TITLE: 11/02 Day Shift: 1430-2330 UTC (0730-1630 PST), all times posted in UTC
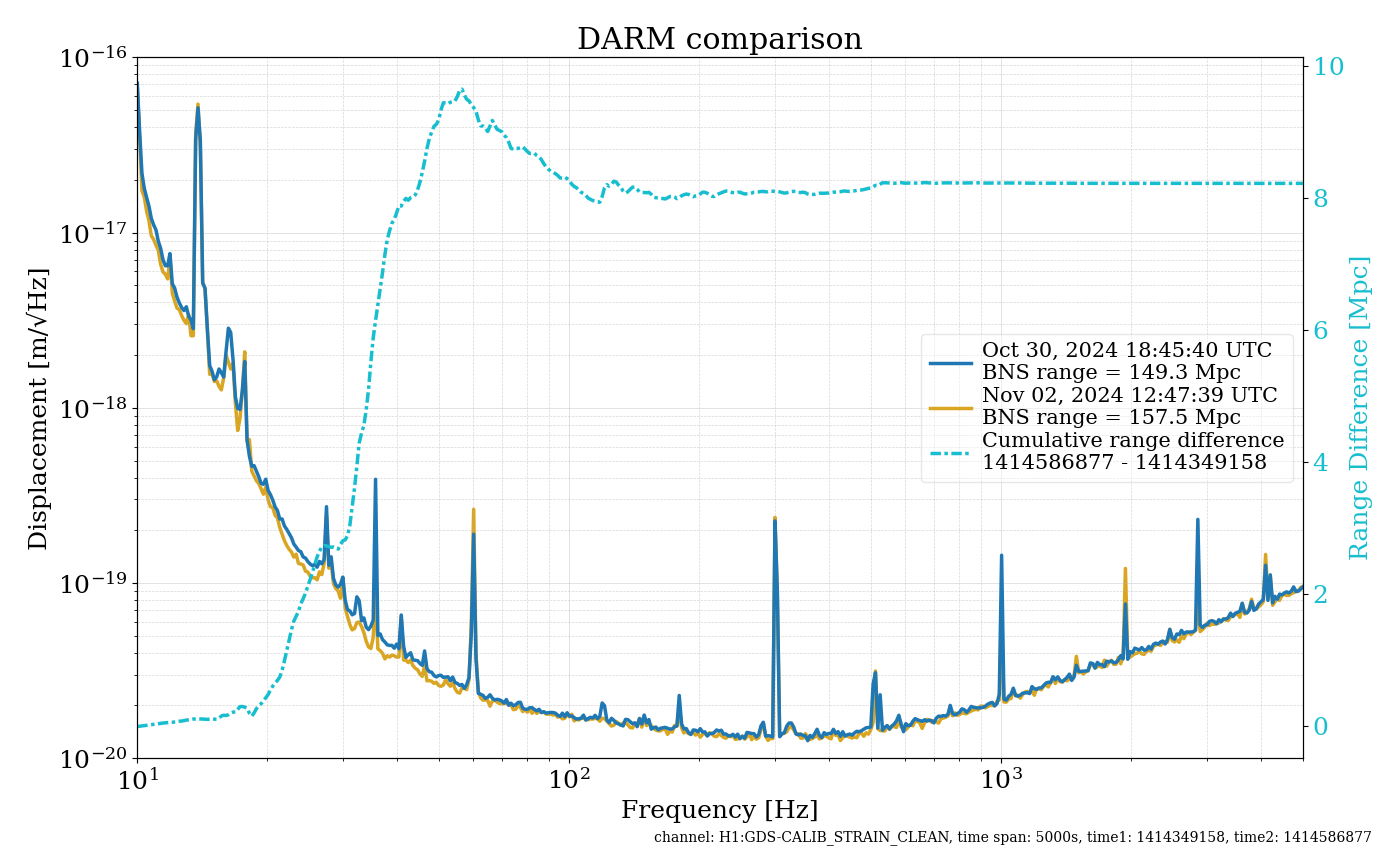
STATE of H1: Observing at 157Mpc
INCOMING OPERATOR: Ryan C
SHIFT SUMMARY: Currently Observing at 157Mpc and have been Locked for over an hour. We relocked many times today and relocking tended to take a bit long due to many locklosses, but for the most part was hands-off. The only things that required help were 1) during both initial alignments I ran today, when we got to aligning PRC, the IMC unlocked and could not relock - every time it would relock the FSS would glitch and unlock. To solve this, I waited until the PSL_FSS guardian was in READY_FOR_MC_LOCK, and then I paused it. Then, I waited for the IMC to lock and it would lock fine that next try, and once it had been locked for a few seconds, I unpaused the PSL_FSS guardian (tagging OpsInfo) and 2) one of the times when we were in GREEN_ARMS, ALS_XARM was stuck in CHECK_CRYSTAL_FREQUENCY, but taking it to UNLOCKED and then ETM_TMS_WFS_OFFLOADED fixed it right away.
LOG:
14:30 Observing and locked for over 3 hours
14:47 Superevent S241102cy
15:17 Lockloss
15:17 Started an initial alignment
IMC lost lock when trying to align PRC
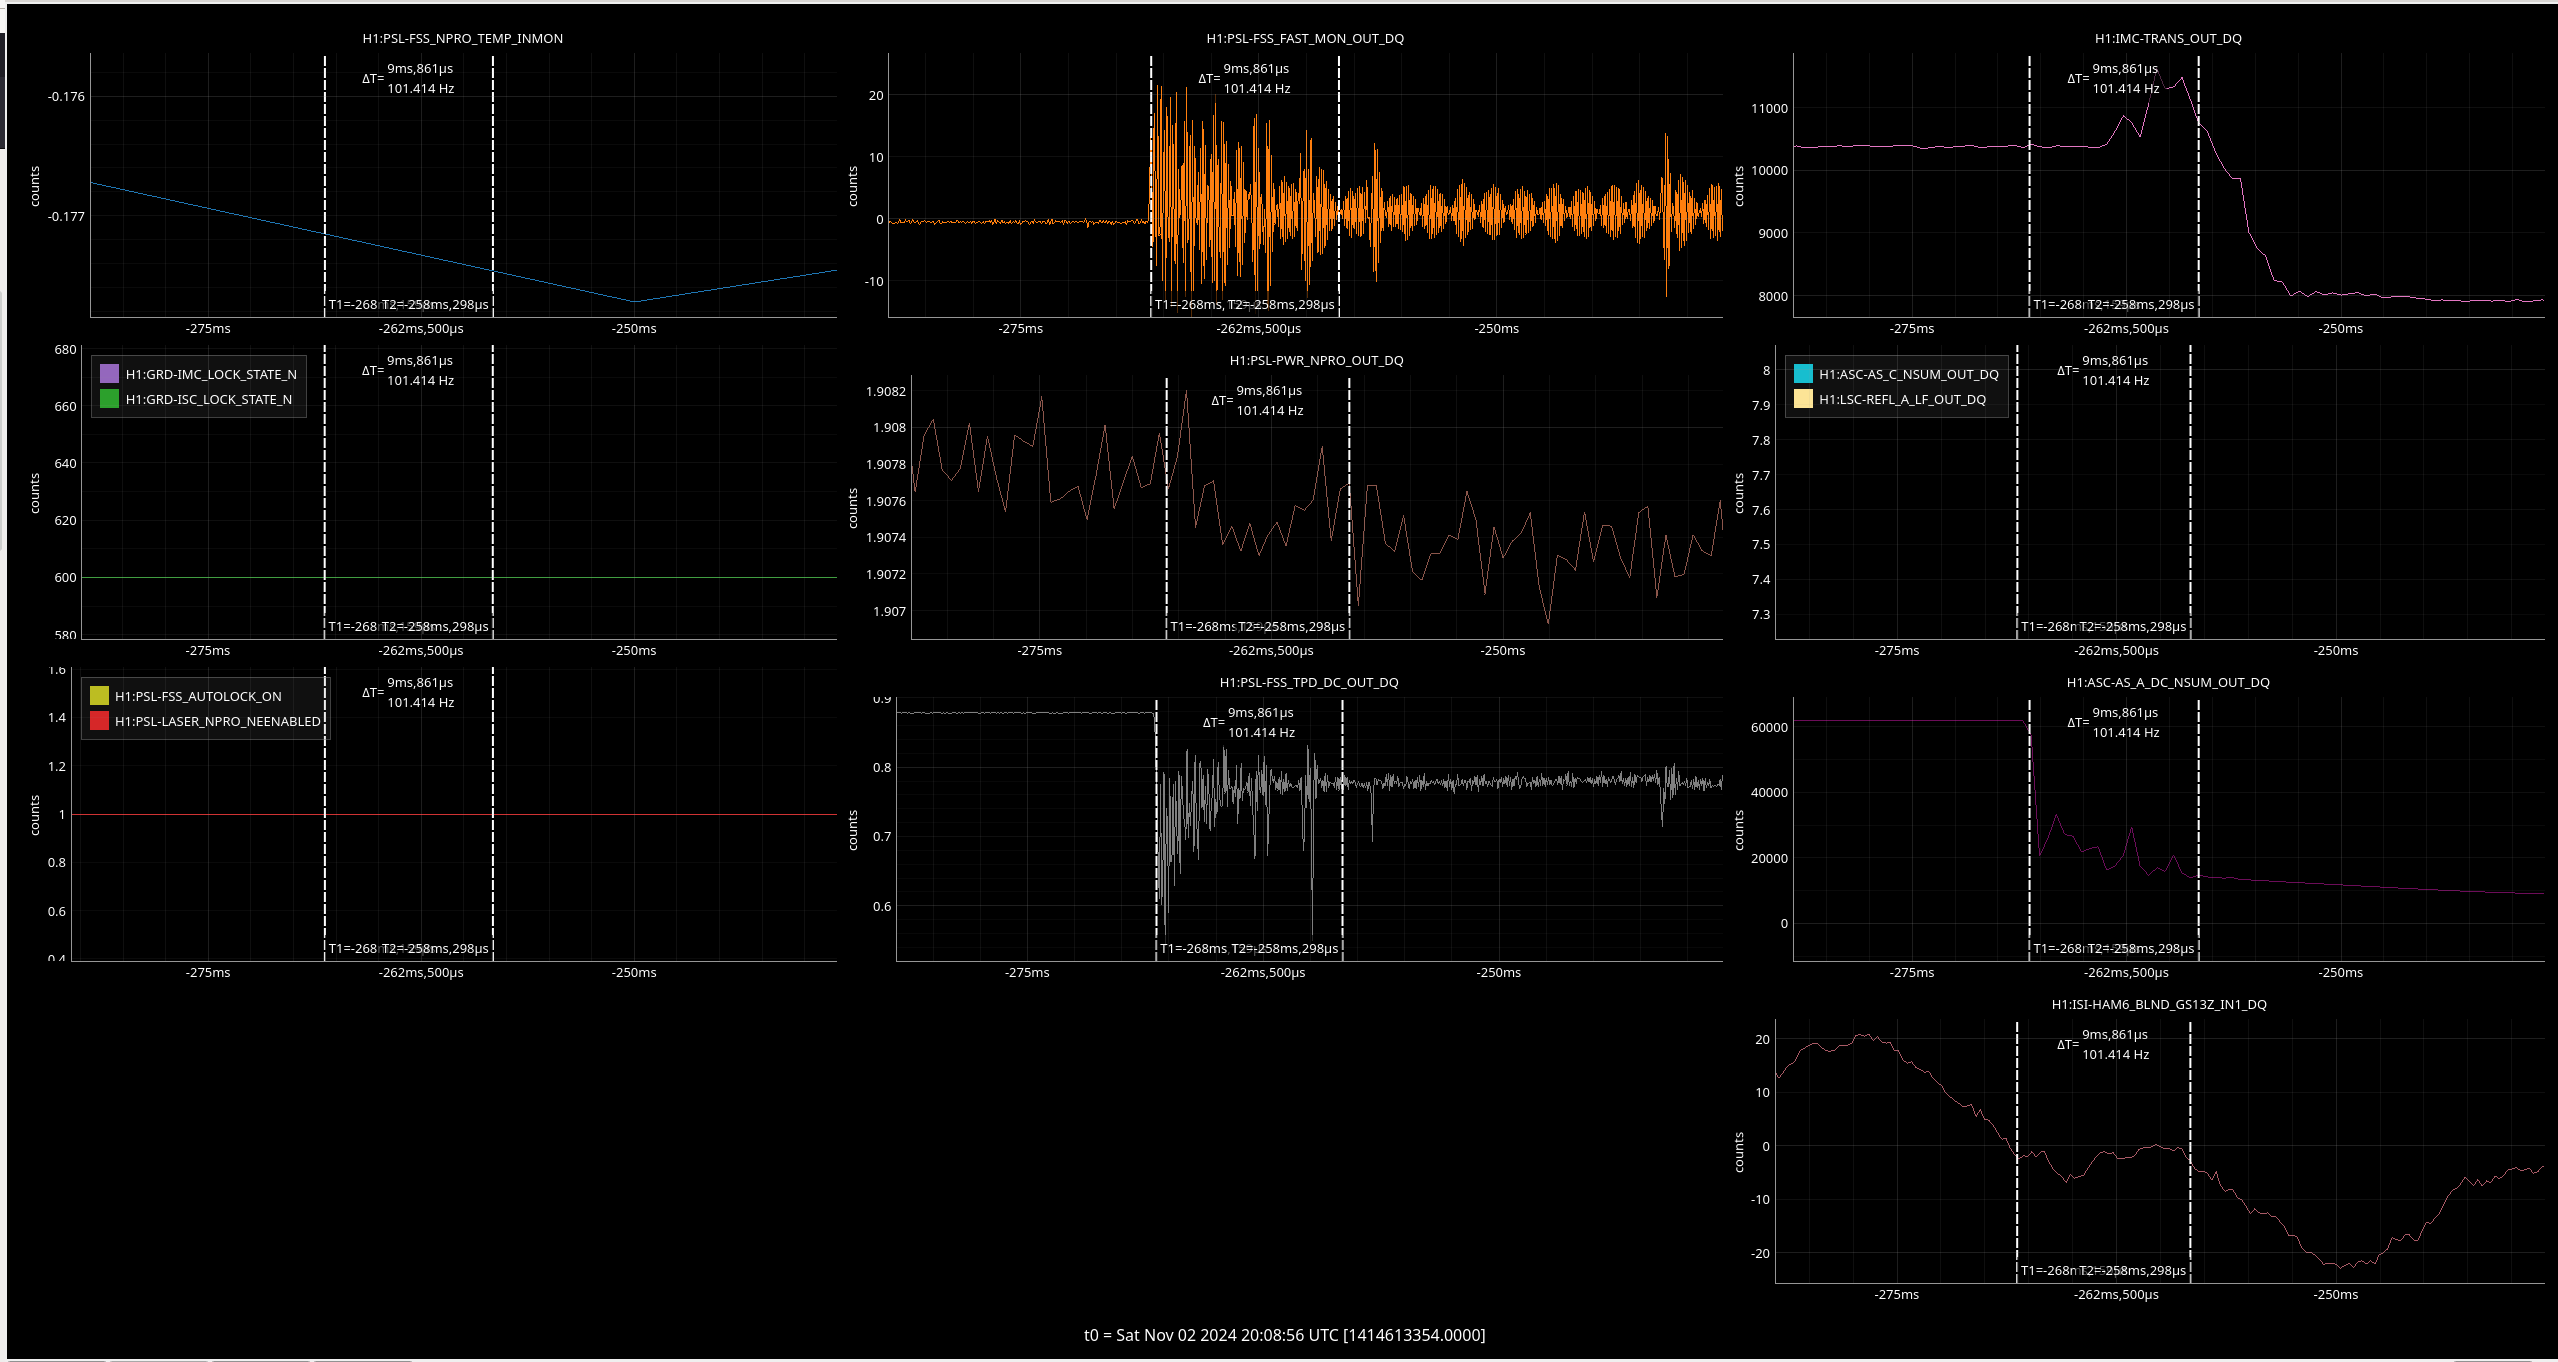
- Every time it would relock, the FSS would oscillate and cause the IMC to lose lock again & FSS would lose lock
- I paused the FSS guardian once the FSS was locked and then unpaused once the IMC was good and locked
15:40 Initial alignment done, relocking
16:12 Lockloss from MOVE_SPOTS
17:04 NOMINAL_LOW_NOISE
17:05 Observing
17:13 Lockloss
18:05 NOMINAL_LOW_NOISE
18:08 Observing
18:38 Lockloss
18:38 Started an initial alignment
- Same issue as before - during PRC the mode cleaner unlocks and cannot relock due to the FSS glitching and unlocking.
Steps that have worked for me: (tagging Ops)
1) Wait until the PSL_FSS guardian is in READY_FOR_MC_LOCK
2) Once it is, pause PSL_FSS
3) Wait for IMC to lock
4) Once it has, unpause PSL_FSS
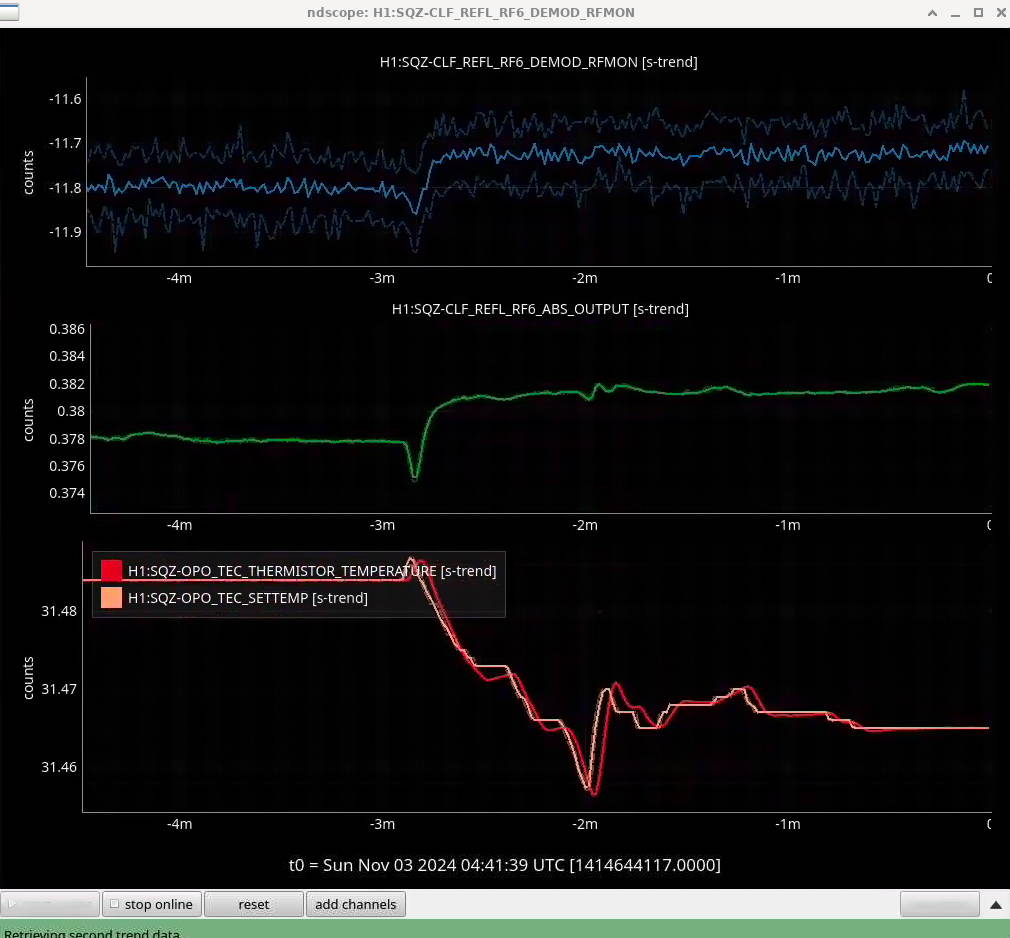
- For some reason, even once the FSS and IMC were locked and we were aligning PRC, the ISS diffracted power was jumping all over the place
18:58 Initial alignment done, relocking
- ALS_XARM CHECK_CRYSTAL_FREQUENCY issue - toggling Force/No Force did not work, so I changed ALS_XARM to AUTO and then took it to UNLOCKED. I selected ETM_TMS_WFS_OFFLOADED and it locked immediately before I could troubleshoot further
19:48 NOMINAL_LOW_NOISE
19:52 Observing
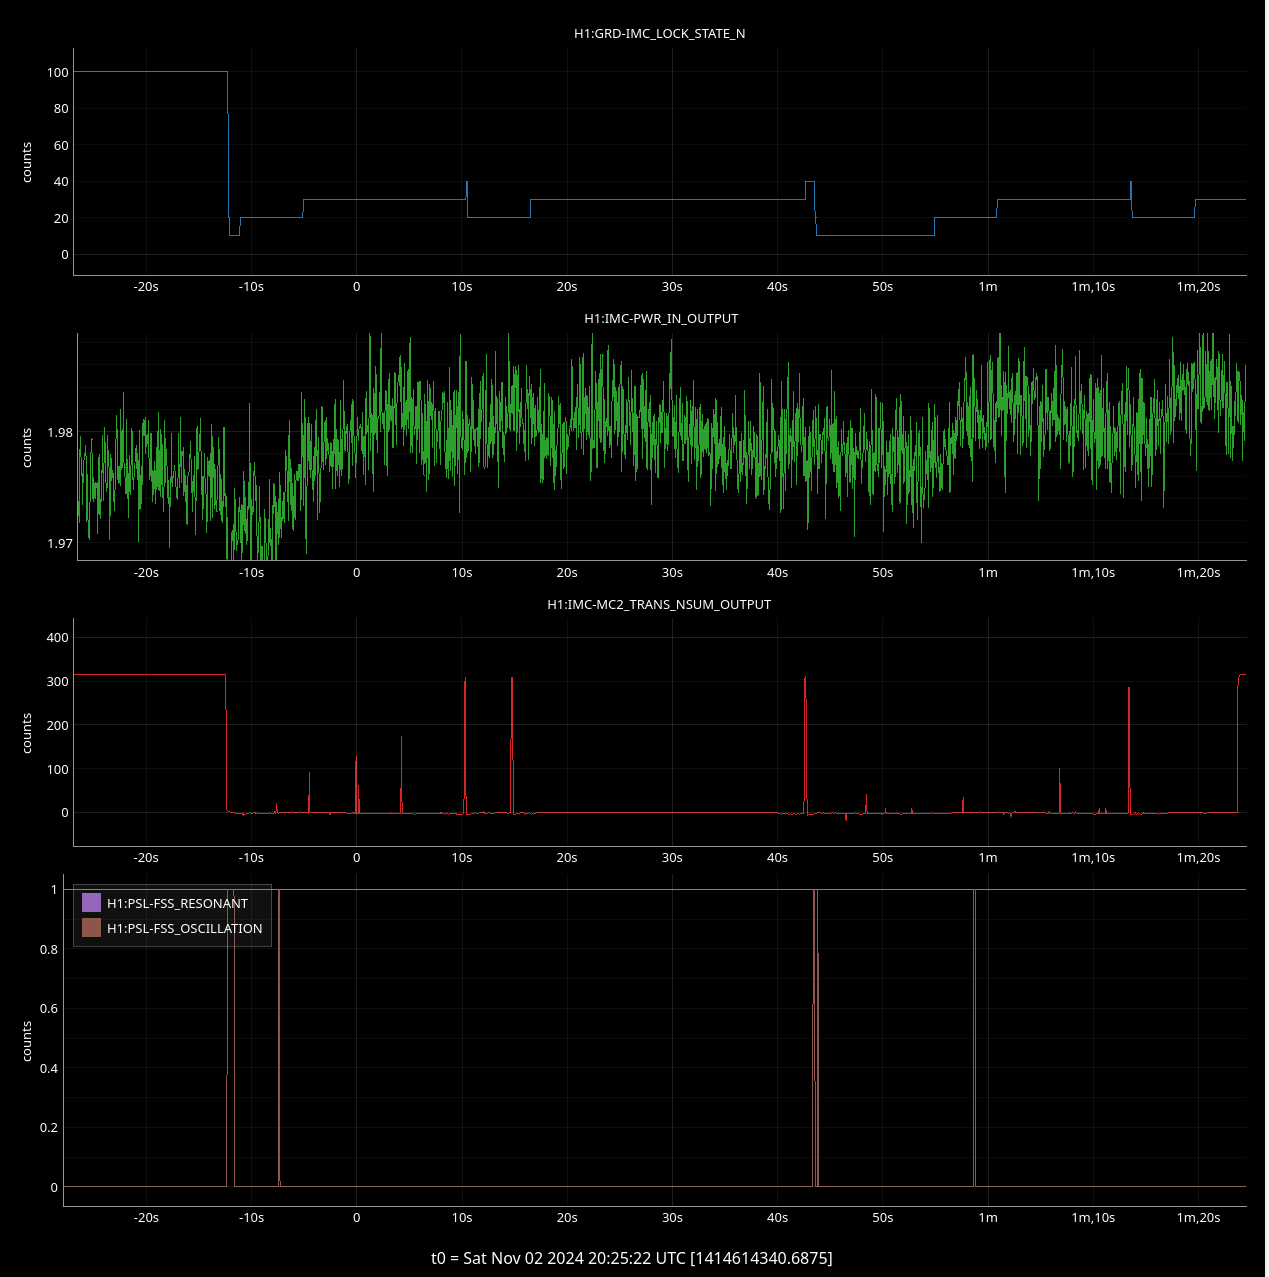
20:08 Lockloss
22:15 NOMINAL_LOW_NOISE
22:15 Observing
| Start Time |
System |
Name |
Location |
Lazer_Haz |
Task |
Time End |
| 17:19 |
PEM |
Robert |
LVEA |
Y |
Looking for grounding spot |
17:39 |
| 17:48 |
PEM |
Robert |
CER |
n |
Setting up stuff |
18:02 |