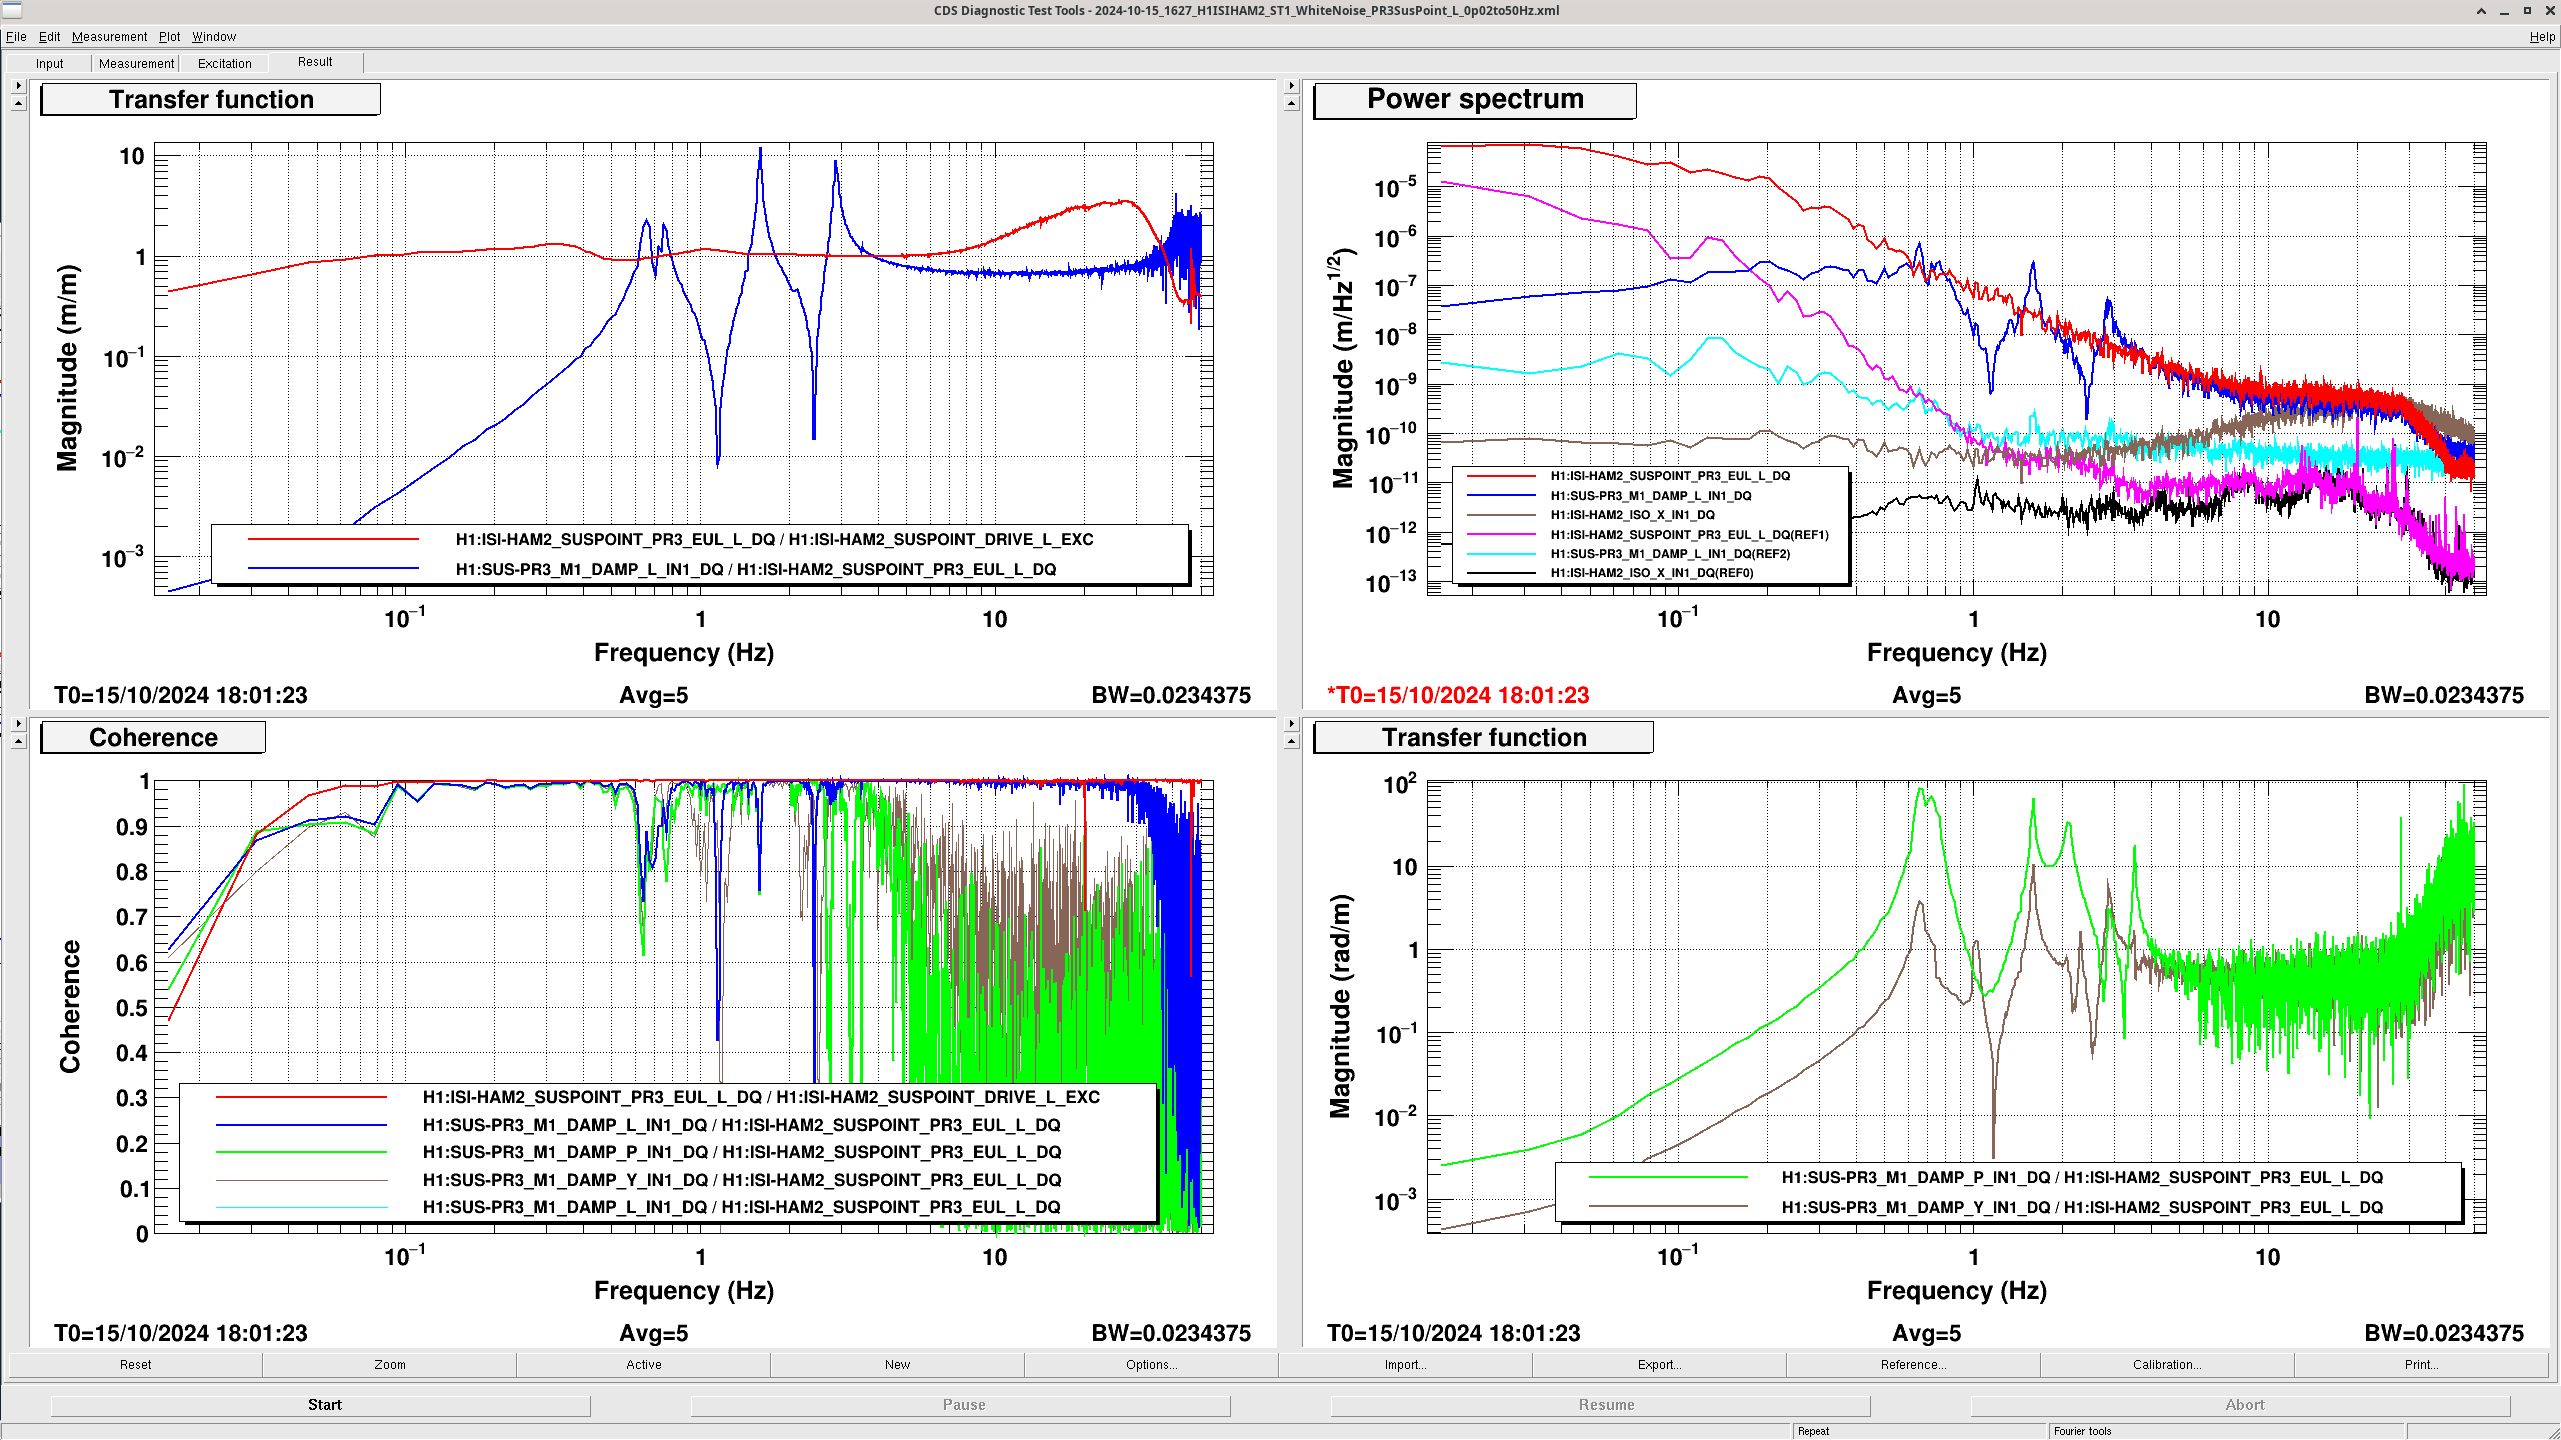
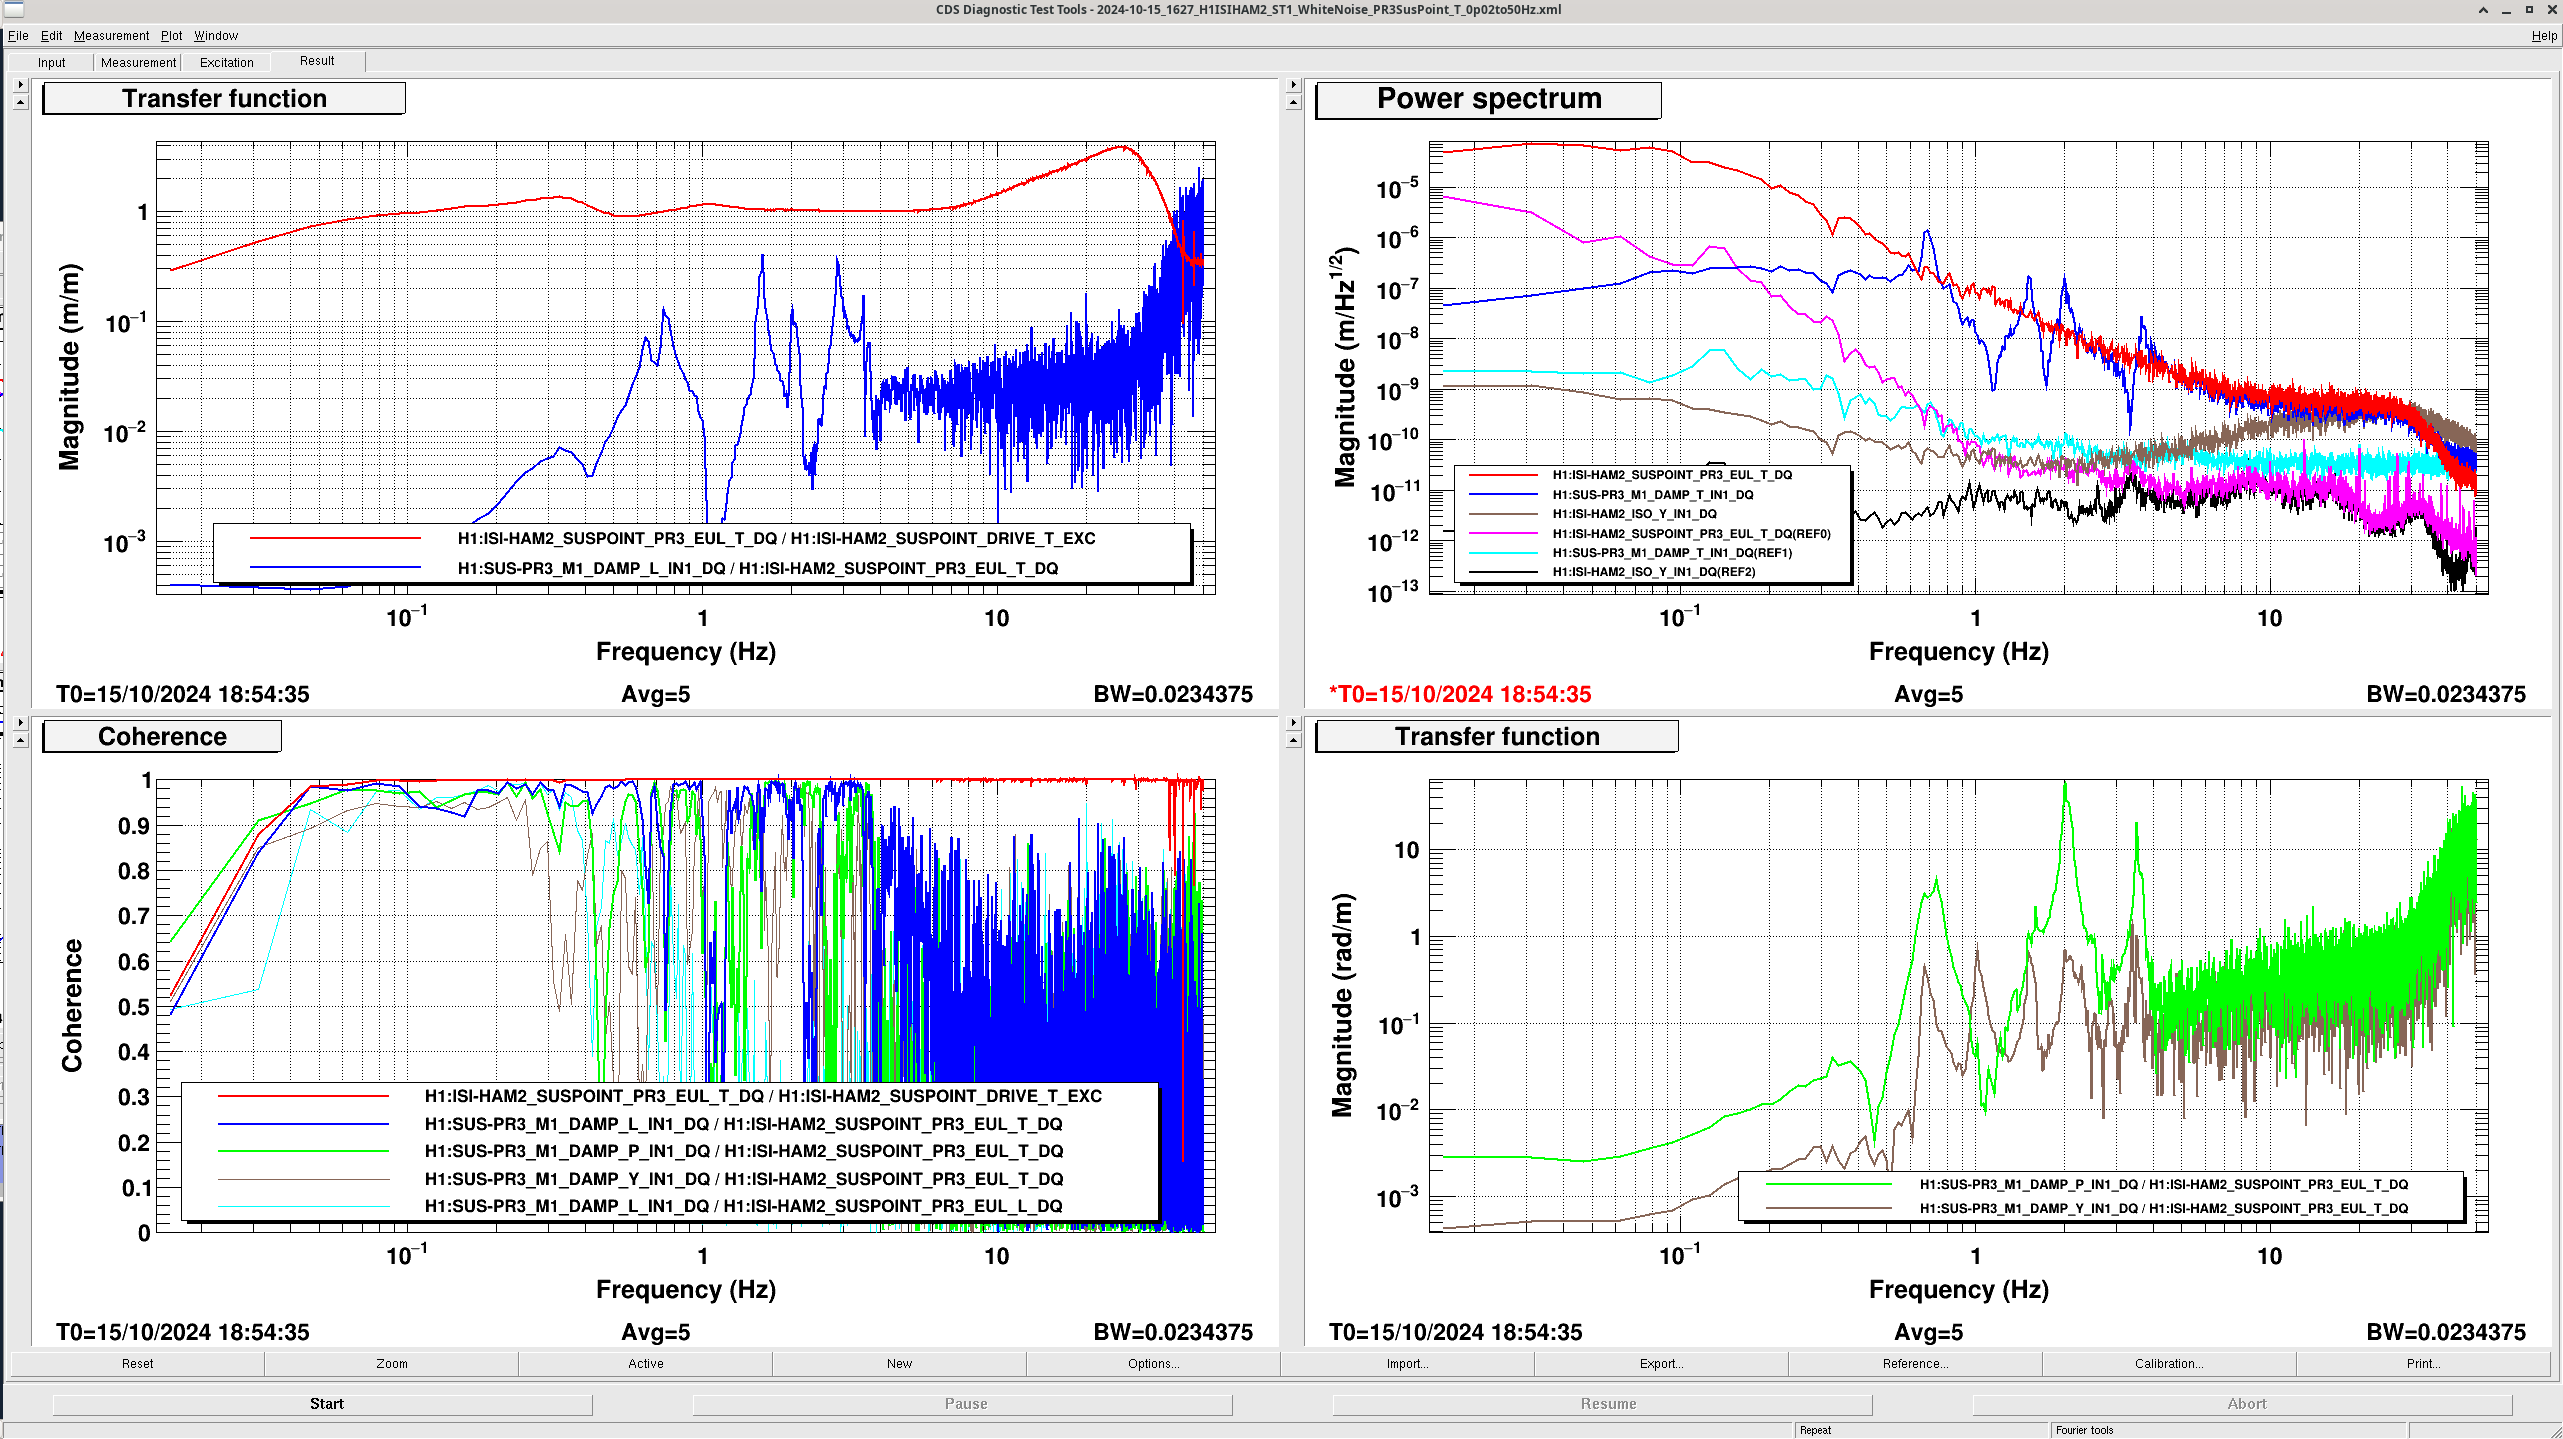
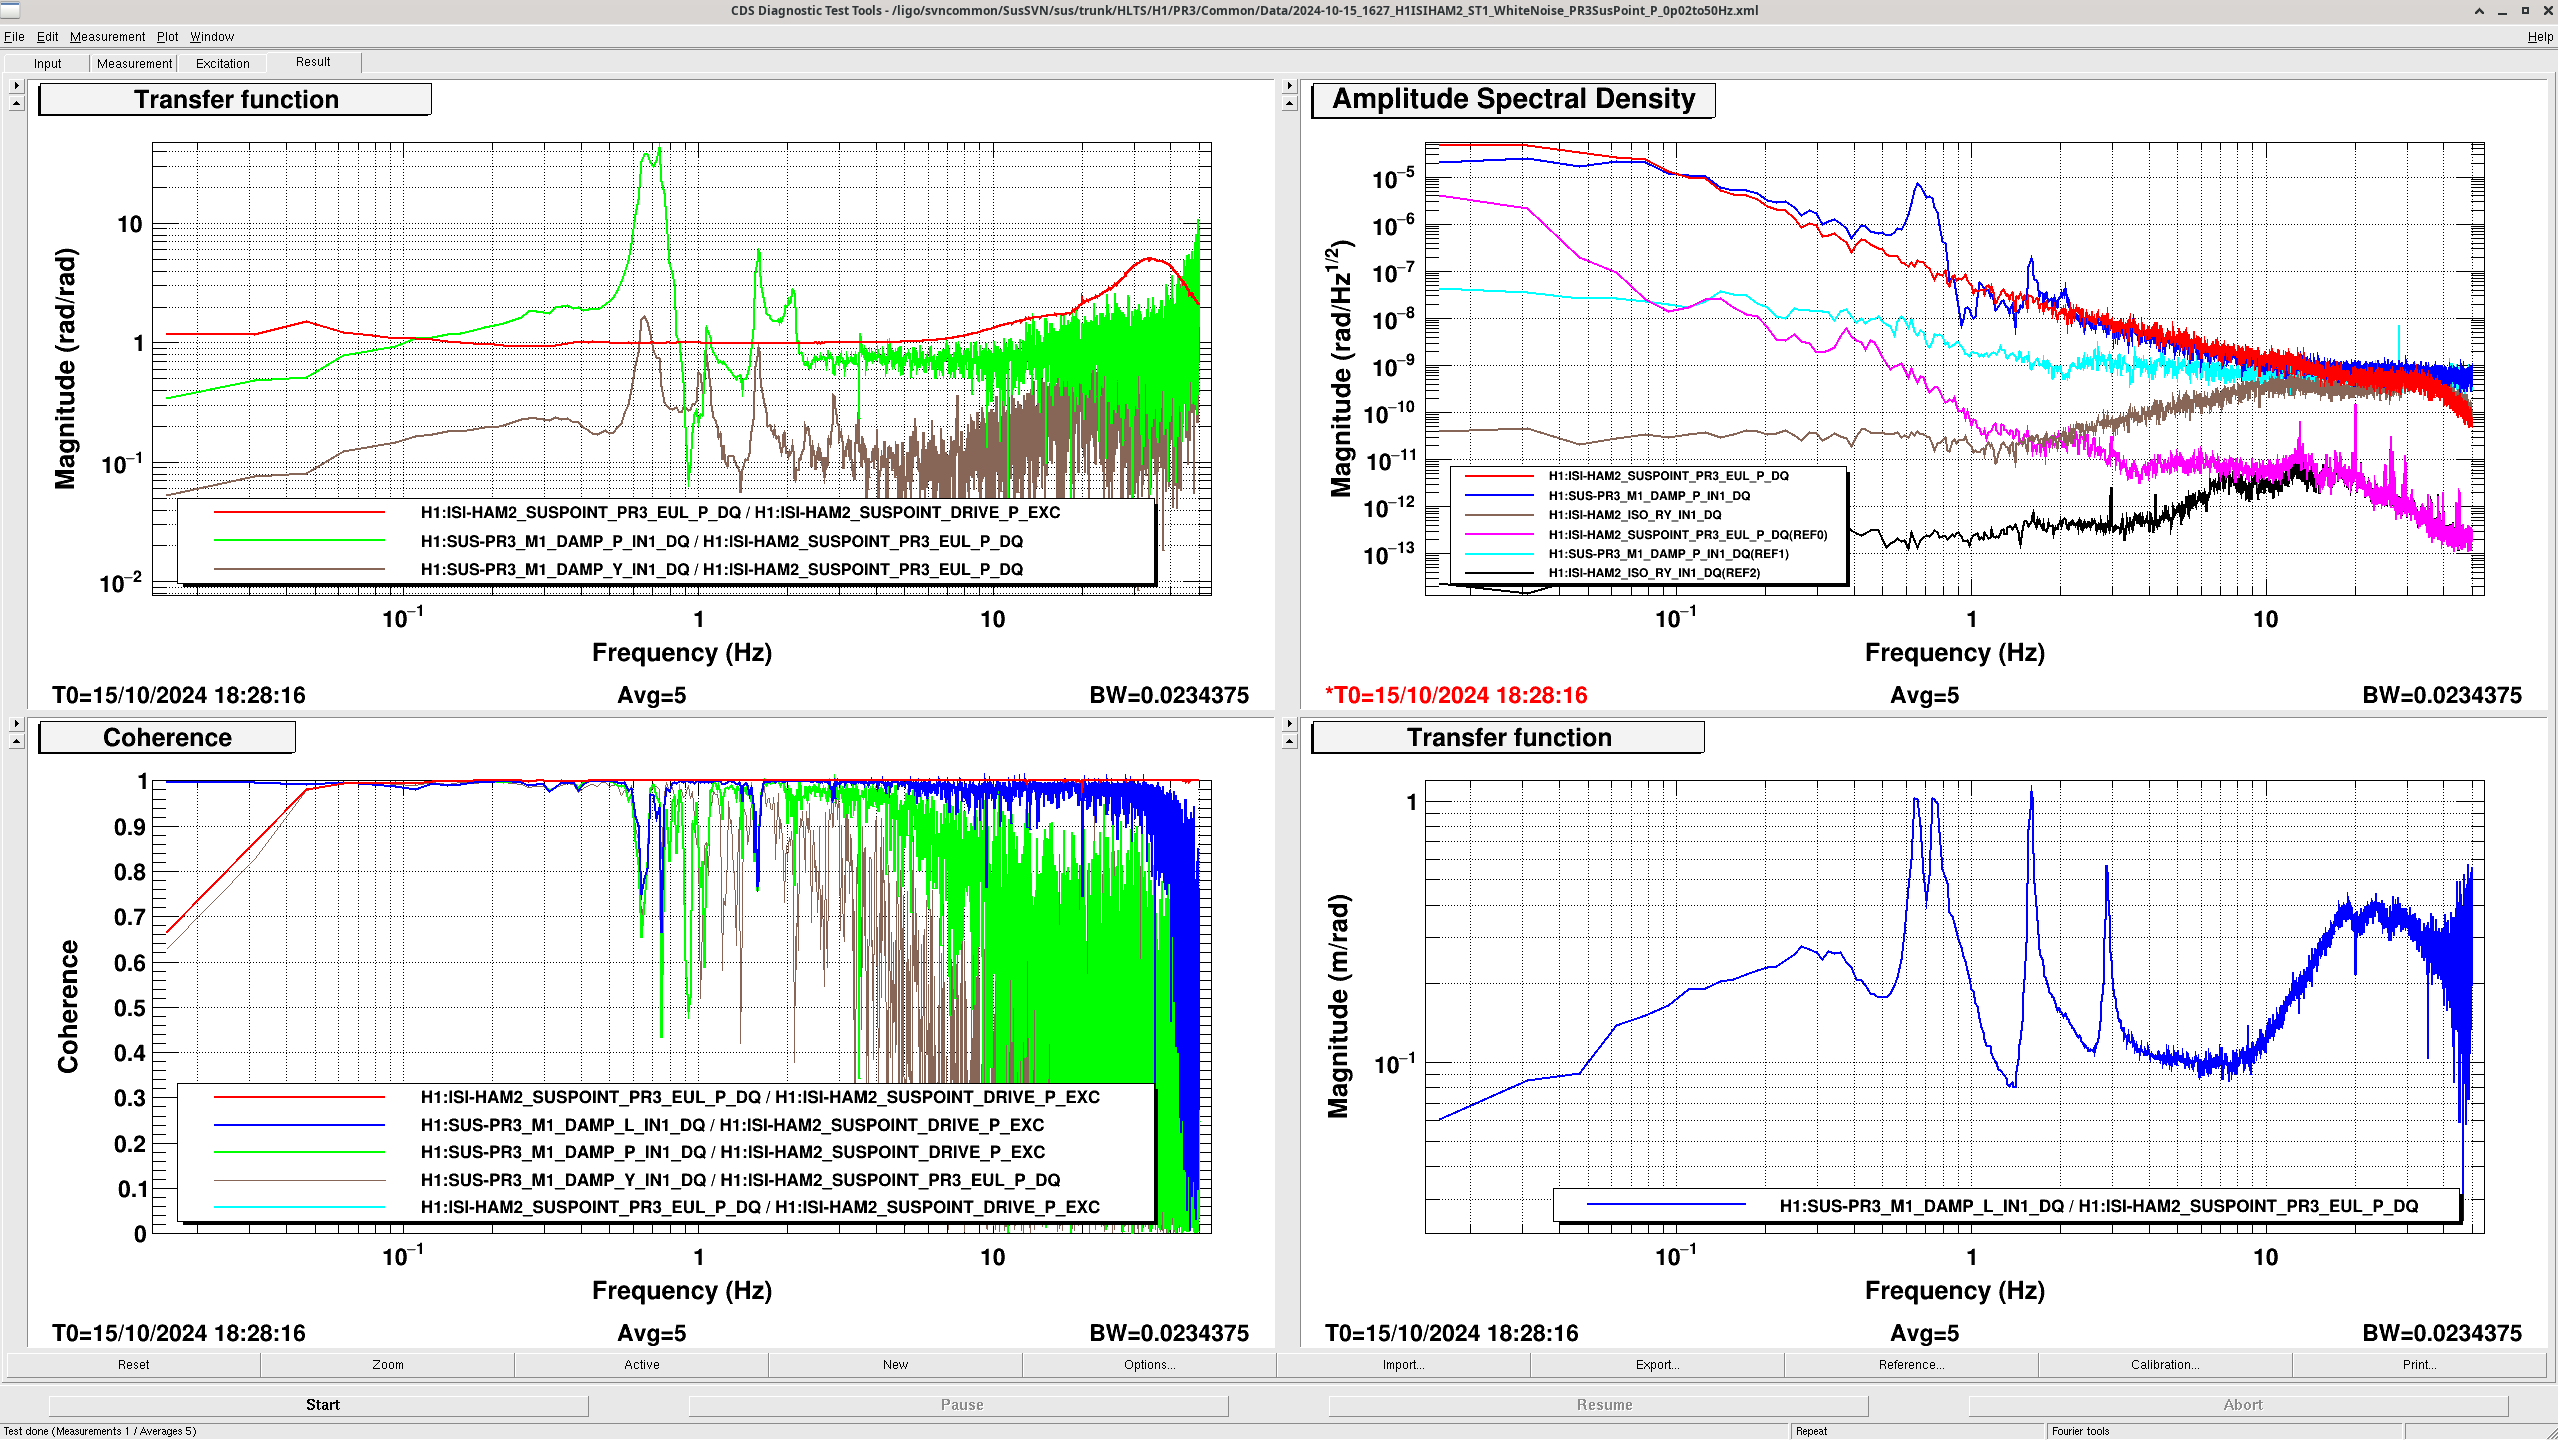
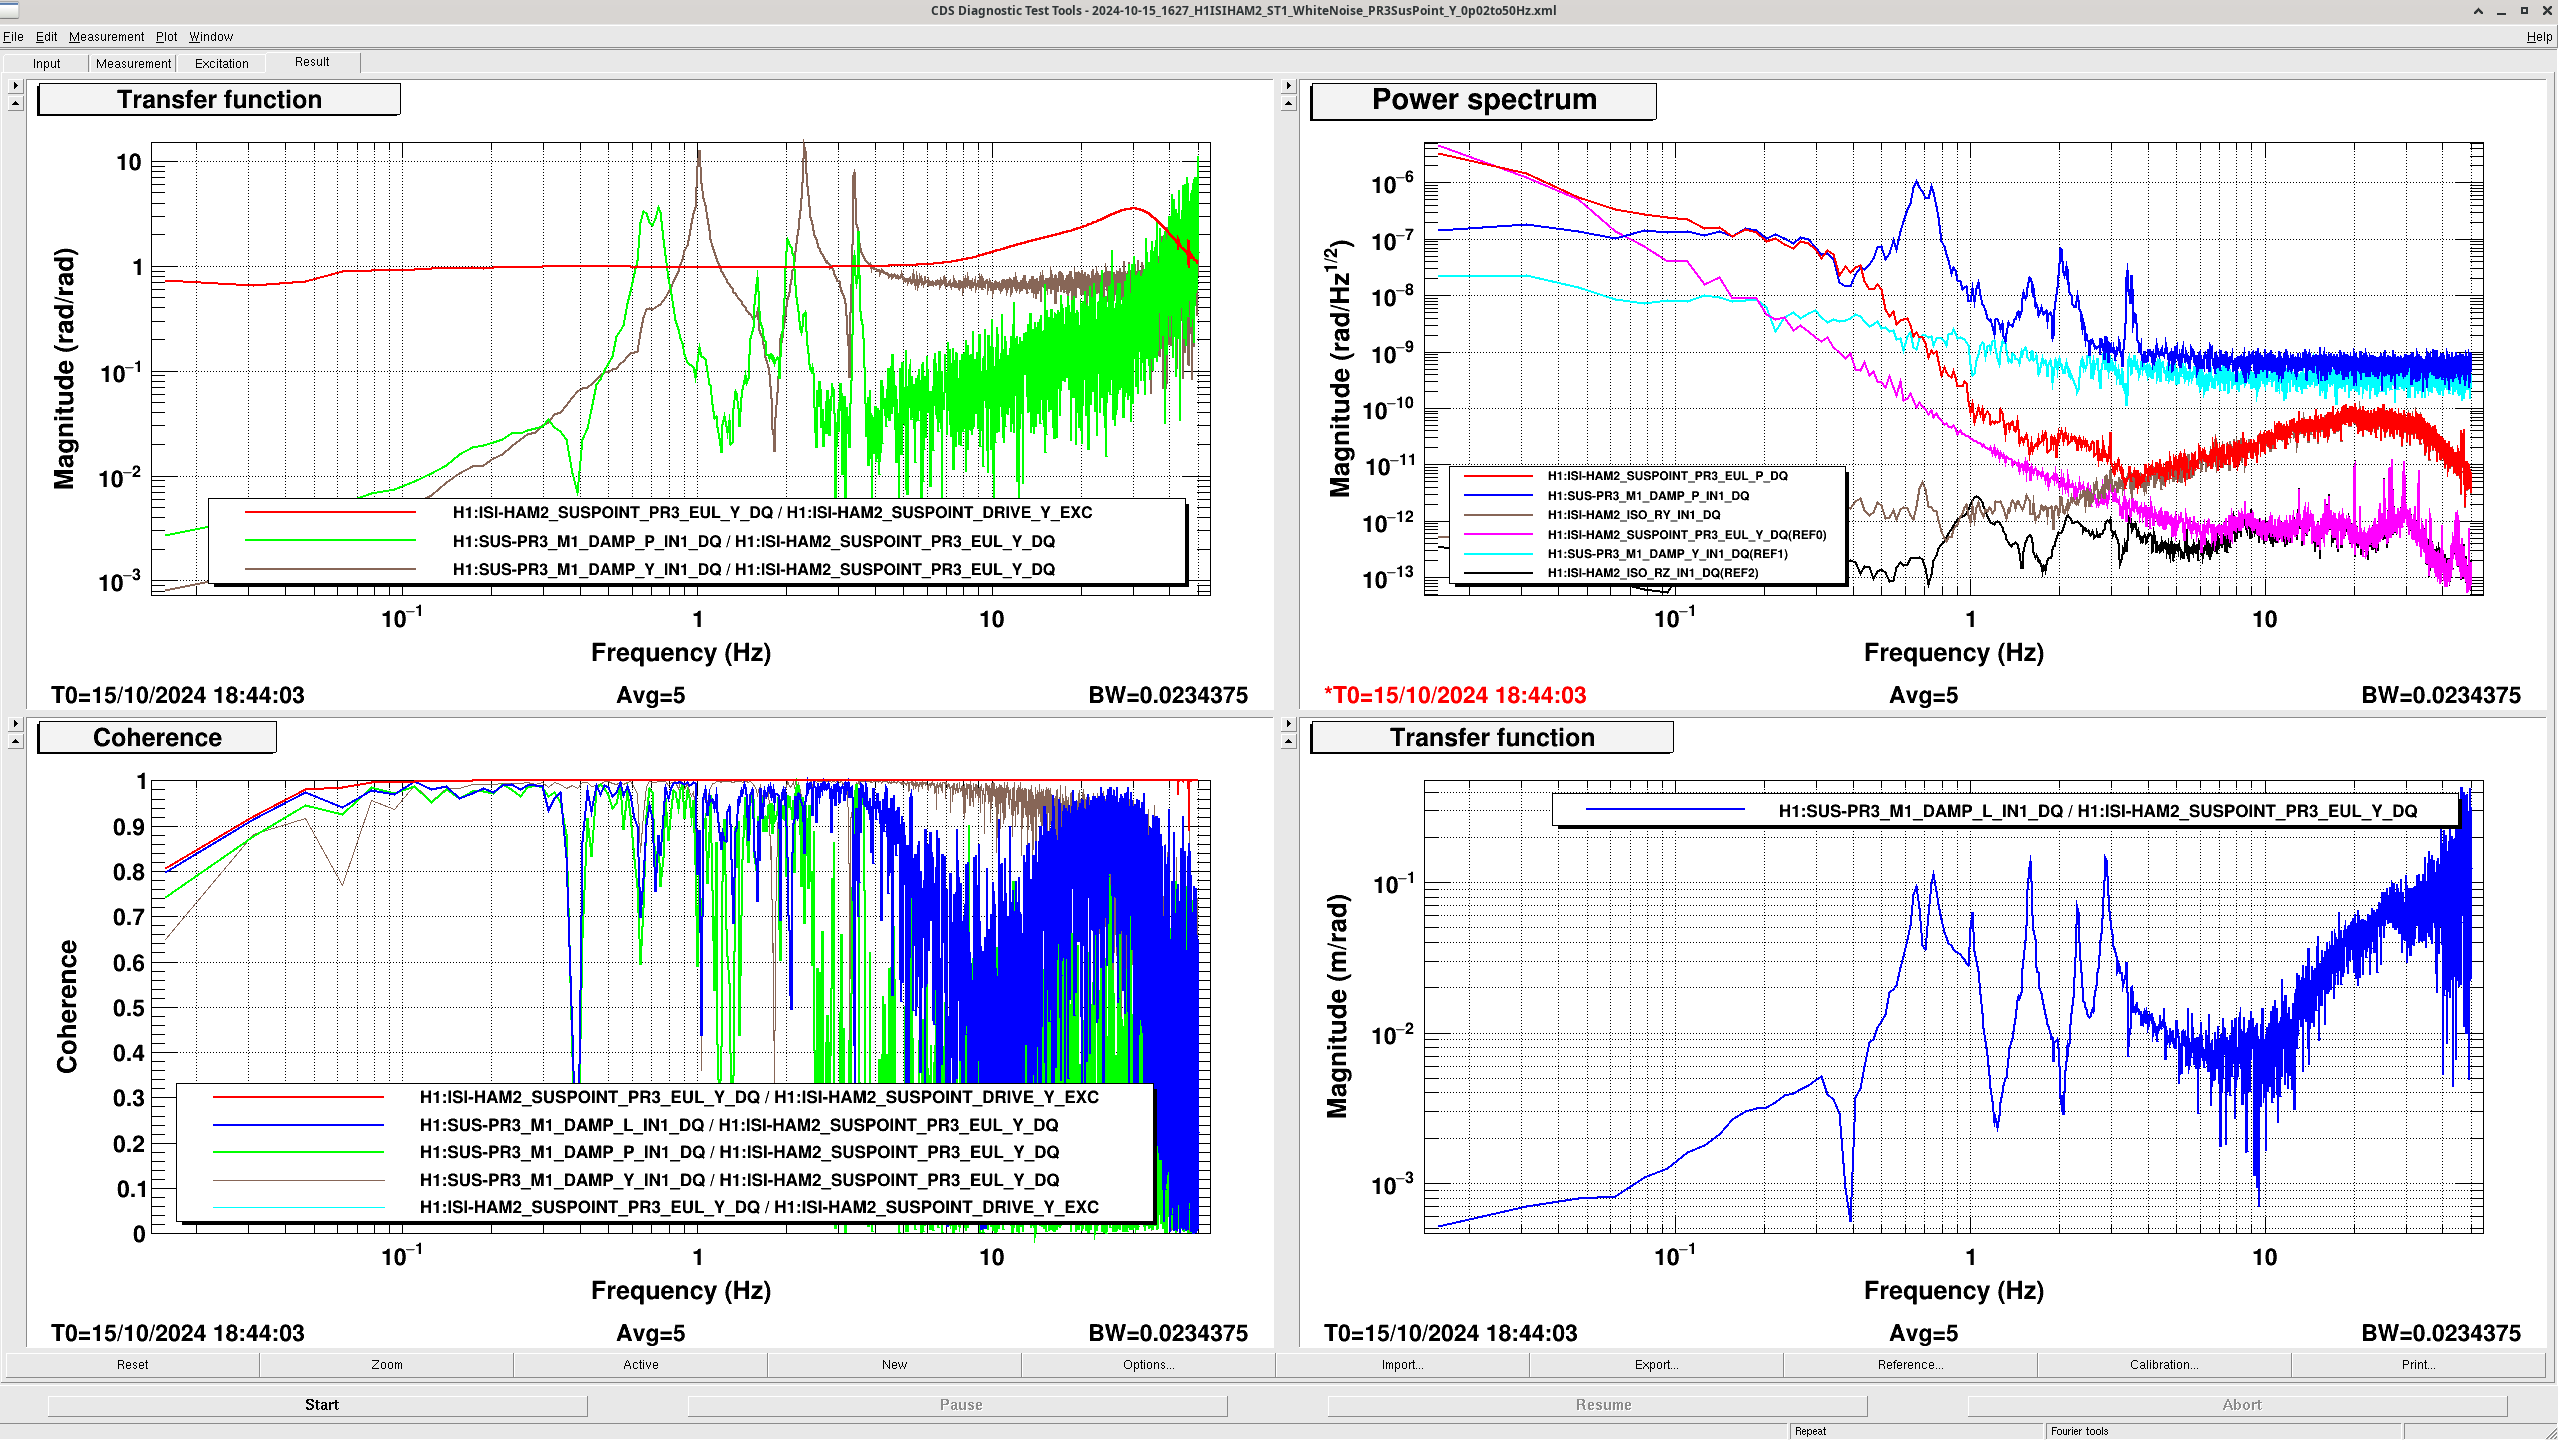
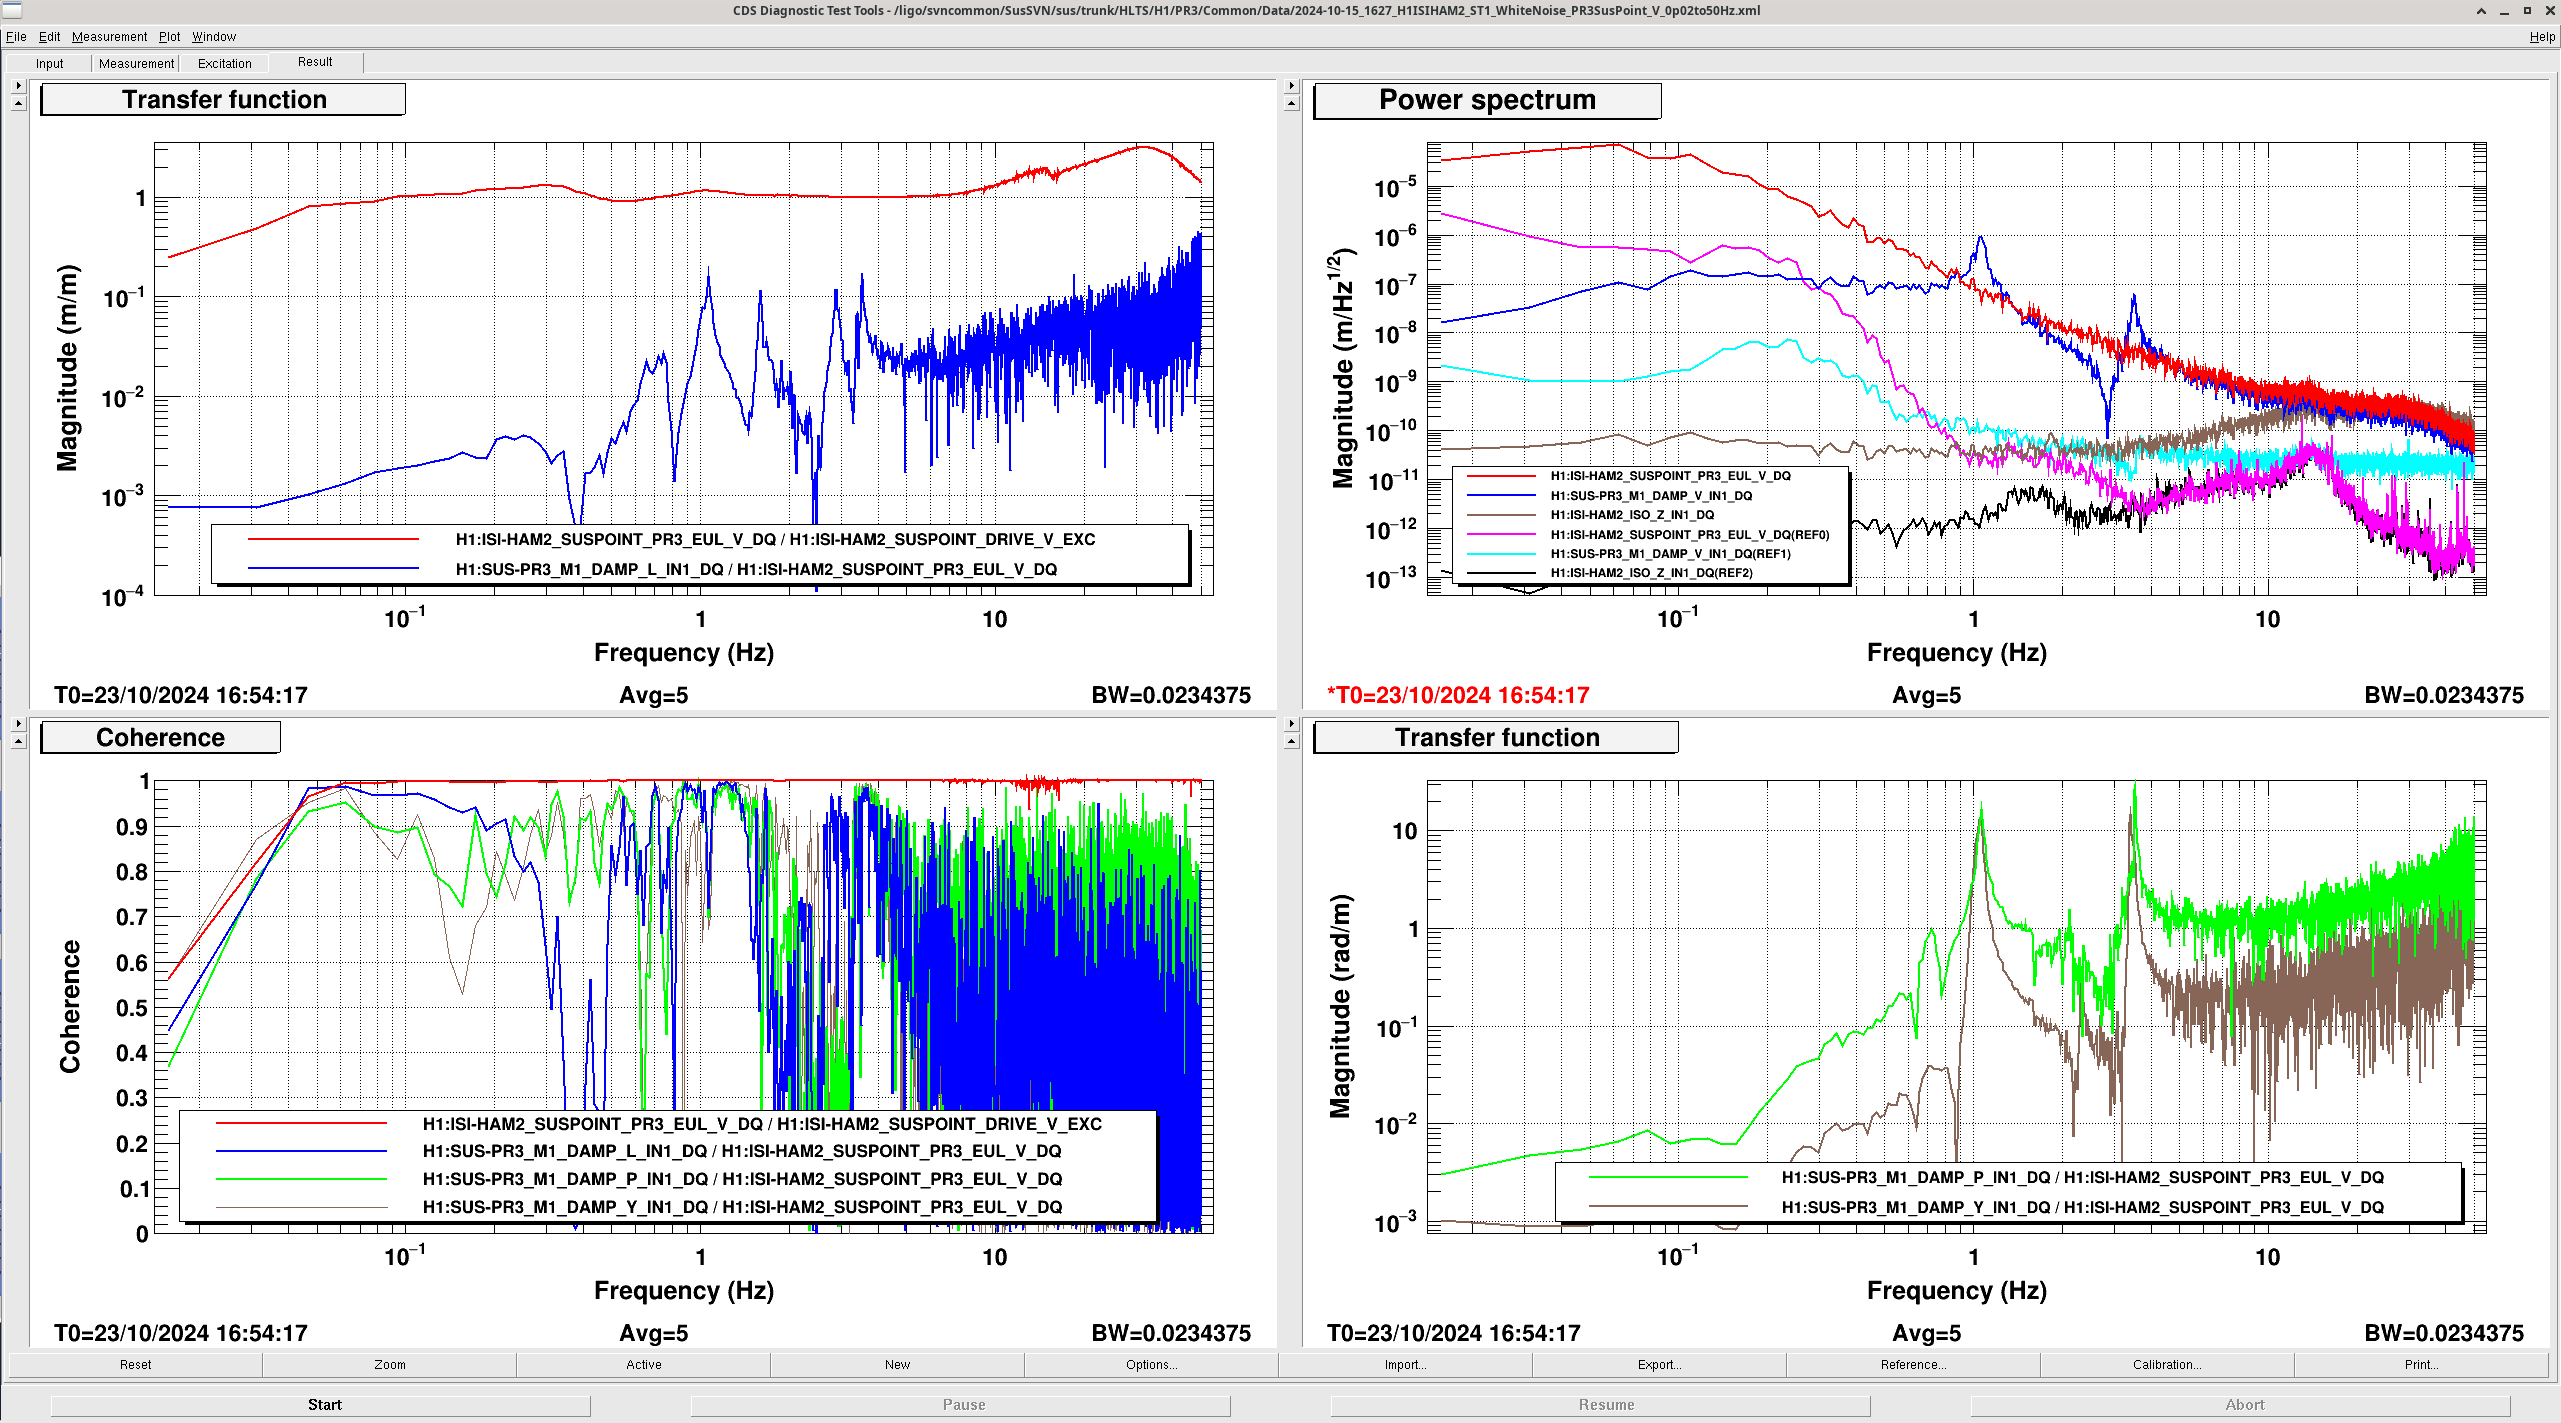
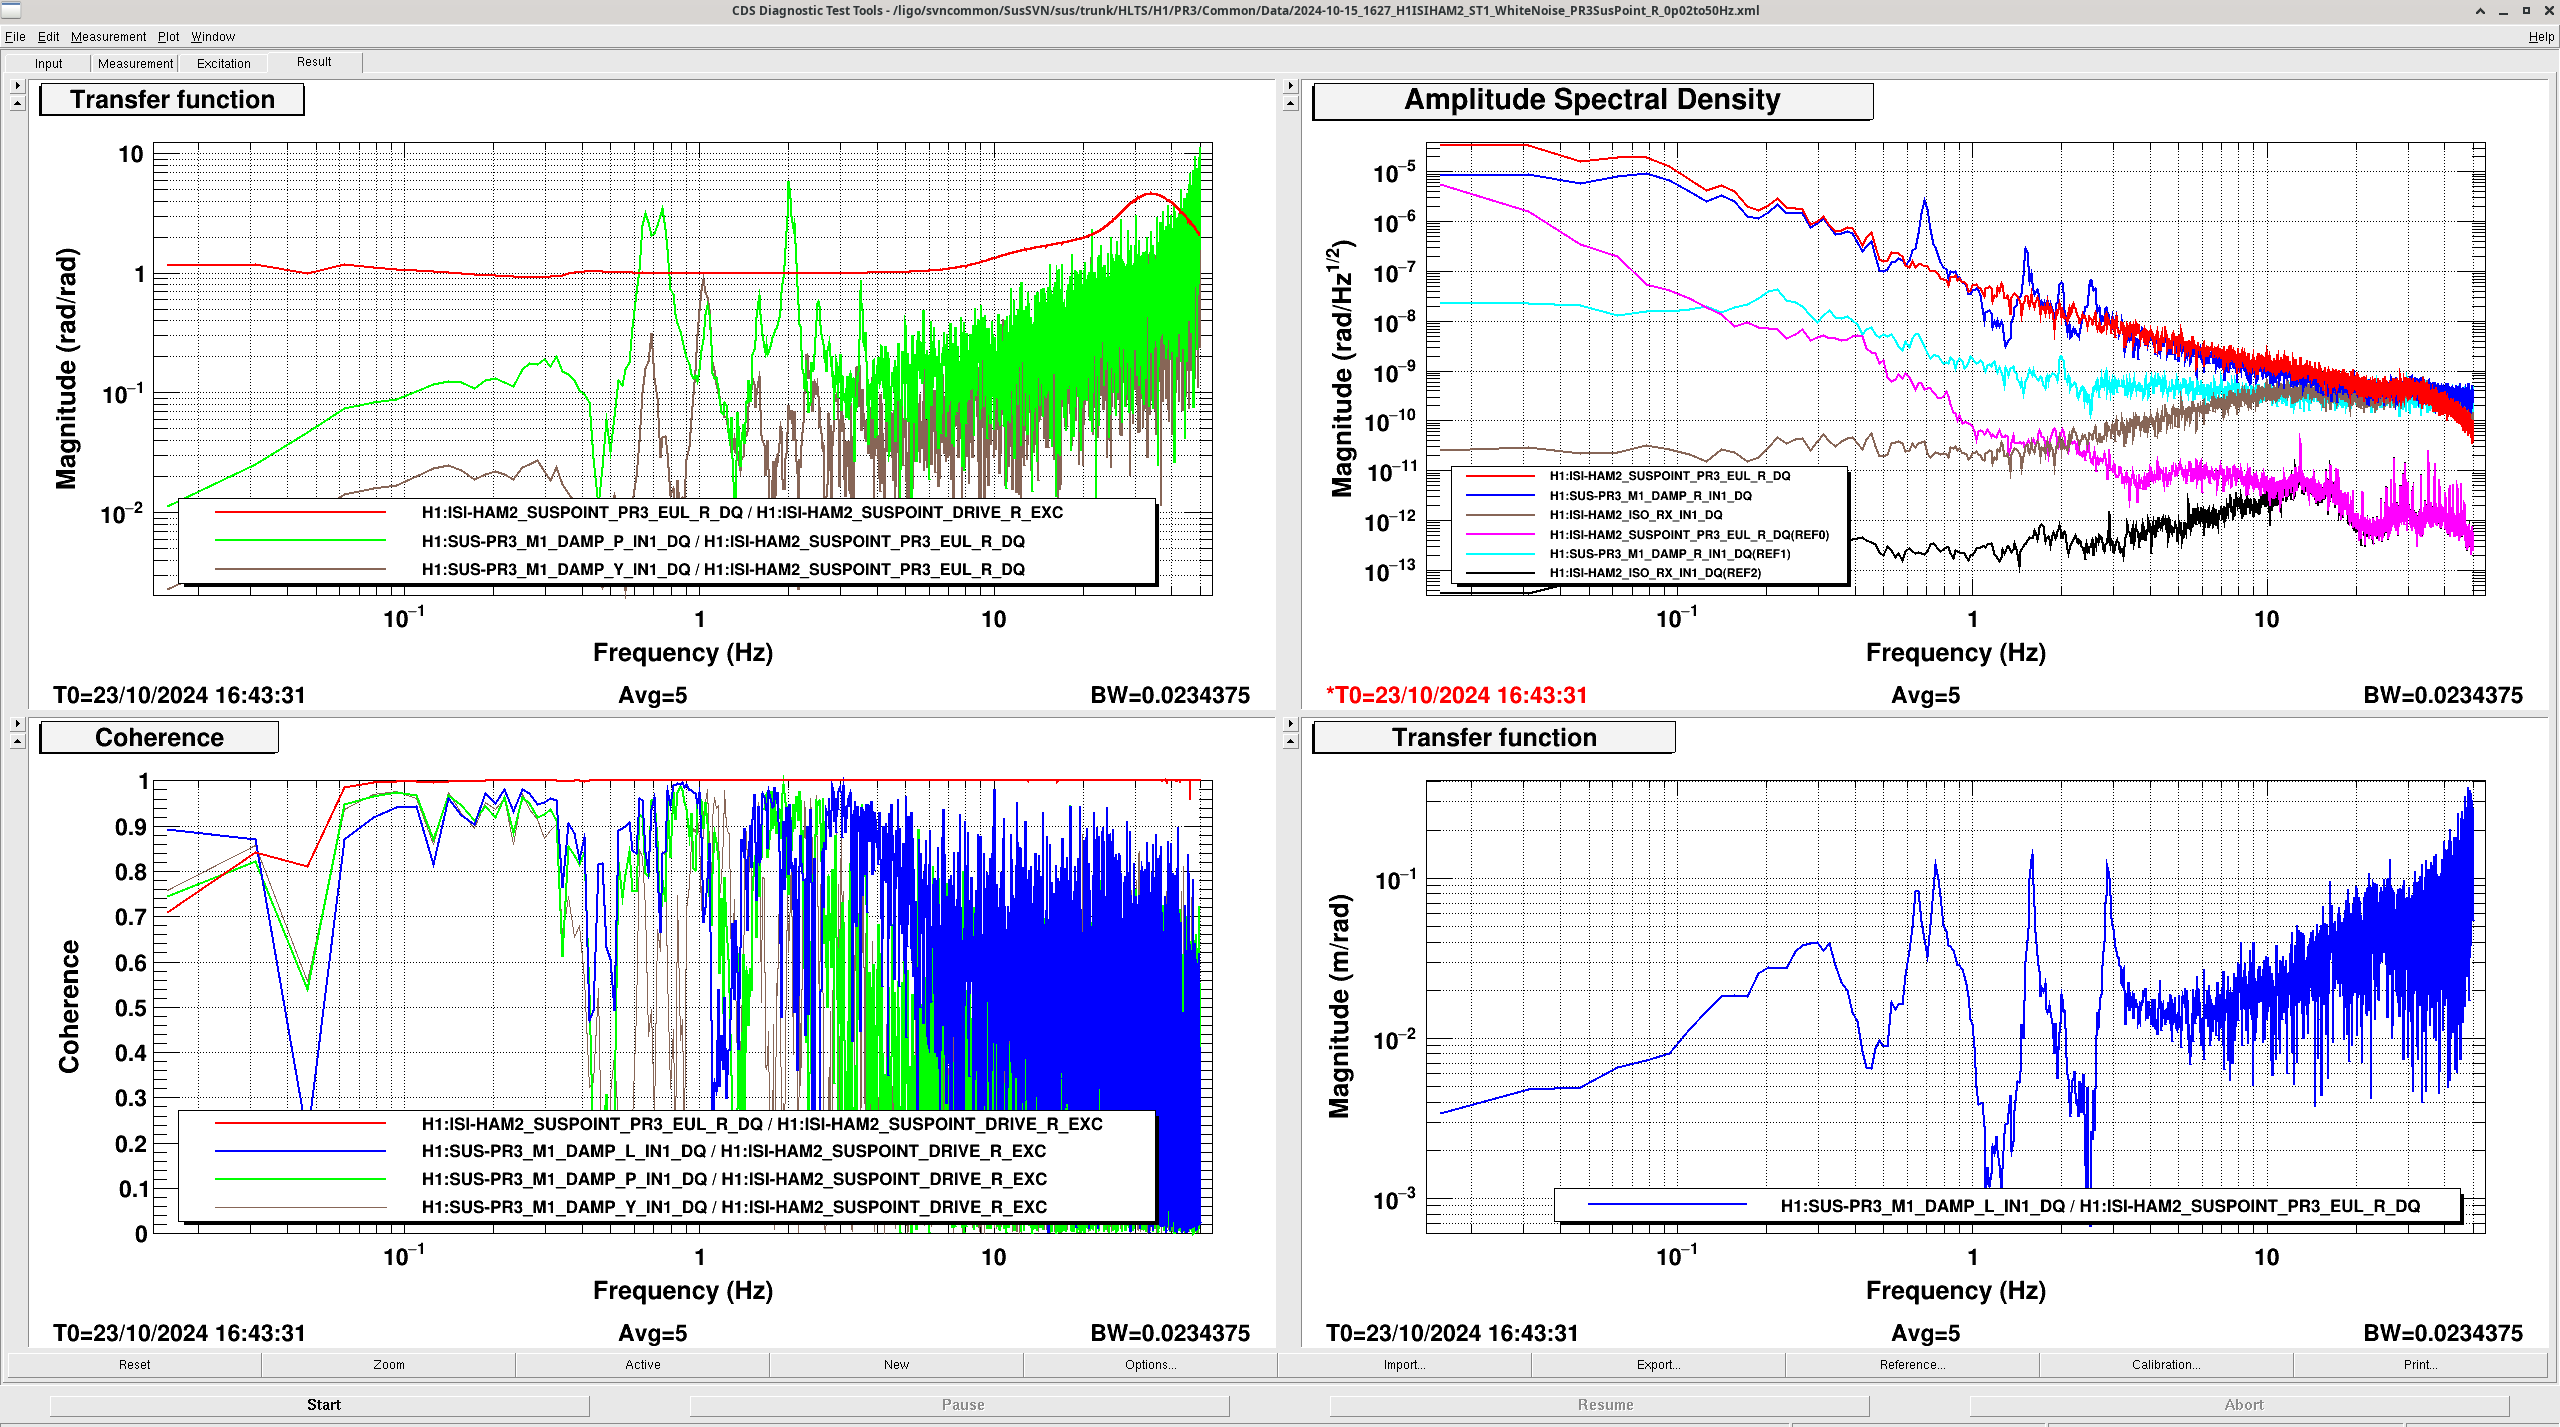
Fri Apr 12 10:12:09 2024 INFO: Fill completed in 12min 5secs
Gerardo confirmed a good fill curbside.
TITLE: 04/12 Day Shift: 15:00-23:00 UTC (08:00-16:00 PST), all times posted in UTC
STATE of H1: Observing at 158Mpc
OUTGOING OPERATOR: Ryan C
CURRENT ENVIRONMENT:
SEI_ENV state: CALM
Wind: 5mph Gusts, 1mph 5min avg
Primary useism: 0.01 μm/s
Secondary useism: 0.13 μm/s
QUICK SUMMARY: Locked for 10 hours. We've had a handful of EX saturations throughout the night, but our range is looking good. Commissioning planned for today at 1pm PT.
Below is the summary of the DQ shift for the week from 2024-04-01 to 2024-04-07
The full DQ shift report with day-by-day details is available at https://wiki.ligo.org/DetChar/DataQuality/DQShiftLHO20240401
Since PMC is so sensitive to acoustic noise I was curious if PMC added additional contributions to the sqz phase noise. So, I did the same SQZ phase noise budget analysis that was done in O3. The explanation and the methodology can be found in P2200287 chapter 6.3.1 onward.
PMC noise contribution to sqz phase noise is 0.59 mrad. There's no need to put extra efforts into damping the cavity unless people are annoyed that it loses lock everytime we use some of the motorized half wave plate.
The FWHM and FSR of the PMC was measured by Vicky at MIT. They are 175MHz and 713 MHz respectively. We didn't repeat this measurement after the installation because the LVEA was too loud and the finesse is high for s-pol (4070).
The Vpp calibration for the PMC is 2.22 Vpp/FWHM. This was measured after the PMC was installed. In order to fit the transfer function I had to multiply a factor of 1.5. Vicky mentioned the PMC PZT is very nonlinear so my V/Hz calibration could be off. If that's true then the PMC trace needs to be multiplied by a factor of 1.5.
I had to multiply a factor of 0.33 to the CLF and LO loop in order to fit the transfer function. Even after using the new VCO V to Hz calibration that Daniel measrued. I suspect the Vpp/rad calibration was over estimated due to RLF. If that's true then the LO and CLF traces shown in this alog needs to be multiplied by a factor of 0.33.
The PZT driver for the PMC is the same as in the SHG and the OPO
This plot shows overall noise contributions to the sqz angle from all the sqz loops. The data were taken in between 11-18 March 2024 (pre O4b). The rms from different loops are added in quadrature to get sqz phase noise. I don't have filter cavity red lengthnoise data handy but a rough calculation from Dhruva's measurement back in February last year the lengthnoise should be sitting at 0.3 mrad/sqrt(Hz) at a 100Hz. If the rms scales the same way that's 3 mrad added in quadrature with the rest of the noise contributions.
This screenshot shows more details analysis from PMC, SHG, OPO, CLF (6dBm and -23dBm) along with the transfer functions and sensing noise.
A separate screenshot for LO loop, low and high CLF power, with the transfer functions and sensing noise.
The table below lists all the noise contribution from sqz loops to sqz angle. Until we achieve a single digit % loss these numbers are negligible. The major contribution to sqz angle pahse nosie still comes from the IFO control signal sidebands. I didn't remeasure the TTFSS noise so I used the in-loop rms number from last year.
SQZ phase noise | Low CLF (mrad) | high CLF (mrad) |
TTFSS (phi laser) | 0.03 | 0.03 |
PMC | 0.59 | 0.59 |
SHG | 0.089 | 0.089 |
OPO | 0.11 | 0.11 |
CLF | 2.25 | 0.37 |
LO | 2.5 | 0.91 |
FC | 2.6 | 2.6 |
total | 4.294359207 | 2.844999297 |
TITLE: 04/12 Eve Shift: 23:00-07:00 UTC (16:00-00:00 PST), all times posted in UTC
STATE of H1: Observing at 156Mpc
INCOMING OPERATOR: Ryan C
SHIFT SUMMARY: Mostly quiet shift with just one lockloss. Reacquisition was fairly straightforward; I only had to manually find DIFF IR.
H1 has now been locked for 2 hours.
LOG:
No log for this shift.
We see occasional excess nosie around 32.5 Hz in the h(t). This feature has been there for a long time, was present even in O3. They were identified before and were a-logged, for example 52796 (?), 73601. The first plot in this a-log shows the feature in last week's data. A corresponding featuer is seen in almost all the accelerometers and ground seismometers in the corner station (the second and third plots show the HAM6 and PSL accelerometers data while the fourth plot shows the HAM2 STS). In addition to the 32.5 Hz feature, if we squint, we can also a 38-39 Hz feature in h(t) which seems to presnt only in the vibration sensors in the PSL/HAM1/HAM2 region, so maybe there is a coupling is in that region. Not all features we see in those sensors show up in h(t), not atleast very strong, so maybe something special about these frequencies.
Lockloss @ 03:37 - no obvious cause, but there was an ITMX saturation immediately before the lockloss. First signal that shows motion is LSC-DARM.
Online lockloss tool is down.
H1 back to observing at 04:58 UTC. Waited in OMC_WHITENING for 10 minutes to damp rung up violin modes on ETMX.
State of H1: Observing at 163Mpc
H1 has now been locked for 9.5 hours. Very quiet evening so far.
TITLE: 04/11 Day Shift: 15:00-23:00 UTC (08:00-16:00 PST), all times posted in UTC
STATE of H1: Observing at 158Mpc
INCOMING OPERATOR: Ryan S
SHIFT SUMMARY: A power glitch this morning cause the EY HEPI pump to trip off, but after it was recovered, we finished initial alignment (and fixed SRY), then all the way up. We've been locked for 5.5 hours.
LOG:
Start Time | System | Name | Location | Lazer_Haz | Task | Time End |
---|---|---|---|---|---|---|
16:17 | SEI | Ryan C | EY | n | Reset HEPI pump controller | 16:18 |
16:45 | FAC | Tyler, contractor | Mids | n | Roof inspections | 20:04 |
18:50 | CDS | Fil | EY | n | Check on HEPI UPS | 19:22 |
20:46 | VAC | Gerardo, Jordan | MX | n | Looking for table | 21:14 |
21:38 | SQZ | Camilla, Eric | Optics Lab | N | Parts pick up/ drop offf | 22:27 |
TITLE: 04/11 Eve Shift: 23:00-07:00 UTC (16:00-00:00 PST), all times posted in UTC
STATE of H1: Observing at 157Mpc
OUTGOING OPERATOR: TJ
CURRENT ENVIRONMENT:
SEI_ENV state: CALM
Wind: 12mph Gusts, 7mph 5min avg
Primary useism: 0.03 μm/s
Secondary useism: 0.17 μm/s
QUICK SUMMARY: H1 has been locked and observing for over 5 hours.
In last night's lock, the range steadily increased overnight, this looks like it is a result of the cleaning being better tuned for a thermalized IFO than for early in the lock.
We have for a long time had a reference of 165 Mpc on the front wall, which is from a time of OM2 warm. This was the range reported by H1:CDS-SENSMON_CAL_SNSW_EFFECTIVE_RANGE_MPC, which did not have time dependent calibration corrections applied. The range with calibration corrections applied at that time was H1:CDS-SENSMON_CLEAN_SNSC_EFFECTIVE_RANGE_MPC, closer to 160 Mpc.
The attachment shows the spectrum and range comparison of last night to our previous reference time.
In order to reduce the duct static pressure of the hot and cold decks, we reduced the airflow rate from 15,000 CFM to 13,000 CFM. This lowered the static pressure in both ducts by roughly .05" which helped reduce the airflow noise in the control room. Currently one of the dual duct VAVs in the control room also has a degraded control board which will be replaced once available and should help further reduce the airflow noise.
J. Kissel, F. Clara Continuing along the design process for SPI, I asked Fil what we typically do for optical fiber "patch panels," where we want to modularize long optical fiber runs. He showed me this example of a fiber patch panel that uses off-the-shelf optical feedthrough parts. Note, as is specifically visible in IMG_4258.jpg, there is no optical element within the feedthrough. Hence, the feedthrough just serves the purpose of aligning the to connecting fibers for a (potentially lossy) brief fiber-to-air-and-back transition. This isn't the only way we do it; for comms fibers like what goes from the timing master in the MSR to the timing fanout in the CER, we do somethin like what's shown in IMG_4254.jpg. Alternatively, when optical fibers enter / exit a laser table (e.g. SQZT0 or the ALS ISCTEX or ISCTEY tables) we build our own labeled panel, that holds an off-the-shelf thorlabs feedthrough -- for example, the LO beam for the SQZ'er's panel is D1700147 which uses the Thor Labs part #ADAFC4.
FAMIS25985
ITMX ST1 was looking a bit higher, but perhaps not an issue yet. Everything else looks good.
Sheila, Jennie W
We have some a series of peaks inthe DARM spectrum from 25-34 Hz, some of which have broad shoulders, which have been with us for a long time but are now more prominent due to improvements in low frequency sensitivity.
I took a 2mHz resolution spectrum from a time with good range last night (165 Mpc). I tried searching all of these frequencies on the alog but found none of them.
frequency (Hz) | |
25.223 | |
26.475 | maybe BS roll mode (0.3 Hz off) Jennie found HAM6 channels in Gabriele's BRUCO from last night around 26.5 Hz. This frequency shifted since March 31st when it was at 26.512 Hz. Jim found these peaks in HAM6 GS13s and HPI L4Cs, and sees them when the IFO is locked and unlocked. He also sees that the frequency of this line shifted slightly since March 31st in the seismic sensors, as in DARM |
27.418 | HSTS bounce modes could be candidates (these look closest): SRM, SR2, PR2, MC1, MC2 Jim also sees this in HAM6 GS13s and L4Cs. |
27.504 | SR2/SRM bounce modes are closest |
27.707 | SR3 bounce? |
28.217 | PR3 bounce BRUCO shows coherence with PRCL, which |
29.000 | suspicously close to exactly 29 Hz, Jim also sees this in HAM6 GS13s and L4Cs. |
29.971 | |
32.301 | broad shoulder, dramatic change with PRCL offset |
33.334 | |
33.428 | |
33.639 | PR2 coherence |
33.639 | |
33.513 | |
35.712 | |
40.938 | HSTS and HLTS roll modes, PR2 and MC2 are closest. 40.938*0.6666 is 27.291 Hz, not lining up exactly with any of the above. (see similar discussion here: 21696) |
In the resonances wiki there is a ERM mode listed at 25.6281 (calculated not measured). There is a BS roll mode (R3) calculated as 25.9175 Hz with a link to 49643, which suggests it is 26.06 Hz
Jennie searched Gabriele's Bruco from last night, and found that there are PRCL coherences for some of these peaks. I retook the 2mHz spectra for a comparison of the times before and after the PRCL offset was first tuned, you can toggle between this and this screenshot to see the difference. Since this PRCL offset was first put in, we have changed the BS camera spot position which brought back the board PRCL coherence this offset was getting rid of (76814). The PRCL offset did seem to reduce the broad noise in DARM around these peaks, as you can see in the third attachment with with more binning.
Here's a similar effort from a few weeks ago: 76505
Interestingly, some of the peaks appear to have moved:
25.194 to 25.225 Hz
26.536 to 26.477 Hz
27.041 Hz is gone
29.500 Hz is gone
33.591 to 33.642 Hz
35.221 to 35.400 Hz
39.800 Hz is gone
The ETMY HEPI pump tripped this morning around 14:35 UTC (7:35am PST) potentially from the CS power glitch? I ended up going out to the Yend mech room and reset the VFH panel to reset the HEPI pump controller. The light was still on when I first checked the panel, I pressed the green ON button first which did not fix the issue, I then cycled it off and back on, pressing the red then green button, confirming that the light went off and on which Jim confirmed to have fixed it. Jim then brought back the pressure to 70PSI from the Beckoff_Pump_Controller medm.
Verified the HEPI Beckhoff electronics are powered by 24V from the VAC-R1 rack. Vacuum rack is on UPS.
Starting around 00:20 UTC (5:20pm PDT) this evening, the air has been much louder in the control room. Called Bubba to ask about it, and he says it's related to Eric's work today on the AHU-3 VAV (alog77092) and that the temporary ducting may have come undone. Other than it being louder in the control room, the duct should be fine and will be addressed in the morning.
I have not noticed a noticeable change in the IFO range since this noise increase, but I'll tag PEM and DetChar just in case.
This particular issue seems to have been caused by tubing coming loose from the pressure transducer for the supply fan on the hot deck side of AHU-3. The control system no longer had a reference for the fan static pressure and opened the vanes to maximum which sent the duct static pressure to over 3" W.C. The air handler ran this way all night until I was able to reconnect the tubing and reset the air handler.
HAM1 ASC FF was off from 1396381762 to 1396382969 (20 minutes starting 90 minutes into lock). Using this data I could retune the feed forward filters that subtract HAM1 motion from the ASC signals.
I based the attached jupyter code on an older version, and automated the subtraction training for all pitch and yaw ASC signals (CHARD, INP1, PRC2, DC1 and DC2).
Looking at the filters that are loaded now, we used to do the FF only for the pitch degrees of freedom. The subtraction seems to be doing something good in yaw too, so I suggest we upload and try the yaw feedforward filter.
The first plot shows the expected subtraction predicted by NonSENS. The second plot shows the absolute value of the transfer functions.
Finally, the attached text file contains the foton filter definitions for all the feedforward filter banks. I haven't upload those flter to foton, and not tried them yet. Before each filter there is the name of the filter bank where it should be loaded, for example H1:HPI-HAM1_TTL4C_FF_CART2ASCP_1_1
[Jennie, Jim, Gabriele]
We tried the new filter, and there's something wrong with them. Even with a gain of 0.5 (instead of 1) they make some of the ASC signals much worse, see attached plot.
We'll use the time we got today with FF off (starting 1396987833 and lastring 10 minutes) to debug the problem and retune the FF
In the attached plot: green = FF off, blue = nominal FF, red = new FF with half gain
Gabriele, Jim, Jennie W
I saved the new HAM FF filters in H1SEIPROC foton file. These will only be loaded in during our commissioning window tomorrow.
The code attached to this alog had a bug that produces the wrong filters. Attached an updated version, hopefully without any more bugs. Also attached the new text filw with all the filters.
The two plots show the expected subtarction and the absolute value of the filters.
Gabriele's new coefficients have been loaded into SEIPROC and are available, but haven't been turned on or tested yet.
WP 11805
ECR E2400083
Lengths for possible SPI Pick-off fiber. Part of ECR E2400083.
PSL Enclosure to PSL-R2 - 50ft
PSL-R2 to SUS-R2 - 100ft
SUS-R2 to Top of HAM3 (flange D7/D8) - 25ft
SUS-R2 to HAM3 (flange D5) - 20ft
J. Kissel [for J. Oberling] Jason also took the opportunity during his dust monitoring PSL incursion today to measure the distance between where the new fiber collimator would go on the PSL table to the place where it would exit at the point Fil calls the PSL enclosure. He says SPI Fiber Collimator to PSL Enclosure = 9ft.
J. Kissel [for F. Clara, J. Oberling] After talking with Fil I got some clarifications on how he defines/measures his numbers: - They *do* include any vertical traversing that the cable might need to go through, - Especially for rack-to-rack distances, always assumes that the cable will go to the bottom of the rack (typically 10 ft height from cable tray to rack bottom), - He adds two feet (on either end) such that we can neatly strain relieve and dress the cable. So -- the message -- Fil has already built in some contingency into the numbers above. (More to the point: we should NOT consider them "uncertain" and in doing so add an addition "couple of feet here" "couple of feet there" "just in case.") Thanks Fil! P.S. We also note that, at H1, the optical fibers exit the PSL at ground level on the +X wall of the enclosure between the enclosure and HAM1, underneath the light pipes. Then the immediately shoot up to the cable trays, then wrap around the enclosure, and then land in the ISC racks at PSL-R2. Hence the oddly long 50 ft. number for that journey. Jason also reports that he rounded up to the nearest foot for his measurement of the 9ft run from where the future fiber collimator will go to the PSL enclosure "feed through."
Upon discussion with the SPI team, we want to minimize the number of "patch panel" "fiber feedthrough" connections in order to minimize loss and polarization distortion. As such, we prefer to go directly from the "SPI pick-off in the PSL" fiber collimator directly to the Laser Prep Chassis in SUS-R2. That being said purchase all of the above fiber lengths, such that we can re-create a "fiber feedthrough patch panel full" system as contingency plan. So, for the baseline plan, we'll take the "original, now contingency plan" PSL-R2 to SUS-R2, 100 ft fiber run and use that to directly connect the "SPI pick-off in the PSL" fiber collimator directly to the Laser Prep Chassis in SUS-R2. I spoke with Fil and confirmed that 100 ft is plenty enough to make that run (from SPI pick-off in PSL to SUS-R2).