Sheila, Vicky - Summarizing SQZ losses from the continuously updated sqz wiki, and loss gsheet.
Total SQZ Losses inferred from Generated SQZ and Measured Anti-SQZ / SQZ: ~30-35%.
With total budgeted optical losses of 20%, this implies ~10-15% unexplained losses. Are these excess losses IFO- or SQZ- side?
Summary of the 20% budgeted optical losses, excluding mode-mismatch:
- IFO path - Readout losses (SRM-DCPDs) ~ 8%
- IFO readout losses can also be inferred from the shot noise level without squeezing which depends on circulating arm power, HD angle (-10.7 deg, LHO:71913), SRCL detuning, and readout losses. LHO:67610 -- Given reasonable measurements of other quantities, to reconcile shot noise with calibrated DARM, we consistently require high readout losses of 20-25%.
- Compared to the known 8% readout losses, this implies unexplained IFO readout losses of ~12-17%, without squeezing.
- Are these excess IFO readout losses also SQZ readout losses? Common losses include optical pickoffs, OMC losses, DCPD QE, etc. Differential losses can result from e.g. different IFO + SQZ mode-matchings and alignments through the AS port.
- SQZ path - Injection losses (SQZ-SRM) ~ 13%
- From diagnostic homodyne measurements, we expect no more than 7% excess HAM7 losses. See e.g. Feb '23, LHO:67219 (< 10% unexplained HD loss) and Sept '23, LHO:72802 (< 7% unexplained HD loss).
- Suspect homodyne squeezing is still limited by our setup and not in-chamber losses, given high-throughput in-chamber measurements. More homodyne squeezing would further constrain HAM7 loss.
--------------------------------------------------------------------------------------
Other non-loss mechanisms that reduce observed squeezing:
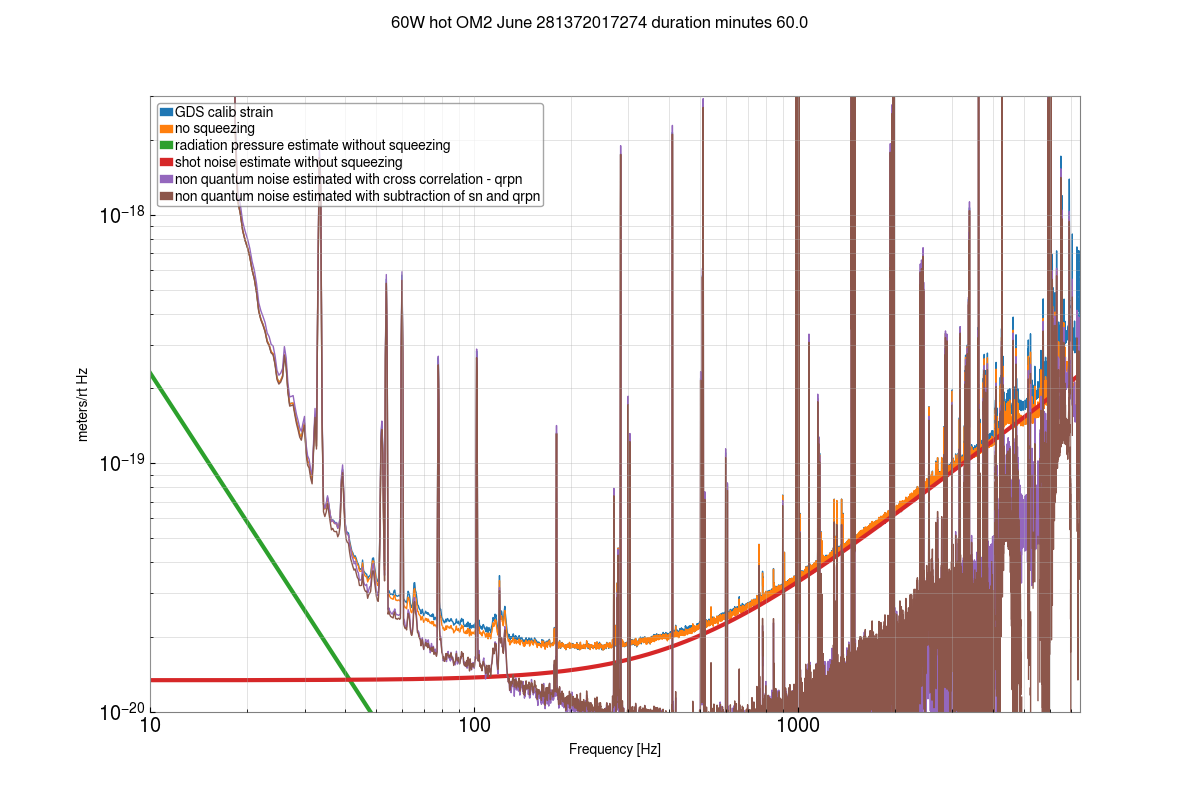
- technical noise -- From the noise budget in LHO:72717, laser frequency noise looks about -14 dB (=20*log10(0.7/3.5)) below unsqueezed shot noise at our best around ~1 kHz. Correlated noise estimate suggests even higher technical noise at kHz, see Sheila's log June 2023, LHO:70978 for plots with 60W and hot OM2, and Craig's correlated noise budget from July 2023, LHO:71333.
- phase noise -- From homodyne measurements LHO:67223, we expect phase noise is less than ~20 mrad. In DARM, we haven't seen sqz turn-arounds at high NLGs; NLG sweeps on DARM can be used to check this phase noise estimate.
- mode-matching -- between SQZ-IFO and SQZ-OMC. From SQZ-OMC mode scans (e.g. Jan 2023, LHO:66946) and attempts to improve ADF-OMC transmission (most recently July 2023, LHO:71270), it seems we have railed PSAMS before fully optimizing SQZ-OMC mode-matching. Although recent Aug. 2023 sqz measurements (72565) looked quite flat (maybe because we are loss-limited, or too much mismatch?), we do expect mode-mismatch with OM2 hot.
For AS port loss budgeting and estimating OMC mode-mismatch, it may be worth trying another sqz single-bounce OMC scan with hot OM2, comparing e.g. SQZT7 OPO-IR transmitted seed power with output PD's such as OMC_REFL, and playing with PSAMS.
--------------------------------------------------------------------------------------
To get to 4.5 dB sqz, we need to reduce technical noise by about 5-7 dB (aim for laser frequency noise 10-fold lower than shot noise in asd). May need to reduce losses by a few %, but we have seen almost 4.5 dB sqz at various IFO powers over the past year (e.g. 50W, 60W), so suspect losses limit sqz at this 4.5 dB level.
To get to 6 dB sqz, we need to reduce losses by 10-15% and technical noise by 5-7 dB (as above). To find losses, we can use e.g. AS port measurements to constrain IFO-path readout losses, and in-air homodyne measurements to constrain SQZ-path injection losses from HAM7. Analysis of the quantum noise should also help us identify mode-matching losses as they become prominent.
NLN reaquired at 21:10 UTC