[Koji, Dan]
This is a followup entry for LHO ALOG 16034.
Summary
- The OMC cavity was locked with PDH locking by implementing a bypass optical path from at the OMC REFL to the AS resonant RF PD.
- The OMC cavity length displacement was measured. It is found in the 4th attachment.
- It is mostly consistent with Zach’s measurement LLO ALOG 8674 and has x3 better floor level at some frequencies.
- There is a forest of peaks above 400Hz to 1.3kHz. They were very easily excited by light tapping on the HEPI crossbars
Motivation
- The length noise of the Output Mode Cleaners at LHO and LLO were so far locked with the transmission DCPDs with length dither or mid fringe with CDS.
- The measurement bandwidth with these techniques was limited by the CDS bandwidth (8kHz) or the dither frequency (2~3kHz). The cavity length noise above these frequencies wer e unknown.
- The measurements were also prone to the intensity noise on the beam. As the base band is at audio frequency in either cases, it is hard to be shot noise limited without proper setting of the intensity stabilization. Some features in the spectrum were not distinguishable from the intensity noise.
- PDH locking of the OMC was expected to provide an independent measurement of the OMC length noise with possibly better sensitivity, as the PDH locking is in principle insensitive to the intensity noise.
- In fact, the most of the conmponents for the PDH locking were already there. If we use the single bounce beam from one of the ITMs, the beam is already phase modulated. An RF PD is at the same table with the OMC REFL beam. The detection system and actuator are on the field racks next to HAM6. Therefore the effort of the PDH locking was minimal.
Configuration
- The ITMY single bounce beam was guided to the OMC. i.e PRM/SRM/ITMX/ETMX/ETMY were misaligned.
- The beam alignment to the OMC was controlled using OMC QPDs. The dither alignment servo has not been configured and was not functional at the time.
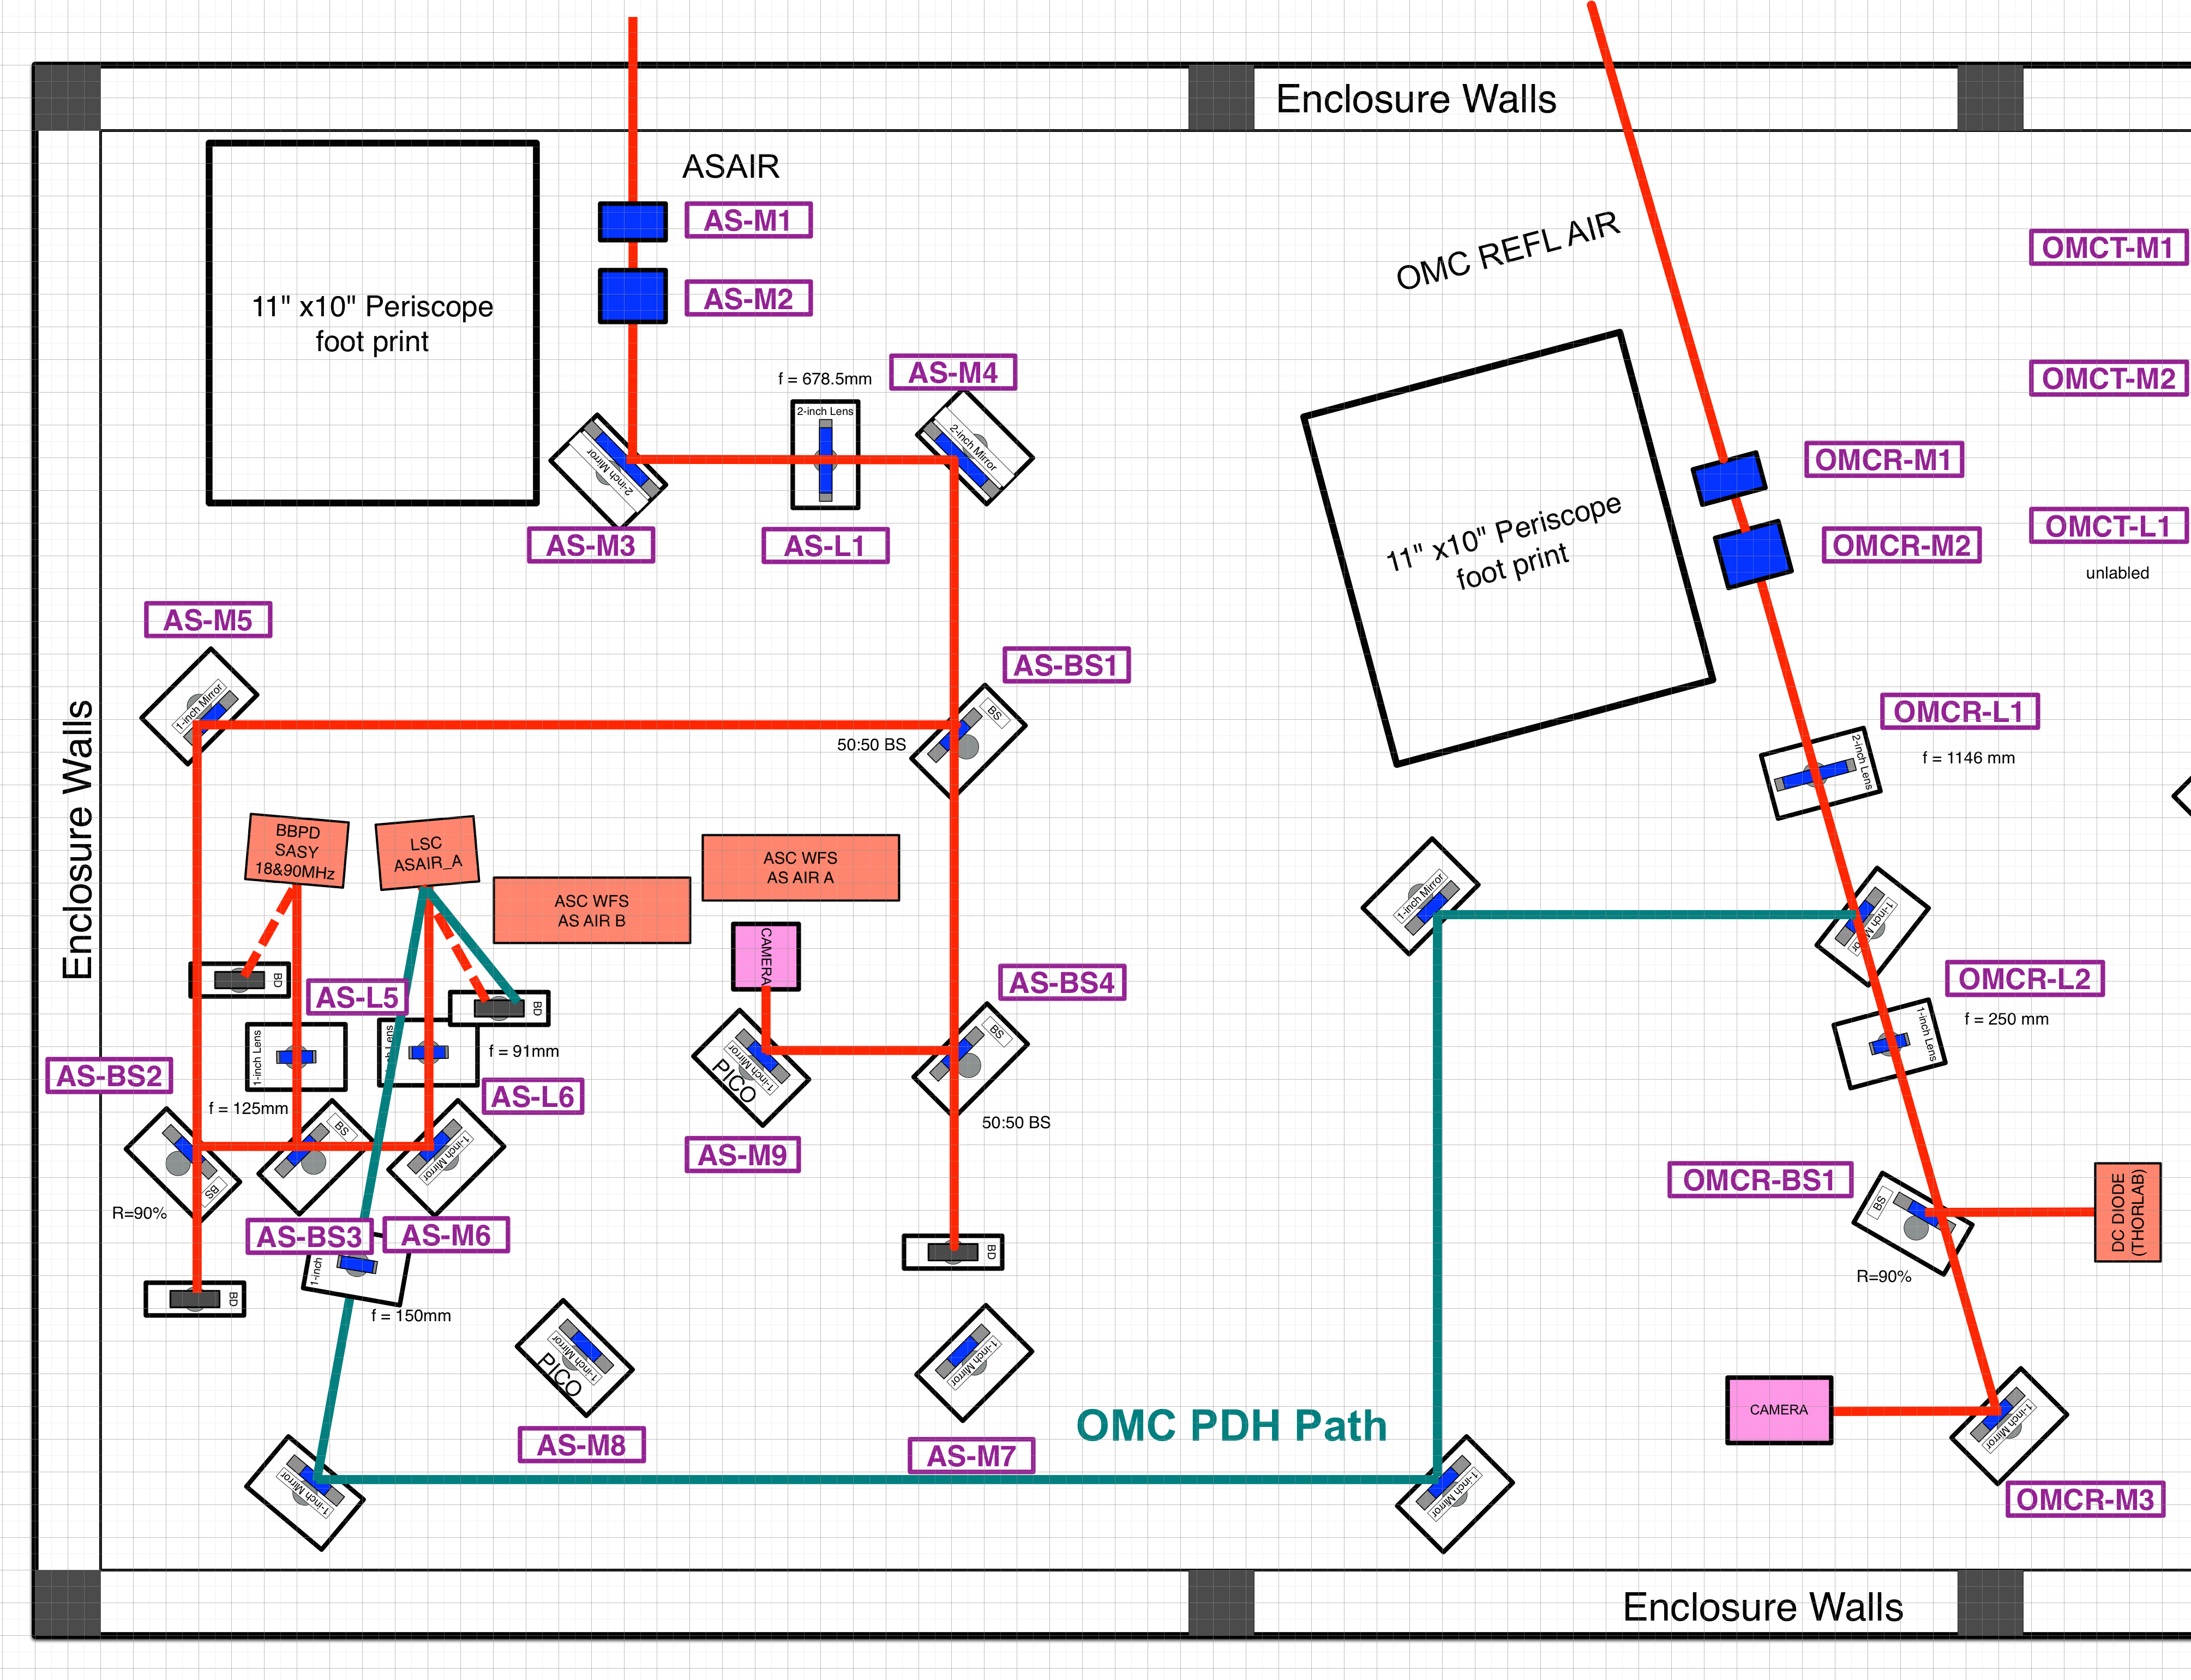
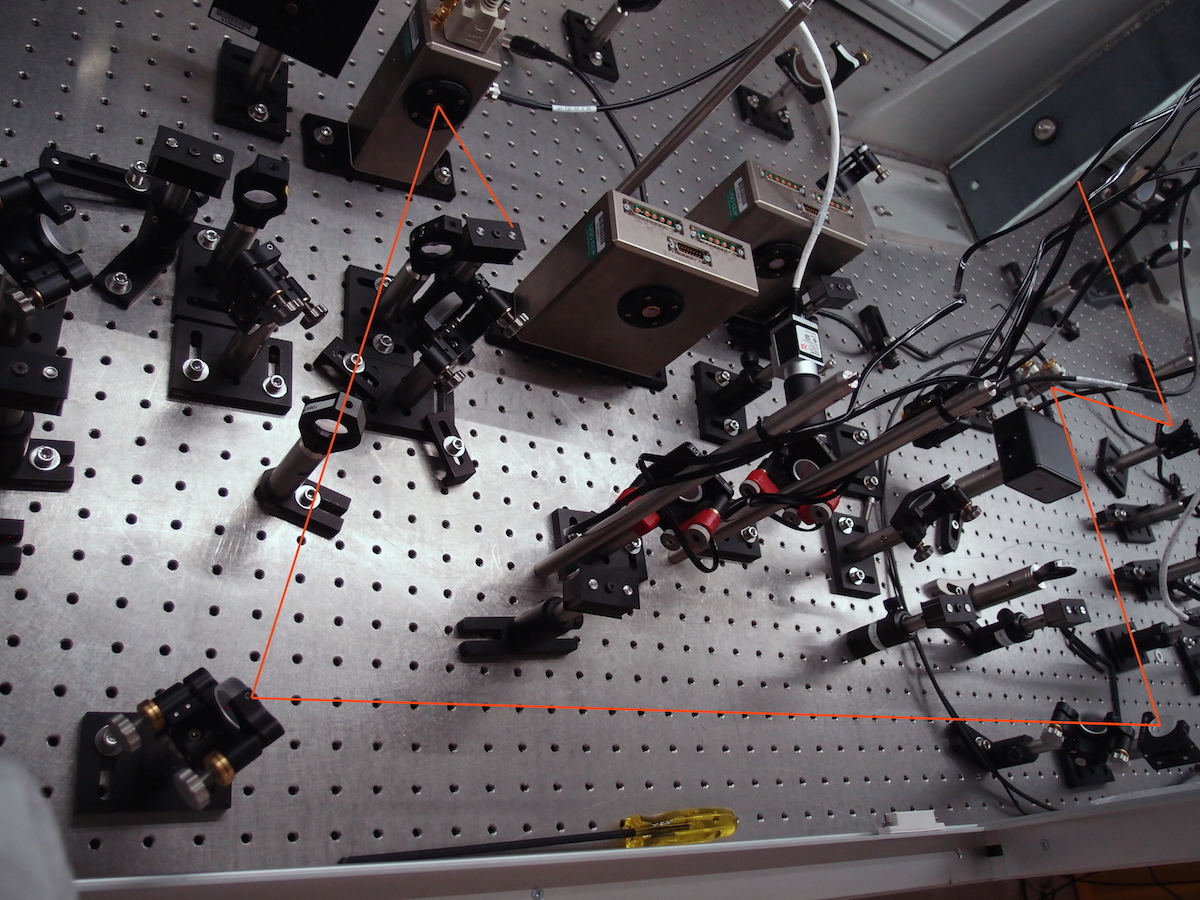
- The OMC REFL beam was aligned to the OMCR path on ISCT6 by moving an in-vacuum picomotor as Dan described as Dan described.
- The OMCR beam was introduced to ASAIR_A PD without moving existing optics on the table. As found in the figure (attachment 1), an additional optical path was added to the OMCR path. The OMCR beam was deflected between two lenses and brought to AS45 PD going through the space between the mirrors in the AS path. The beam on the PD was focused by a lens with the focal length of 150mm. This made the spot sufficiently small for the 2mm aperture of the PD.
- With the single bounce configuration, the optical power from the chamber was ~10mW.
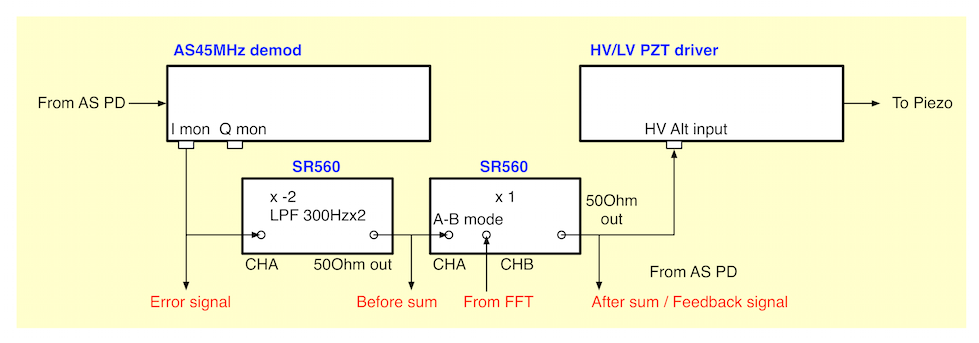
- The servo configuration is found in the figure (attachment 2). The AS 45MHz demodulator was used for the PDH sensing (i.e. no rewiring was necessary). We found our bad luck that the proper demodulation phase was about 45 deg off and the signal size in the I and Q phases were almost the same with opposite sign. This meant that we could combine these two with another SR560. But we decided to use the I signal for the error signal.
- Since there is no digital signal path from LSC outputs to the OMC PZT, we implemented an analog servo. The error signal from the demodulator I-phase monitor channel was fed to an SR560 with gain of -2 and LPF (-16dB/Oct, fc=300Hz). The 50 Ohm output of this SR560 was fed to another SR560 with the gain of the unity. The second SR560 was used as a summing point for an openloop TF measurement. The 50Ohm output of the second SR560 was connected to an aux drive port of the HV driver.
Servo modeling
- You may wonder how just a 300Hz 2nd order LPF could make the servo stable!? In fact, we could lock the cavity even with gain of -1 with flat response. This is a subtle combination of the dewhitening and the poles and zeros formed by the PZT capacitance and the output RC network of the driver.
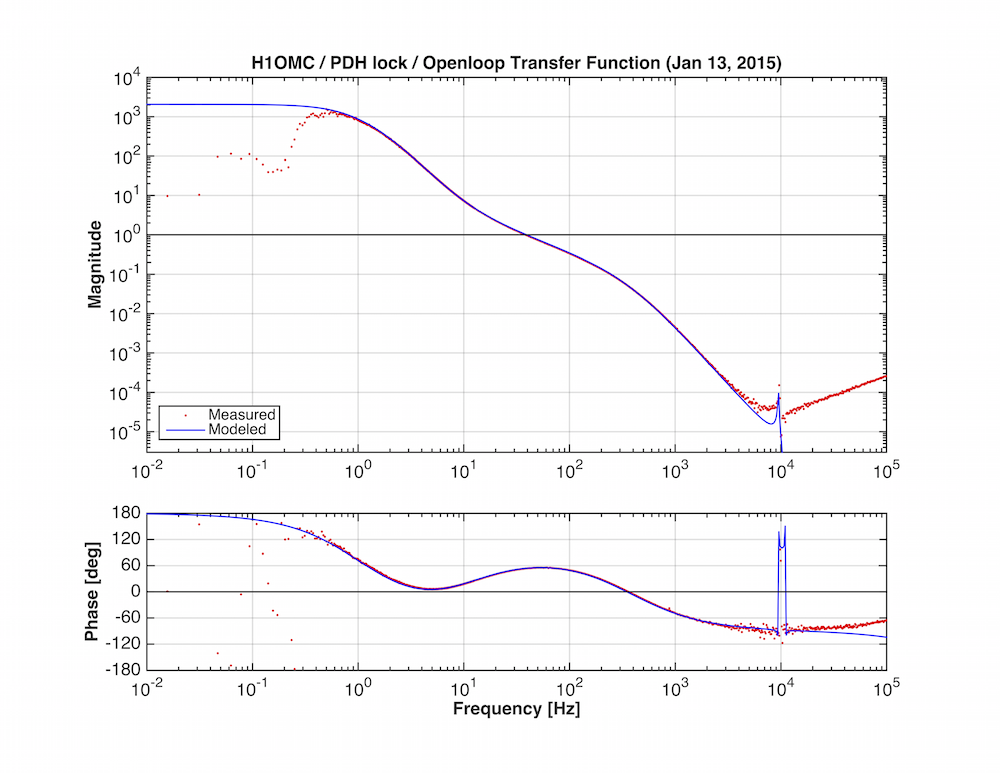
- The open loop transfer function of the servo was measured (attachment 3) by injecting the excitation at the second SR560 while the "after sum" (denominator) and "before sum" (numerator) signals were observed with SR785.
- Driver/actuator response: The HV Piezo driver (D060283) has two dewhitening stages and an output RC network. The dewhitening stage, which are common for the digital and external analog inputs, have two poles at 0.923Hz and two zeros at 10.15Hz with the DC gain of the unity. Note that the signal is reduced by a factor of 0.9989, as the input impedance of the driver (47.5kOhm) and the 50Ohm output impedance of the SR560 form a voltage divider. The main HV stage has the gain of 10. The output stage has the output series resister of 50k (R51) and then the parallel capacitors including the PZT capacitance of 0.51uF (Noliac NAC2124). (C11 - 0.47uF // C26+R55 - 0.47uF // Cpzt - 0.51uF). This imposes two poles at 2.19Hz and 502.1Hz, and one zero at 338.6Hz. Finally the OMC PZT2 has the calibration of 12.9nm/V (measured at Caltech), and the beam incident angle of theta = 4.04deg, and parasitic mechanical resonance of the PZT tombstone (pole at 9.5kHz Q=100 and zero at 11kHz Q=100). Don't forget that the factor of 2 i.e. cavity length change = 2/cos(theta) * PZT displacement
- The model of the openloop transfer function agrees exteremely well with the measurement. From this model, we determined the slope of the PDH signal to be 4.0e9 V/m.
Cavity displacemen noise
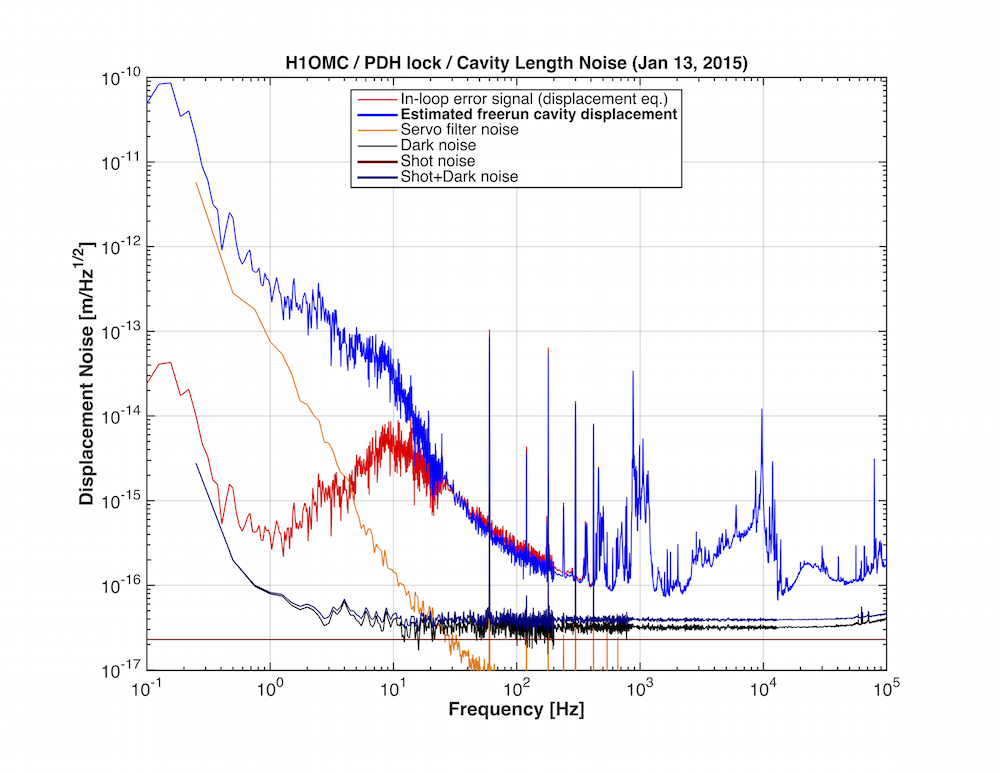
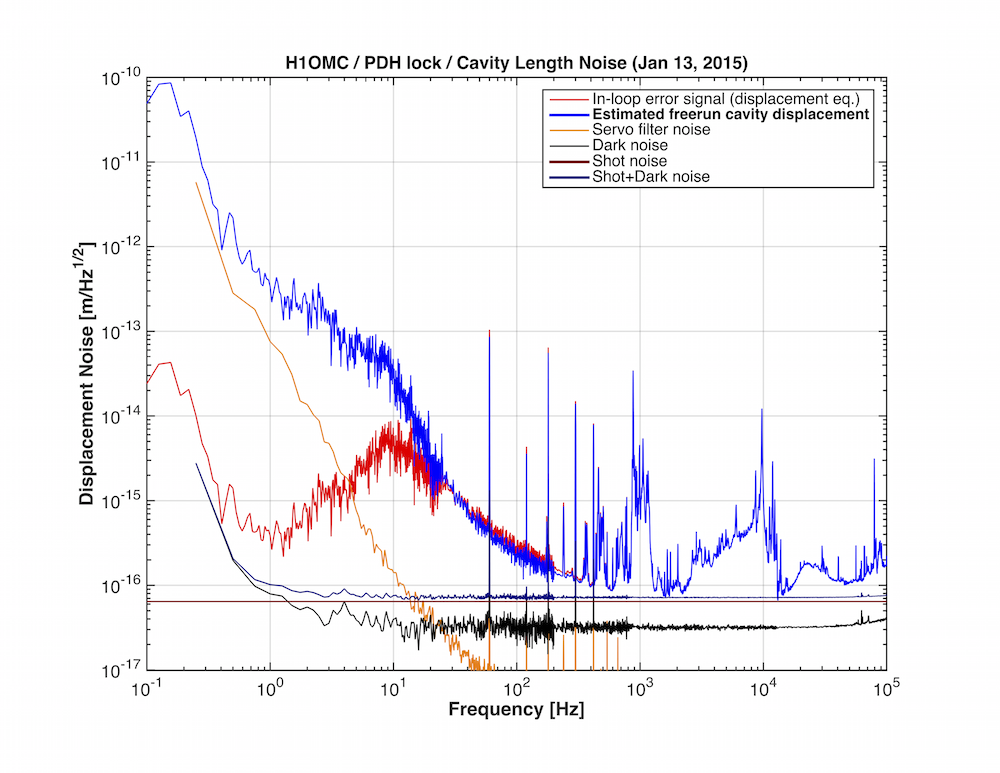
- Calibrated cavity displacement noise is found in attachment 4.
- The red curve is the error signal calibrated in the unit of displacement. The compensation of the loop supression was applied to this red curve in order to obatin the "estimated free running motion" of the cavity (Blue curve).
- The estimated cavity displacement seems to have better floor level by a factor ~3 compared to the half-fringe measurement at LLO. Also the spectrum below 300Hz looks cleaner and smoother. We wonder what is the cause of this noise.
- Similar to the LLO measurement, the spectrum has forest of peaks from 400Hz to 1.3kHz. There is very eminent peak at 9.5kHz which is associated with the prism resonances of the cavity.
- The dark noise was estimated to be 3.3x10⁻¹⁷m/rtHz. I made the simplest estimation of the shot noise level. The dark noise was assumed to be limited by the PD noise. The shot noise intercept current is 2mA and the photocurrent was ~8mA. Therefore the shot noise level was estimated to be 3.3x10⁻¹⁷x Sqrt(8/2) = 6.6x10⁻¹⁷ m/rtHz.
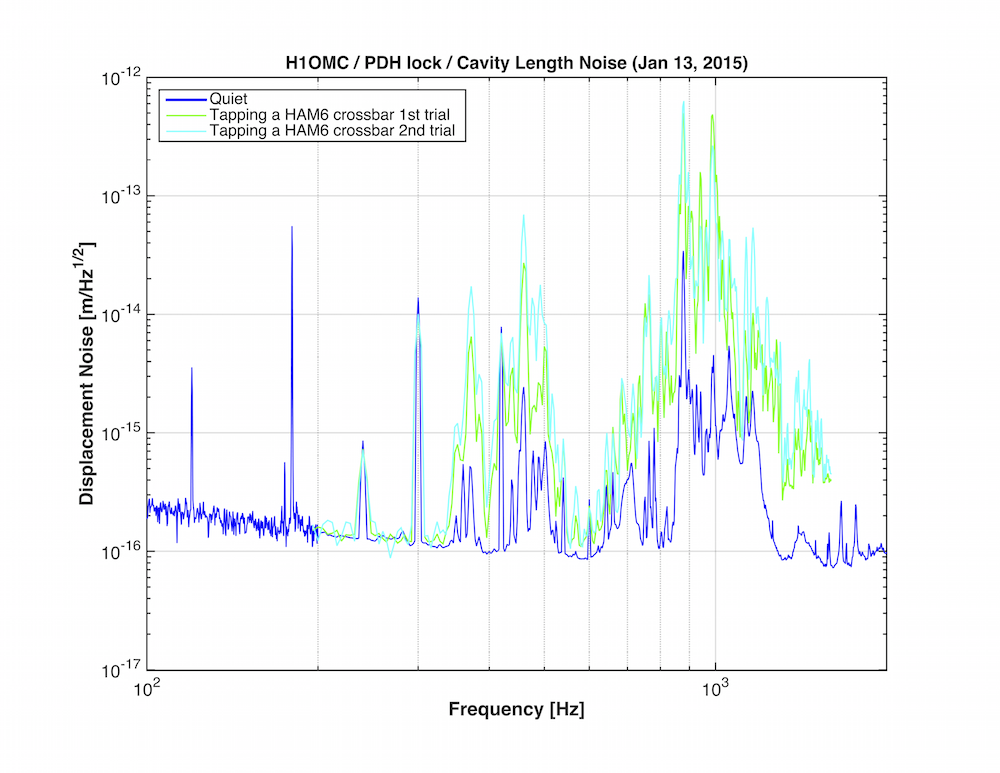
Peaks between 400Hz and 1.3kHz
- It is unlikely that the OMC cavity itself has such many mechanical resonances from 400Hz to 1.3kHz. It is known that the OMC cavity has one high Q resonance at 1kHz (body bending mode). But any other resonances are above 3kHz.
- We tapped the ISCT6 tables, theHEPI crossbars, and chambers in order to see if we can excite these forest somehow.
- Basically everything is accoustically coupled. But we dare to say that the table does not excite the noise much. The most sensitive one was the HEPI crossbars. Just light touch of a HEPI cross bar excited the modes nearly x100 (attachment 5). This excitation was more eminent at the HEPI crossbars than at the chamber or the flange for the windows.
Still to do
- The displacement data is to be compared with the measurements with the other techniques.
- The displacement with PDH while the cavity is locked with the dither locking.
- Noise coupling from the OMC ASC.
- Evaluate frequency noise coupling.
- Actuator noise from the PZT driver.

The PZT HV/LV driver outputs were measured. They were calibrated to be equivalent to the cavity displacement.
There are AC and DC outputs for each of the HV and LV PZT voltages. The plot shows min(disp. AC, disp. DC) to give the upper limit of the driver noise.
They look suspiciously close to the measured OMC length displacement. However, we can't exclude the possibility that the readout circuit noise is limiting this measurement.
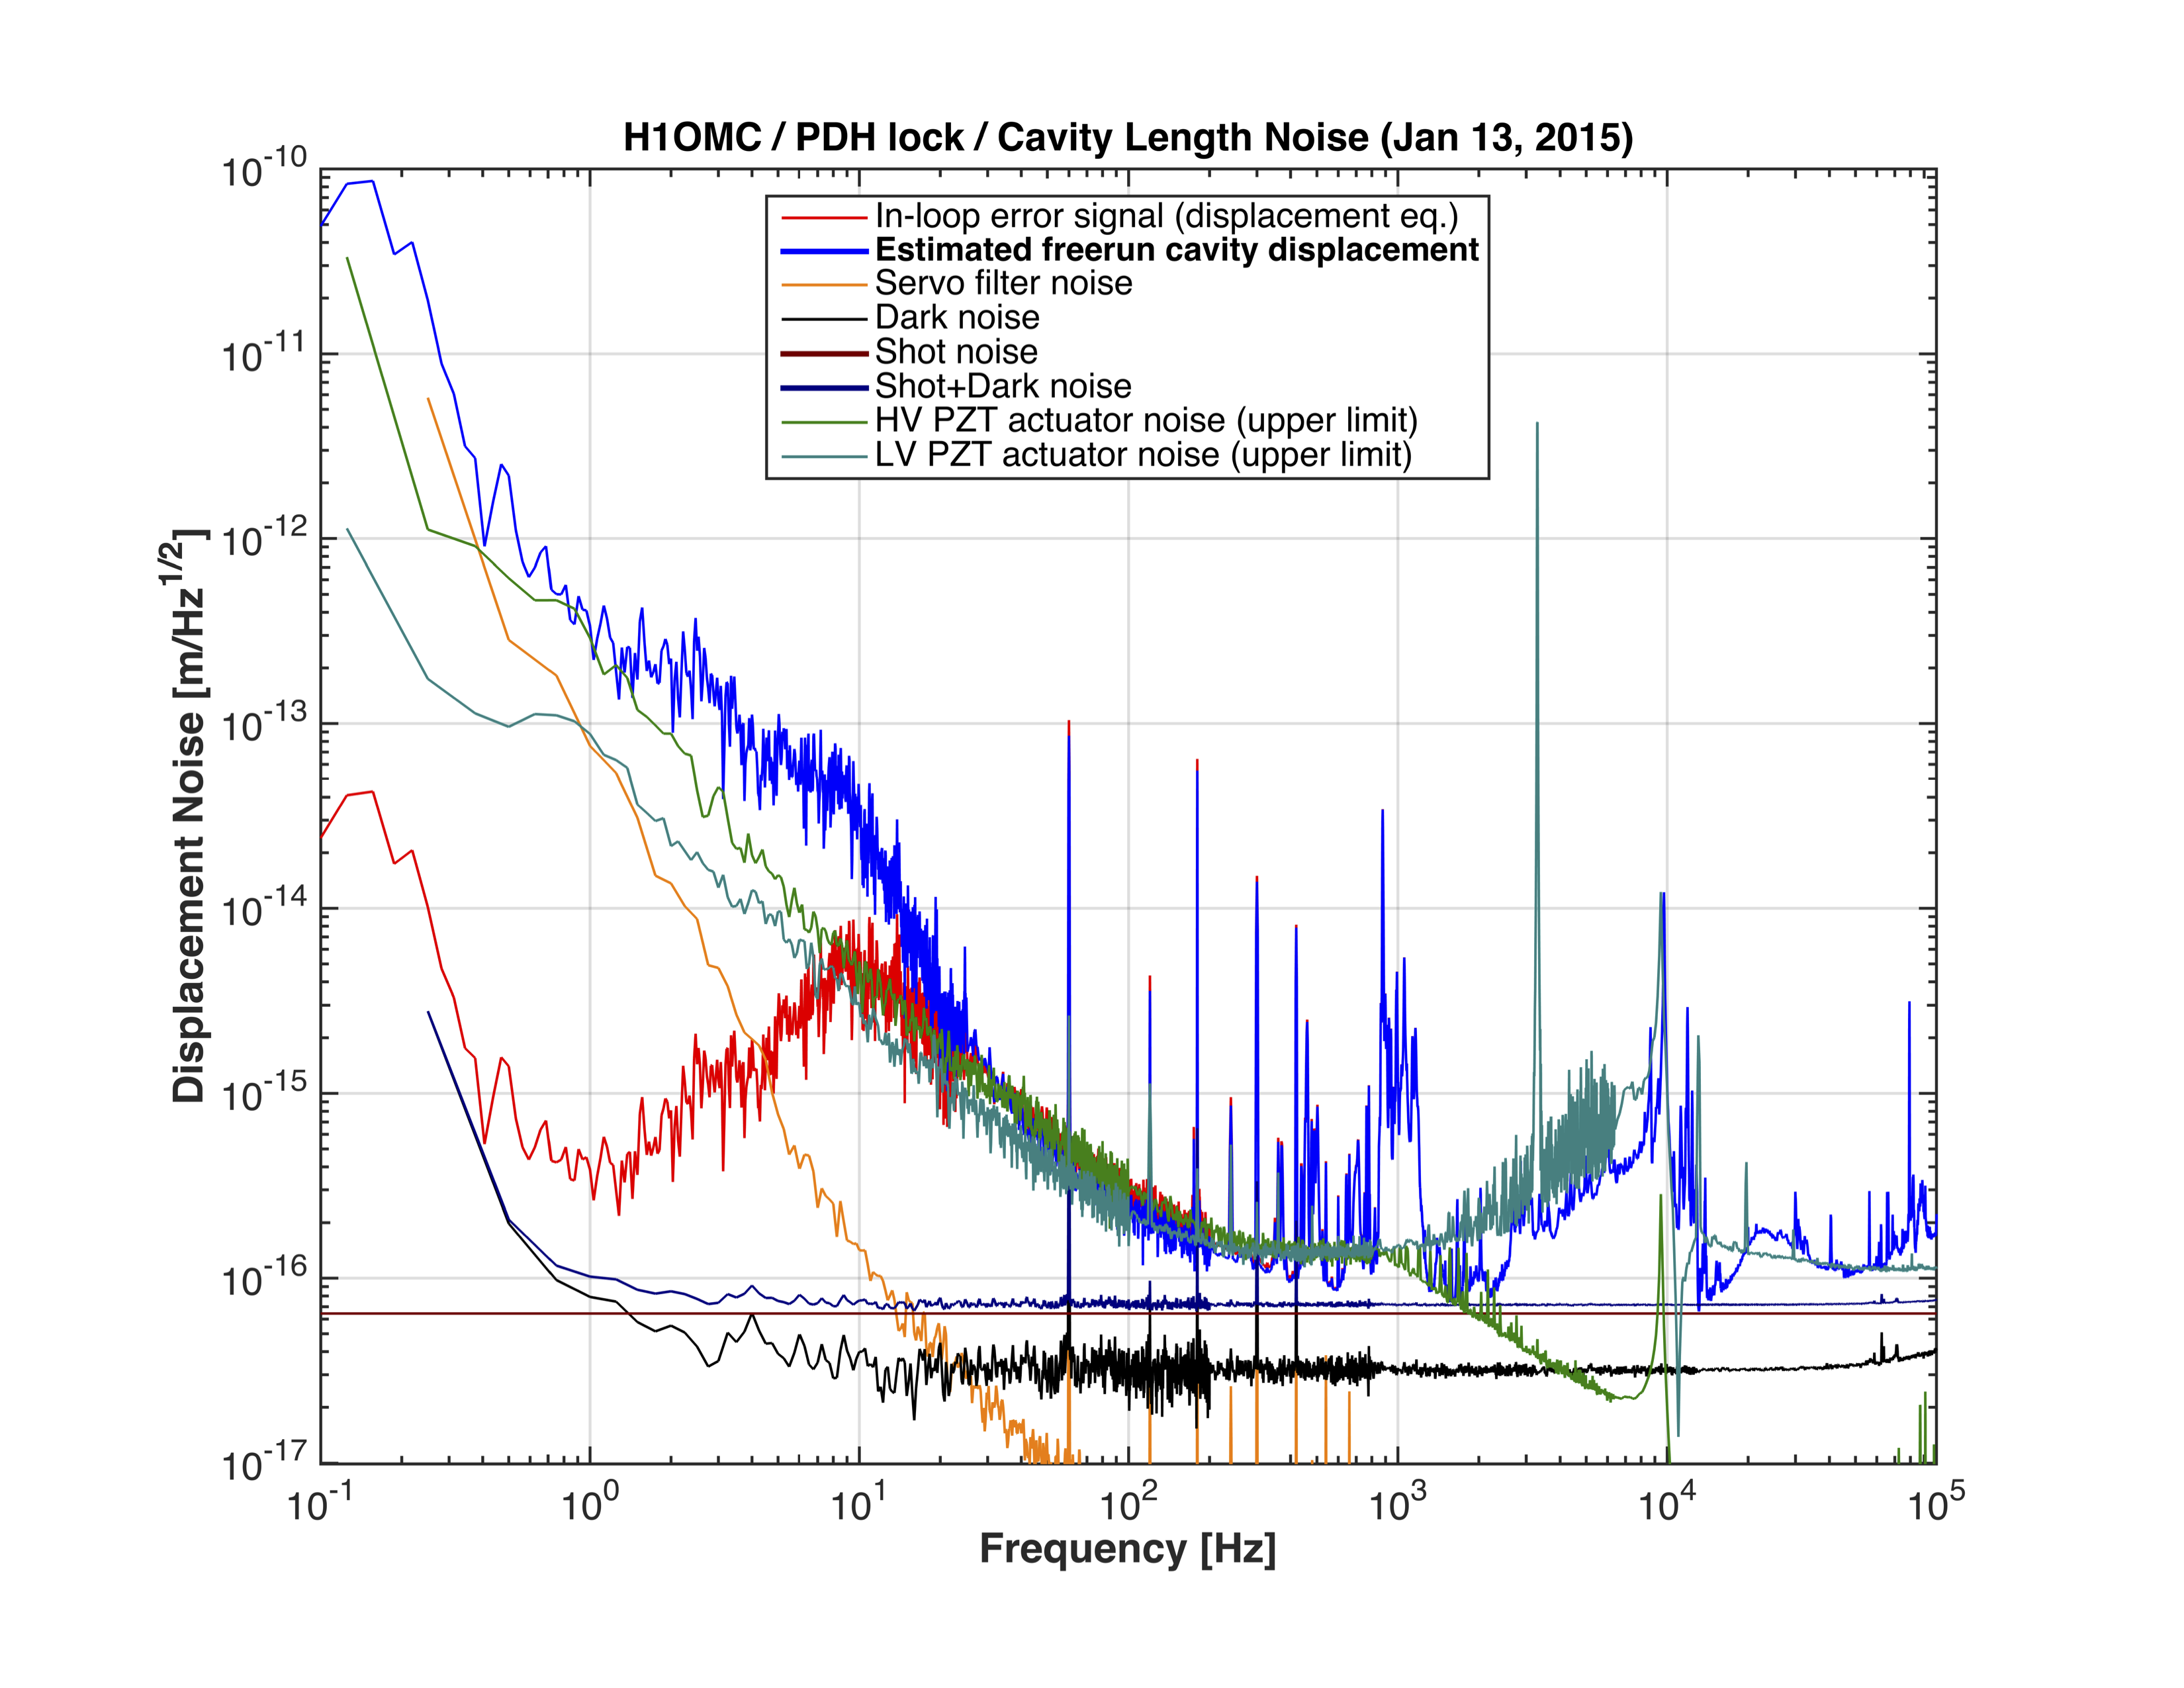
There was some mistake in the shotnoise calculation. The revised plot is here.
This tells us that the sensing noise is well below the measured noise level.