madeline.wade@LIGO.ORG - posted 18:27, Thursday 17 September 2015 - last comment - 20:05, Monday 21 September 2015(21638)
Changes to GDS calibration filters between ER7 and ER8/O1
I've quantified the changes that will take place in the GDS calibration correction filters when the ER8/O1 update occurs. A summary of the changes are:
- Actuation time delay update causes about 6 degrees of change in the phase accross 1 kHz
- Updates to the analog AA/AI filters cause < 5% change amplitude across all freqeuncies and about 7 degrees of change in phase across 8kHz
- Removal of ESD low-noise-low-voltage driver pole correction removes < 0.1% change in amplitude, mostly at high frequencies and about 2.5 degrees in phase across 1kHz
- Uncompensated OMC whitening poles update causes ~25% change in amplitude across 8kHz and ~60 degree change in phase across 8kHz.
In total:
- The residual correction filter updates cause 16% change in amplitude and 50 degree change in phase across 8 kHz.
- The control correction filter updates cause <1% change in amplitude and 2.5 degree change in phase across 1 kHz
The attached plots illustrate the changes described above.
Non-image files attached to this report

Comments related to this report
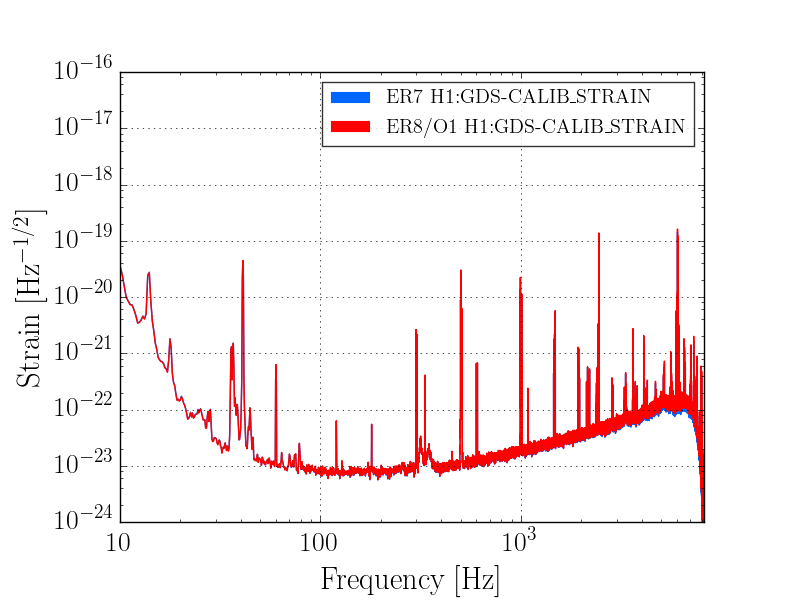
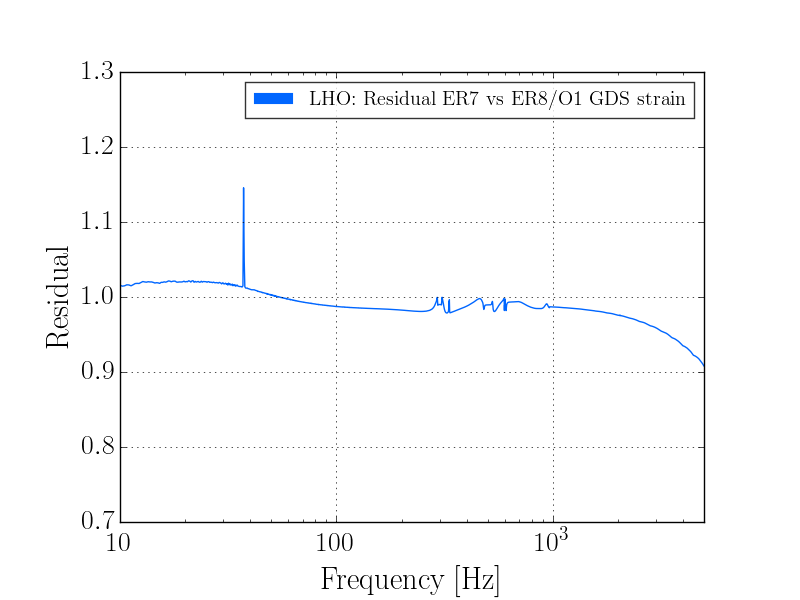
I have also plotted the h(t) spectrum for the ER7 and ER8/O1 GDS filters. Attached are plots of the spectrum on top of each other and of the residual between the two. Overall, the ER8/O1 GDS filter updates average ~a few percent corrections to h(t).
Images attached to this comment