Camilla, Georgia
Checking co-alignment between A and H paths
-
Set irises for the A path off the VOPO platform, on transmission of the beamsplitter.
-
Switched the green fiber from the G path to the H path
-
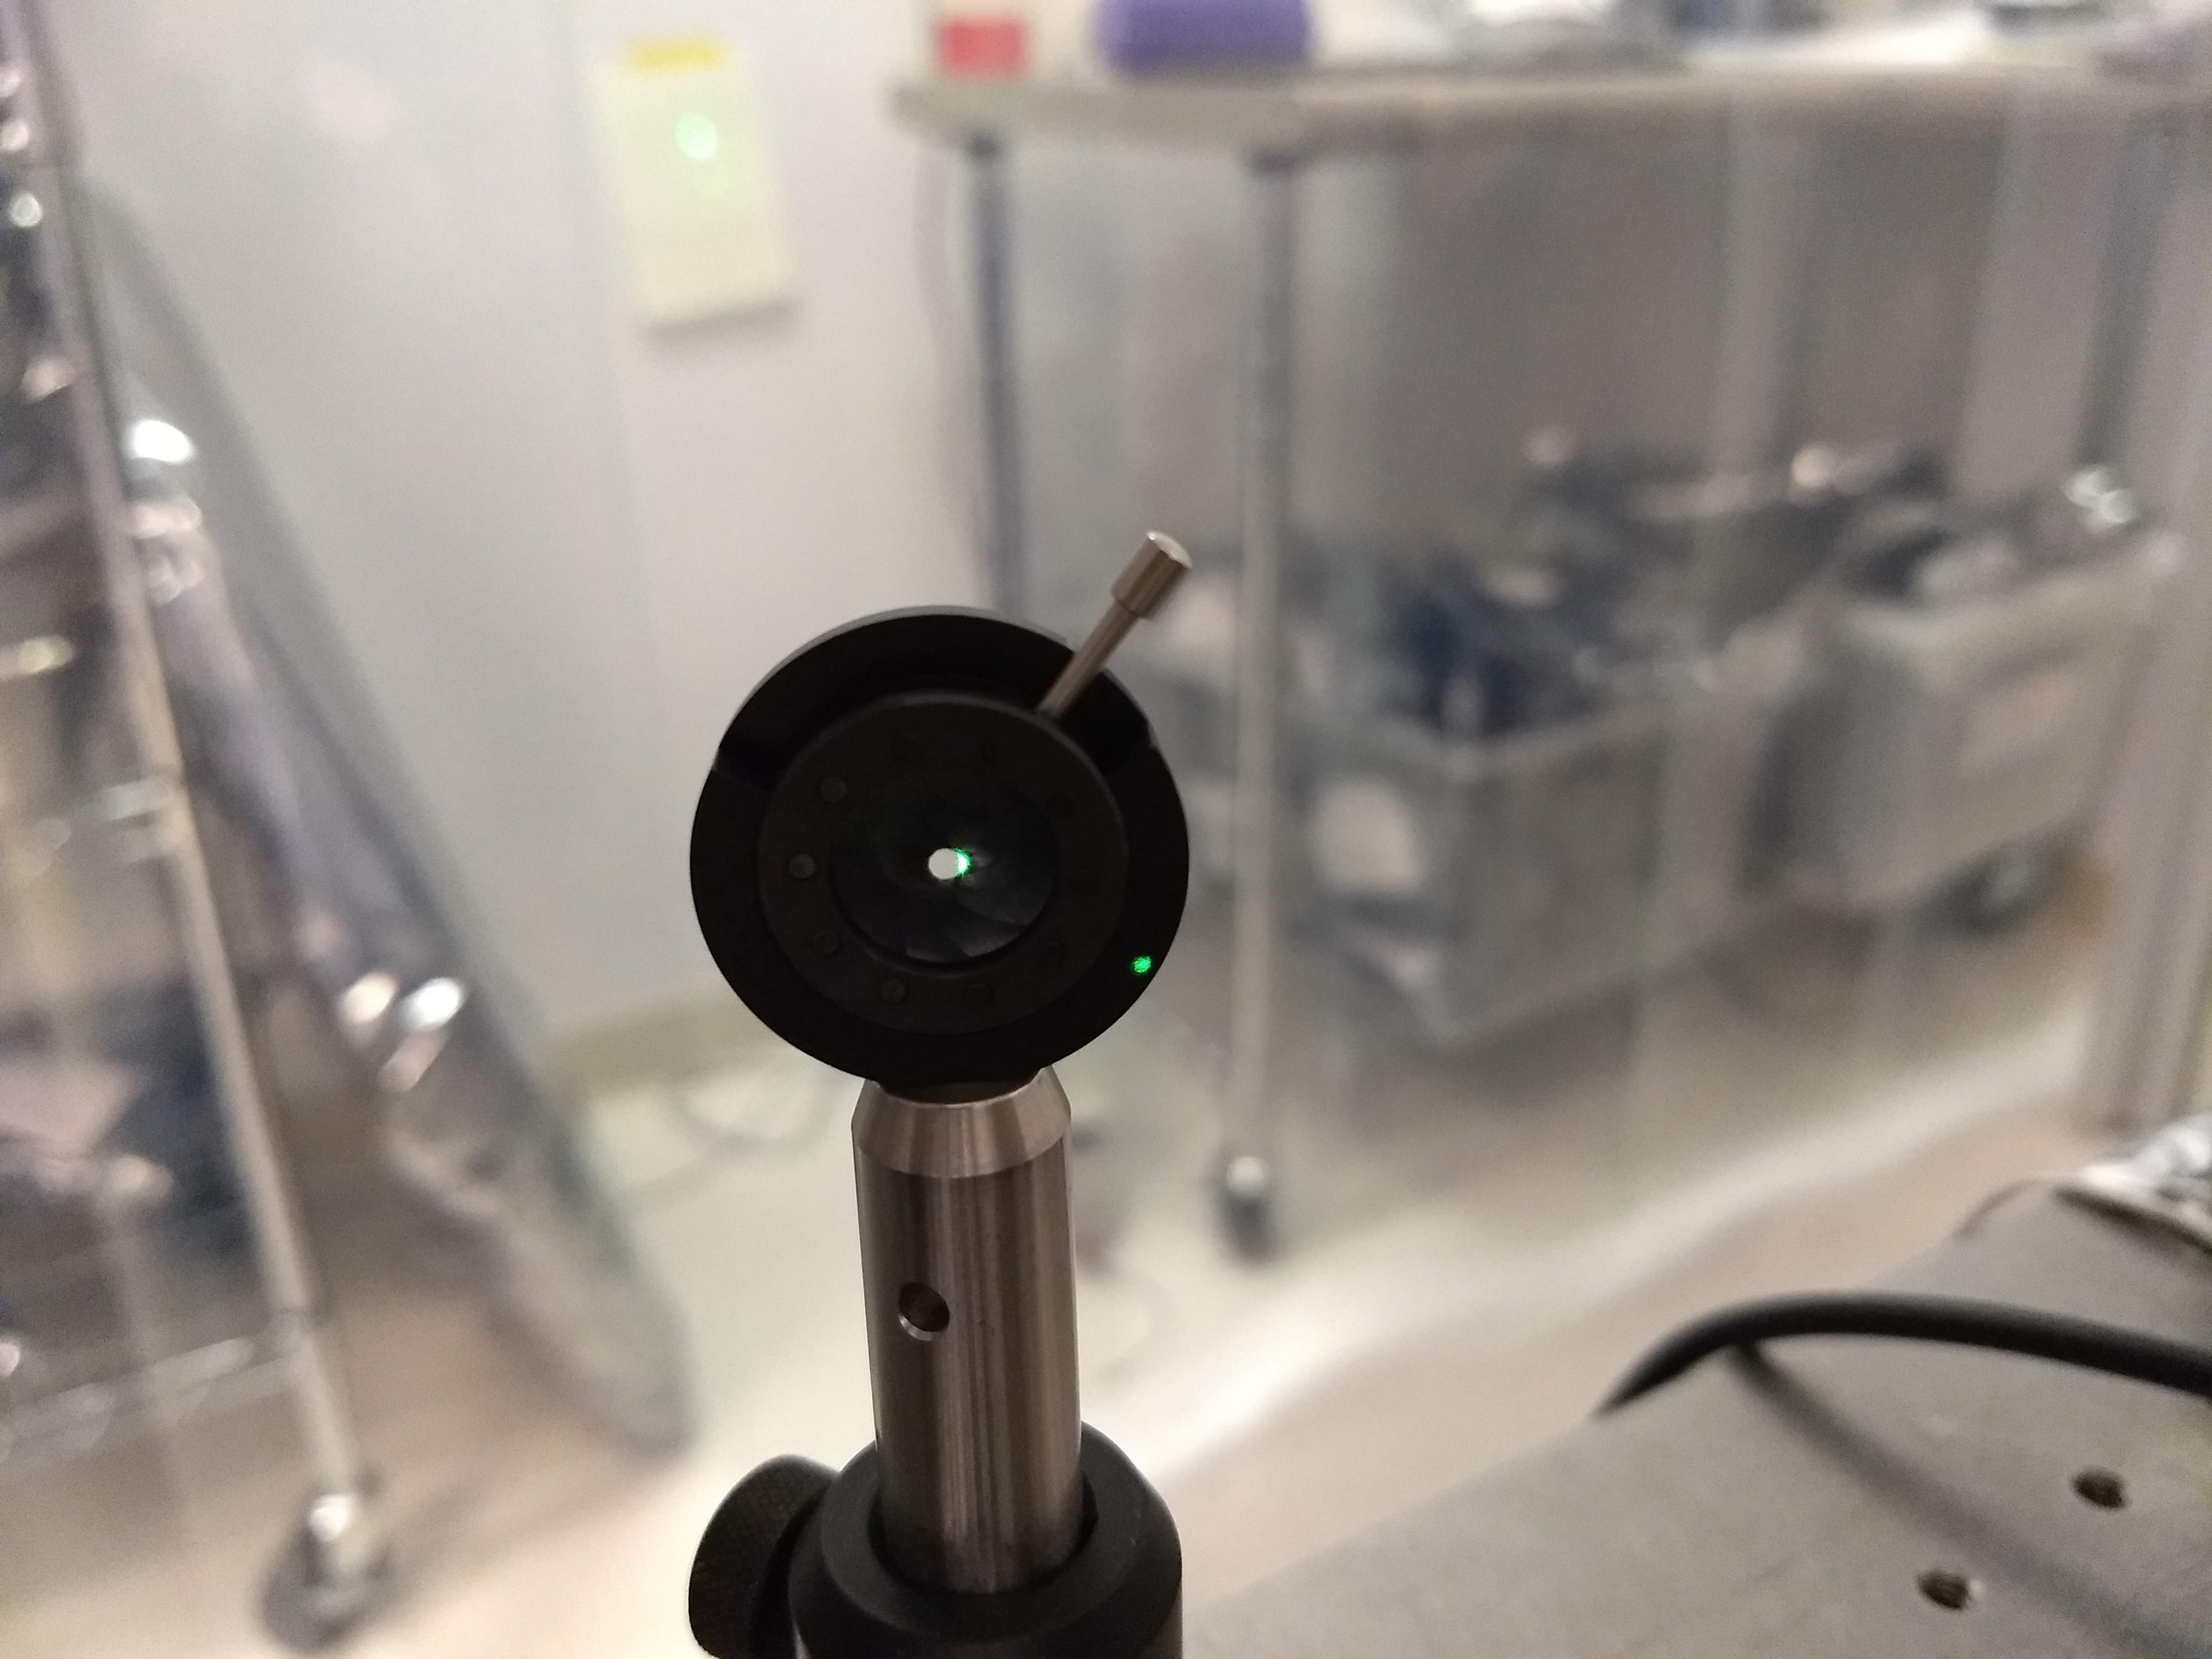
Found that in the far field the green and IR were slightly misaligned in yaw (first attachment is an iris near the edge of the table).
-
Decided not to touch A:M2 (Keita’s recommendation) since we’re worried about misaligning the path throguh SFI2.
Swapping out G:COL mount
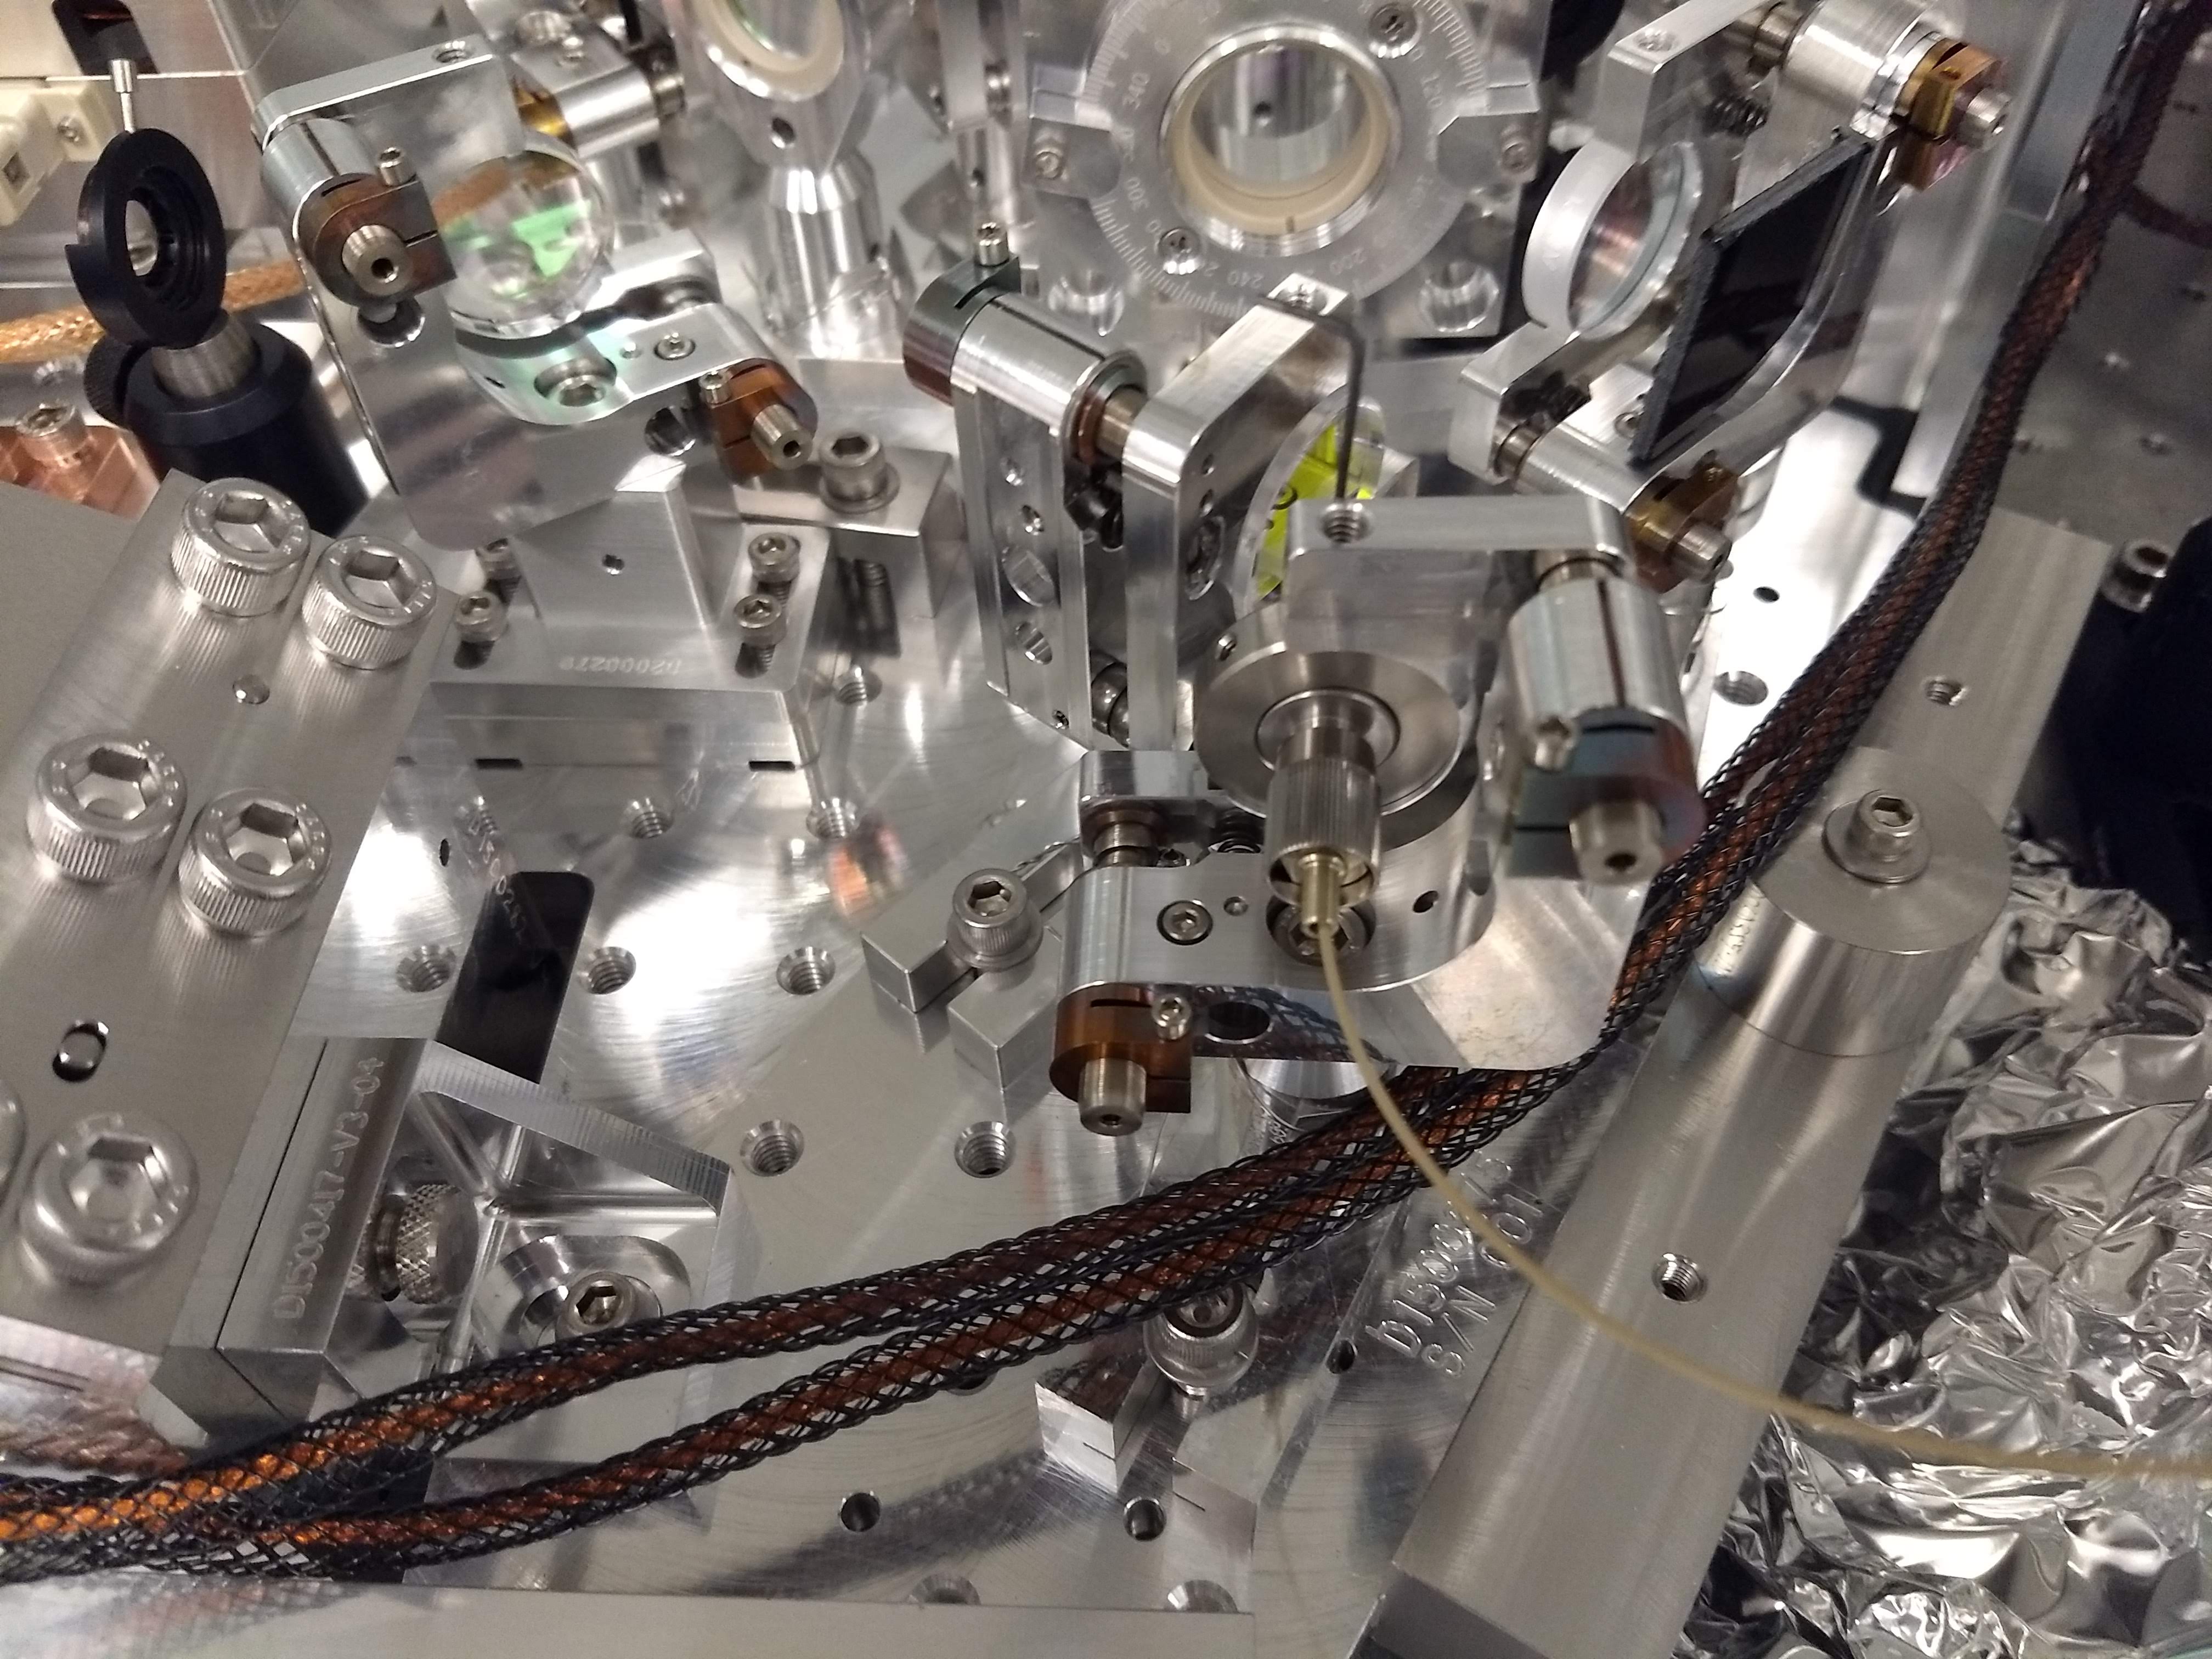
- We’ve been having problems with the G:COL mount - the adjuster screws are so tight it’s almost impossible to steer. Camilla switched the mount out for a new mount, and now it is adjustable with the usual knobs. The new mount is opposite-handedness (second attachment is of new mounting), but we don’t think this will be an issue.
Adjusting focus on G:COL
-
The G:COL is of the type where the front of the collimator rotates to adjust the focus of the beam coming out) to improve the quality of the beam coming into the OPO.
-
We iterated adjusting the focus of the collmator, fixing the alignment into the OPO cavity, and looking at the shape of the beam on reflection.
-
We made the mode mismatch slightly lower, and changed the beam shape, but it still had a clipped looking D shape with a little buddy (see third attachment).
-
We’re pretty confident that the collimator is the origin of the beam weirdness, so we might want to replace it? It’s unclear from ICS if we have spares
Looking at the green mode shape on transmission of the OPO
-
I was wondering if the G path is worth all this trouble, since the beam will be cleaned by the OPO, and it’s the mode shape in the cavity that actually determines the shape of our squeezed beam, so I checked the profile on transmission.
-
We moved the beam profiler over to the 532 transmission.
-
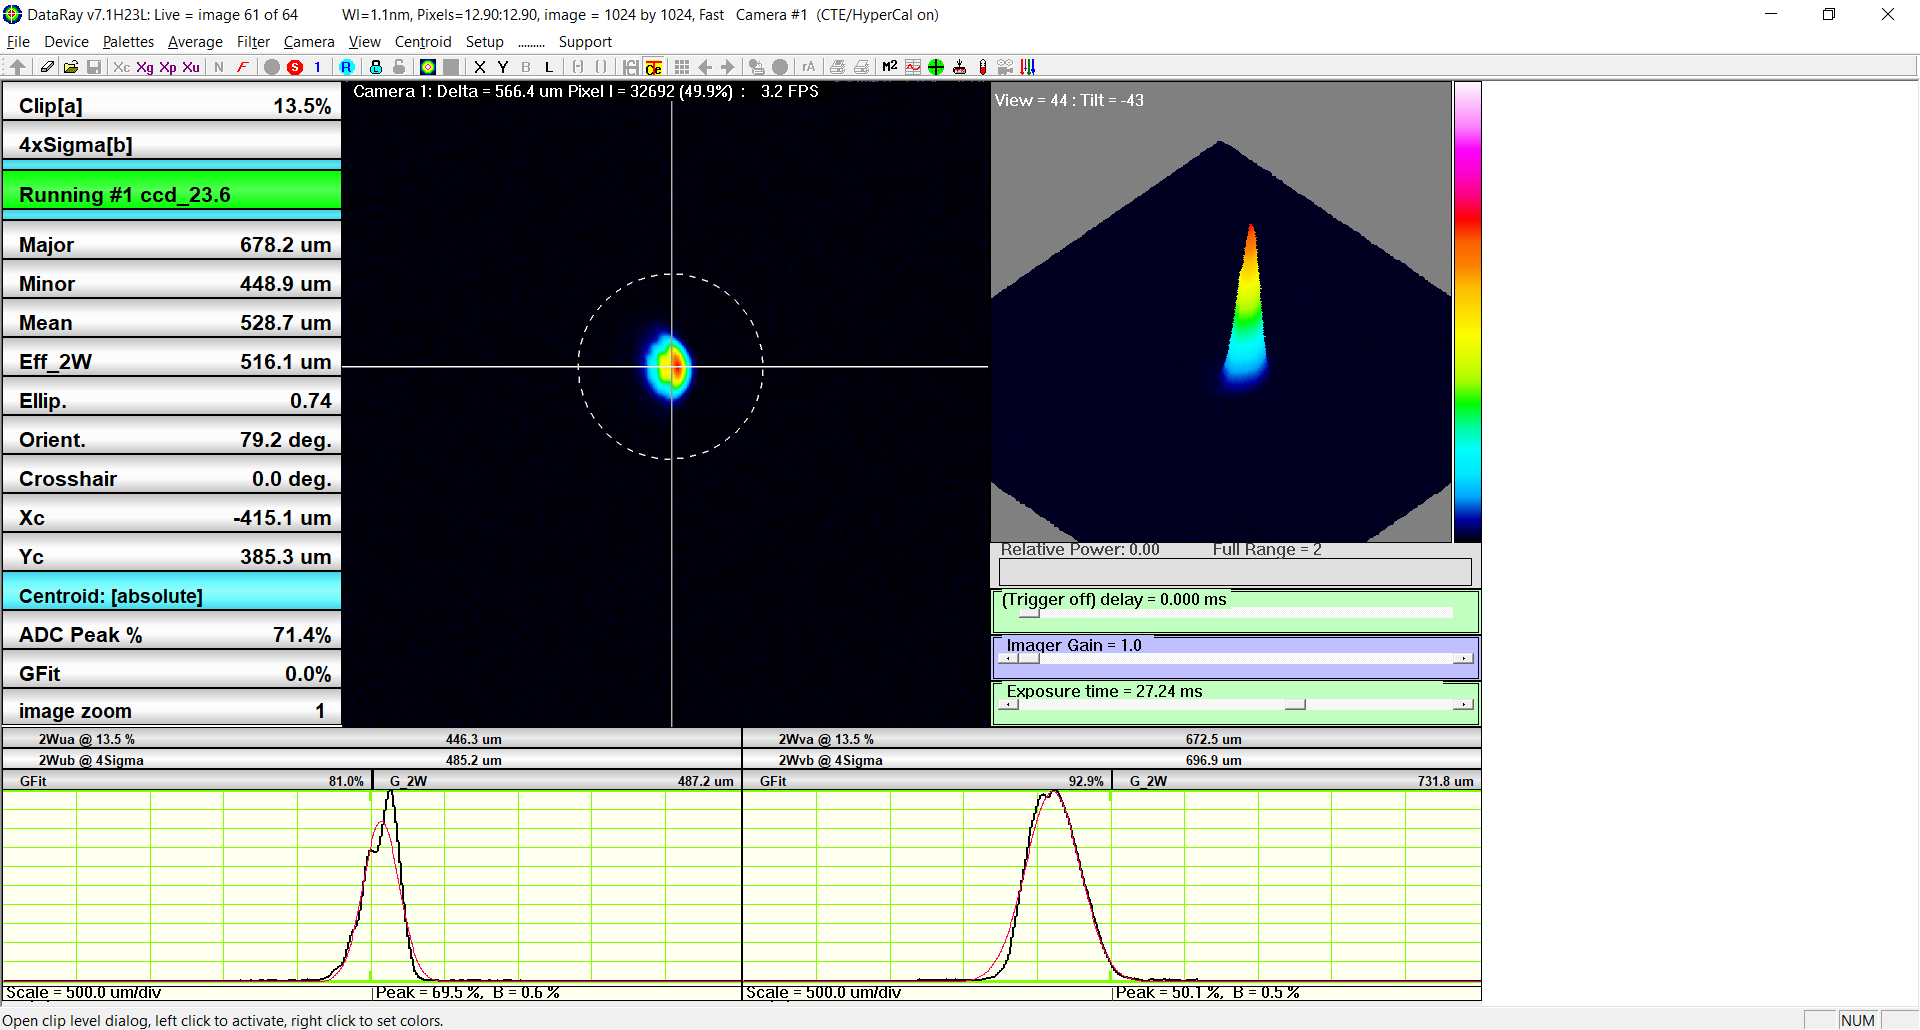
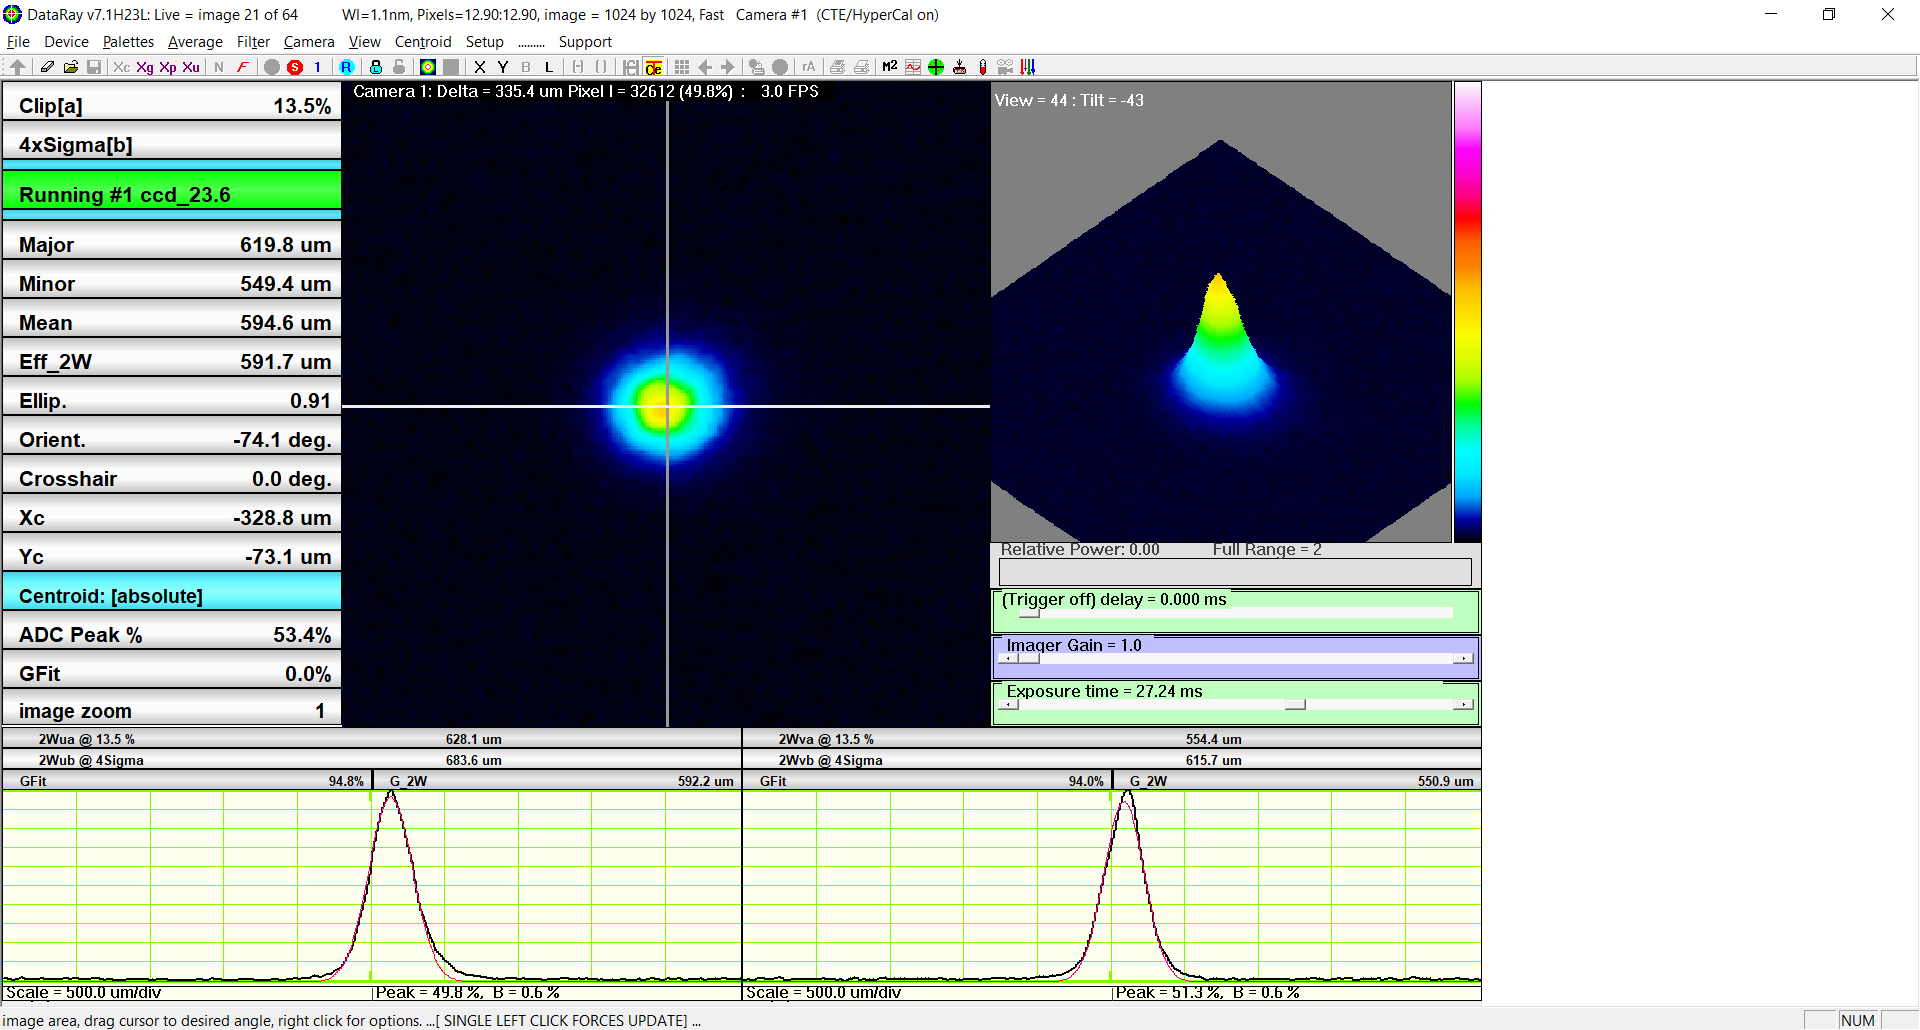
We manually adjusted the voltage to the PZT to keep the green on resonance for a few seconds and looked at the beam on the profiler. It was surprisingly not quite a perfect Gaussian, and had some ripples in the x direction (fourth attachment).
-
This beam shape was repeatable with different attenuations and positions of the beam on the sensor.
Beam shape after G:HWP1
- Previously we had measured the beam rejected by the G:POL1 and found the shape to be a little elliptical but not super ugly, while the beam after G:L2 has the suspicous "D" shape we've been seeing on reflection of the cavity.
- Today we measured between these two positions - putting the crane-mounted mirror just after G:HWP1.
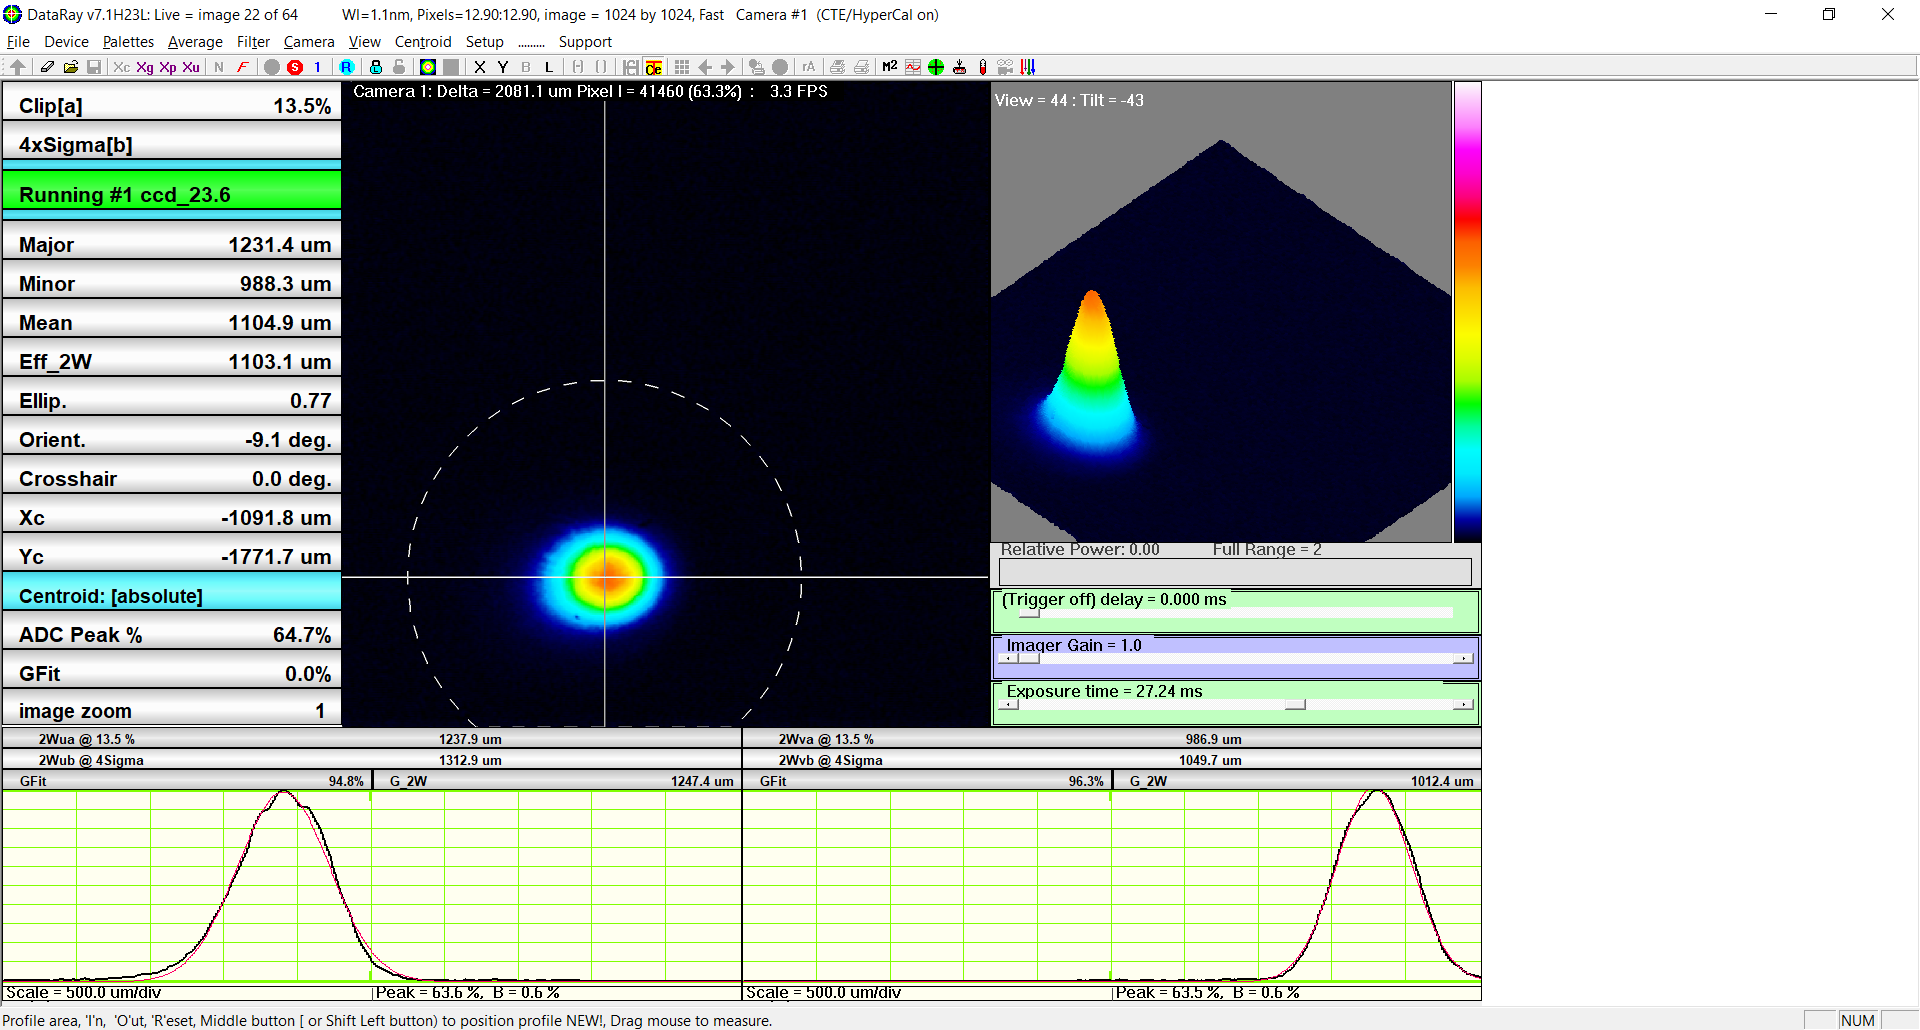
- In the near and far field this beam looked elliptical, but fine. See final two attachments.
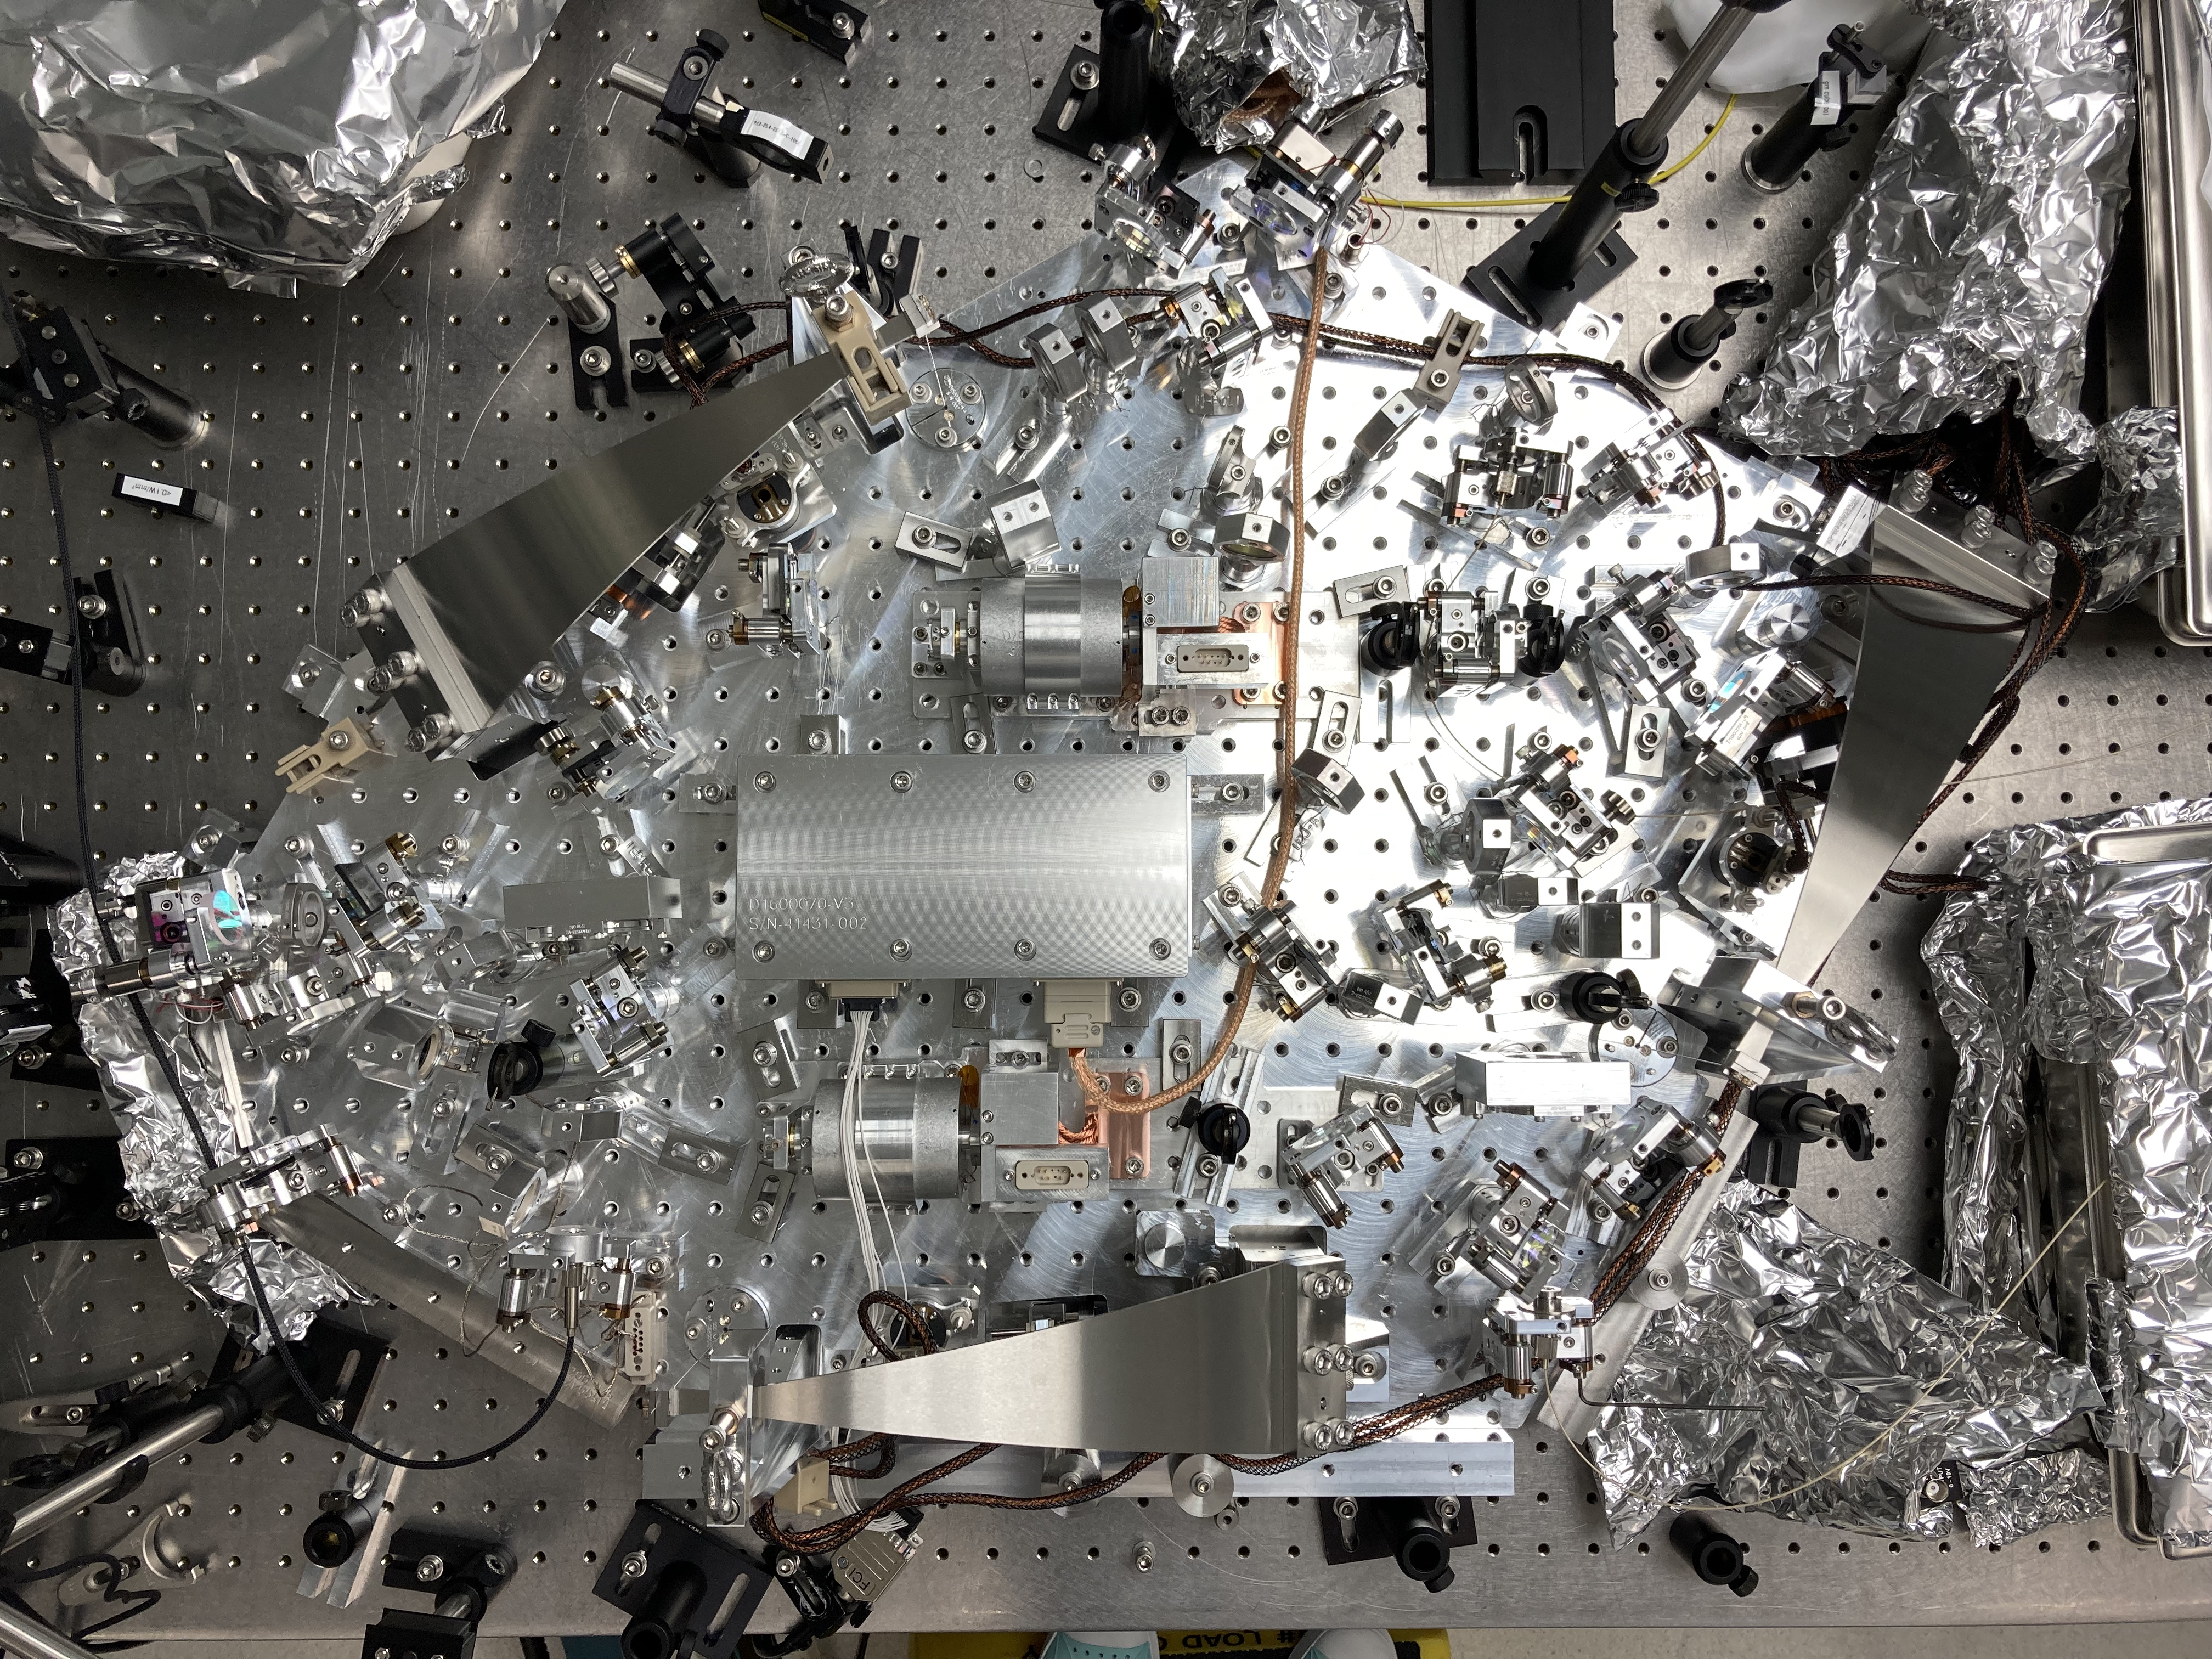
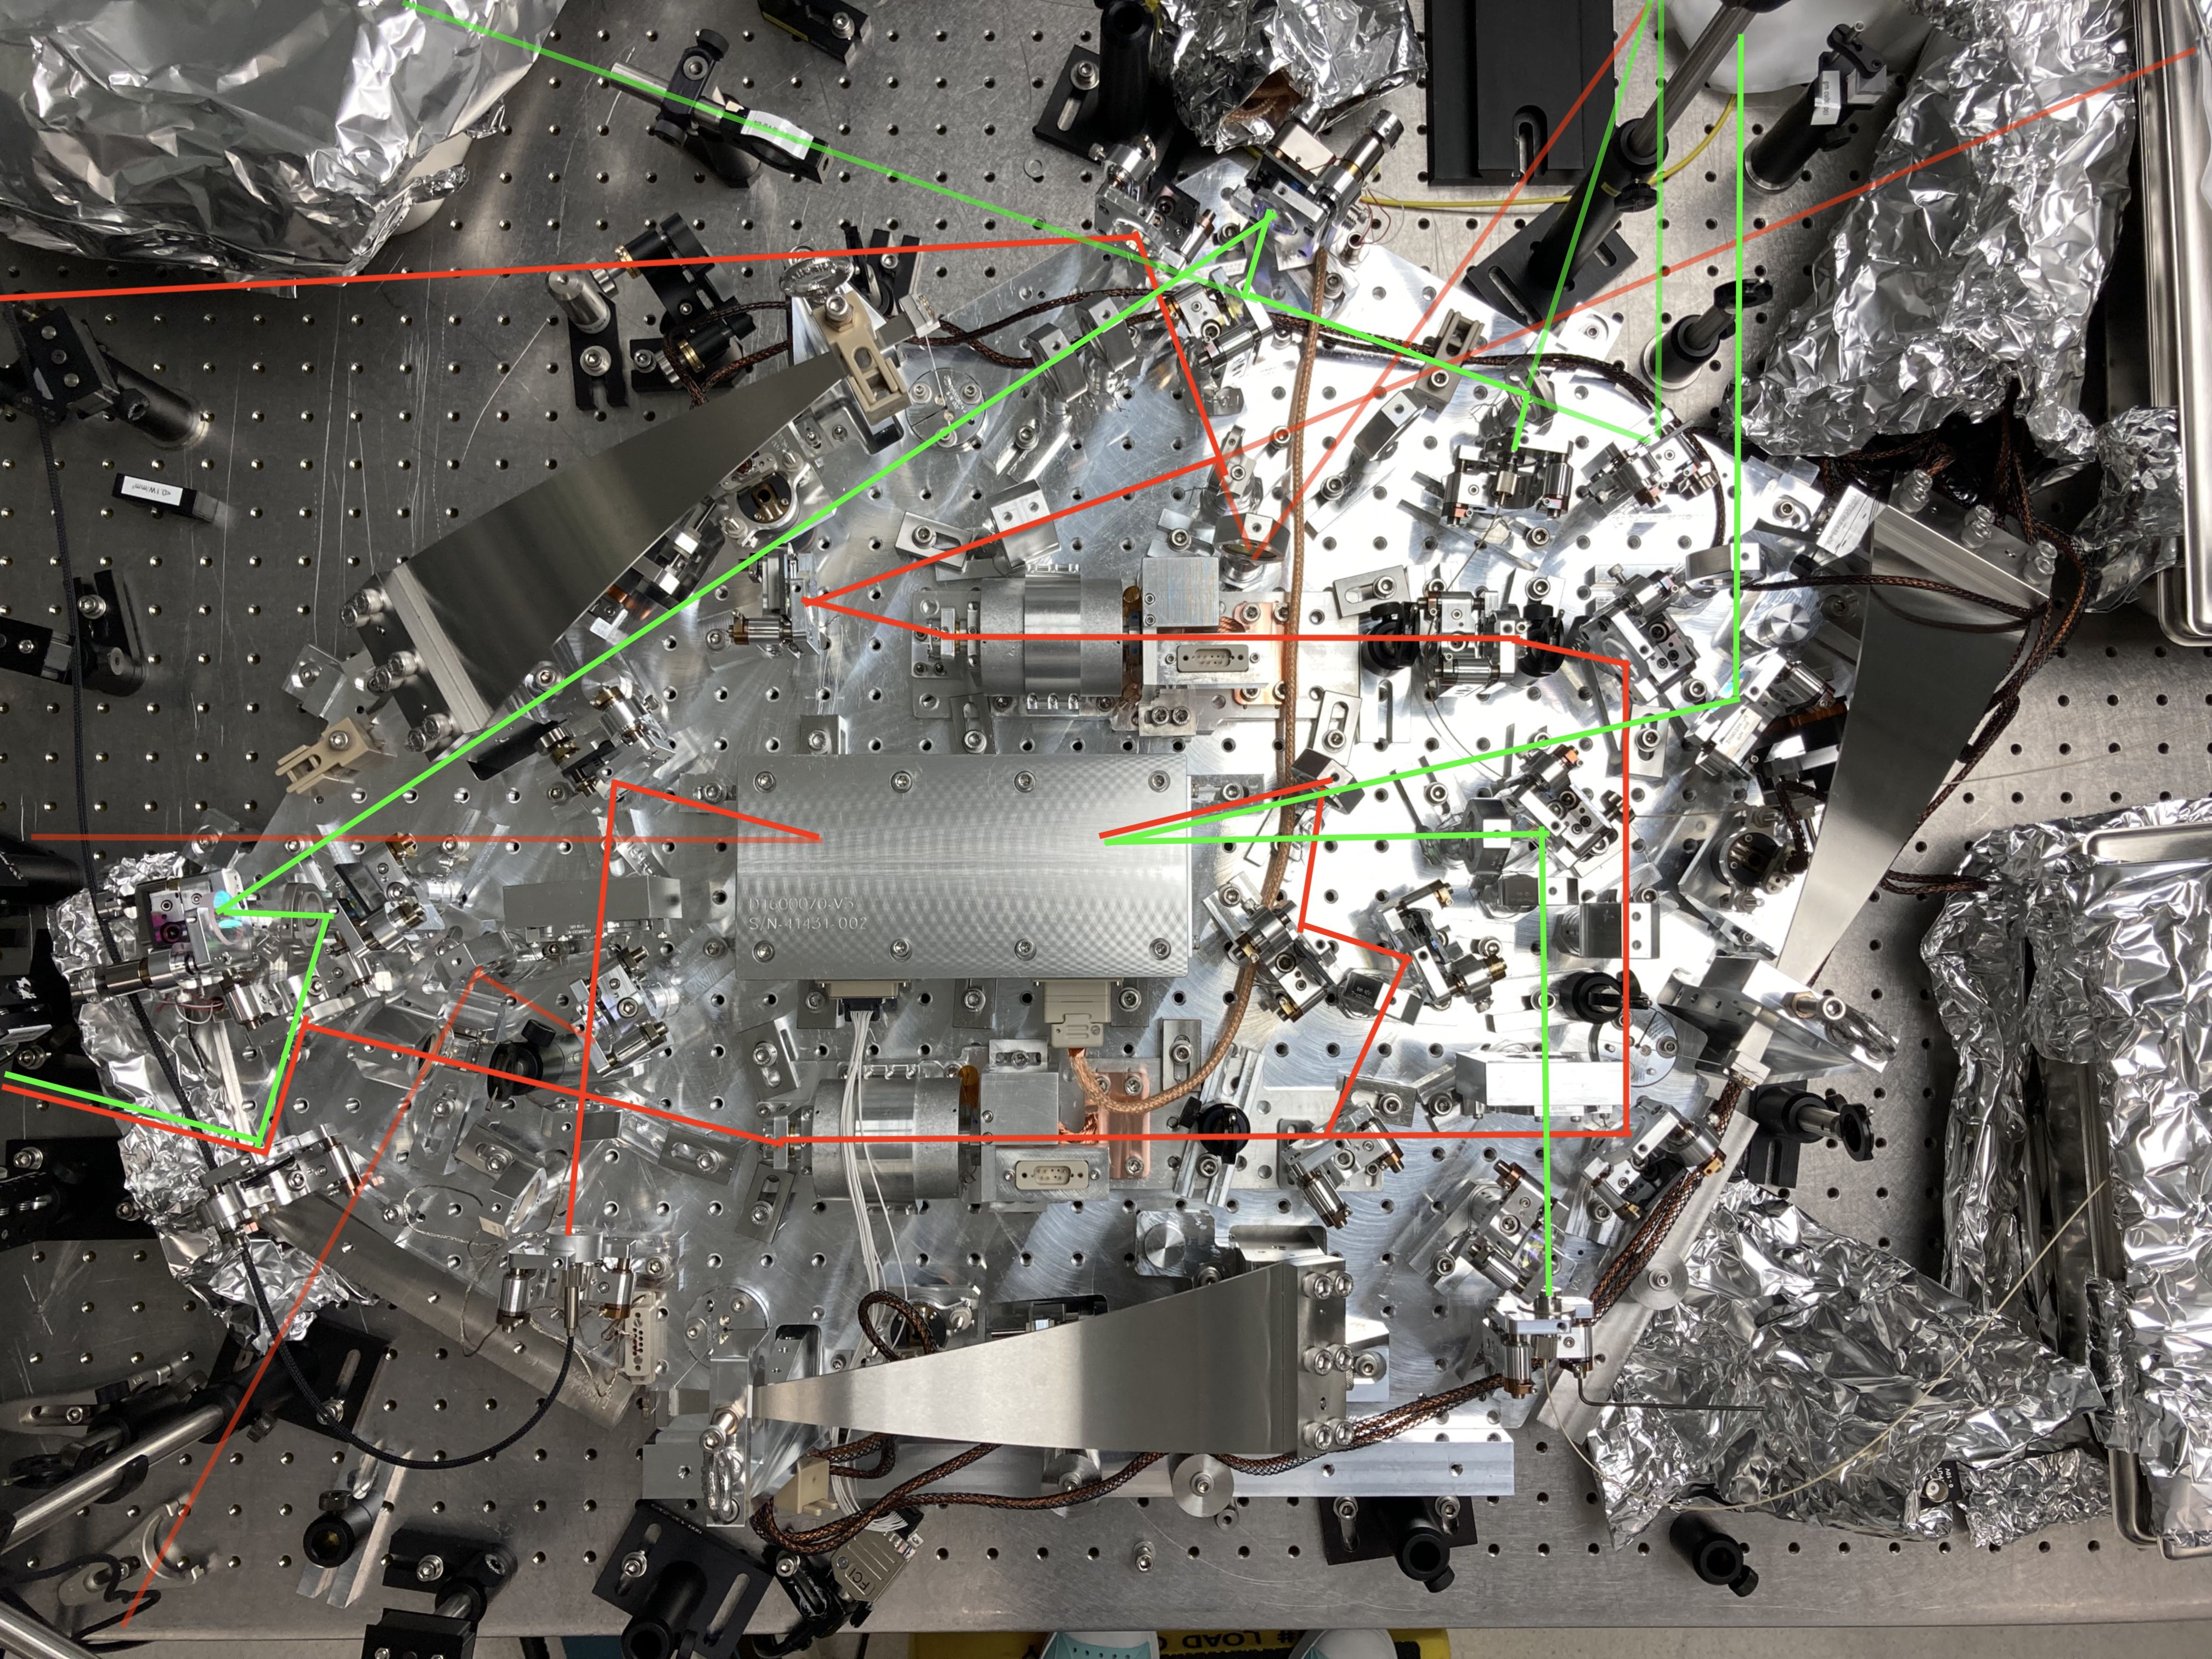
I have attached photos of the VIP including and not including the beam paths. Taken 22nd July.
SFI2 isolation is close to -36dB (Wed. Jul/28)
Not sure what was wrong with previous measurement (alog 59384)) but it's good now. I see no need for mechanical adjustment of the polarizer.
I remeasured the SFI2 isolation by injecting the IR light from IFO path back into SFI2. The setup, which is the same as before, is in the 1st attachment. Polarizing cube placed outside of the opo platform ensures that S-polarization is injected (don't take the direction of PBS in the cartoon literally, in reality the cube was rotated 90 degrees in roll so the rejected beam goes down, i.e. S-pol for the OPO platform was transmitted). Most of the power was blocked by the aperture stop on B:L1 as per design. I inserted the power meter to either location 1 or 2 (red letters 1 or 2 in a white circle on the cartoon) to measure the power going back to SFI1 and the input power.
The table below shows my raw measurement numbers in chronological order, and the isolation derived from them assuming that the input power didn't change during the measurement. In reality you'll only want to look at the last three or so data points in bold letters because I know that the laser power was drifting around very slowly probably due to that the room temperature was changing (it was hotter than usual and was still recovering from some glitch in the air handler (??) earlier).
Positive current means that pin1 of TEC was positive. (+0mA means that the current source was connected in pin1=positive polarity but the current was set to 0. OTOH, 0mA without sign means that the current source was physically disconnected. Distinction between +0, 0 and -0 doesn't matter anyway, this is jusf for record.)
Don't take the thermistor reading too seriously as I didn't wait forever until the crystal reached equilibrium, but I waited at least 1 minute. But anyway you can see that the isolation is good in general.
| Current [mA] | Thermistor 1 [kOhm] | Power at position 1 (i.e. power not rejected [uW]) | Power at position 1, beam blocked. | Input power [mW] | Isolation [dB] |
| 2.7nW | |||||
| 0 | 10.13 | 2.97+-0.01 | -35.5 | ||
| -20 | didn't measure | 2.97+-0.01 | -35.5 | ||
| -41 | 9.92 | 3.07+-0.01 | -35.4 | ||
| -60 | 9.75 | 3.18+-0.01 | -35.2 | ||
| 0 | 10.18 | 2.98+-0.01 | -35.5 | ||
| +0 | 10.28 | 2.93+-0.01 | -35.6 | ||
| +20 | 10.39 | 2.905+-0.005 | -35.6 | ||
| +40 | 10.55 | 2.88+-0.01 | -35.6 | ||
| +60 | 10.75 | 2.895+-0.005 | -35.6 | ||
| +80 | 10.93 | 2.92+-0.01 | -35.6 | ||
| 0 | 10.42 | 2.775+-0.005 | -35.8 | ||
| 0 | 10.43 | 2.735+-0.015 | -35.9 | ||
| 5.2nW | |||||
| 10.6mW-33uW |
Green pump reflection mode profile. (This was actually from last week but I'm putting it here.)
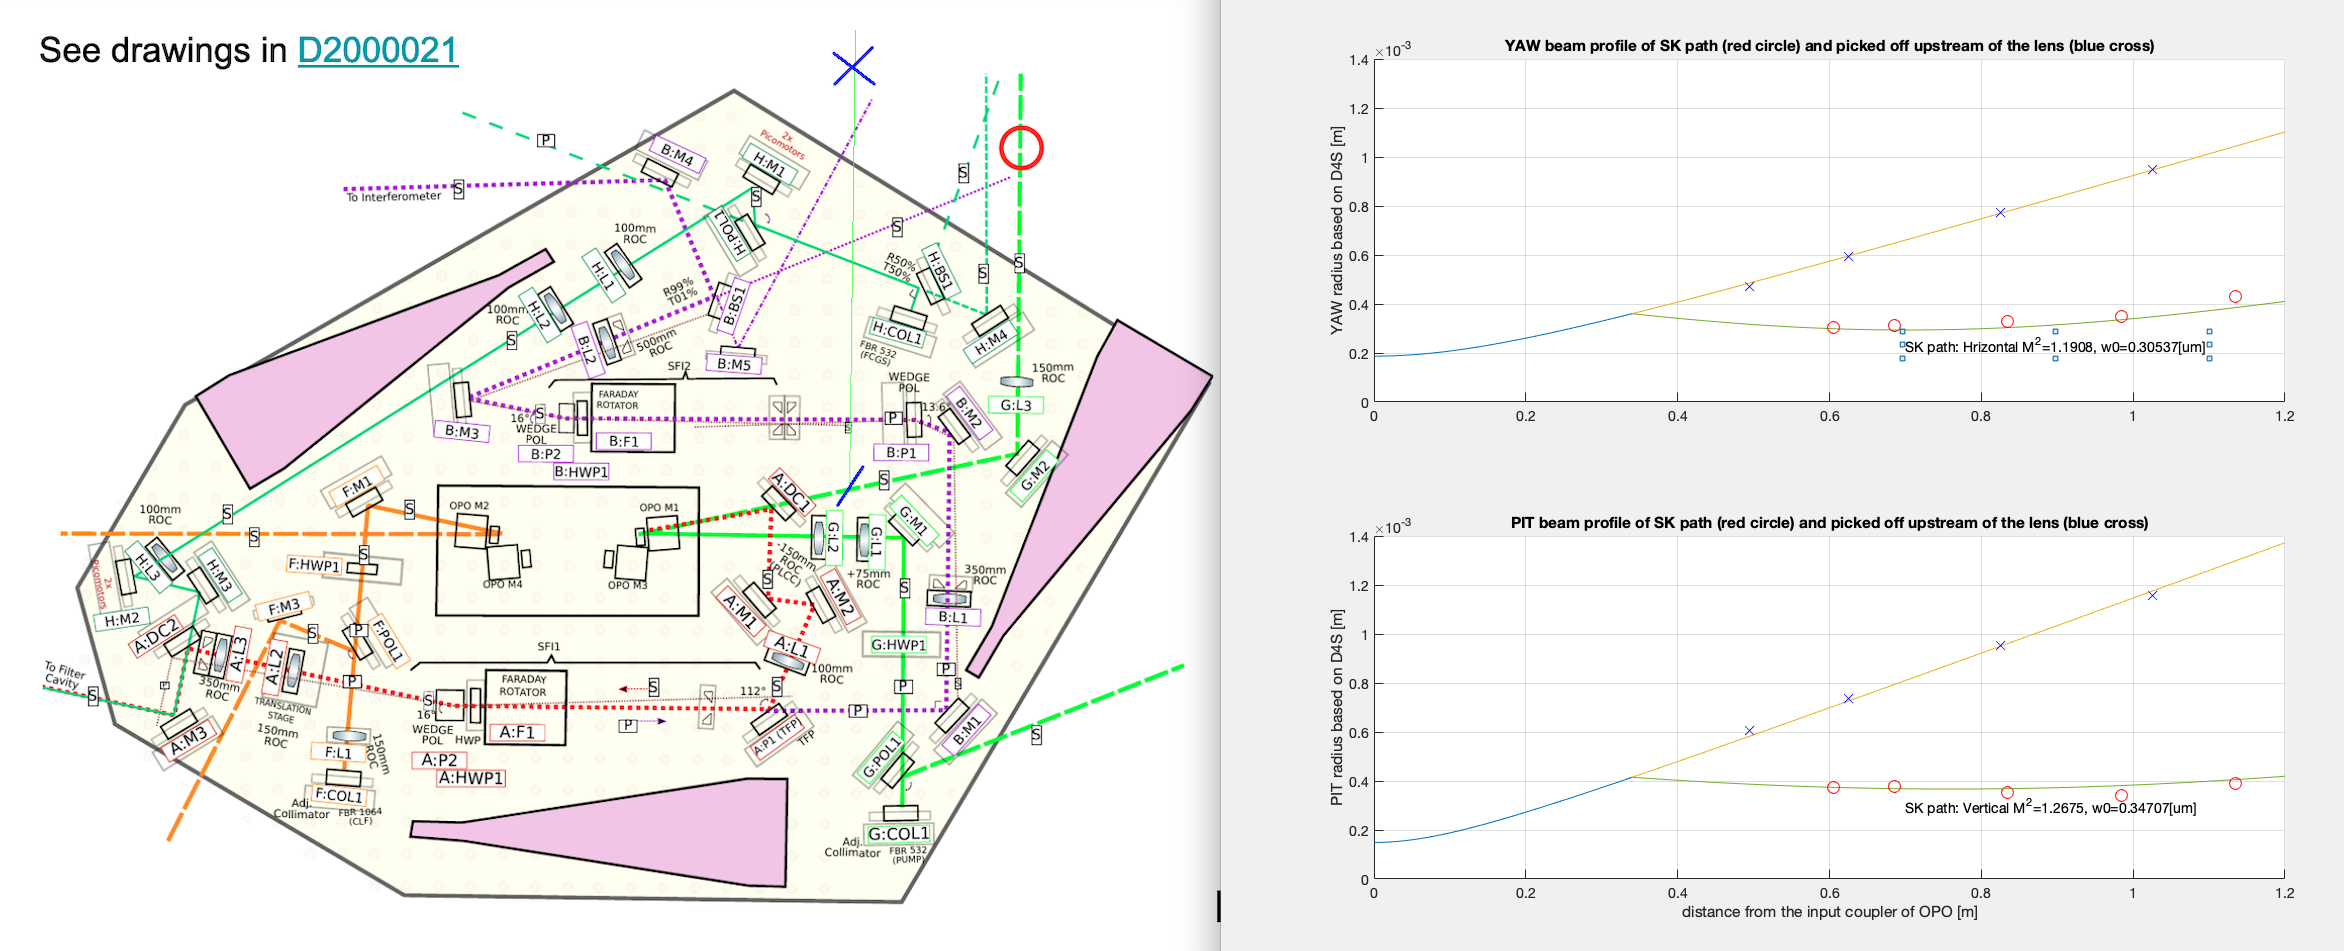
I measured the green pump reflection by OPO while it was not resonant by placing a Wincam on a rail at the position marked by the red circle on the attached cartoon. Measurement data points are also plotted as red circles. This is the beam for SK path.
I also placed a pick off mirror between G:M2 and dichroic using a crane-type gizmo and placed the Wincam rail at the position marked by the blue cross.
Smooth yellow-red line on the plot is the fit for the blue crosses, blue smooth lines are the Gaussian propagation toward the OPO, and greenish line is Gaussian propagation from upstream through a plano-canvex lens with ROC of 150mm.
Good news is that the mode downstream of the lens is consistent with upstream, i.e. the red circles are reasonably on top of the green line. Nothing looks crazy even though the mode looks ugly. As such, it still looks to me as if the problem is the mode profile of the pump itself, and therefore this is a problem of the loss.
(I don't like that M squared numbers for PIT (bottom plot) and YAW (top) are 1.27 and 1.19 respectively, and that if you look the PIT data (bottom plot) closely, you'll notice something that I've never observed in the past. As you go from x~0.6 to x~0.69 to x~0.84, D4S-based radius increases slightly and then decreases. I repeated the measurement with different averaging and this was consistently the case. Maybe a ghost beam coming into the sensor only at one location?)
(I also picked off the beam between the OPO and dichroic, the data points of which are included in the attached script, but it's uninteresting.)


Yesterday we recorded some VOPO cavity scans, so we can estimate the cavity finesse and measure the higher order mode content.
First attachment shows the pump scan. Here we're injecting through the G path collimator, and measuring the cavity transmission through OPO M2. The top time series is one FSR. The time series is a second dataset zoomed in (on the oscilloscope) on the first TEM00 resonance. From this we estimate the 532nm finesse to be 175 (? this seems pretty high?). To get this number I take the ratio of the time for 1 FSR to the time for one TEM00 FWHM. In retrospect I should have also taken a zoomed in time series around the second resonance - I tried to zoom in on the data in the top plot but the resolution is too low.
From this same scan we can measure the power in higher order modes (second attachment highlights the HOMs and shows the scan on a y-log-scale). The percentage of power in HOMs is tabulated below:
| Voltage [mV] | V minus background [mV] | % | |
| 0th order | 1450 | 1427 | 100 |
| 1st order | 96 | 73 | 5.11562719 |
| 2nd order | 81.9 | 58.9 | 4.127540294 |
| 3rd order | 53 | 30 | 2.102312544 |
| background | 23 |
We also looked at the scan zoomed in on the higher order modes (third attachment) and a scan with the photodiode on reflection (off-platform after G:L3, fourth attachment). While we we measuring the reflection we noticed the off-resonance power drifting, you can sort of see this in the plot. We turned the lights off and it was still happening so perhaps it was the laser power. Also note we adjusted the PD gain from 40dB to 30dB when moving the PD to reflection as there was way more power there. I haven't fit the refl dips or anything.
1064 scan
We also took a scan of from the CLF path (injecting through the F col, photodiode on transmission of OPO M1), this is shown in the final attachment. The estimated finesse at 1064 to be 79+/- 16: I measure the finesse to be 67 if I use the first resonance FWHM, or 91 if I use the second resonance FWHM. These are so different, due to the PZT nonlinearity I suspect.
The 1064nm higher order mode content is tabulated below:
|
Voltage [V] |
V minus background [V] |
% | |
| 0th order | 3.864 | 3.824 | 100 |
| 1st order | 0.2447 | 0.2047 | 5.353033473 |
| 2nd order | 0.95 | 0.91 | 23.79707113 |
| 3rd order | 0.15 | 0.11 | 2.876569038 |
| background | 0.04 |
Keita mentioned that he could get the 1st order mode way down by doing some fine alignment of this path. I didn't touch it up before this measurement.
I used a rough spreadsheet here to do some calculations.
Note that the PZT voltage on these plots is before the HV amplifier, which has a gain of 15.
When we did the green pump OPO scan (see Georgia's entry above) the green power measured in front of OPO was 0.77-0.80mW.
I did some quick calculations for PZT range in MHz/V, based on the cavity scans above.
From Table 1 of the VOPO FDR the cavity FSR is 851.934MHz @ 532nm, and 853.452MHz @ 1064nm.
For the scans we took last week 1 green FSR was 1.05V (to M2) , and 1 red FSR was 1.6V. This voltage is amplifed by a factor of 15, So the range is 54.1MHz/V for 532, and 35.5 MHz/V for 1064.
These should be different by a factor of 2, but they are not, I assume due to the PZT nonlinearity. The 1064nm scan goes to higher voltage.
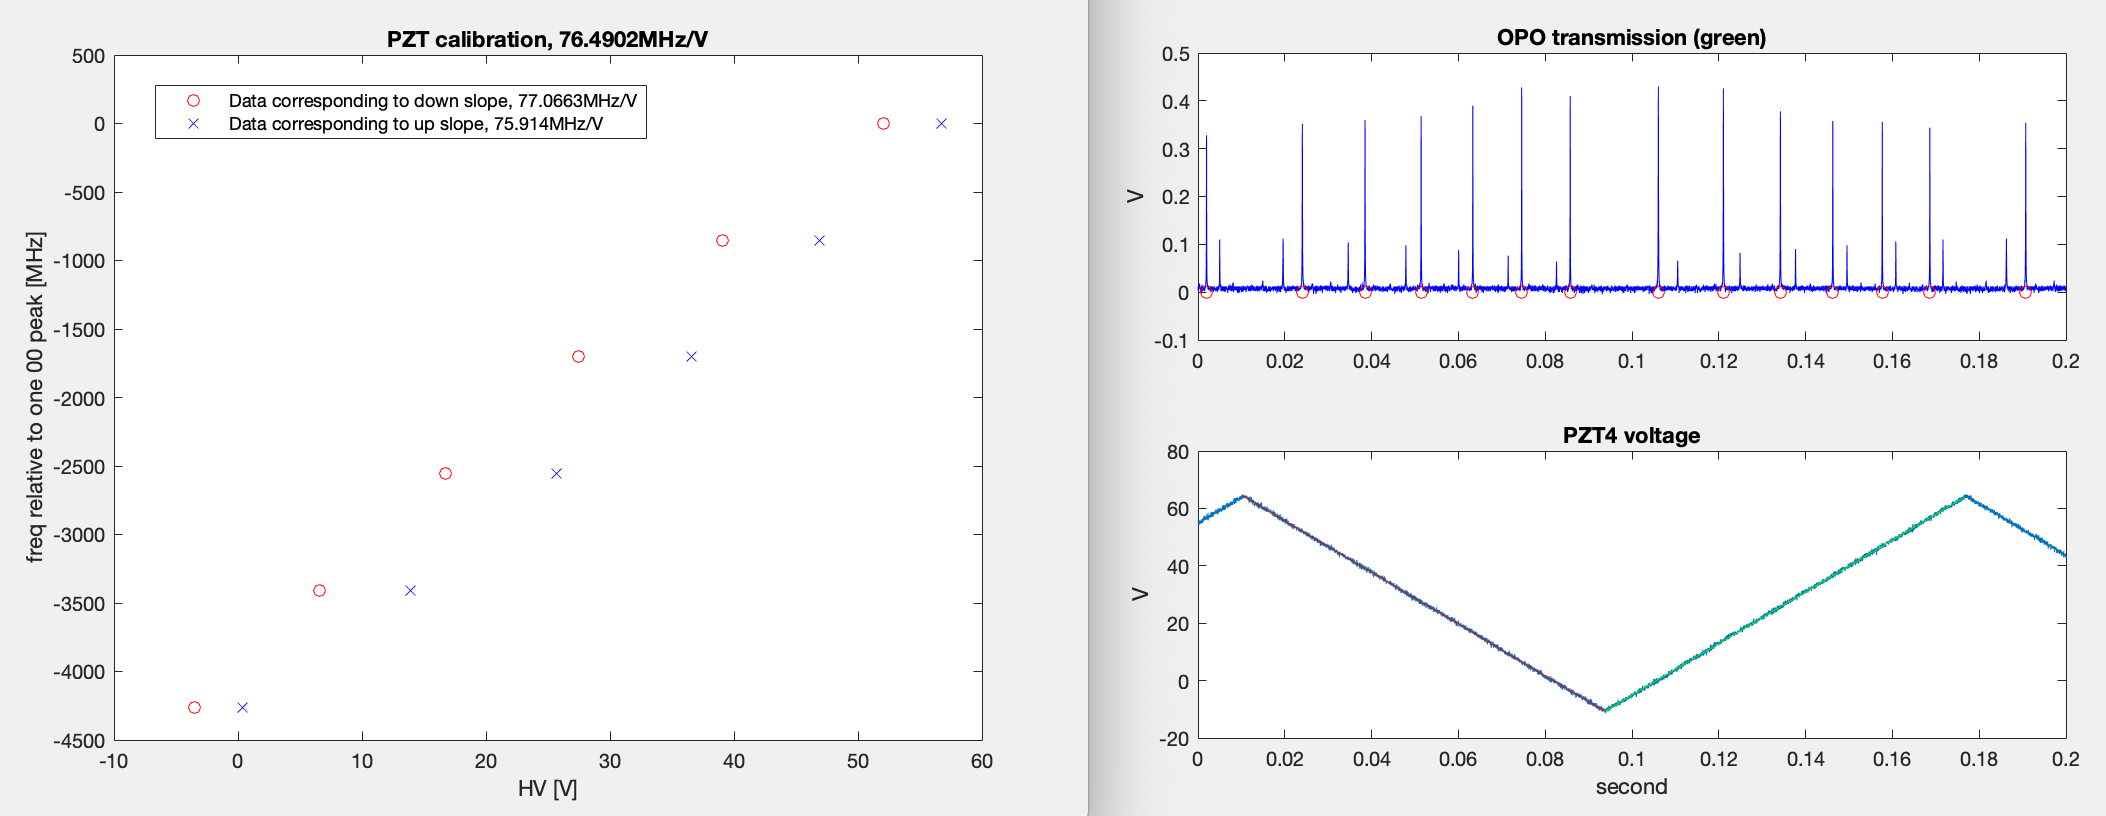
I remembered that OPO M4 PZT calibration was never measured, so here it is.
I applied 5V p-p (0-5V) triangular wave to the external input of the Thorlabs PZT amplifier, which has a gain of 15, and scanned M4 PZT to look at the green transmission (attached right, bottom is supposed to be the voltage across the PZT). This produced more than 5 FSR travel both up and down.
Using FSR=851.934 MHz for green (T1700104) I got 76.5MHz/V on average (attached left).
(I first wanted to copy LLO script (LLO 55578), only to find that my conda2 installation was totally broken on my laptop. Sadly I replicated what LLO did, but in matlab.)

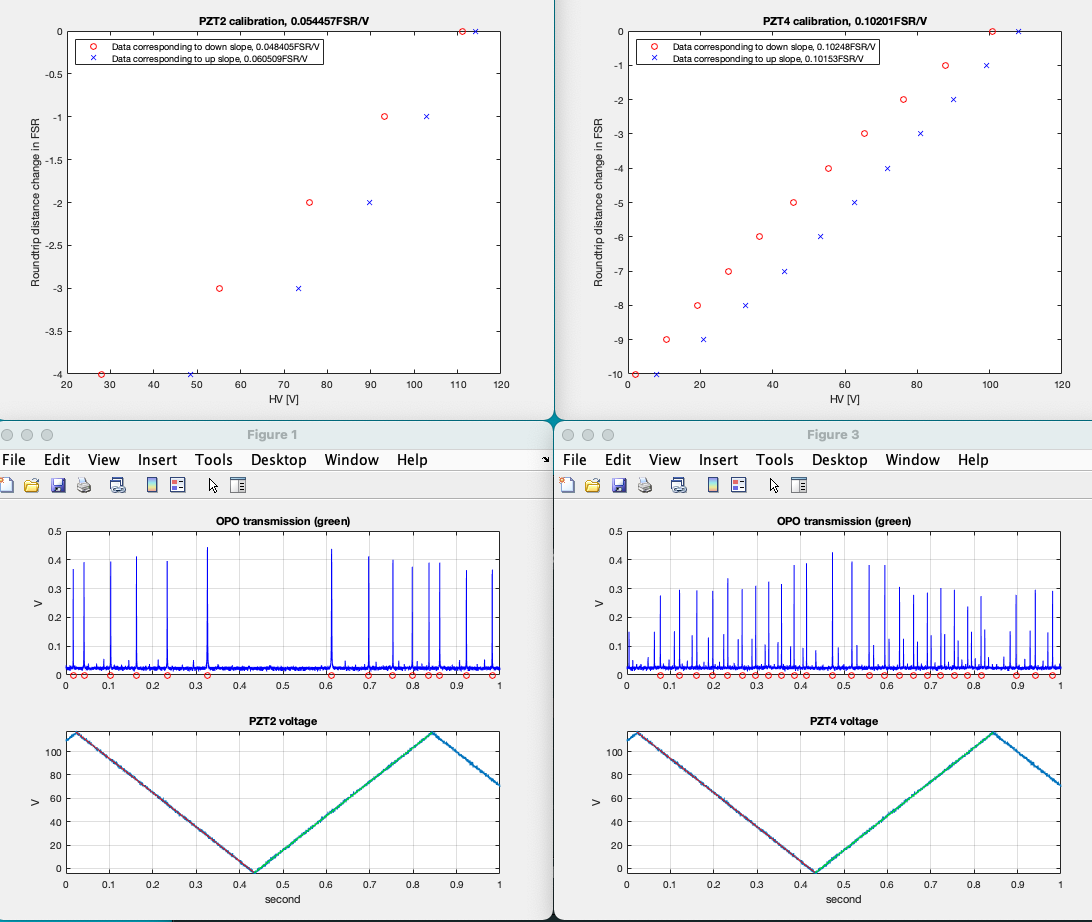
By request I did wider voltage scan of PZT2 (and PZT4 just because I could).
Green pump was injected to OPO while the OPO length was scanned using either PZT2 or PZT4 and the transmission power was monitored using an oscilloscope.
I set the function generator to 1.2Hz triangular wave of 8Vpp, the lowest voltage point at 0V, to feed the external input of the PZT driver. Since the gain of the high voltage amplifer is 15, this resulted in 0 to 120V. HV amplifier bias was set to zero.
I first connected the HV amp to PZT2 after discharging PZT4 and recorded the transmission as well as the function generator voltage (left two figures). I was surprised that it looked completely different from what I saw in the alog above.
Then I connected the HV amp to PZT4, discharged PZT2 and recorded the transmission (right two figures, I forgot to record the function generator voltage but I haven't changed the function generator setting nor the oscilloscope setting so I used the PZT2 scan voltage data for this). It looked consistent with the alog above, which was confirned when I ran the script to calculate the calibration.
| (All measured using 532nm light) | calibration [FSR/V] | calibration (Round-trip nm/V) |
| PZT2 | 0.0545 | 29.0 |
| PZT4 (this measurement) | 0.102 | 54.3 |
| PZT4 (alog above this one) | 0.0898 | 47.8 |
- PZT2 is a factor of 2 less sensitive than PZT4 though it shouldn't be.
- PZT4 seems to tilt more than PZT2 per voltage. I can clearly see 01 mode grow as the voltage increases for PZT4, not so for PZT2.
- Difference between today and the alog above is that today the waveform was 120Vpp 1.2Hz (on the PZT) while it was 75Vpp and 6Hz(?) before.
In the above alog I wrote PZT2 and PZT4 to mean the PZT on M2 and M4, respectively.