Vibration coupling has increased since early in the O3-O4 break, both input jitter coupling and scattering noise. Jitter coupling at the PSL increased by a factor of about 5 between 2021/05/12 (just after TM replacement), when IMC-PWR-IN indicates we were running at 46 W, and 2023/03/17 when we were running at 60 W, just before the increase to 75W (https://alog.ligo-wa.caltech.edu/aLOG/index.php?callRep=68036 ).
Scattering noise from the cryobaffle at EX increased dramatically between 2020/09/14 when we were running at 38W, and during PEM injections this May when we were at 75W (https://alog.ligo-wa.caltech.edu/aLOG/index.php?callRep=69578 ). Scattering noise also increased at the LLO EX cryobaffle (https://alog.ligo-la.caltech.edu/aLOG/index.php?callRep=65641 ).
We have speculated that this increase in coupling is associated with the power increases and might be a general tendency. It might be caused by increased thermal distortion of test mass surfaces around coating defects, resulting in a greater fraction of light scattered and higher vibration coupling through retro-reflected scattered light. Greater thermal distortions associated with defects might also make the arms less symmetrical, reducing common mode rejection of input noise and increasing vibration coupling at the PSL. An alternative hypothesis is that we increased clipping or vignietting when power increased.
The drop in power this week provides an opportunity to test the correlation between power and vibration coupling, and to test it with evaluations right before and after a power change, rather than the years intervening between the measurements referenced above.
Jitter coupling dropped by a factor of roughly two with the reduction in power from 75W to 60W
Figure 1 (3 pages) shows a comparison of the predicted contribution of background vibration to DARM made during PEM injections in May, when we were running at 75 W, versus 60W from this week. While the difference varies across the spectra, I would say the average reduction in jitter coupling is about a factor of two.
The coupling at 60W is simiar to the coupling at 60W measured in March, before we went to 75W,
The amplitude of scattering peaks from EX cryo-baffle decreased by a factor of 3 with the reduction from 75W to 60W
Figure 2 shows that, for similar velocities of the beam tube supporting the cryo-baffle, the amplitude of scattering peaks at harmonics of 4Hz dropped by a facor of about 3 with the decrease in power.
Coupling of the EX cryo-baffle did not strongly limit us at 75 W, though it was close; at 60 W an increase in motion by about a factor of 2.5 causes peaks to show in DARM
An important question for the eventual return to 75W is whether we were limited by cryobaffle scattering in the 20-40 Hz region at 75W or whether some other noise dominated. Figure 3 (two pages) shows, on page one, that, at 75W, an increase in motion of about 1.5 was needed for the peaks to show clearly in DARM. On the second page, a 1000-average spectrum at 75 W does not clearly show peaks at harmonics of 4Hz, supporting the argument that some other noise source dominated in this band.
Figure 4 shows that, at the new 60 W setting, an increase in motion by a factor of 2.5 is now needed for peaks to show in DARM. Thus the 4Hz peaks may show during high winds, off-road traffic within a couple of km, and other activities that increase ground motion at 4 Hz by at least 2.5.
Is there a visible difference in the pattern of scattered light at different powers?
Figure 5 shows photographs taken in 2019 (38W) and 2023 (75W) of ETMX during high-sensitivity operation. I don’t see any obvious changes in the light pattern but there is perhaps relatively more light lighting up the cage at 75W, consistent with an increased fraction of light scattered out of the beam.

Peter, Wen
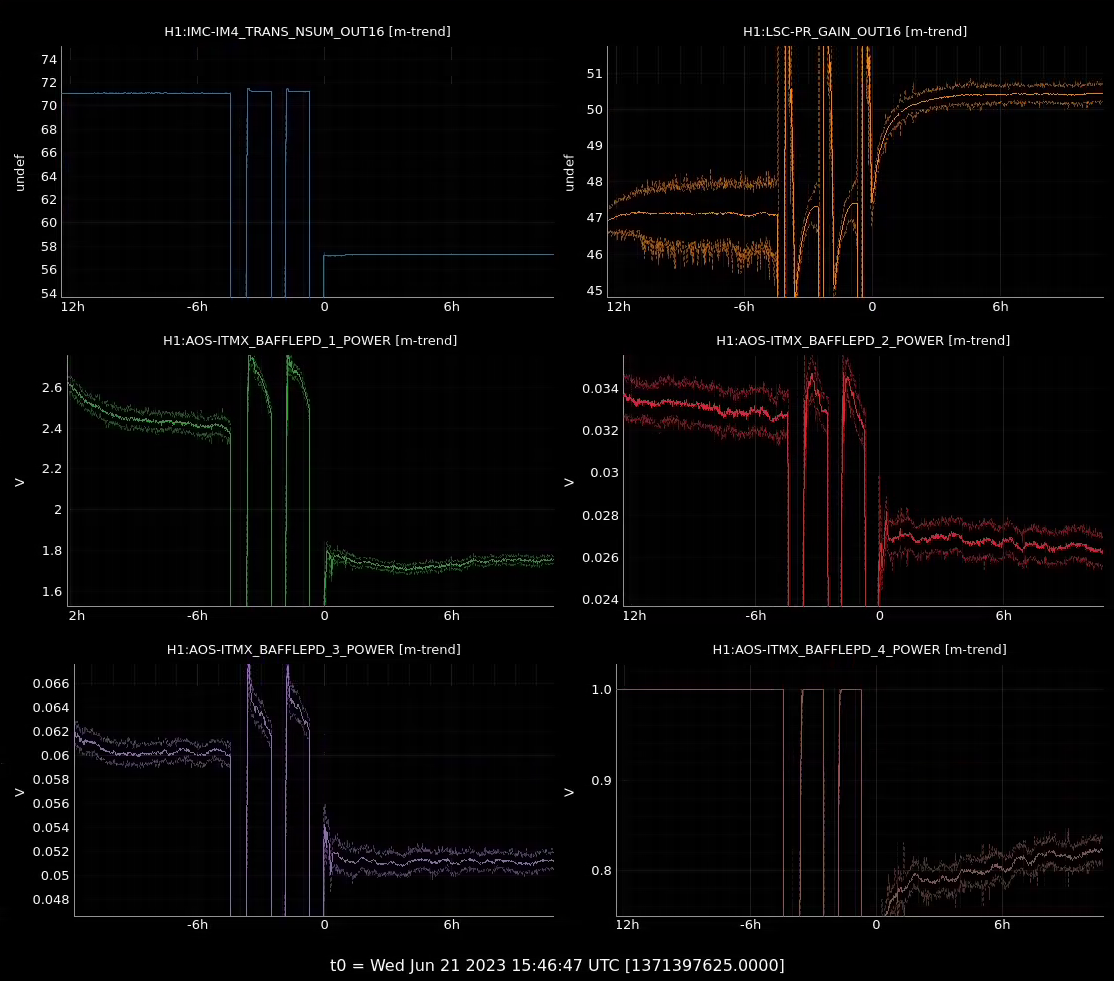
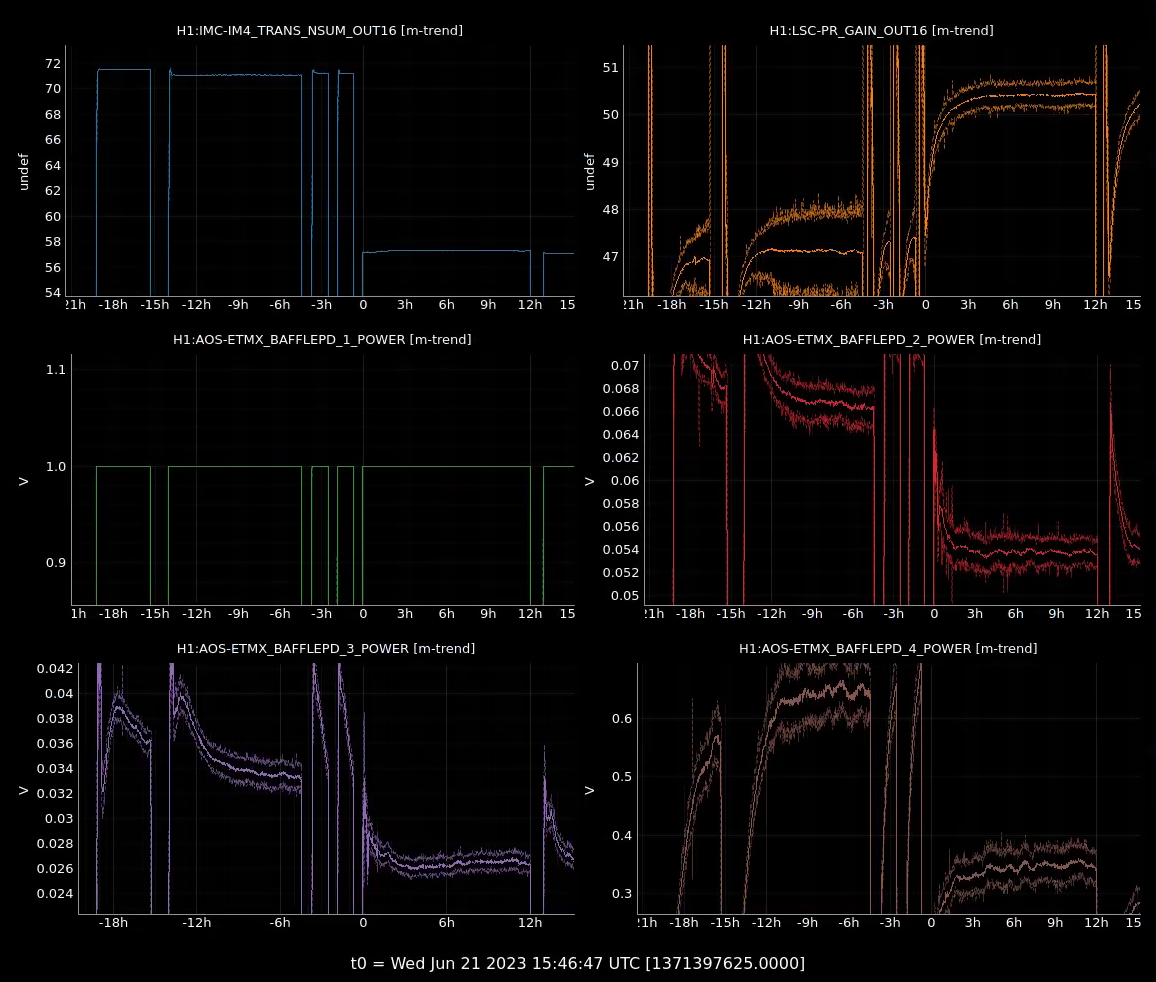
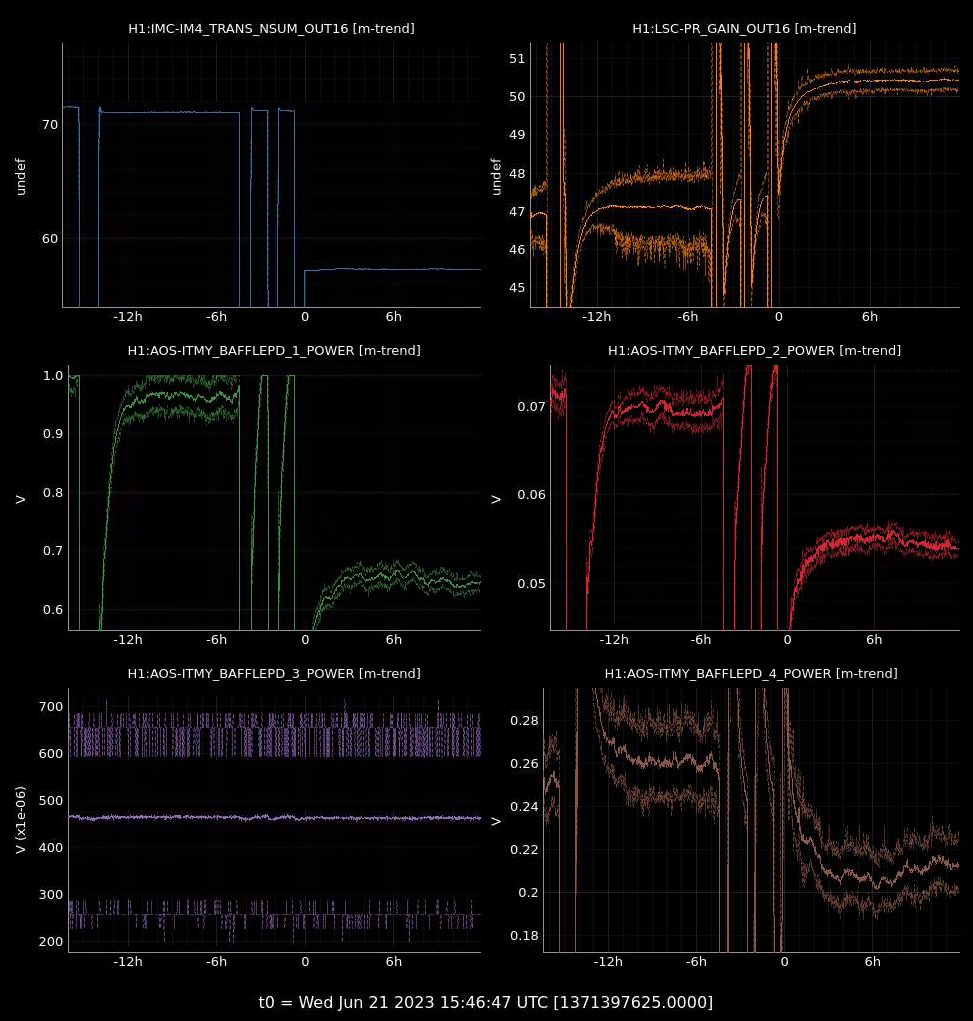
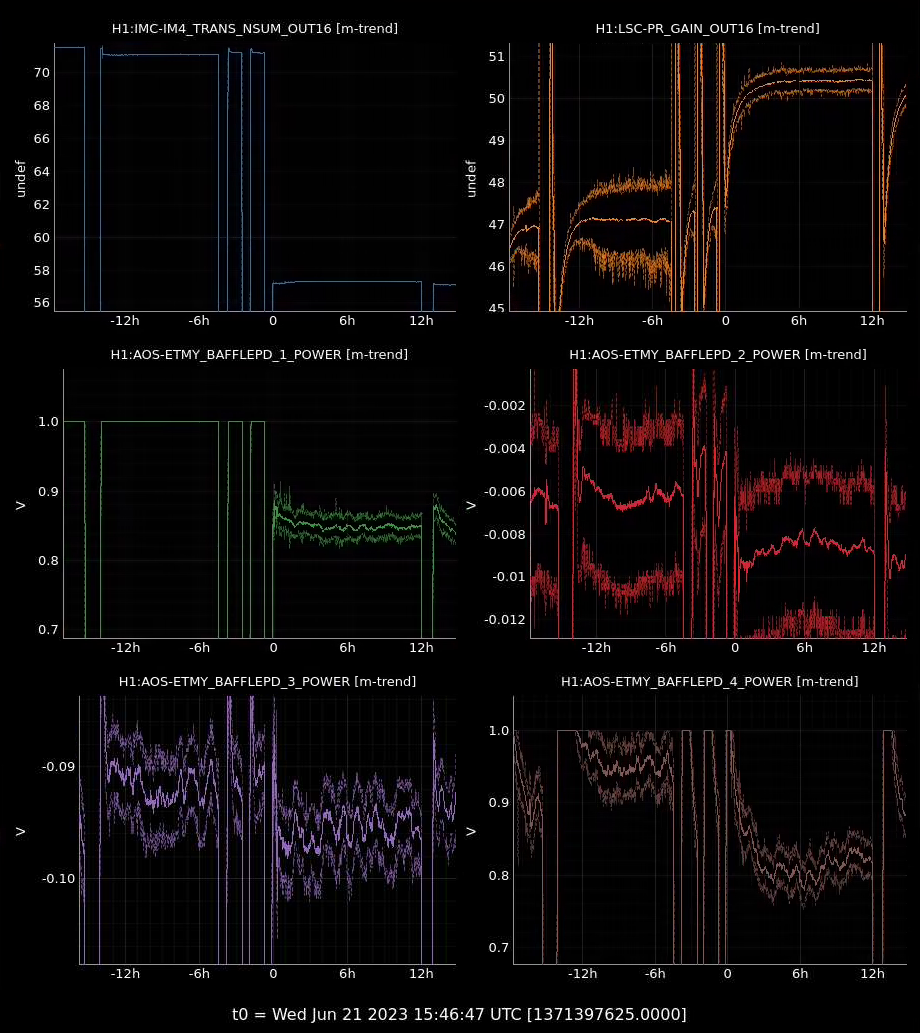
We took a look at the arm cavity baffle PD before/after powering down. These PD are registering low-angle scatter, which includes higher-order spatial modes of the beam scattered from possible thermal deformation of the test mass. The power measured on the baffle PD (after IFO thermalized) depends on the arm power, beam spatial position relative to each baffle, and distance between beam spot center and point absorber if there are any. The measured PD power (dark offset subtracted) are summarized in the table below.
| Variable | Measured value @ 75W [a.u.] | Measured value @ 60W [a.u.] | Normalized PD power @ 75 W / Normalized power @ 60 W |
| Input power on PRM | 71.2 | 57.3 | |
| PRG | 47.1 | 50.4 | |
| ITMX PD1 | 2.47 | 1.77 | 1.20 |
| ITMX PD2 | 0.033 | 0.027 | 1.05 |
| ITMX PD3 | 0.061 | 0.052 | 1.00 |
| ITMX PD4 | Saturated | 0.080 | N/A |
| ETMX PD1 | Saturated | Saturated | N/A |
| ETMX PD2 | 0.068 | 0.055 | 1.06 |
| ETMX PD3 | 0.034 | 0.026 | 1.12 |
| ETMX PD4 | 0.645 | 0.346 | 1.60 |
| ITMY PD1 | 0.96 | 0.66 | 1.24 |
| ITMY PD2 | 0.070 | 0.055 | 1.09 |
| ITMY PD3 | Dead | Dead | N/A |
| ITMY PD4 | 0.26 | 0.21 | 1.06 |
| ETMY PD1 | Saturated | 0.85 | N/A |
| ETMY PD2 | 0.016 | 0.014 | 0.98 |
| ETMY PD3 | 0.044 | 0.041 | 0.92 |
| ETMY PD4 | 0.95 | 0.80 | 1.02 |
The normalized PD power is computed by (Measured PD power) / (input*PRG*270/2). There's more round-trip loss in ppm when the IFO was operating at higher power (last column number > 1) for the X arm. Y arm doesn't see as much of a difference as X arm. This agrees with our knowledge that ITMX has point absorbers. However, the uncertainties of the results are large, since we are assuming that the beam position doesn't change before/after powering down. Note that PD1 and PD4 are much closer to the beam spot center (see llo54050) and have much higher SNR than PD2 and PD3. However, 3 of total 8 PD are saturated.
The time series of the baffle PD are shown here: ITMX, ETMX, ITMY, ETMY.