J. Kissel I've processed the measurements of the ETMX actuation strength during both the nominal IFO conditions (namely, the ETMY spot position was -15.7mm PIT, +13.2mm YAW of center) and when the ETMY spot position was moved toward center (-6.1mm PIT, +0.0mm YAW). As mentioned earlier in several spoilers, the reported actuator strength (as a function of frequency) is the same, regardless of ETMY spot position. We had no expectation it would, this is merely quantitive proof to complete the story. This closes out the analysis of all the data taken while moving the ETMY spot position a few weeks ago (see LHO aLOG 50382), and complements the analysis of the sensing function under spot move here LHO aLOG 50498. Attached are a collection of three plots for each the PUM and TST stages: Page (1): Comparing the two measurements against the full 2019-04-16 reference model Page (2): Dividing out the reference model, to just look at the remaining actuation strength in Newtons/(CAL EXC point ct) Page (3): Each raw measurement that went in to calculating the above. Note, we didn't measure the UIM because (a) we also didn't expect it to change, and (b) it would have taken than much longer, and we were already pushing our allotted measurement time that week. This data was processed with the following script: /ligo/svncommon/CalSVN/aligocalibration/trunk/Runs/O3/H1/Scripts/FullIFOActuationTFs/ process_actuationmeas_collection_20190717_spotmove.py along with rev 8036 of /ligo/svncommon/CalSVN/aligocalibration/trunk/Common/pyDARM/src/ actuation.py
TITLE: 07/17 Day Shift: 15:00-23:00 UTC (08:00-16:00 PST), all times posted in UTC
STATE of H1: Observing at 113Mpc
OUTGOING OPERATOR: Cheryl
CURRENT ENVIRONMENT:
Wind: 13mph Gusts, 9mph 5min avg
Primary useism: 0.01 μm/s
Secondary useism: 0.08 μm/s
Just had 5.3 off coast of Oregon!
QUICK SUMMARY:
H1 had been locked 6+hrs, but as I was typing Cheryl and I saw multiple signals (ASC, tidal, seismic blrms) all grow. Later saw that this was a 5.3 Earthquake off the SW Oregon coast! There was no Verbal warning, and I think I missed it on SEISMON because this was happening as I was logging into the computer (maybe we can have SEISMON or a smaller modified indicator/alert window up on the wall).
At any rate, after the lockloss 15:03utc, I took ISI_CONFIG to LARGE_EQ_NOBRSXY.
Just a note for later: There are plans for the Wednesday Calibration measurements (roughly 1-3pm local).
TITLE: 07/17 Owl Shift: 07:00-15:00 UTC (00:00-08:00 PST), all times posted in UTC
STATE of H1: Observing at 113Mpc
INCOMING OPERATOR: Corey
SHIFT SUMMARY:
LOG:
first attempt:
second attempt
third attempt
fourth attempt
break in Observe for CW injections
H1 lost lock 10 minutes in t my shift, it's been back in Observe for over 3 hours.
TITLE: 07/17 Owl Shift: 07:00-15:00 UTC (00:00-08:00 PST), all times posted in UTC
STATE of H1: Observing at 113Mpc
OUTGOING OPERATOR: Ed
CURRENT ENVIRONMENT:
Wind: 19mph Gusts, 15mph 5min avg
Primary useism: 0.11 μm/s
Secondary useism: 0.09 μm/s
QUICK SUMMARY: locked in Observed, currently riding out an EQ, and in EQ mode
TITLE: 07/17 Eve Shift: 23:00-07:00 UTC (16:00-00:00 PST), all times posted in UTC
STATE of H1: Observing at 114Mpc
INCOMING OPERATOR: Cheryl
SHIFT SUMMARY:
LOG:
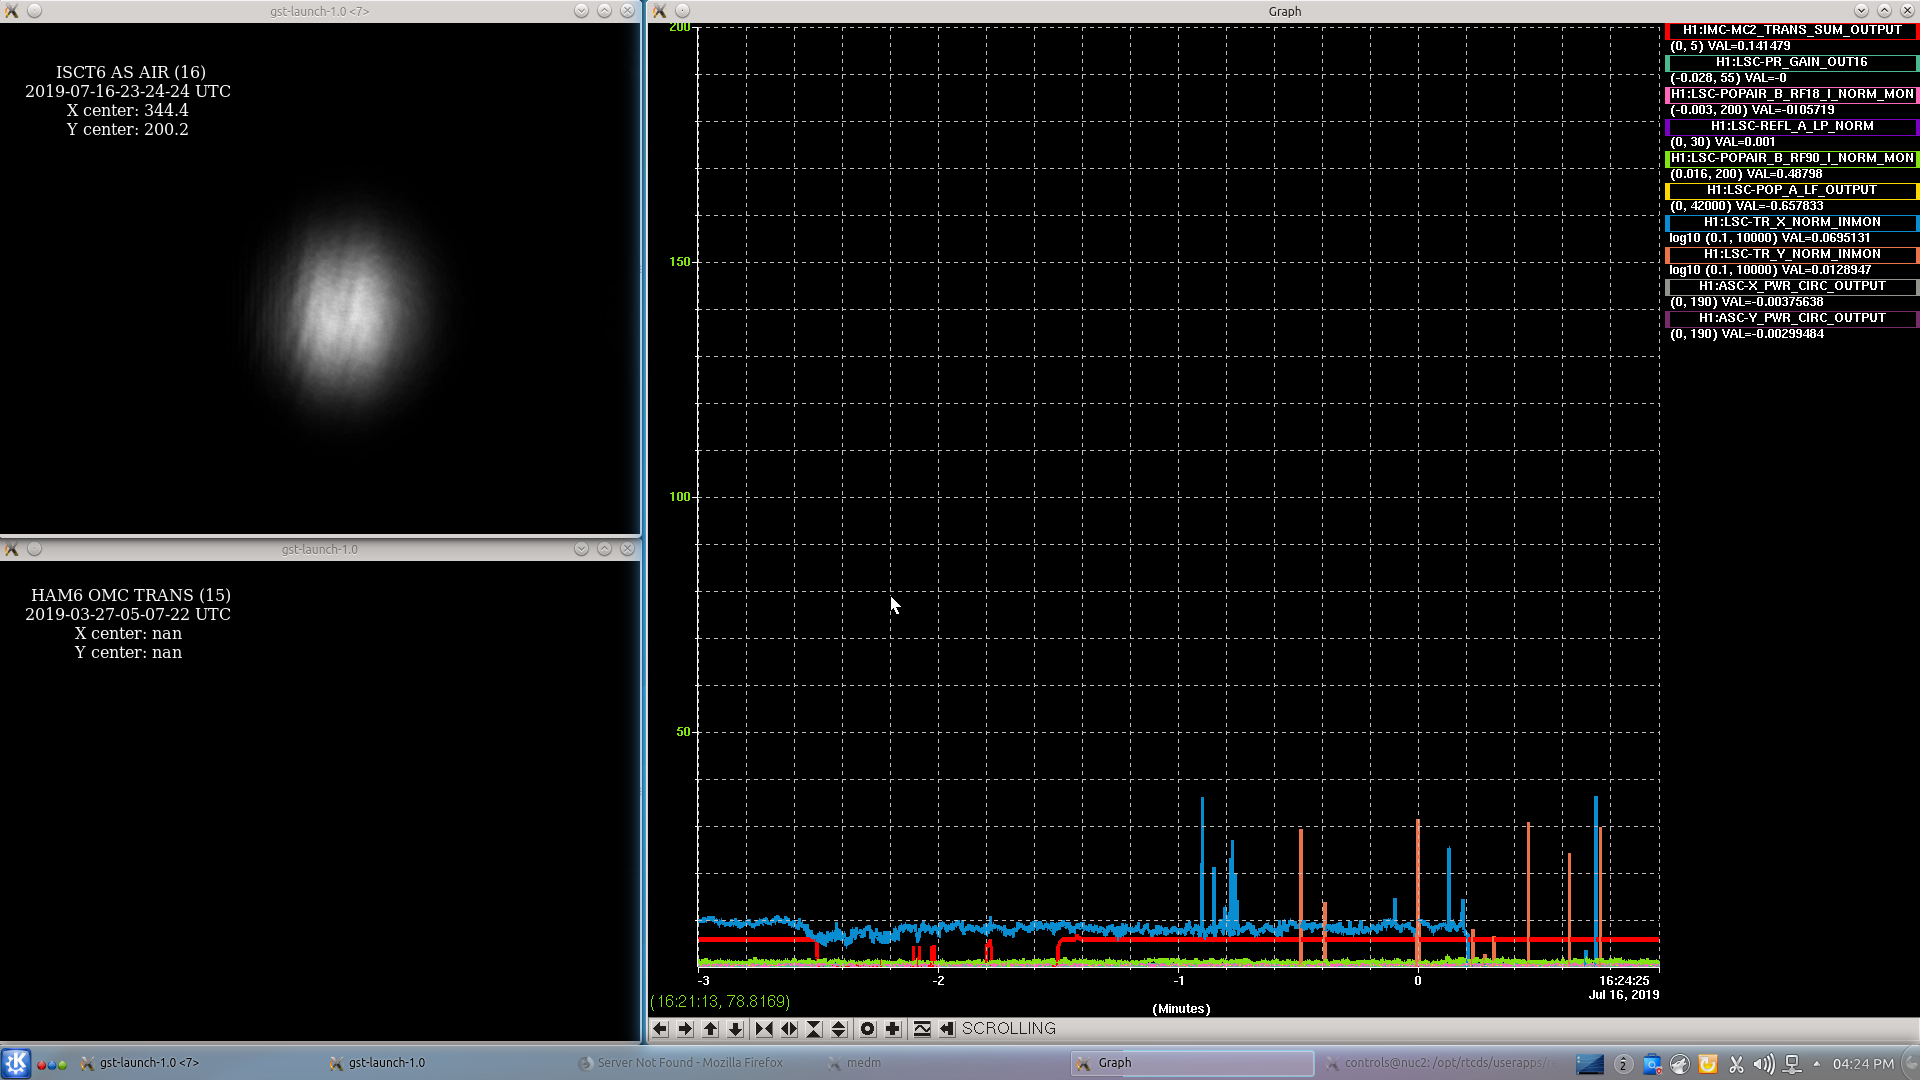
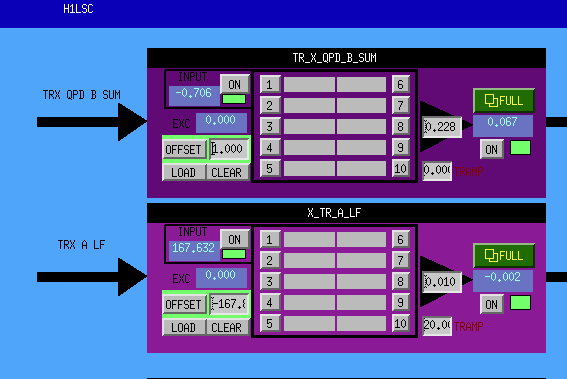
23:20 Adjusted LSC:TRX QPD B SUM offset to zero the output which was noticeable on the StripTool (images below)
23:25 Begin re-locking H1
23:59 SEI_CONF back to WINDY
00:48 H1 back to Observing
02:33 switched to EQ mode for incoming 4.2 from CA
02:47 EQ was nothing. Switched back to WINDY
03:30 back to EQ. Despite nothing significant looking on Seismon, BLRMS seem to be growing steadily and ASC/Tidal looks a bit "shook up".
04:04 back to WINDY.
06:45 48Hz prominence is looking a bit broader in width at this time
06:48 back to EQ for Guatemala 4.9
06:57 handing off to Cheryl
If anyone notices a funny burnt smell in the control room it's because one of the TVs blew some smoke out last night after an audible pop. It's my suspicion that a cap in one of the power supplies popped. It appeared to be the lower TV. I've notified Bubba, Richard, Carlos and Jeff J.
Richard, Carlos:
Carlos upgraded the computer from the old mac-mini (video2) to a Nuc (nuc20). A new TV is being ordered to replace the failed unit.
I've been doing some modeling of the squeezer losses to try and pinpoint possible sources of missing squeezing. One thing that I have noticed is anything related to the interferometer (rather than SQZ or output-optics) will cause frequency dependent losses, which might emulate the frequency-dependent squeezing of SRCL offsets.
Georgia mentioned Shiela's posts 50104, 50473 which indicate a possibility that the budget at LHO currently requires some form of frequency dependence to explain the degradation of squeezing above the cavity-pole, and the conclusion the SRCL tunings aren't affecting it.
The impressive thing about the SQZ budget spectrum is the amount of loss required to degrade squeezing ~2db by 1kHz. This requires enough loss that one might dismiss the possibility that they are in the IFO, but IFO interactions can enhance apparent loss though coherent effects. For mode-matching to the cavity, I go though this a bit in LLO45493 to show that IFO mode matching can enhanc loss 4x in some cases, but there do not show the frequency dependence.
Another possibility is loss in the SRC cavity round-trip. I'll mention a disturbing feature of the SRC. This cavity is anti-resonant to lower the cavity pole, which should lower the effects of losses, as they are cavity-suppressed. However, the anti-resonance is established through the phase-flip of the over-coupled arms. Above the arm-pole, the arm reflectivity flips phase back and by 1kHz, the SRC is resonantly-enhancing its losses. GWINC does properly model this and increasing Optics.BSloss will show the frequency dependent degradation.
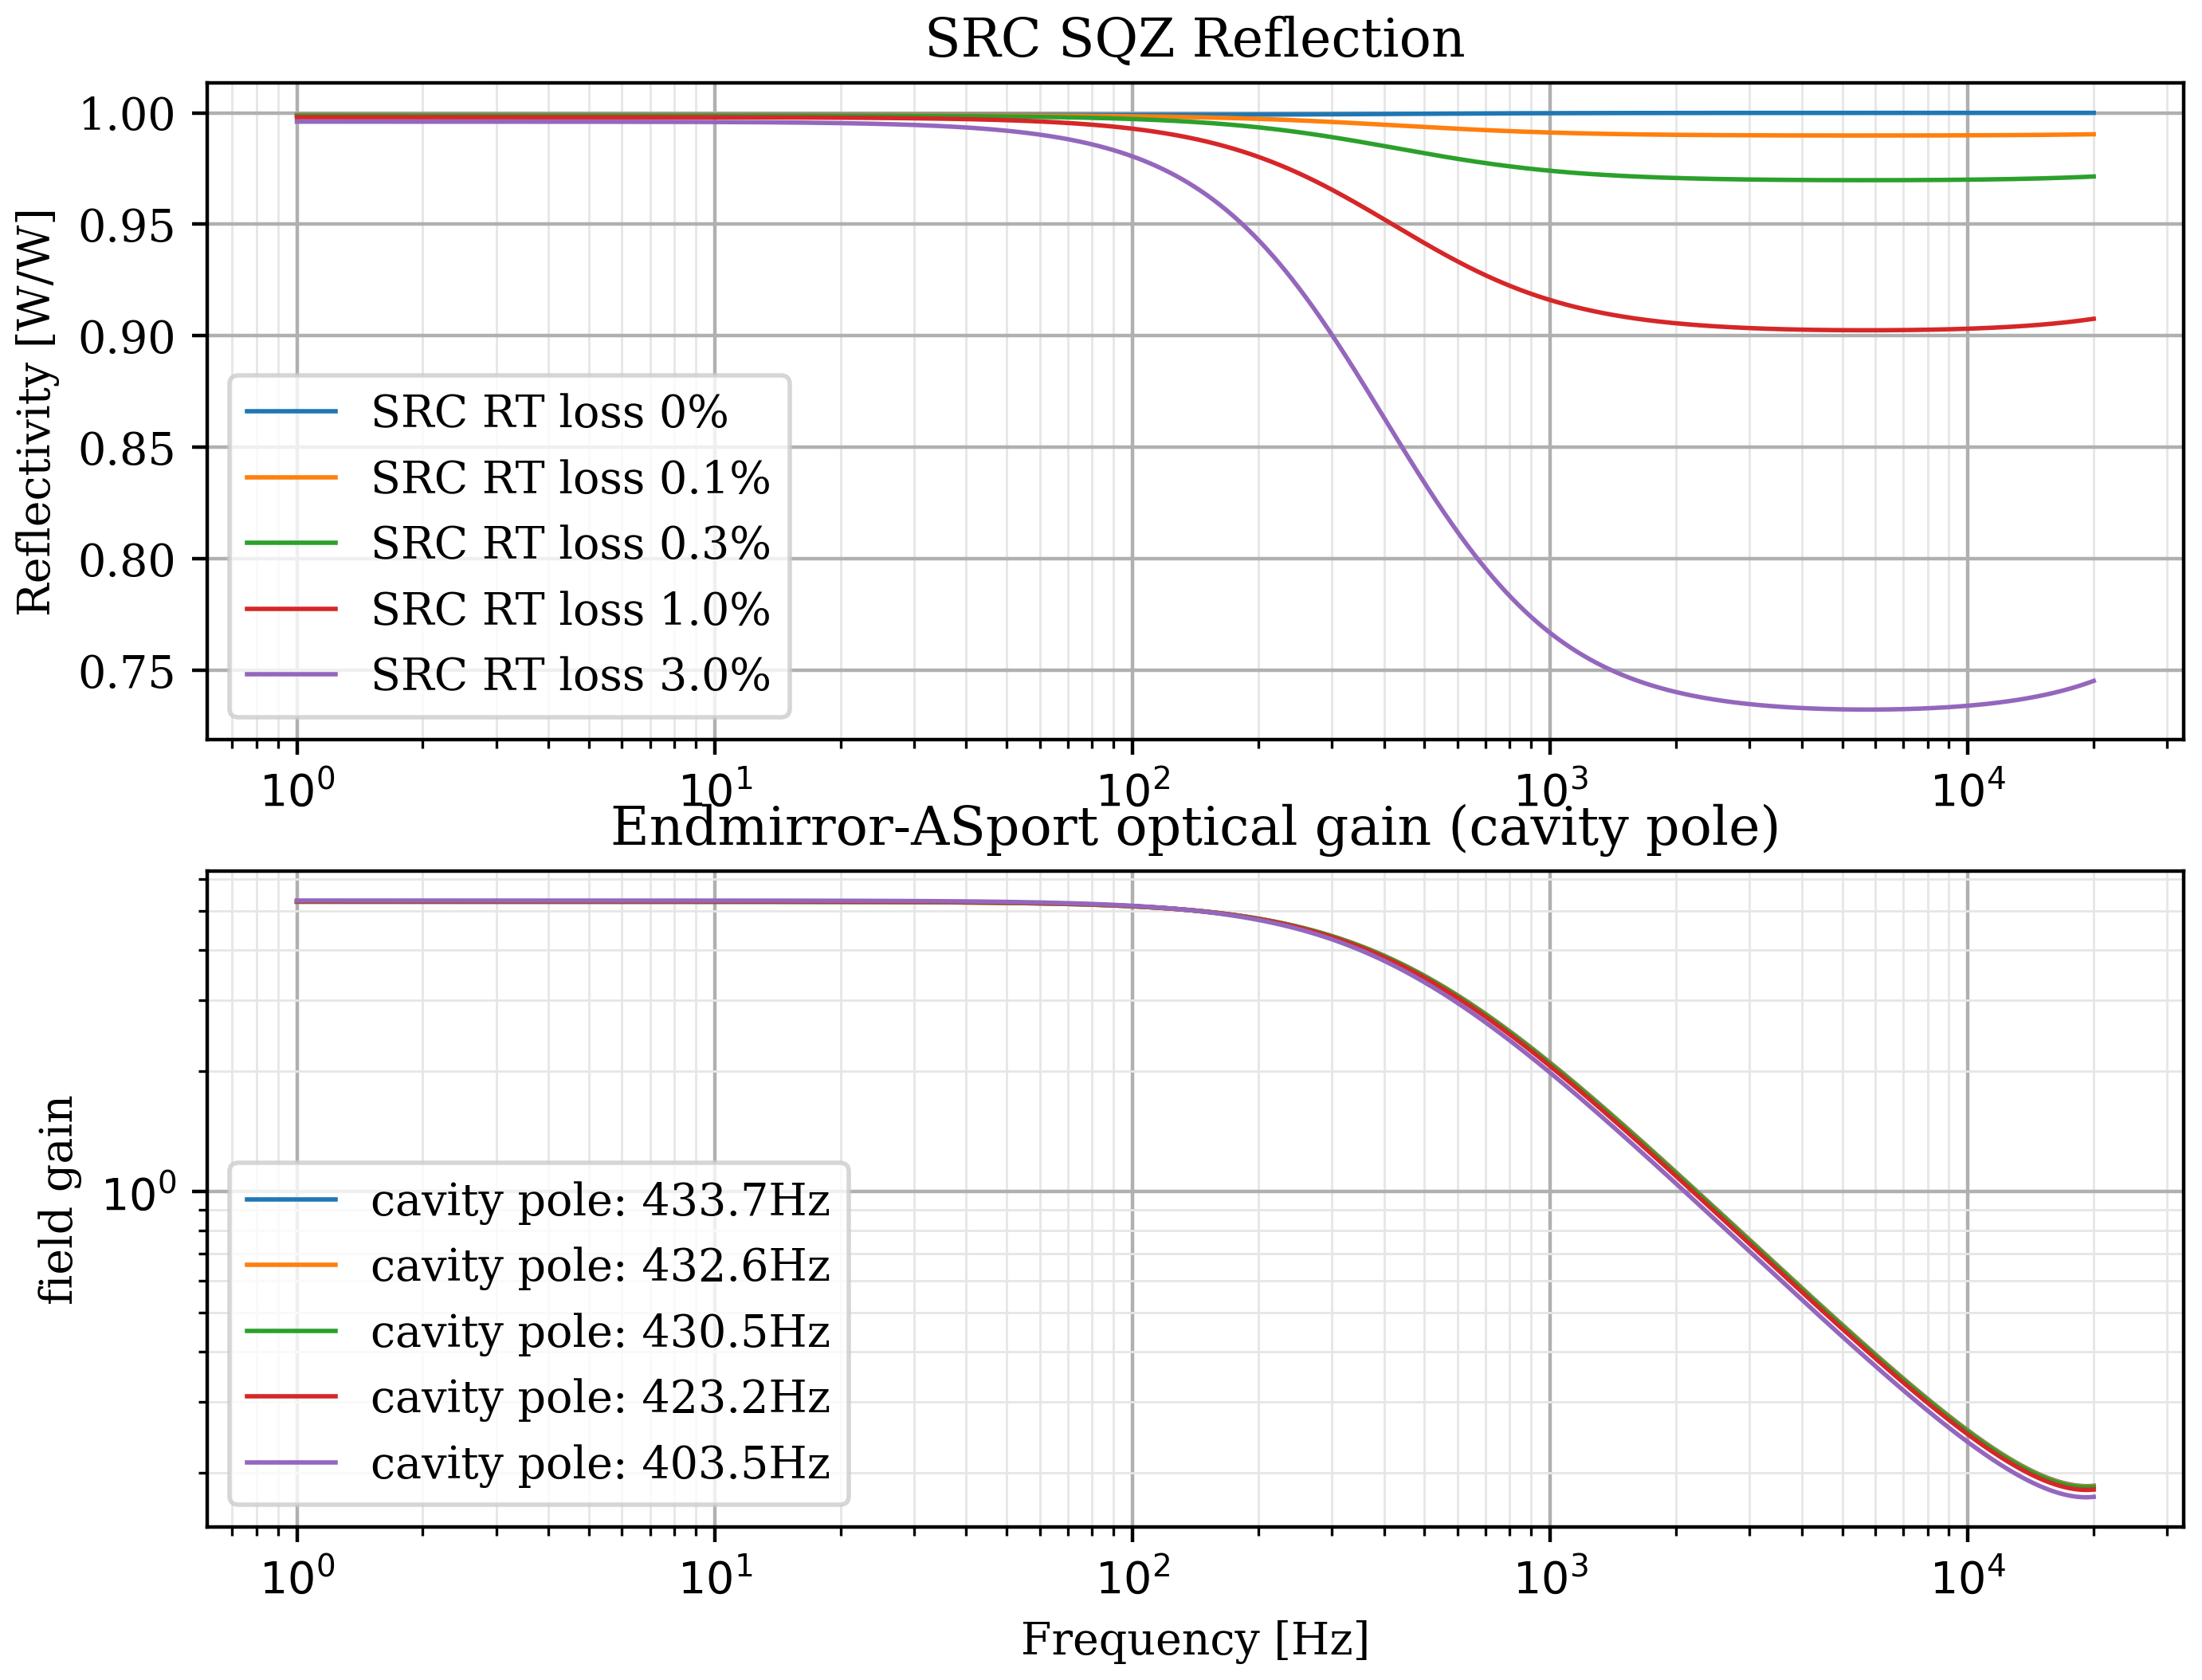
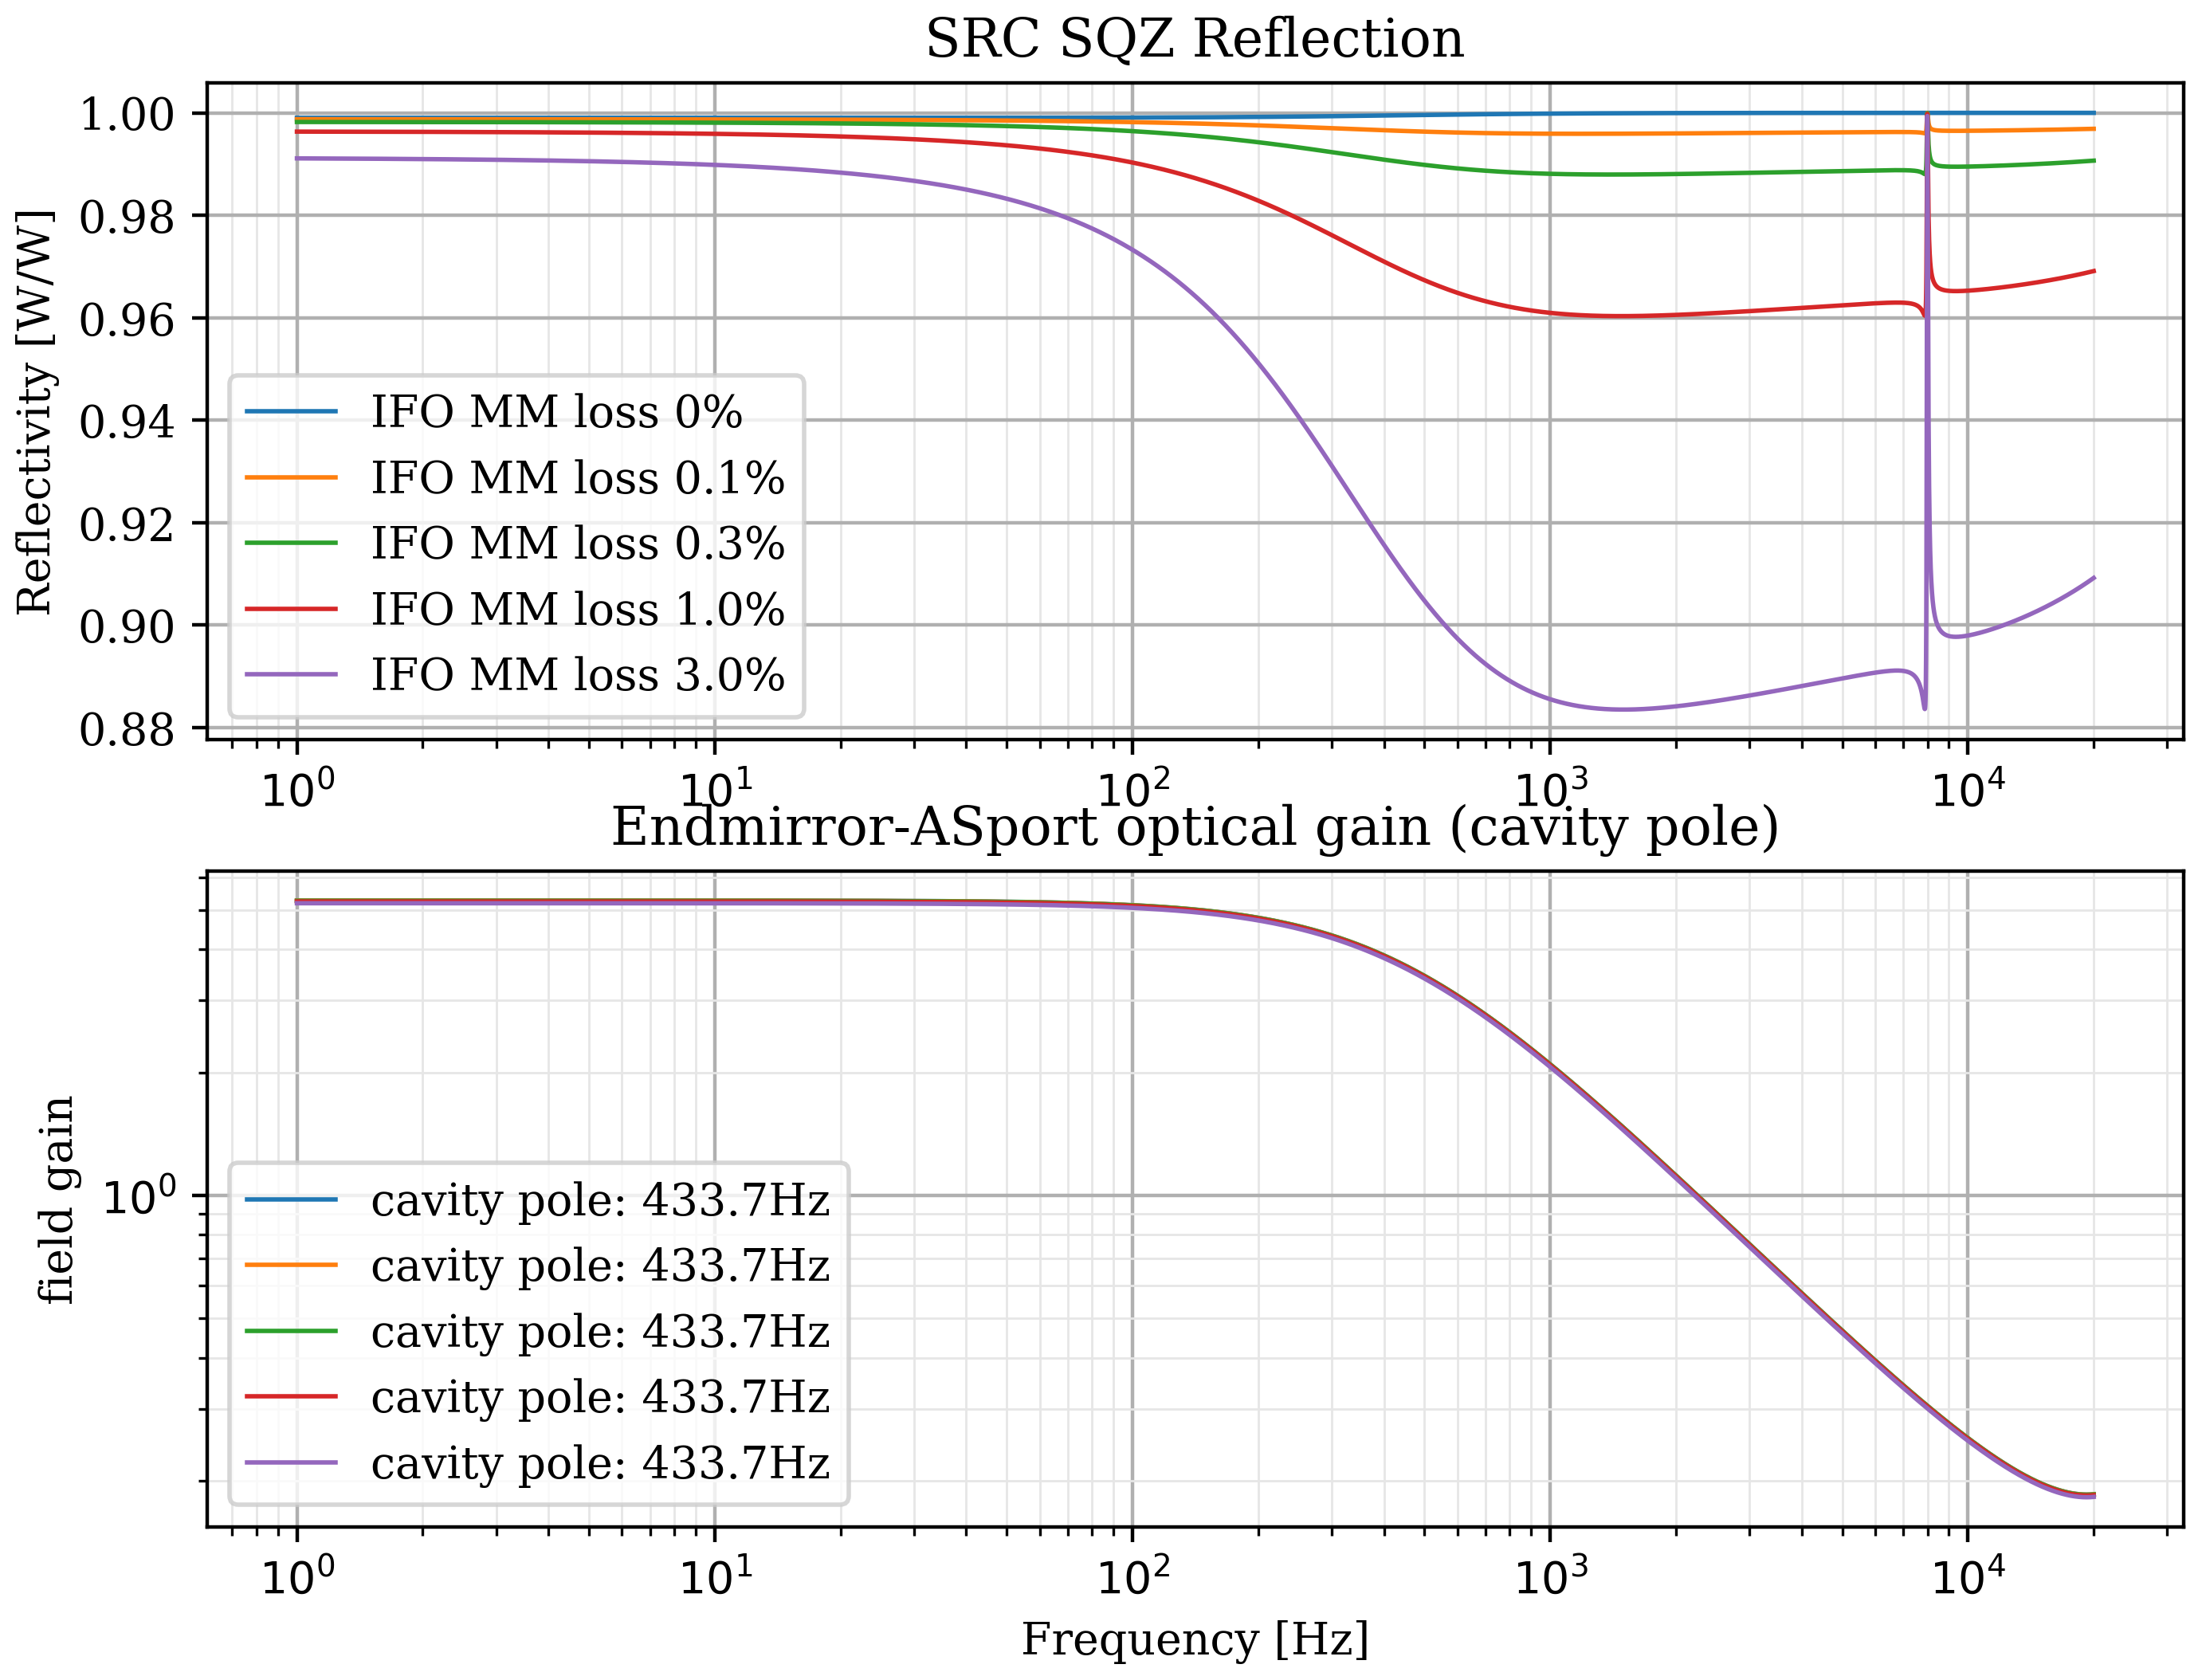
Internal mode-matching between SRC<->ARMs is also a possibility, but since it is power-conserving it is perhaps less strong. I have started modelling all of these in a simple 2-transverse-mode coupled-cavity model (no radiation pressure included). This model isolates the loss from the reflectivity in a simpler form to study (than GWINC, at least). The matrix equations could be expanded to include more modes or 2-photon formalism for RPN, but it is complicated enough as-is. The internal arm<->src mode-matching has not been studied fully yet because I have yet to automate the cavity tuning to compensate for 02-mode gouy phase that enters with the mode-mismatch. I also likely have the exact Gouy phases wrong, but the plots below show the qualitative effects to SRC reflectivity and signal cavity pole for the different levels of loss. The SRC transmissivity used is .325.
cavity_pole_SRCloss.png shows the effect of internal SRC losses.
cavity_pole_SRCmm.png shows the effect of mode-matching losses with the interferometer (assuming perfect matching to SQZ->OMC).
coupled_cavity.py has the matrix equations the notebook generating the figures are in coupled_cavity_LHO_ipynb.tgz (can't upload python notebooks without zipping). Should run in python3 for users with IIRrational.
J. Kissel I've processed actuation function measurements from O3 thus far under nominal IFO conditions (namely, the nominal spot positions on test masses). In short: each ETMX actuator stage strength has not changed one bit, and our 2019-04-16 model, informed by measurements taken on 2019-04-03 (see processing of that data in LHO aLOG 48378) is still valid, in the frequencies where it matters. Attached are plots confirming this conclusion. The "model" in the plots is the 2019-04-16 model, /ligo/svncommon/CalSVN/aligocalibration/trunk/Runs/O3/H1/params/modelparams_H1_20190416.py For each actuation stage of ETMX, UIM, PUM, and TST, I show three plots: Page 1: the model compared against measurement, Page 2: the ratio of model compared against measurement, and Page 3: the resulting GPR fit to the residuals. In the last page, we see that -- in the frequency region which matters for each stage -- the uncertainty estimate (shaded blue) on the systematic error (solid blue line), informed by the collection of data (blue dots) are consistent with unity magnitude and zero phase, i.e. there is no systematic error. Outside the region where it matters, there is systematic error, and we know that these are flaws in the dynamical model of the ETMX dynamics used. These effects are known, (see detailed description in LHO aLOG 47331), but because they are in frequency regions that do not matter, we've not and will not put energy in to fixing them. This allows us to comfortably update the GPR posterior distributions of unknown systematic error on the actuator stages, which in turn inform the response function uncertainty, improving our estimate of the overall unknown systematic error from these actuation model parameters. These plots are created by the following script: /ligo/svncommon/CalSVN/aligocalibration/trunk/Runs/O3/H1/Scripts/FullIFOActuationTFs/process_actuationmeas_collection_20190716.py I have not yet produced any new HDF5 files, nor updated the uncertainty budget. I need to talk to Lilli before understanding how to do so. Also still to come -- analysis comparing the ETMX actuation strength as measured by an IFO with its nominal spot positions (i.e. the L2 and L3 data from all dates included in this entry) and with an IFO whose ETMY spot position has been moved close to center (i.e. L2 and L3 data from LHO aLOG 50382).
115Mpc
{Kyle, Chandra}
This morning Kyle and I attempted to test the newly installed turbo station and hepta roughing pump at mid-Y by simulating a pump down, after Kyle rewired panels by adding relays for valve open/closed positions. But first we vented the turbo and replaced the foreline vent valve with a blank.
We ran into some kinks and were not able to complete the full test, but we did demonstrate a successful rework on the panel wiring. The pressure relief on the Hepta inlet leaks a lot and prevented us from reaching base pressure at roughing inlet so Kyle replaced with conflat blank.
The turbo spun from about noon to 1:30 pm local time to restore vacuum on other side of turbo isolation gate valve.
The 3 attached files show the RF coming from the LSC REFL PD at the 9MHz output for REFL_A and REFL_B, as well as at the 45MHz output for REFL_A. Each plot shows three measurements: one at 1.8W and two at 37W, early and late in a lock. There is quite some variation between the two 37W measurementns, but this might just be due to seismic activity. See previous alogs 45863 and 44771.
TITLE: 07/16 Day Shift: 15:00-23:00 UTC (08:00-16:00 PST), all times posted in UTC
STATE of H1: Preventive Maintenance
INCOMING OPERATOR: Ed
SHIFT SUMMARY:
Fairly light Maintenance Day, and because of this I went for locking before noon and did NOT run an alignment. Observing evaded us post-Maintenance due to some Commissioning work for the first few hours, but eventually managed a few minutes of OBSERVING, only to be done in by an earthquake!
LOG:
TITLE: 07/16 Eve Shift: 23:00-07:00 UTC (16:00-00:00 PST), all times posted in UTC
STATE of H1: Earthquake
OUTGOING OPERATOR: Corey
CURRENT ENVIRONMENT:
Wind: 9mph Gusts, 6mph 5min avg
Primary useism: 0.10 μm/s
Secondary useism: 0.08 μm/s
QUICK SUMMARY:Preparing to begin re-lock after earthquake
WP8275 Fix ADC bus selectors in h1iopsusauxh34
Rahul, Dave:
I fixed the copy-paste error with the bus selectors for ADC4 and ADC5 in h1iopsusauxh34. I restarted both the user model (h1susauxh34) and the IOP model. Note I did not do a startWorld and therefore h1edc was not restarted.
Interestingly the user model's reading of these ADC channels did not change, which suggests this IOP problem did not impact the ADC data as seen by the user model. Rahul is verifying that these signals look correct.
No DAQ restart was required
WP8277 h1calcs model change
Jeff, Dave:
Jeff installed a new h1calcs model, a DAQ restart was required.
h1asc model bug fix
Daniel, Dave:
Daniel fixed a bug in h1asc, no DAQ restart was required.
DAQ Restart
Dave:
The DAQ was restarted once to support the h1calcs model change.
WP8279 BRS SDF
Jonathan, Patrick, Shiela, Dave:
Jonathan has created two new slow-controls SDF systems h1brse[x,y]sdf and Patrick has created a INI/REQ file pair for these systems. I'm in the process of completing the configuration.
Note that once these system were created, this caused SDF problems with the IFO. Sheila added these to the exclude list in isc/h1/guardian/switch_SDF_source_files.py
Video3 upgrade from mac-os (mac-mini) to Debian (nuc)
Carlos, Patrick, Dave:
We upgraded video3 (the wall display of the PSL cameras) from the aging mac-mini (which was running hot and making fan noise) to a Nuc (nuc21).
Corey noted a couple of things while he was relocking after maintenance today:
[Bubba Gateley, Jeff Kissel, Calum Torrie, Krishna Venkateswara, Eddie Sanchez, Rich Savage, Timesh Mistry]
This is a delay post from last week.
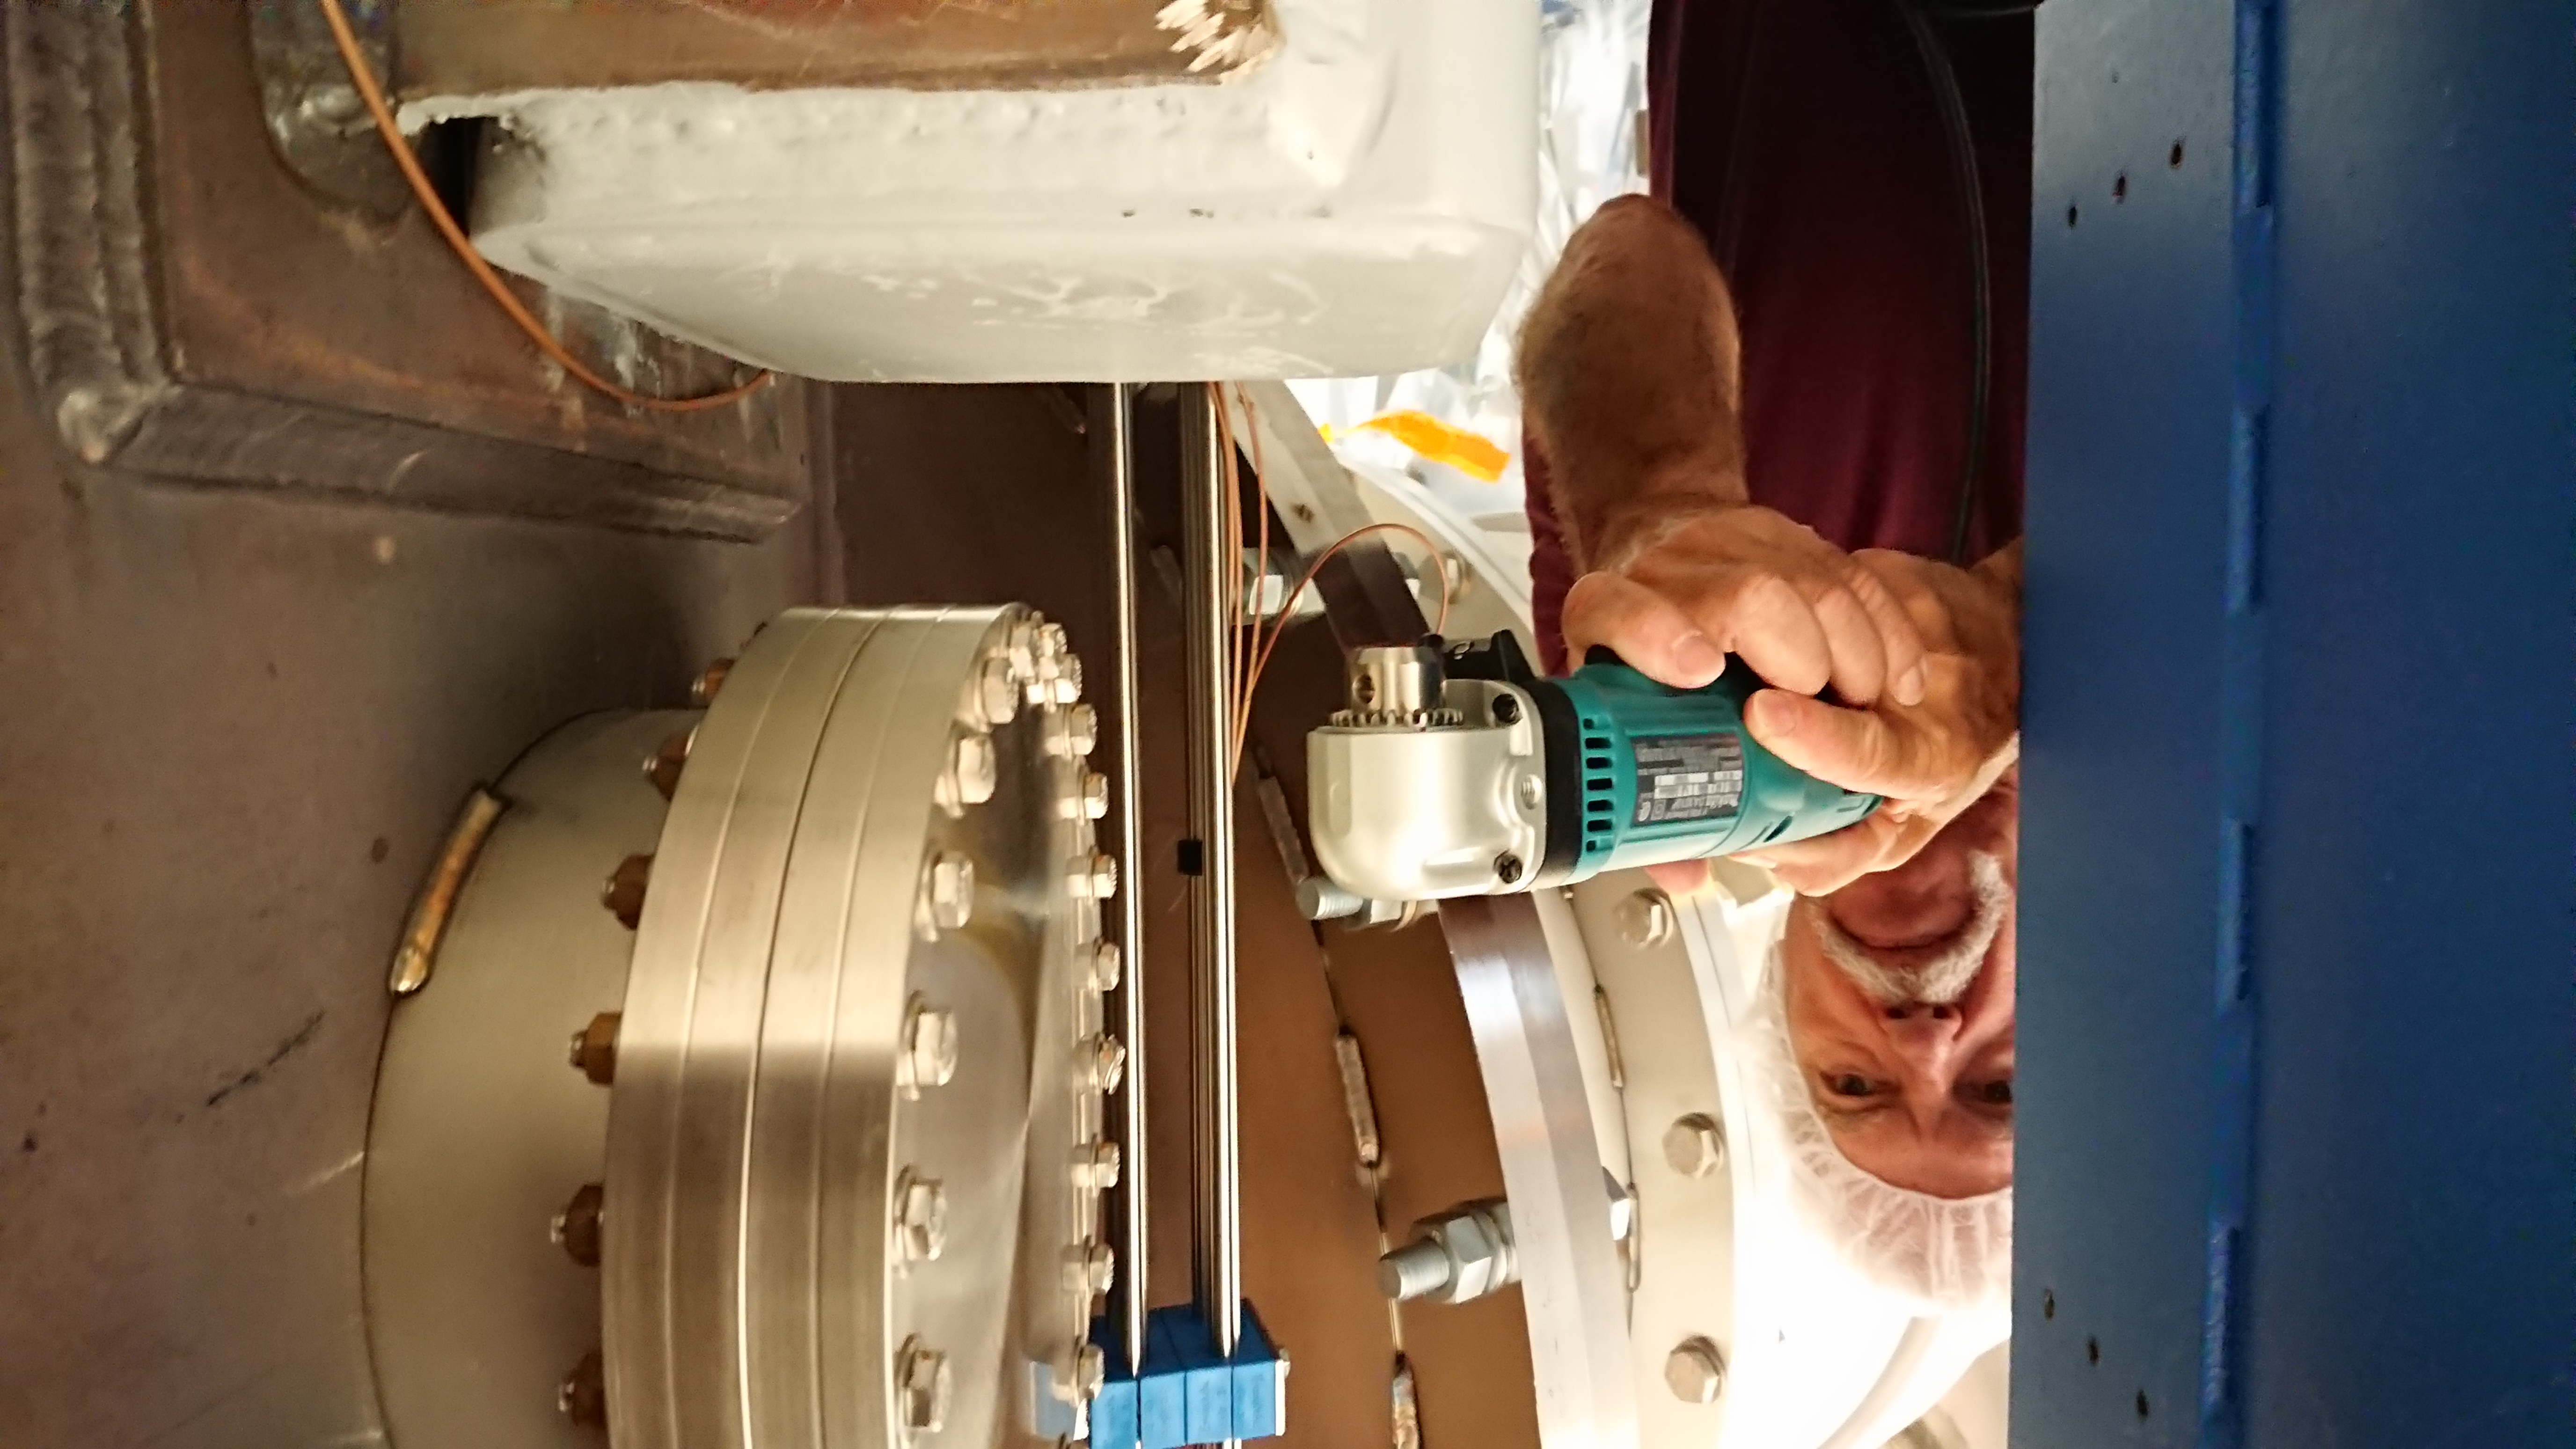
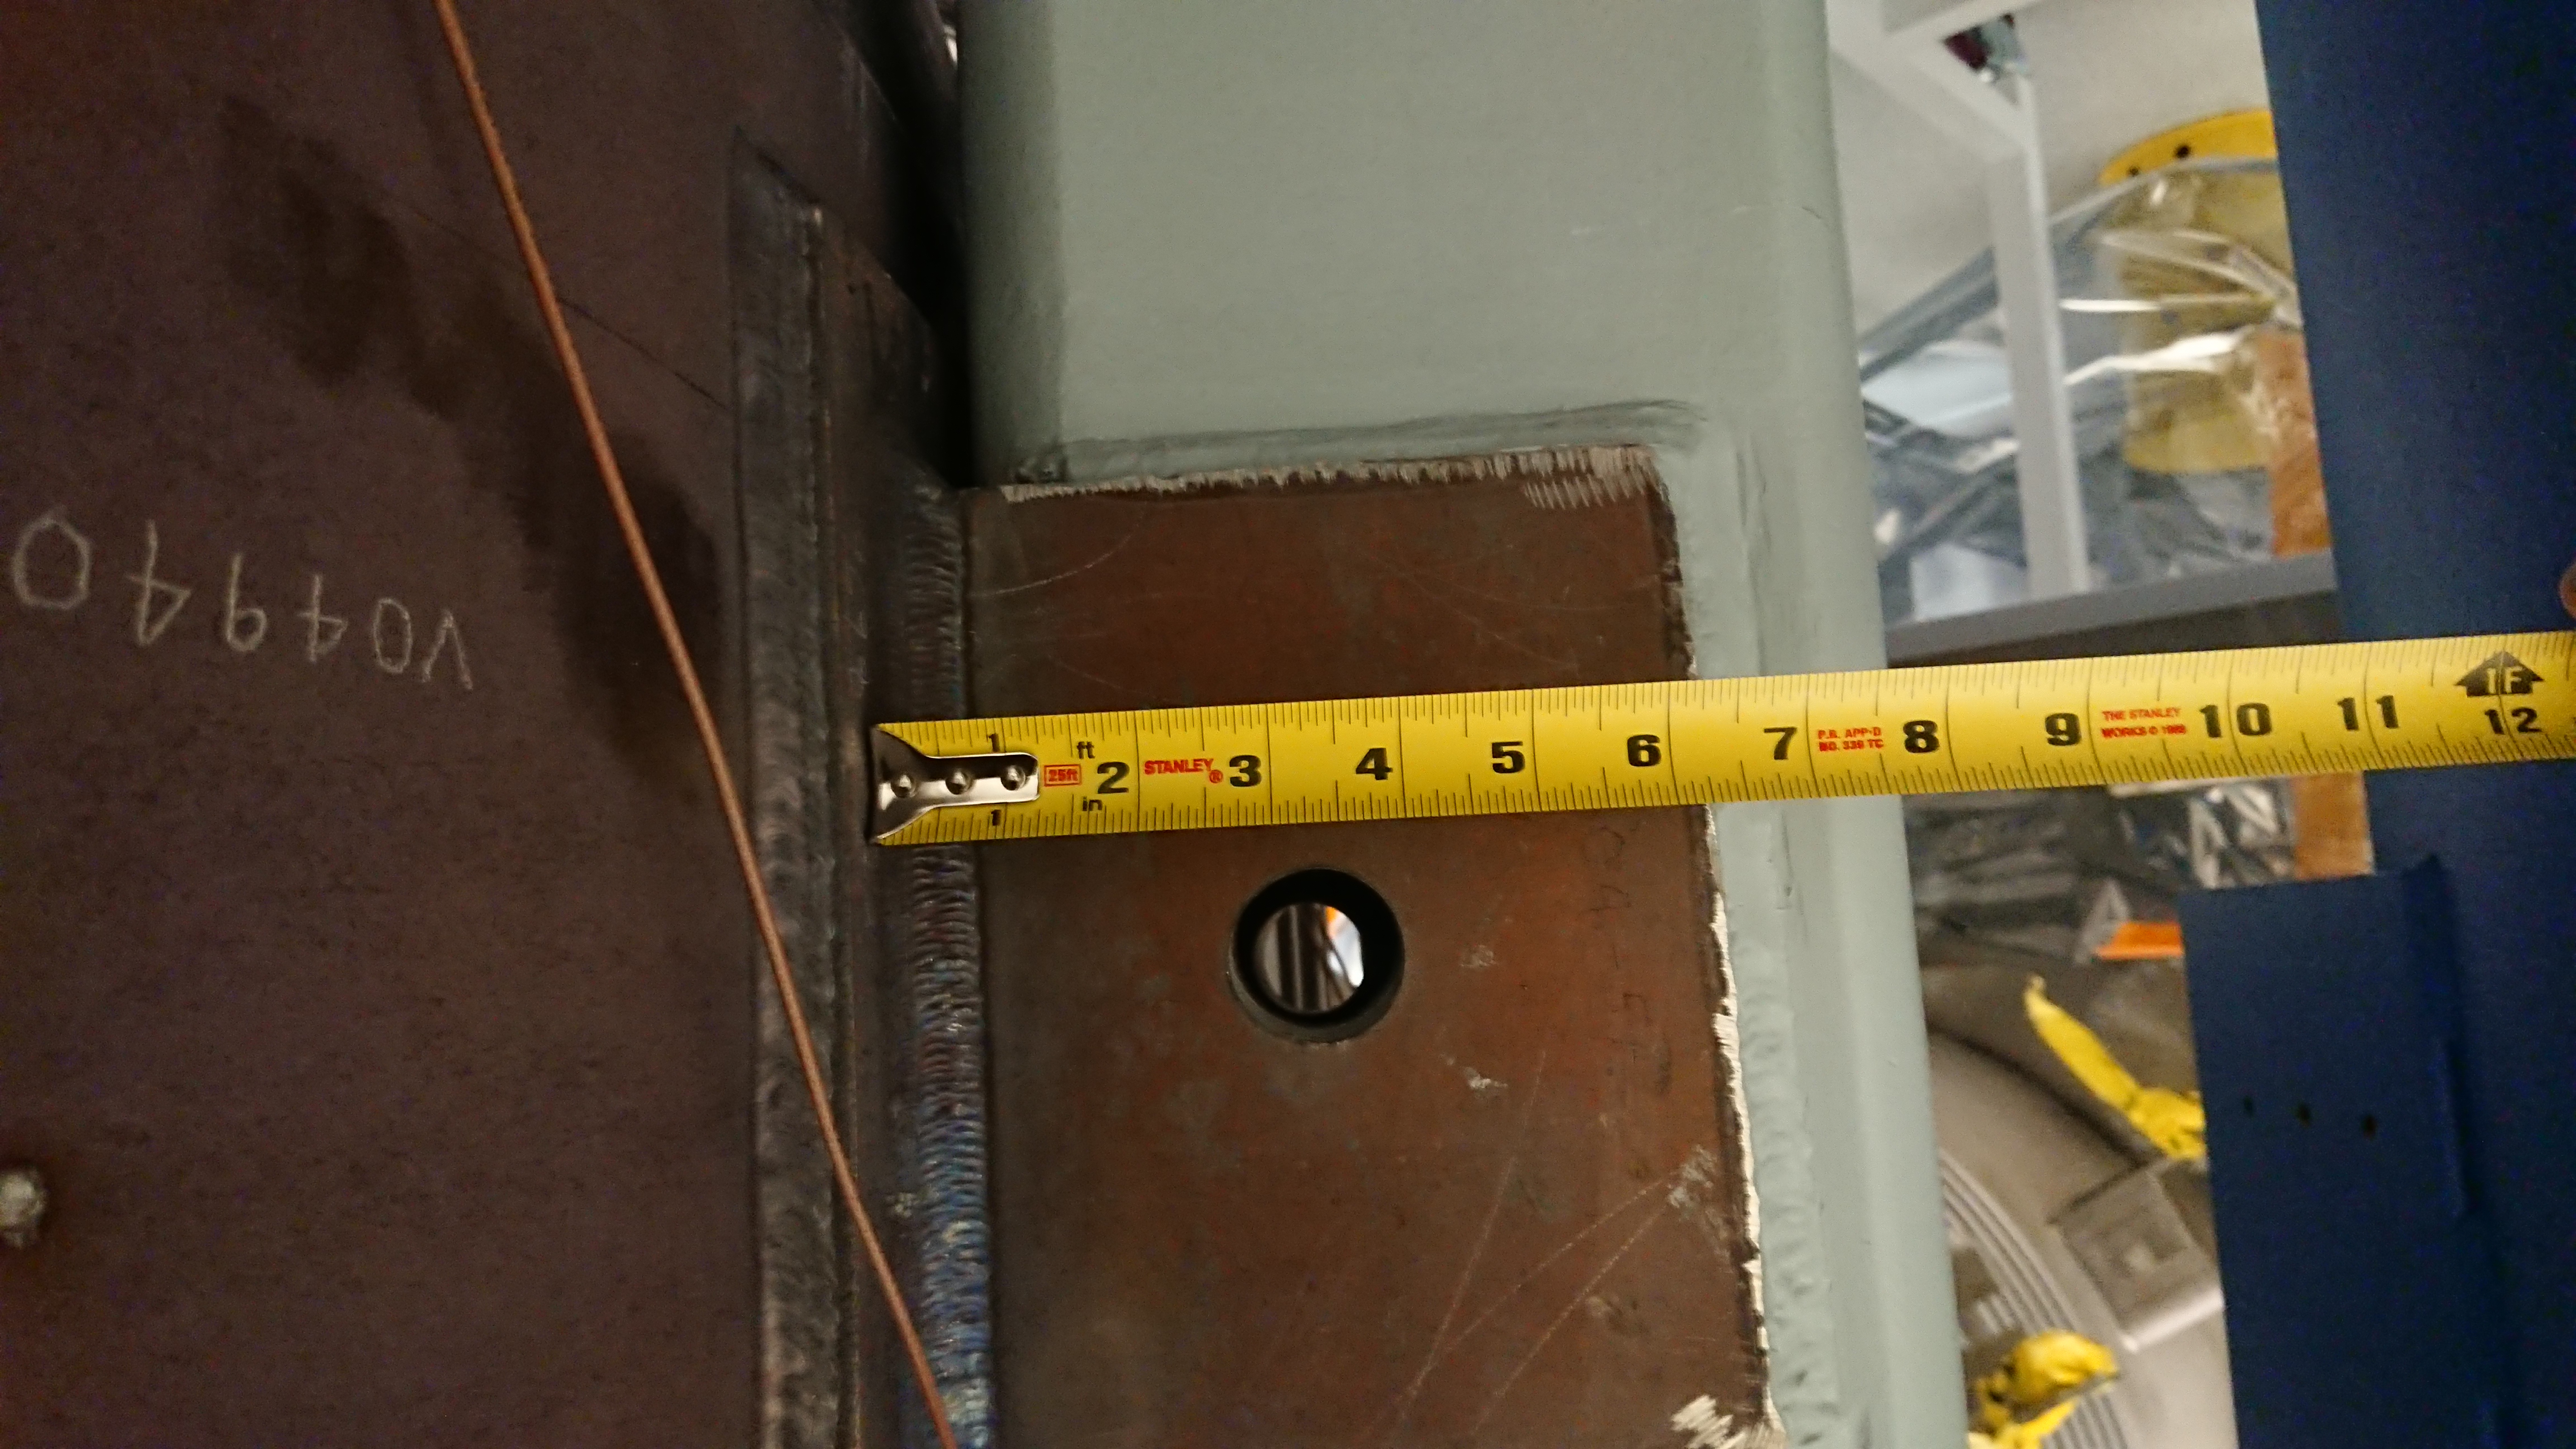
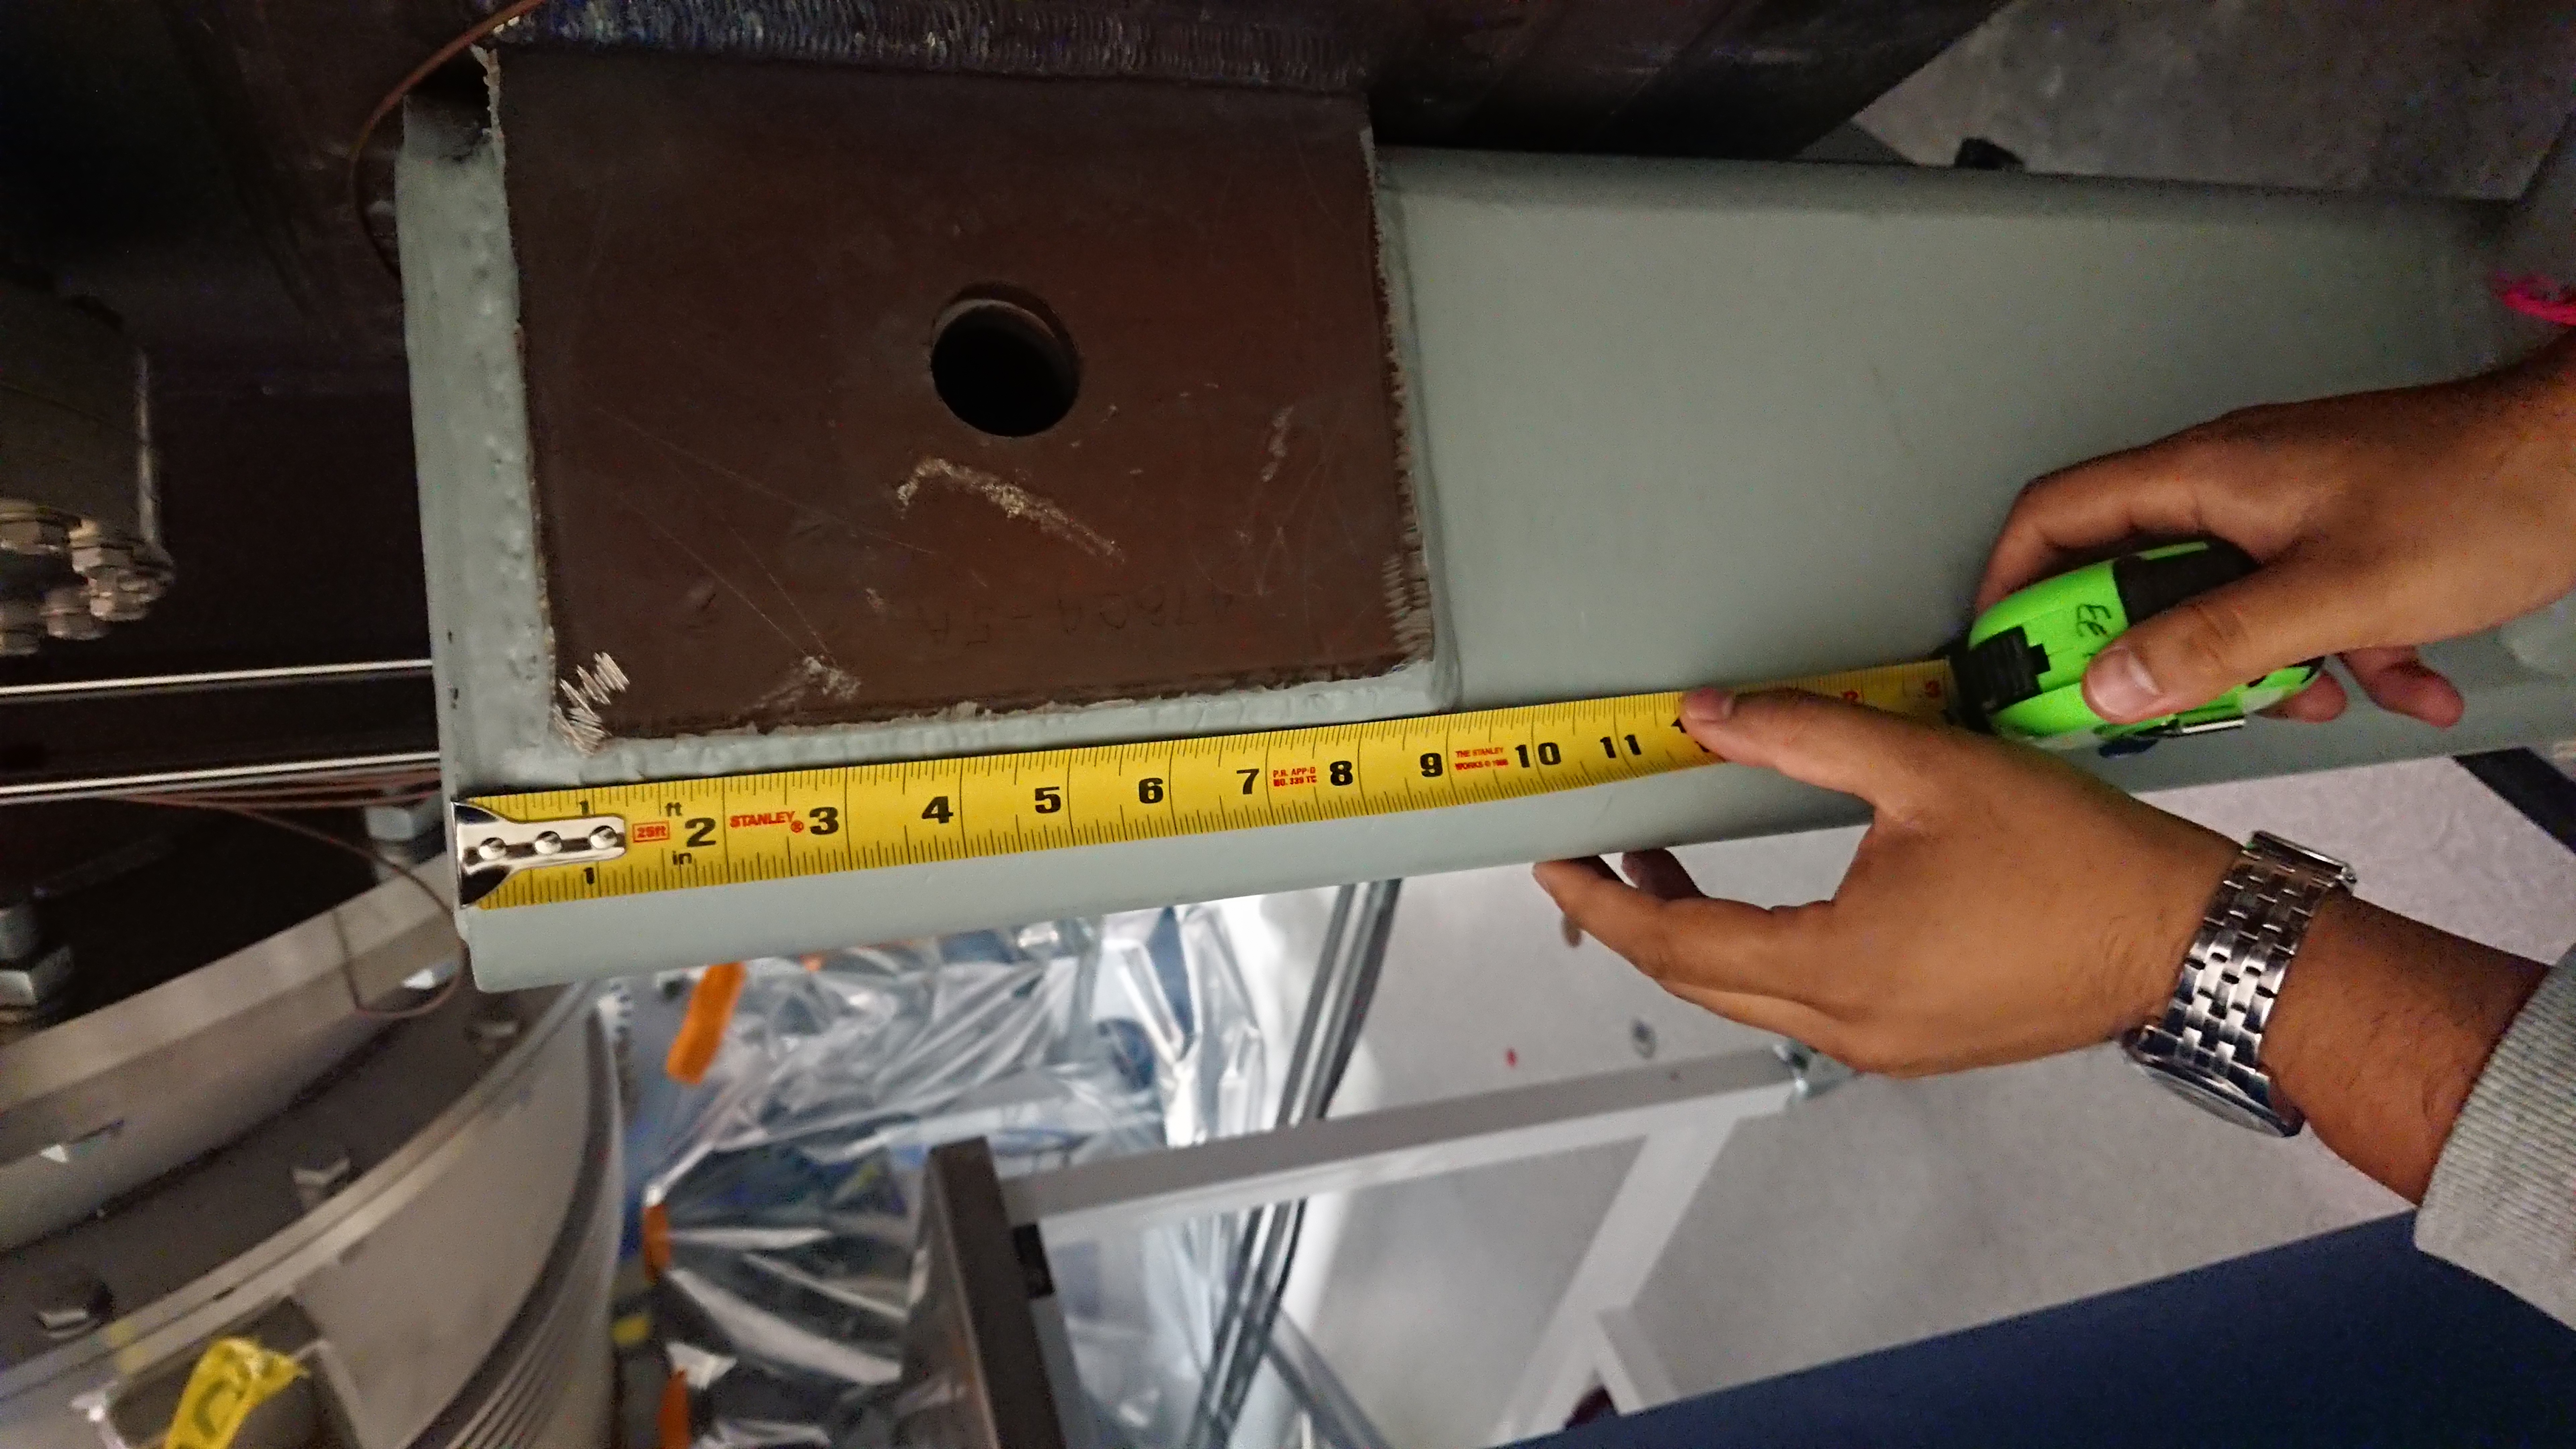
Rick and I went down to EX end station with a tape measure to see how much room there was to physically do the drilling. All the photos ca be found in the DCC G1901341 entry. The key photos will be attached here.
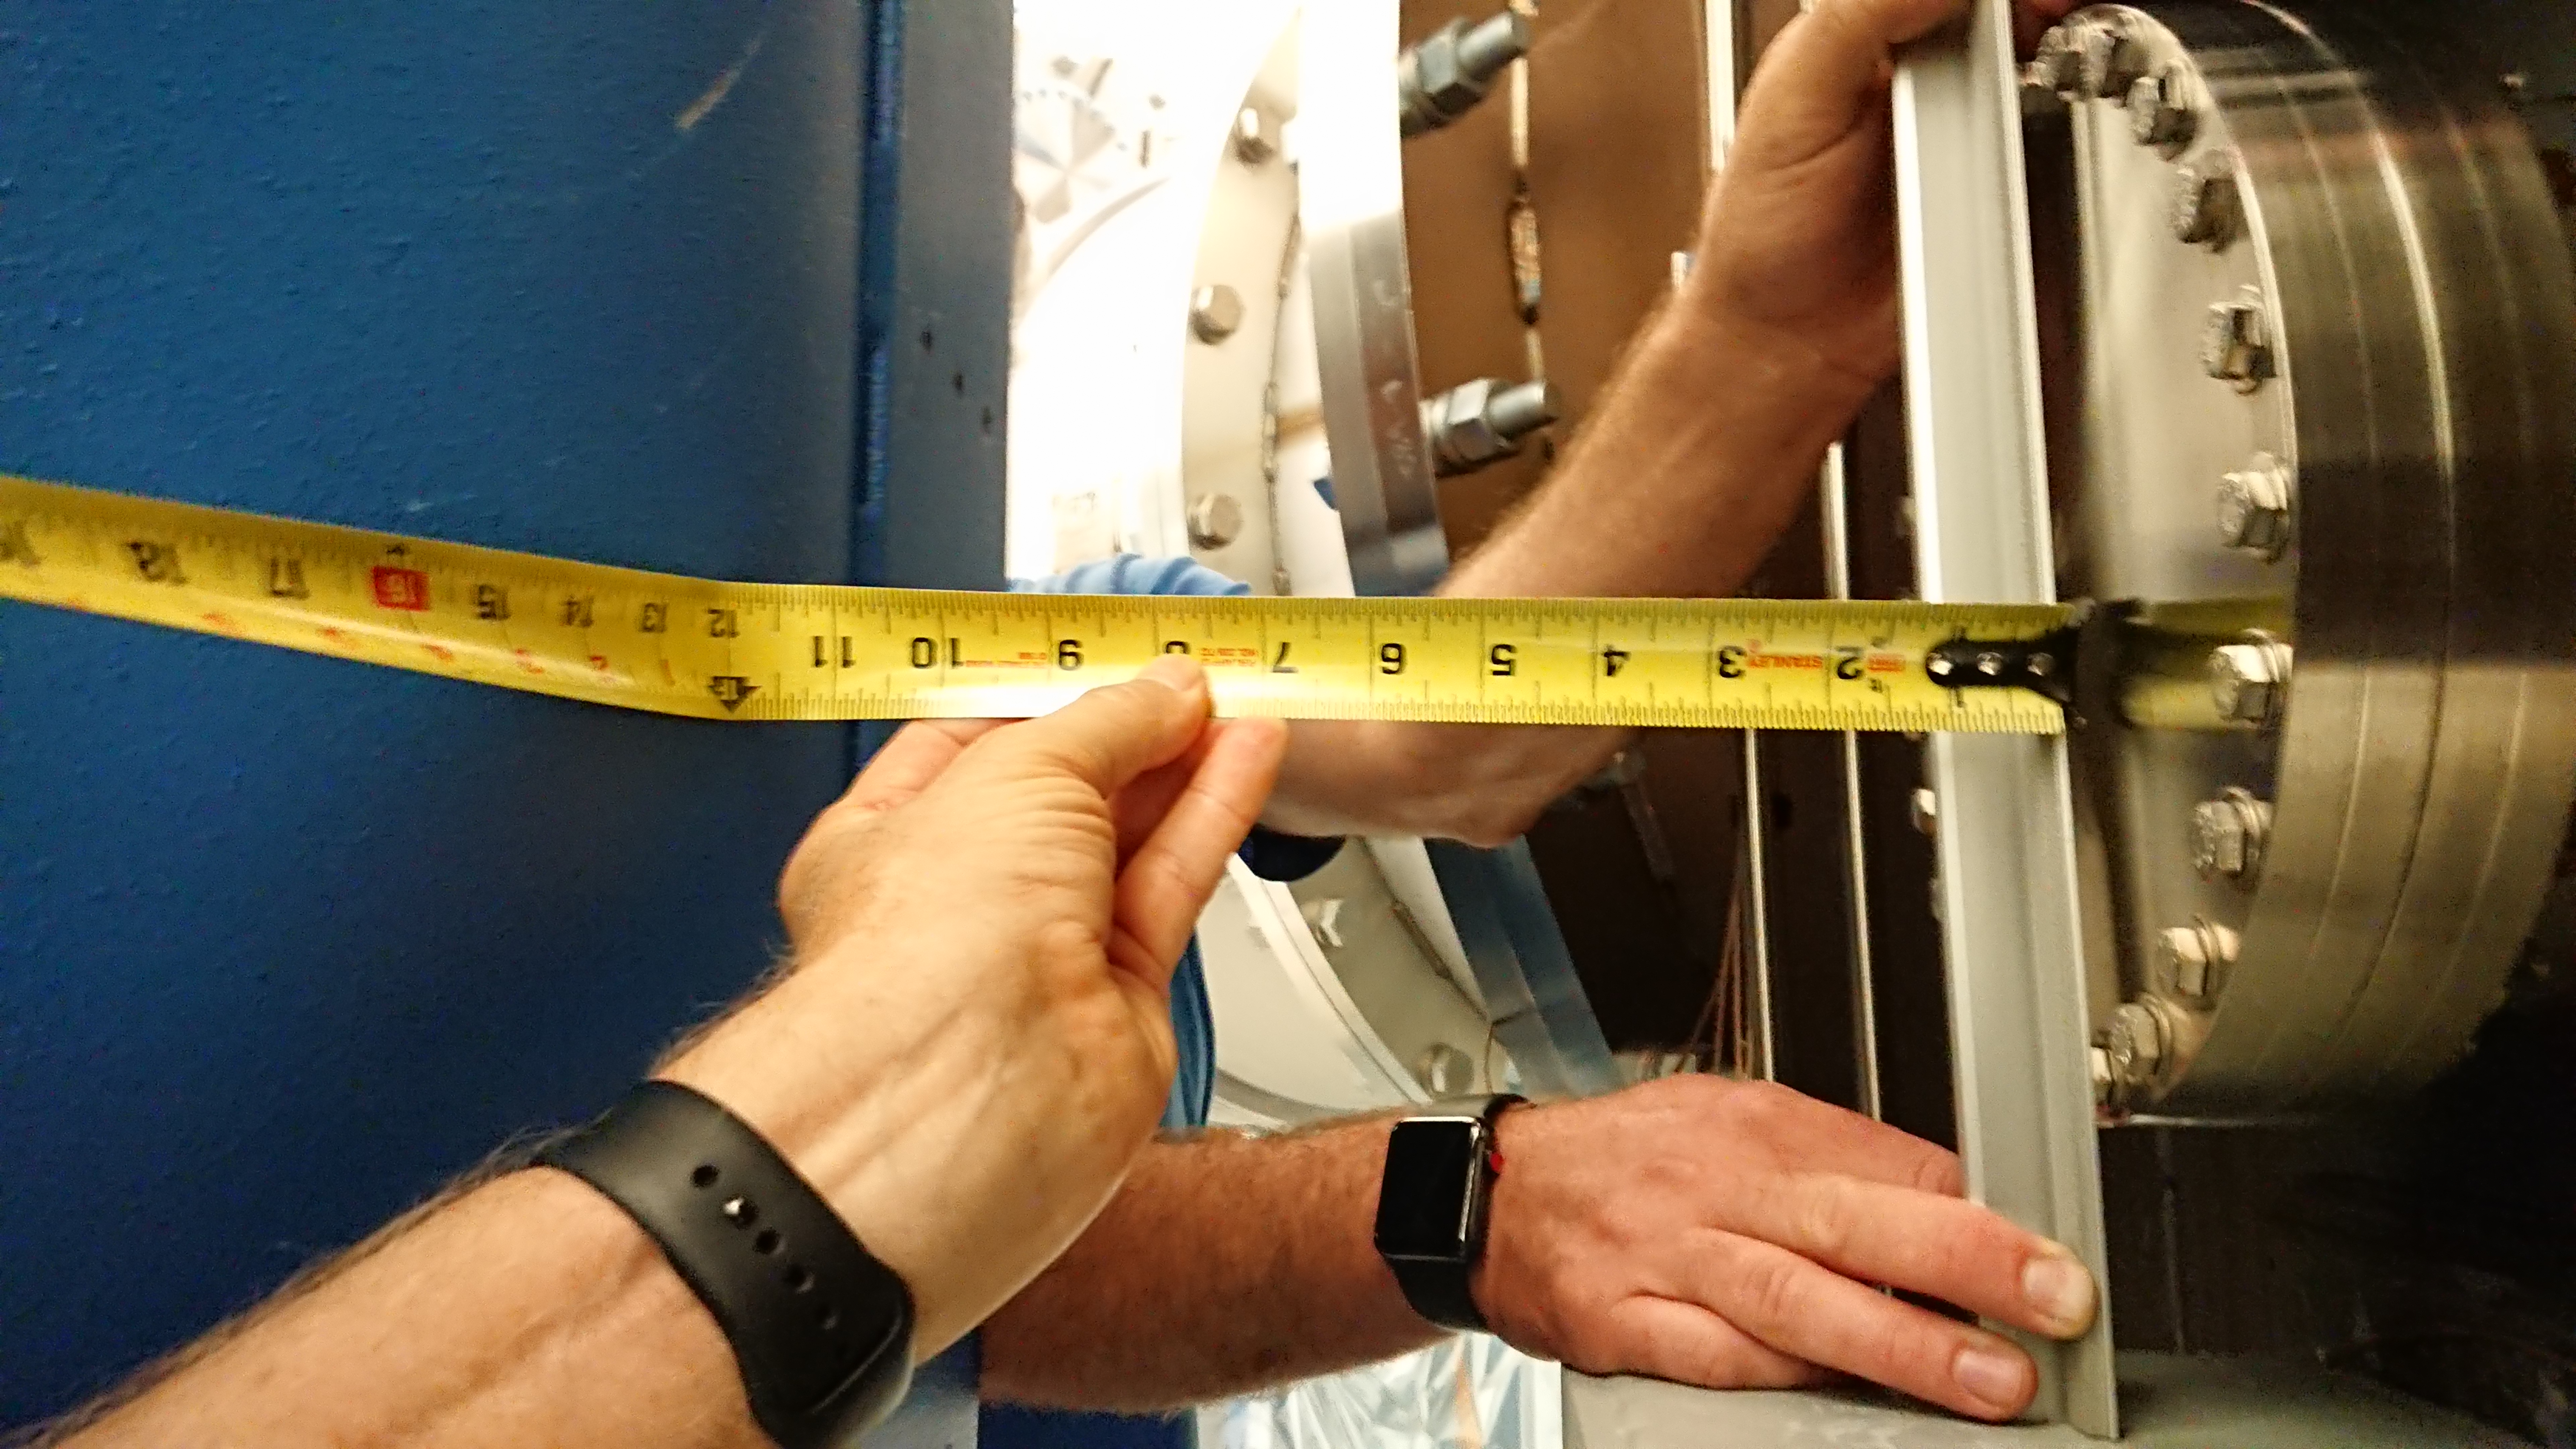
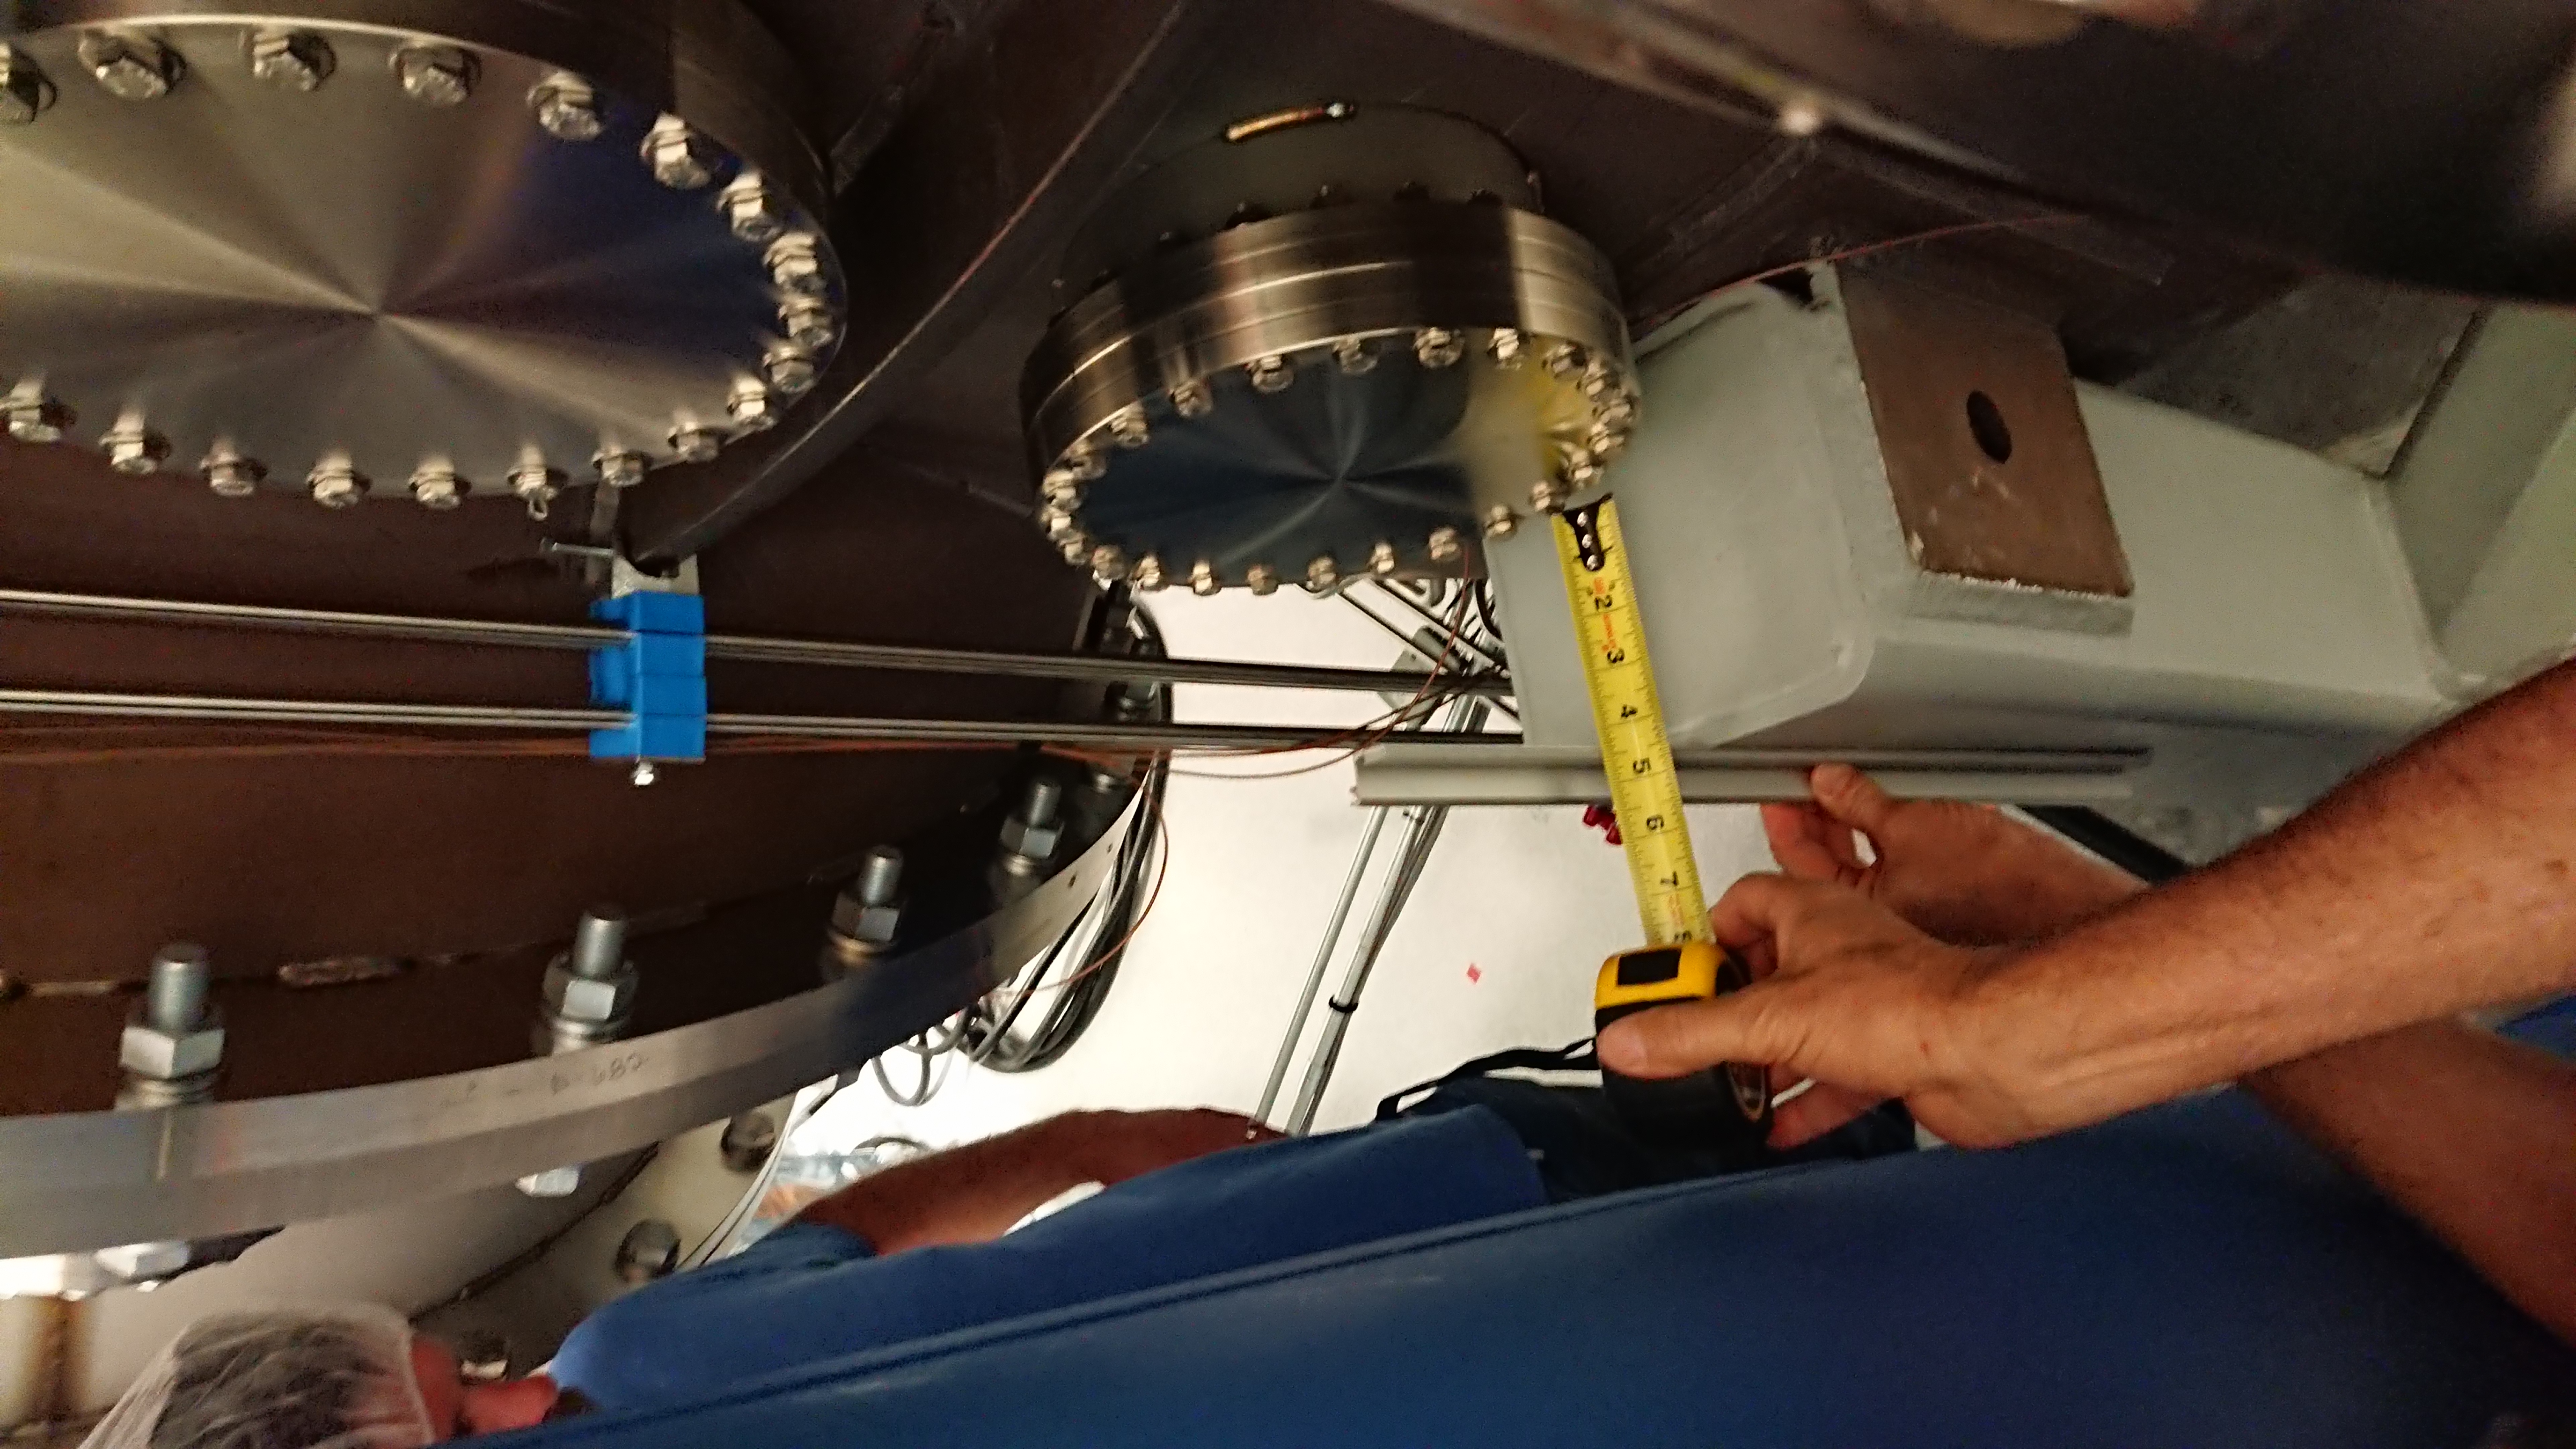
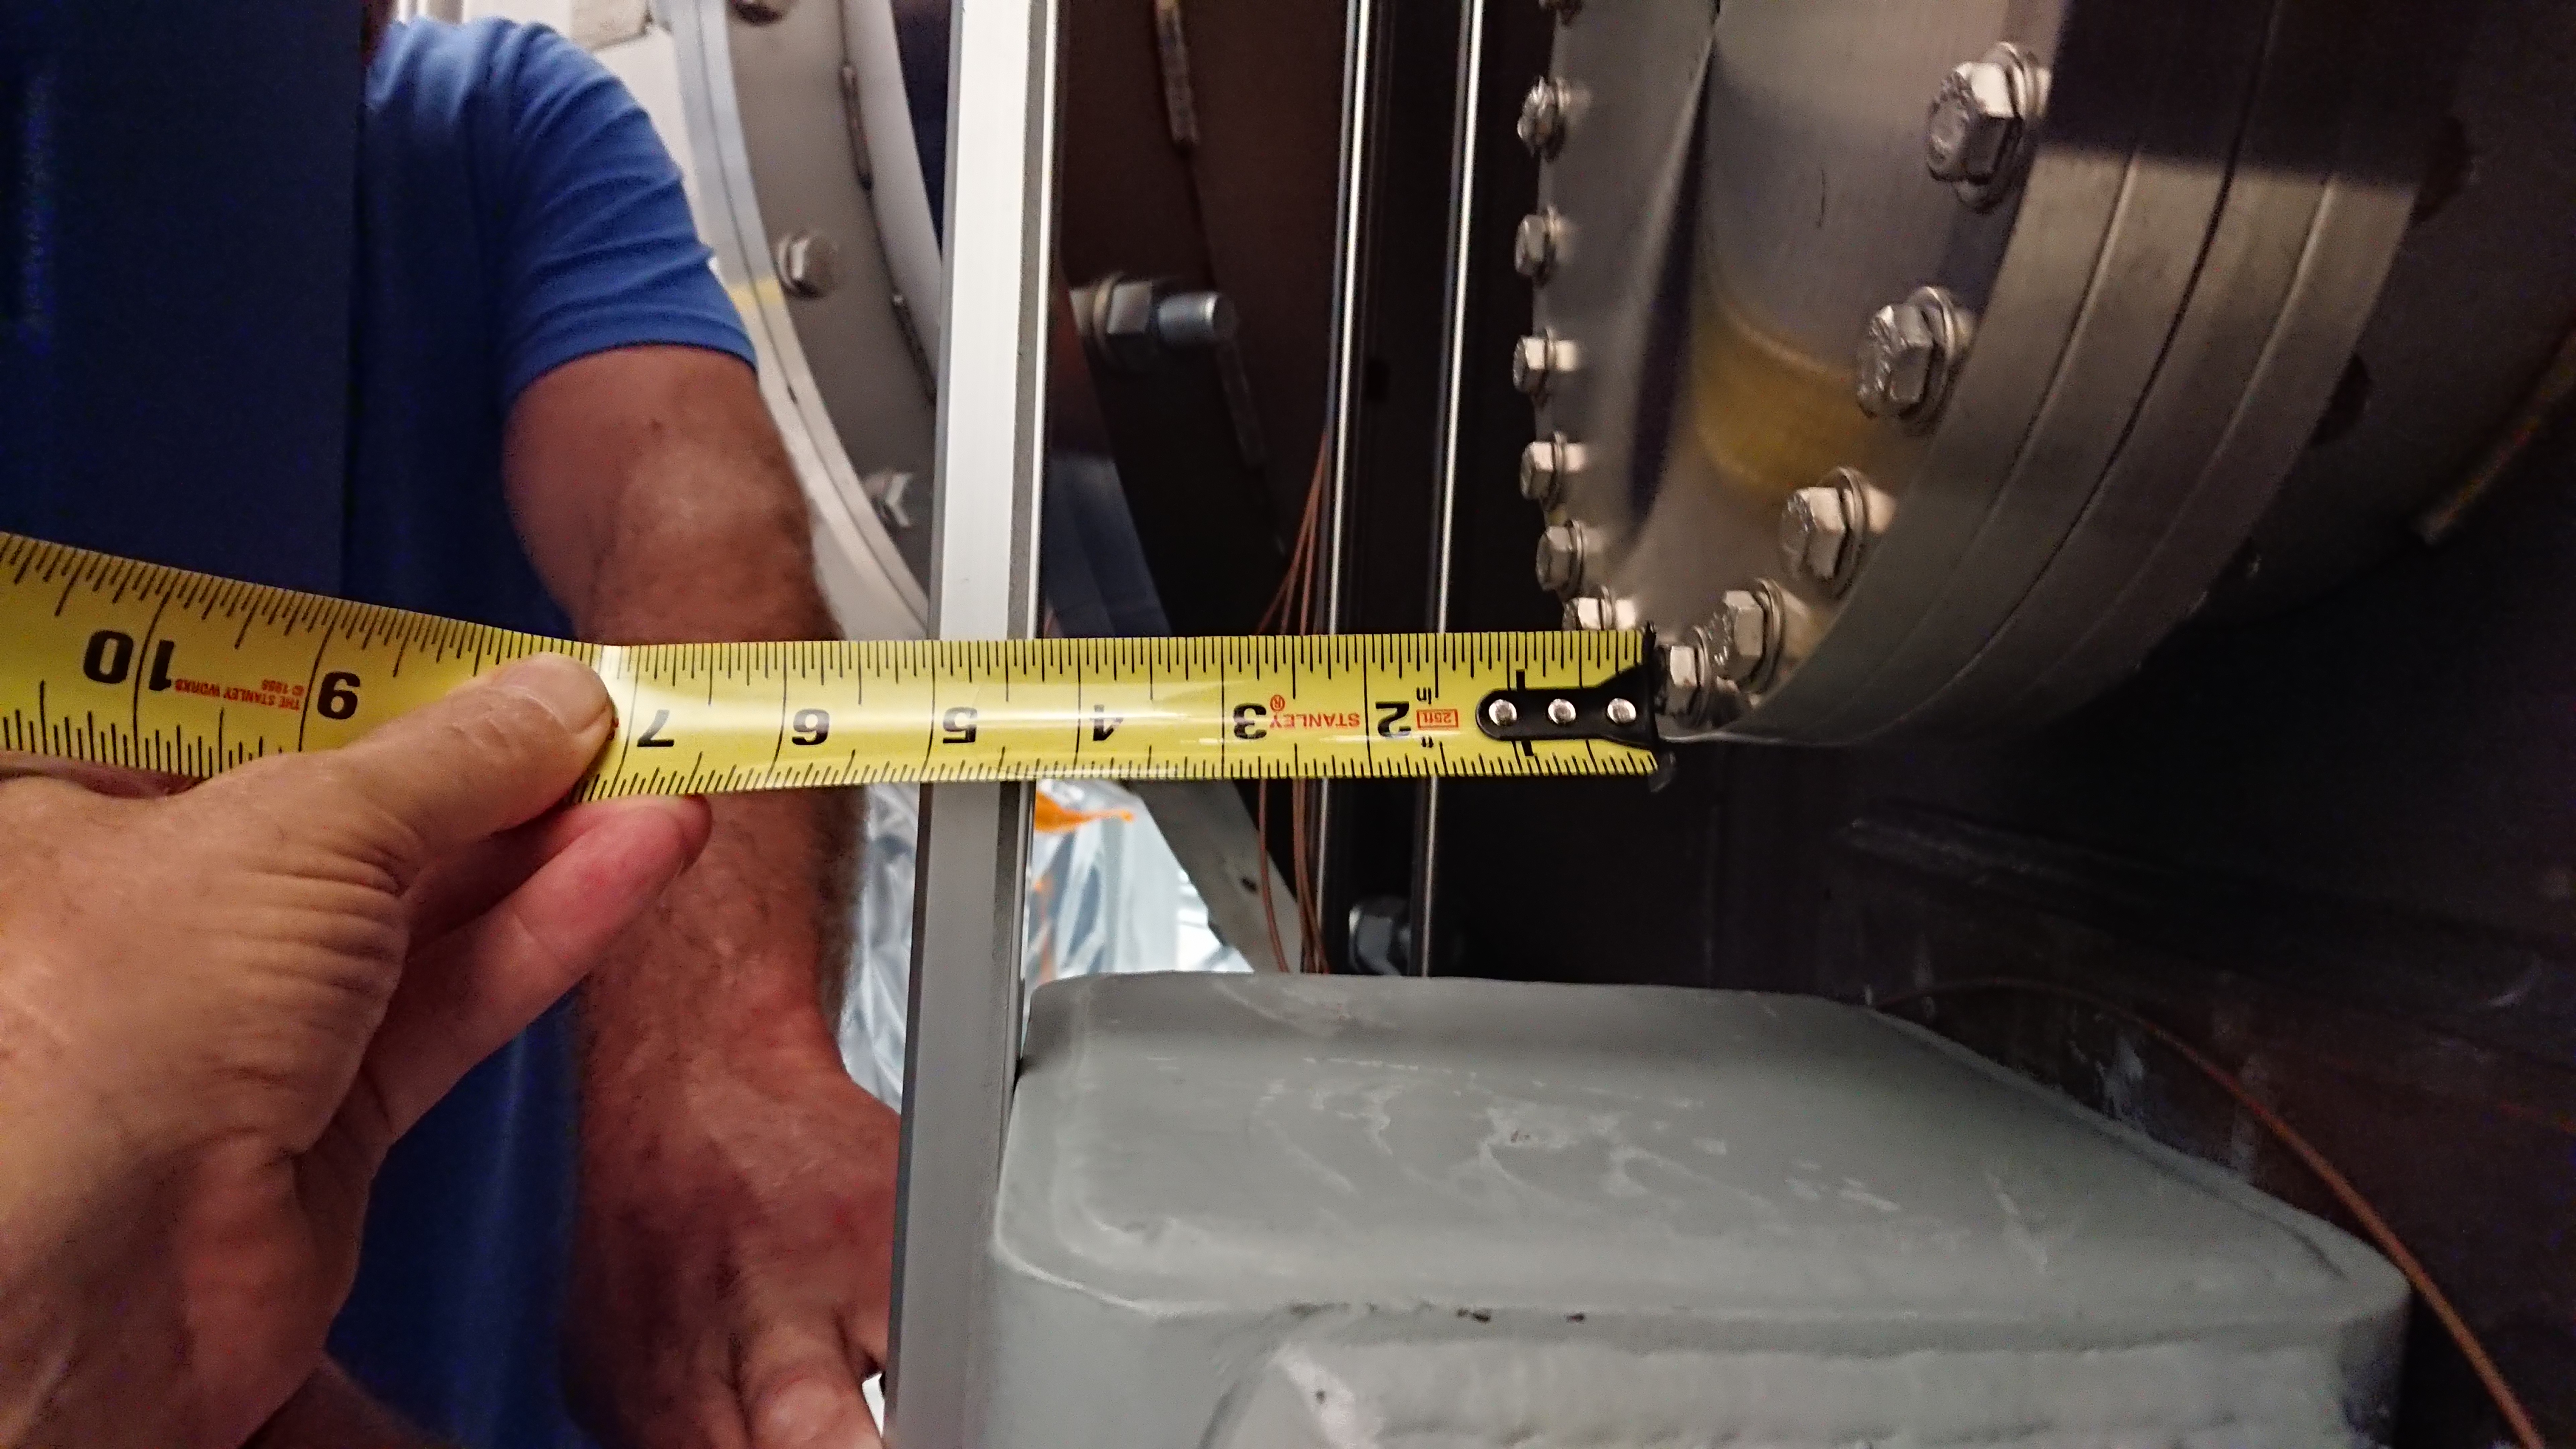
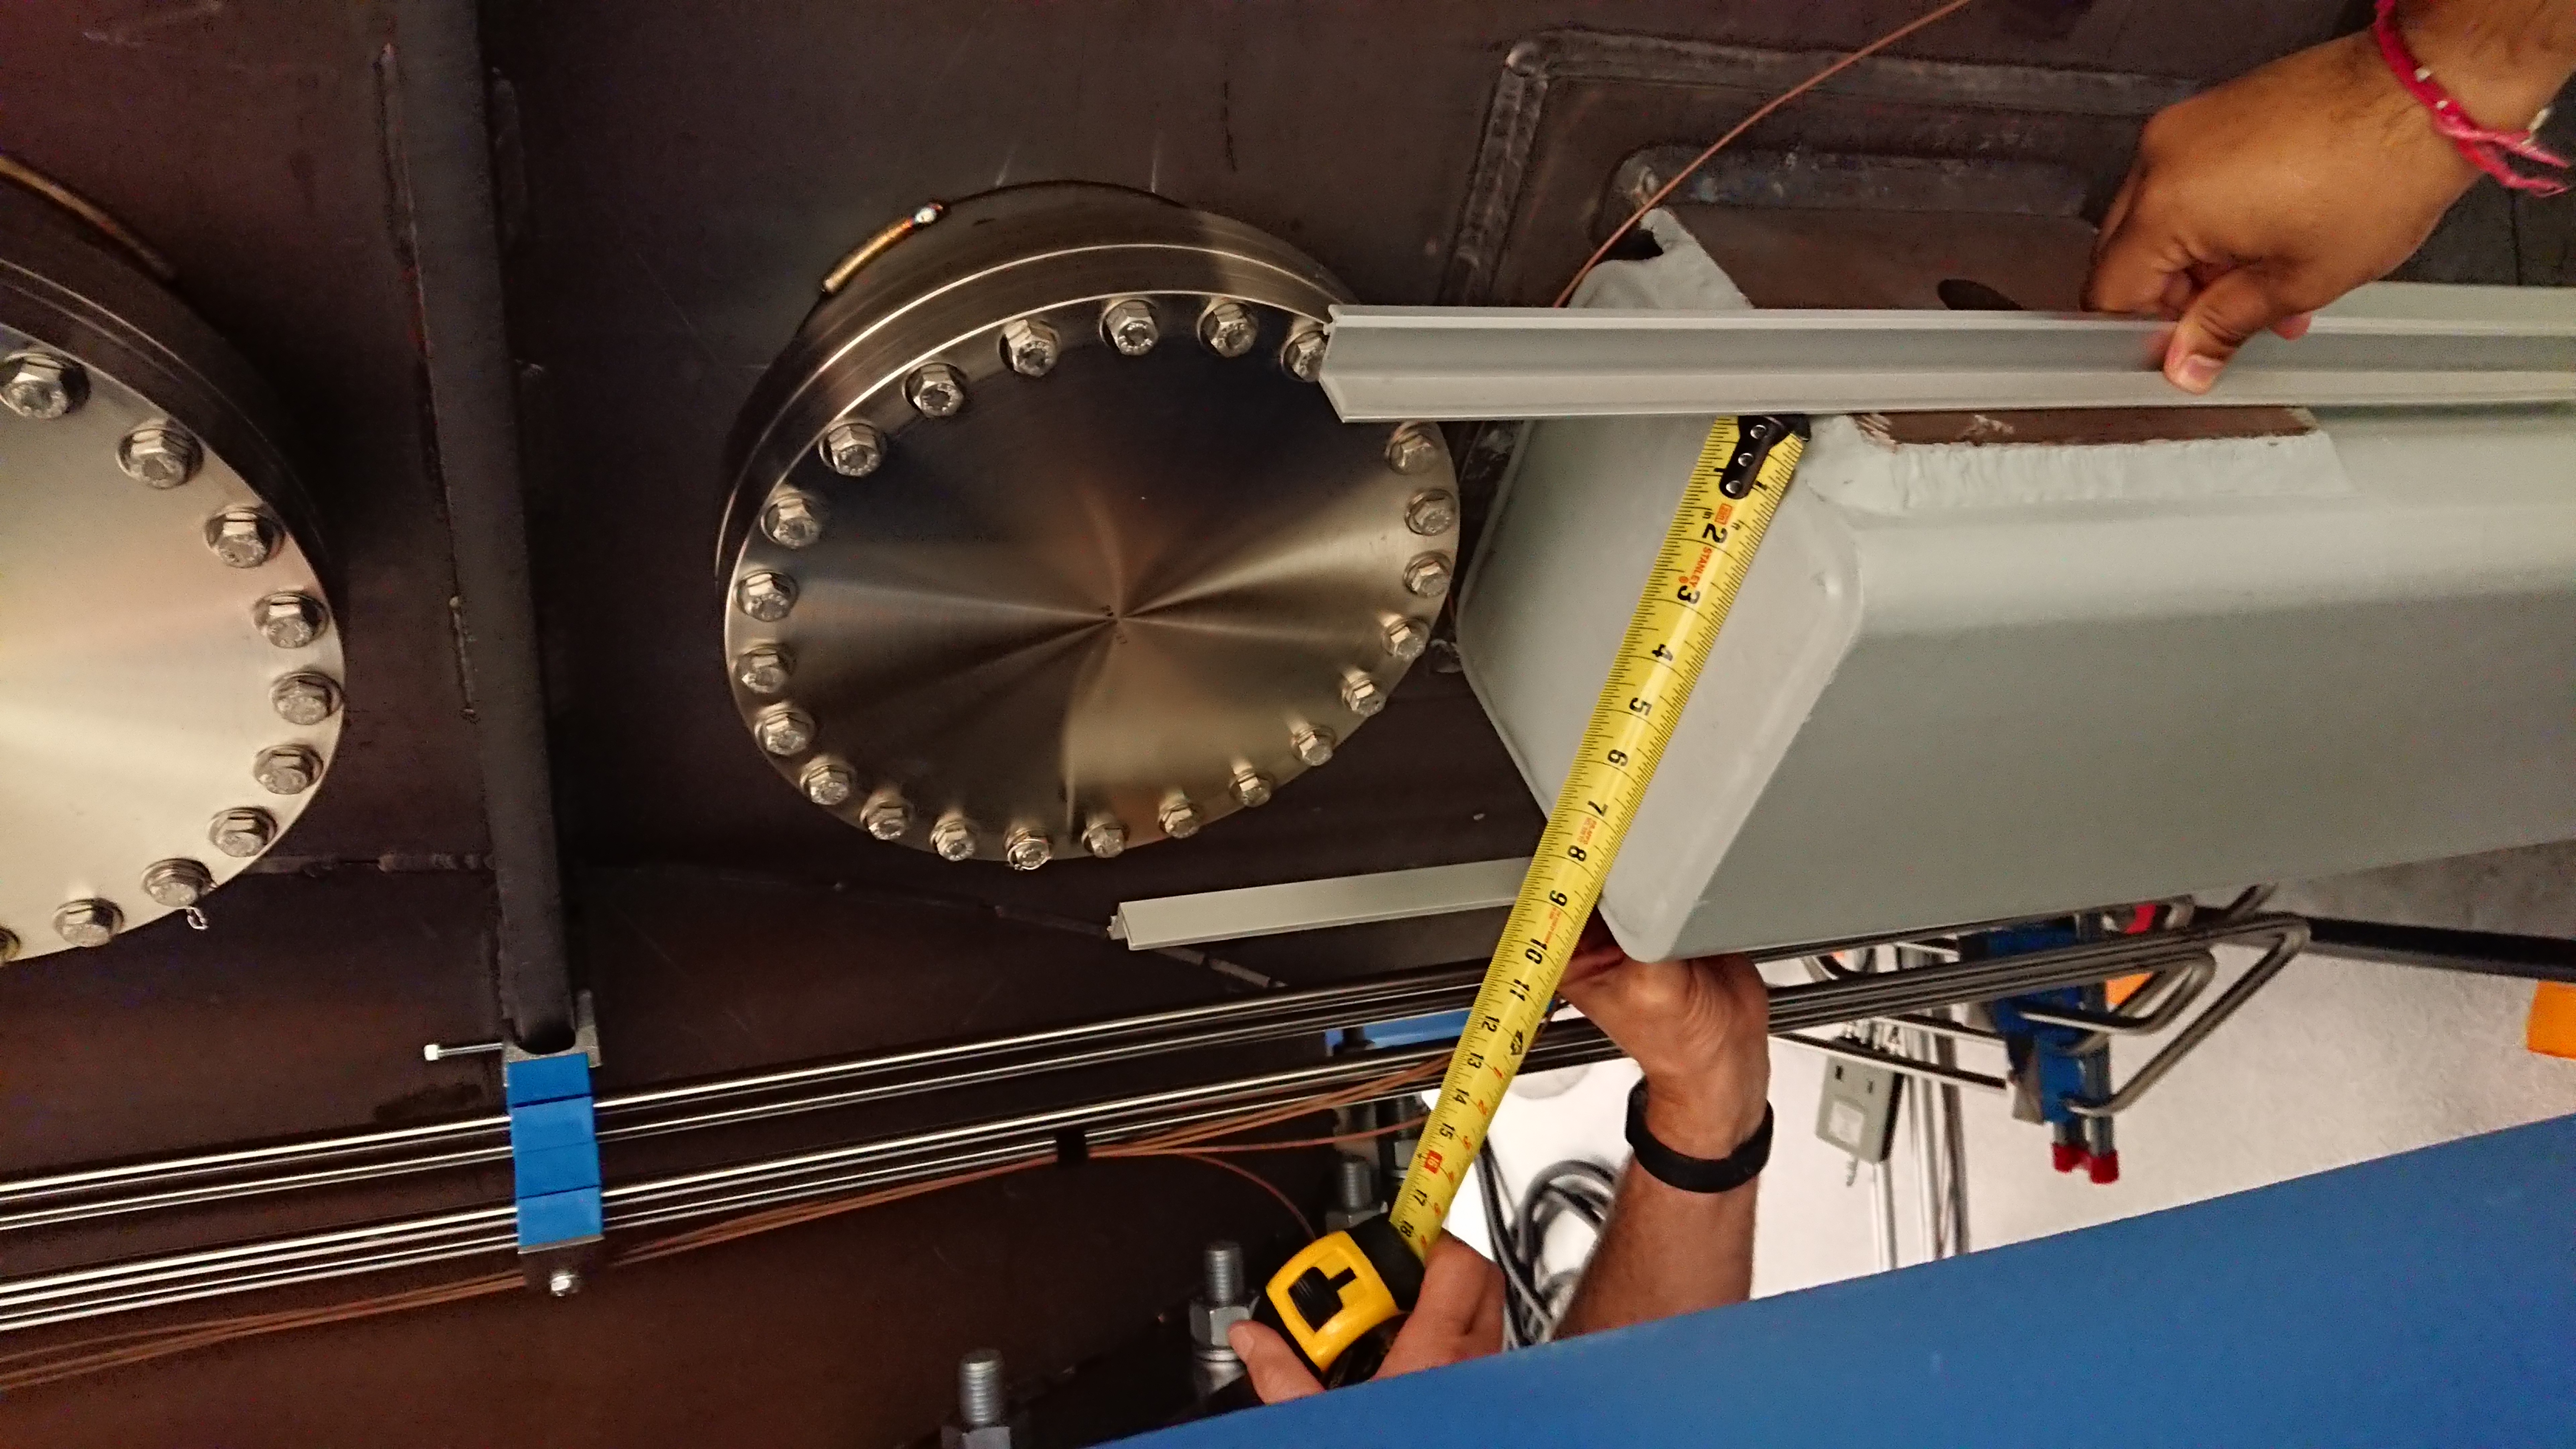
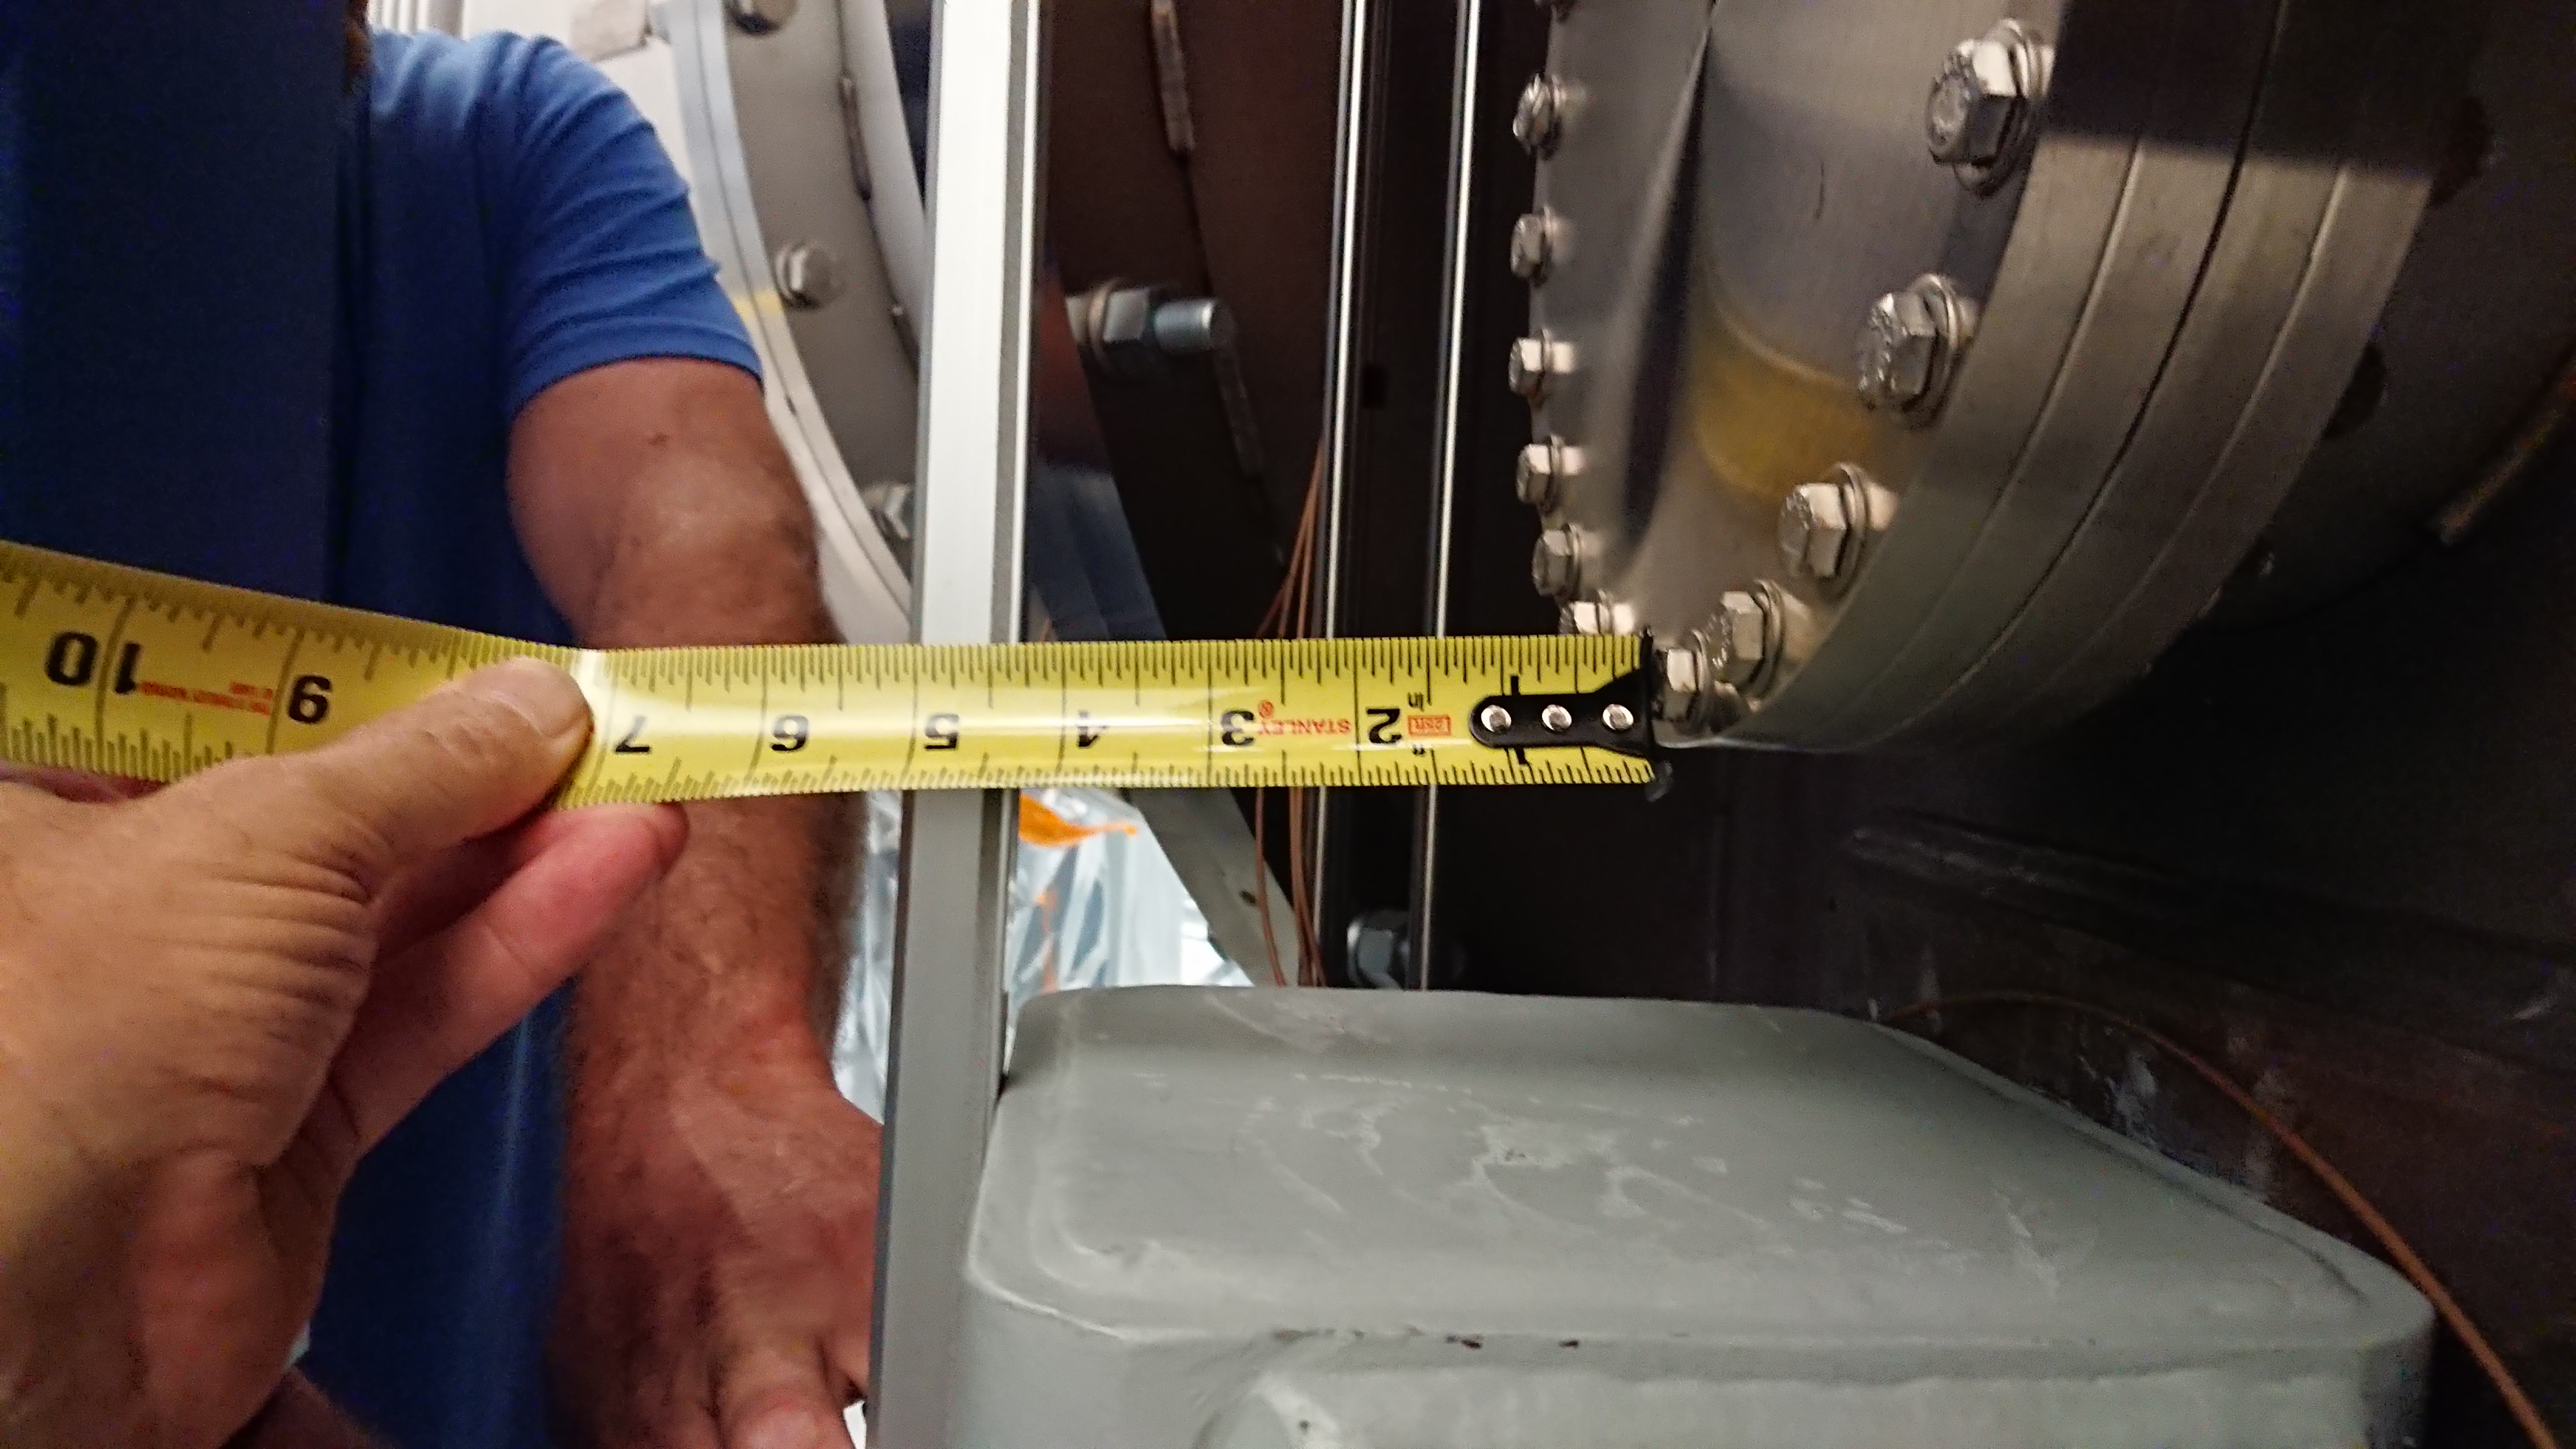
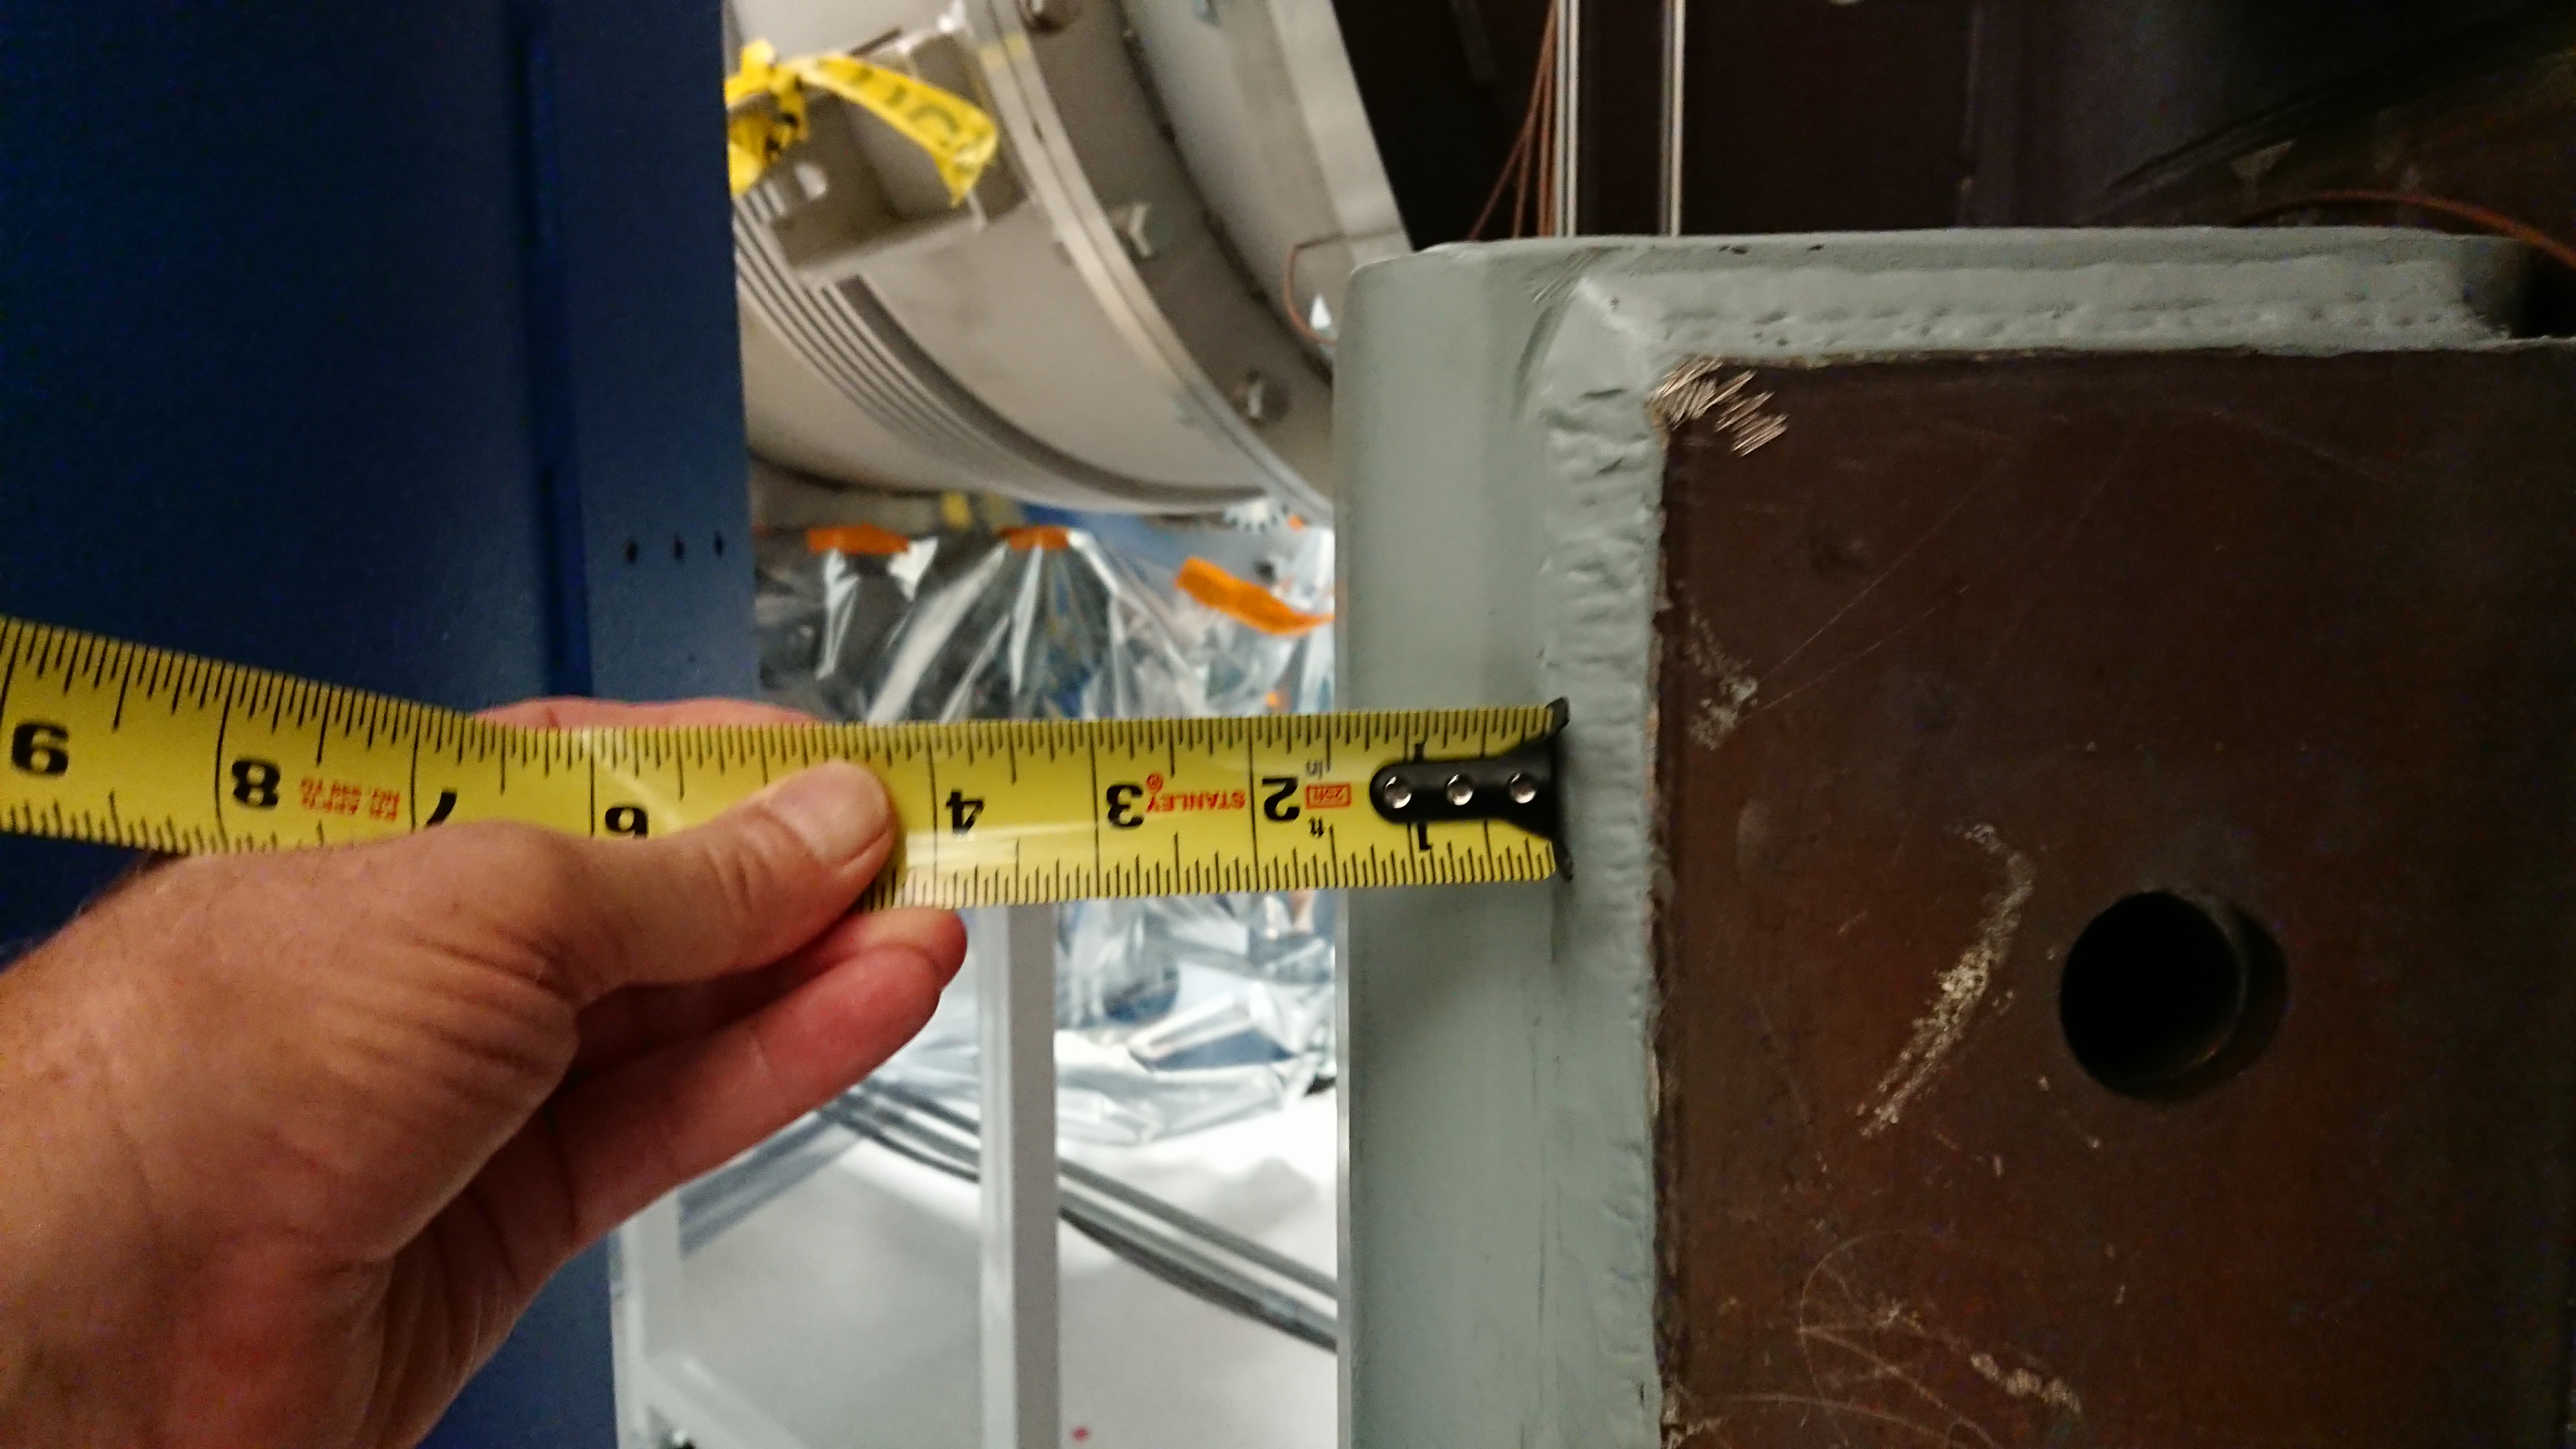
We notice that we have ~11 inches from the vacuum chamber to the HEPI pier however, there is less space than expected as there is a vacuum flange protruding from the vacuum chamber (first image - DSC_1492.JPG). Also, there is only 4.5 inches of space on the top surface of the BSC pier as a result of the vacuum flange (second image - DSC_1487.JPG). Moreover, the top surface is not as the CAD drawing depict. Instead of a flush plate with gussets in the corners, there is a square place raised up and welded (third image - DSC_1500.JPG). In addition, there are 2 extra steel plates on the sides of the BSC pier that are untreated (not painted) that are not present in the CAD drawings this extra room is required in the NCAL mount to accommodate for this (fourth image - DSC_1482.JPG) this, increasing the thickness of the side wall that we have to drill though. The weld due to the side plates will interfere with the current proposed positions for the NCAL mount (fifth image - DSC_1498.JPG and sixth image - DSC_1478.JPG).
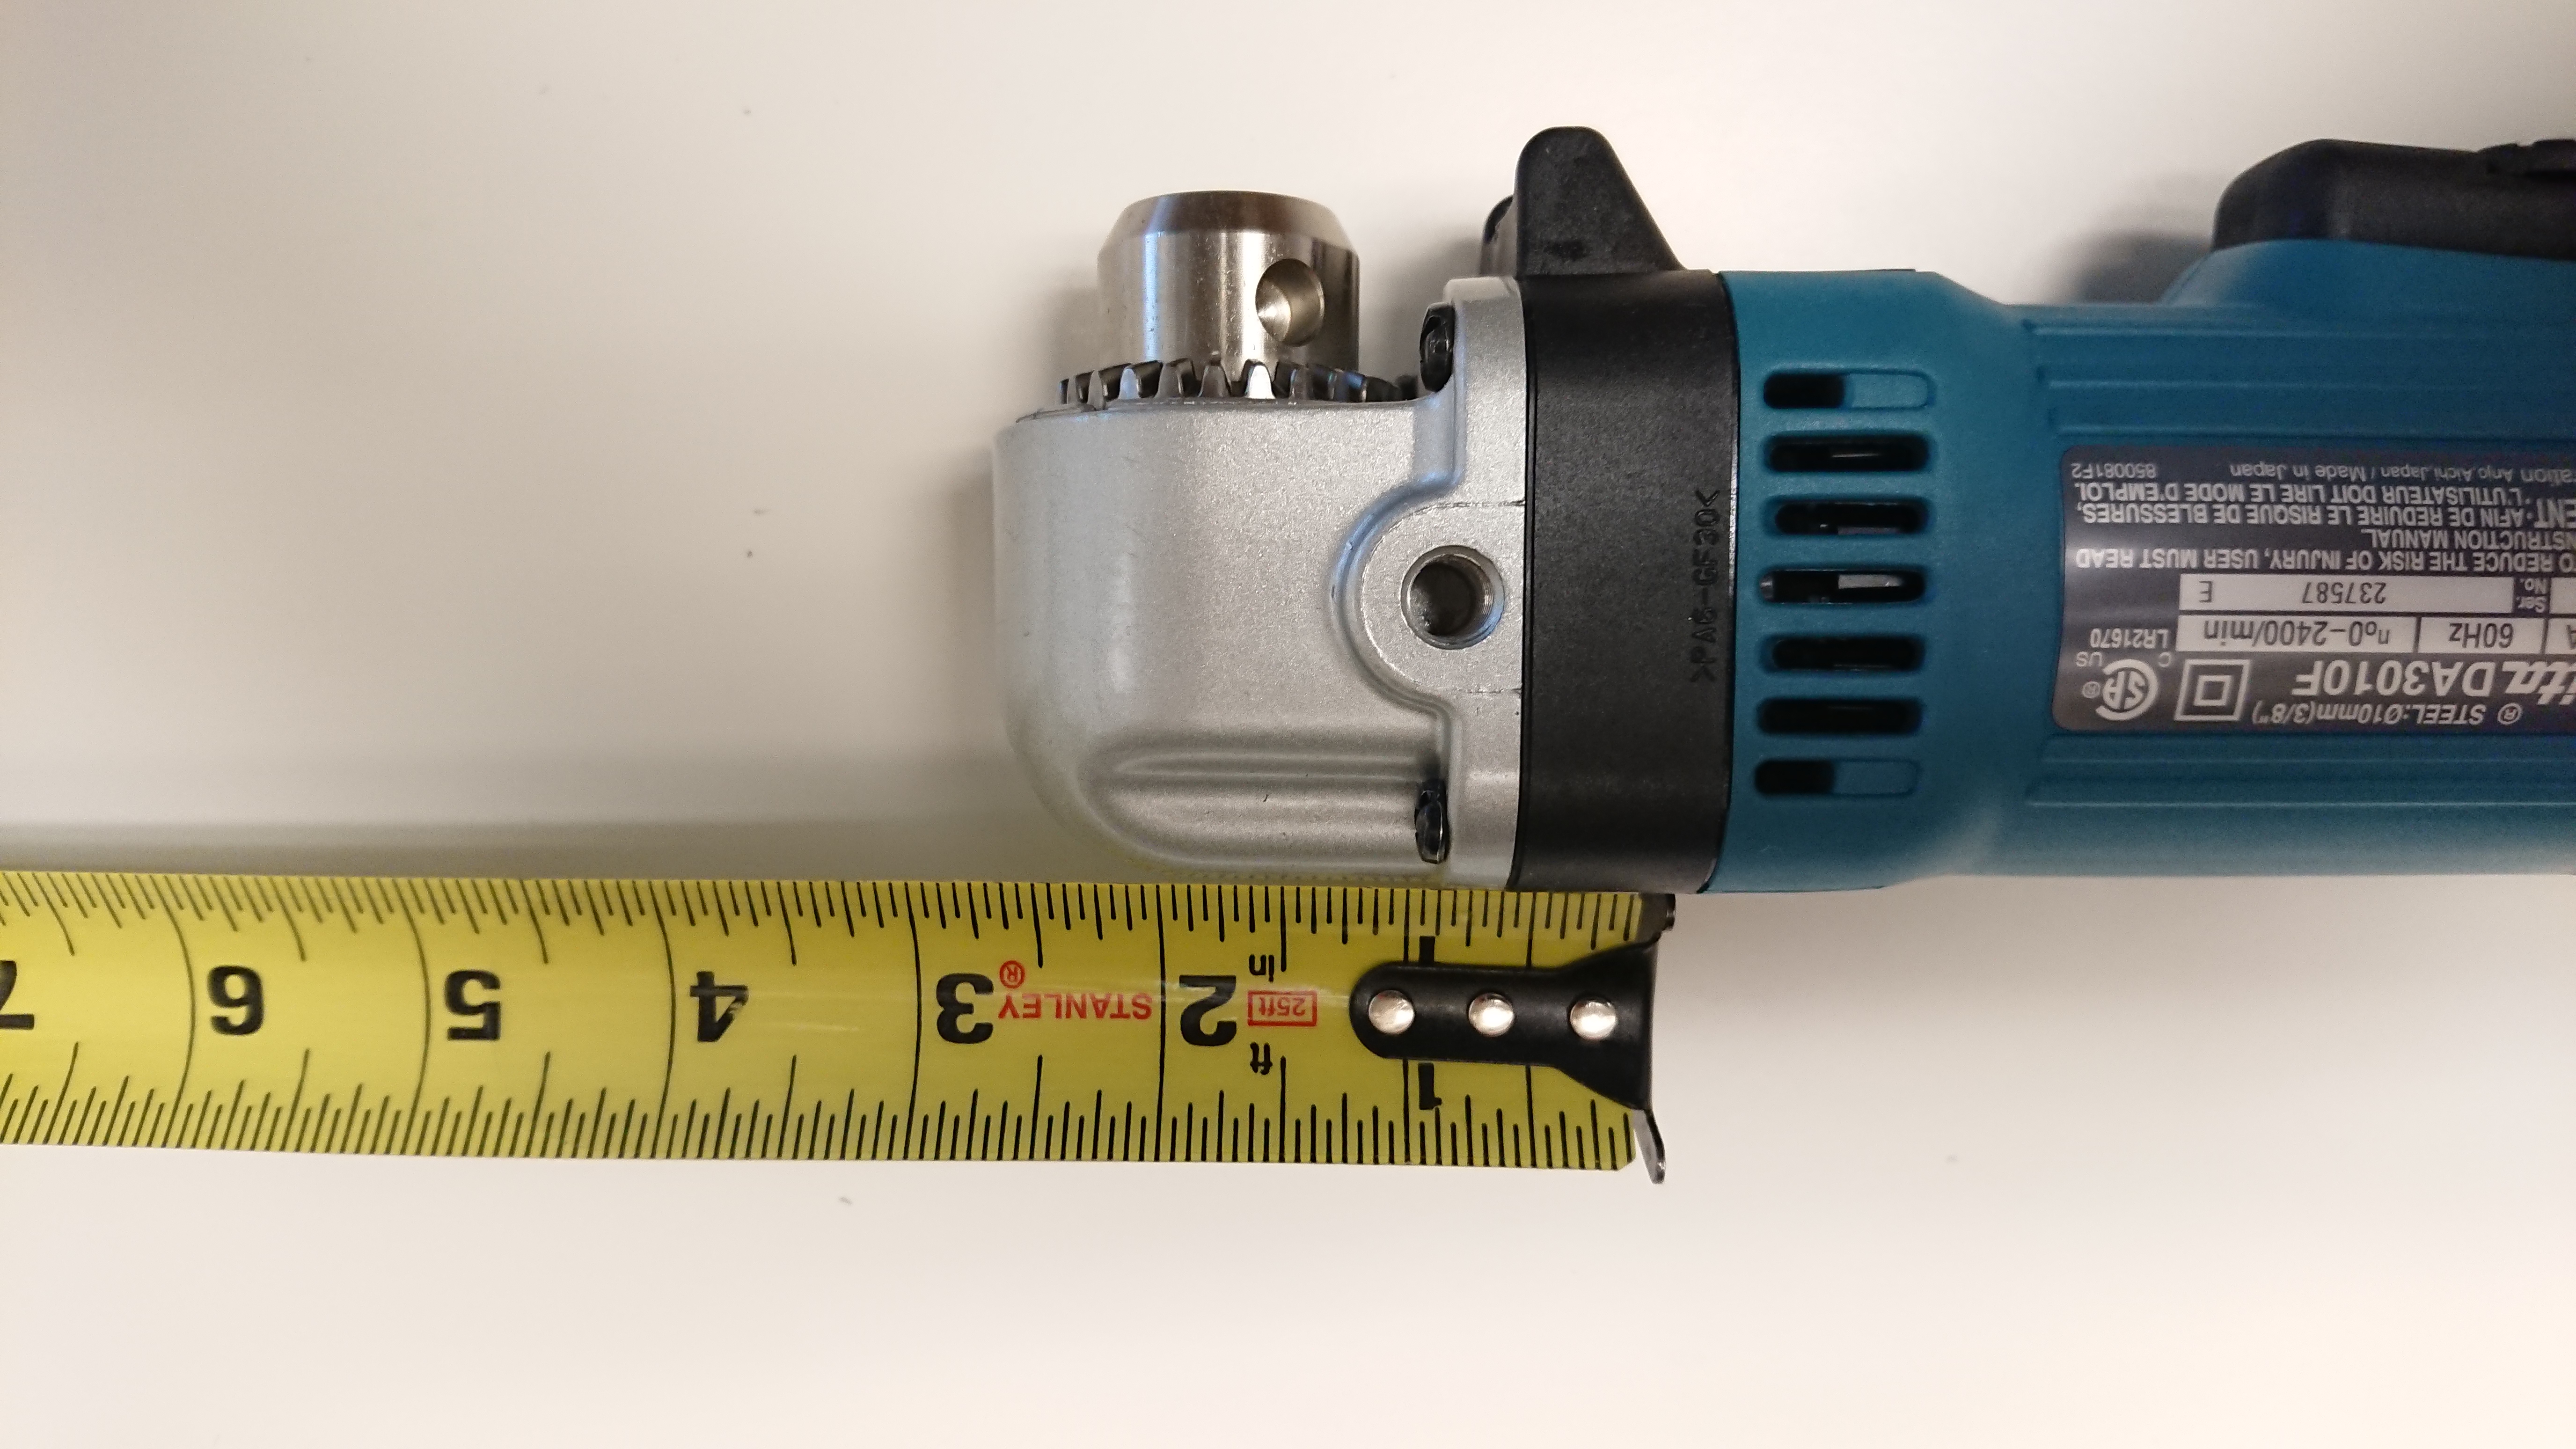
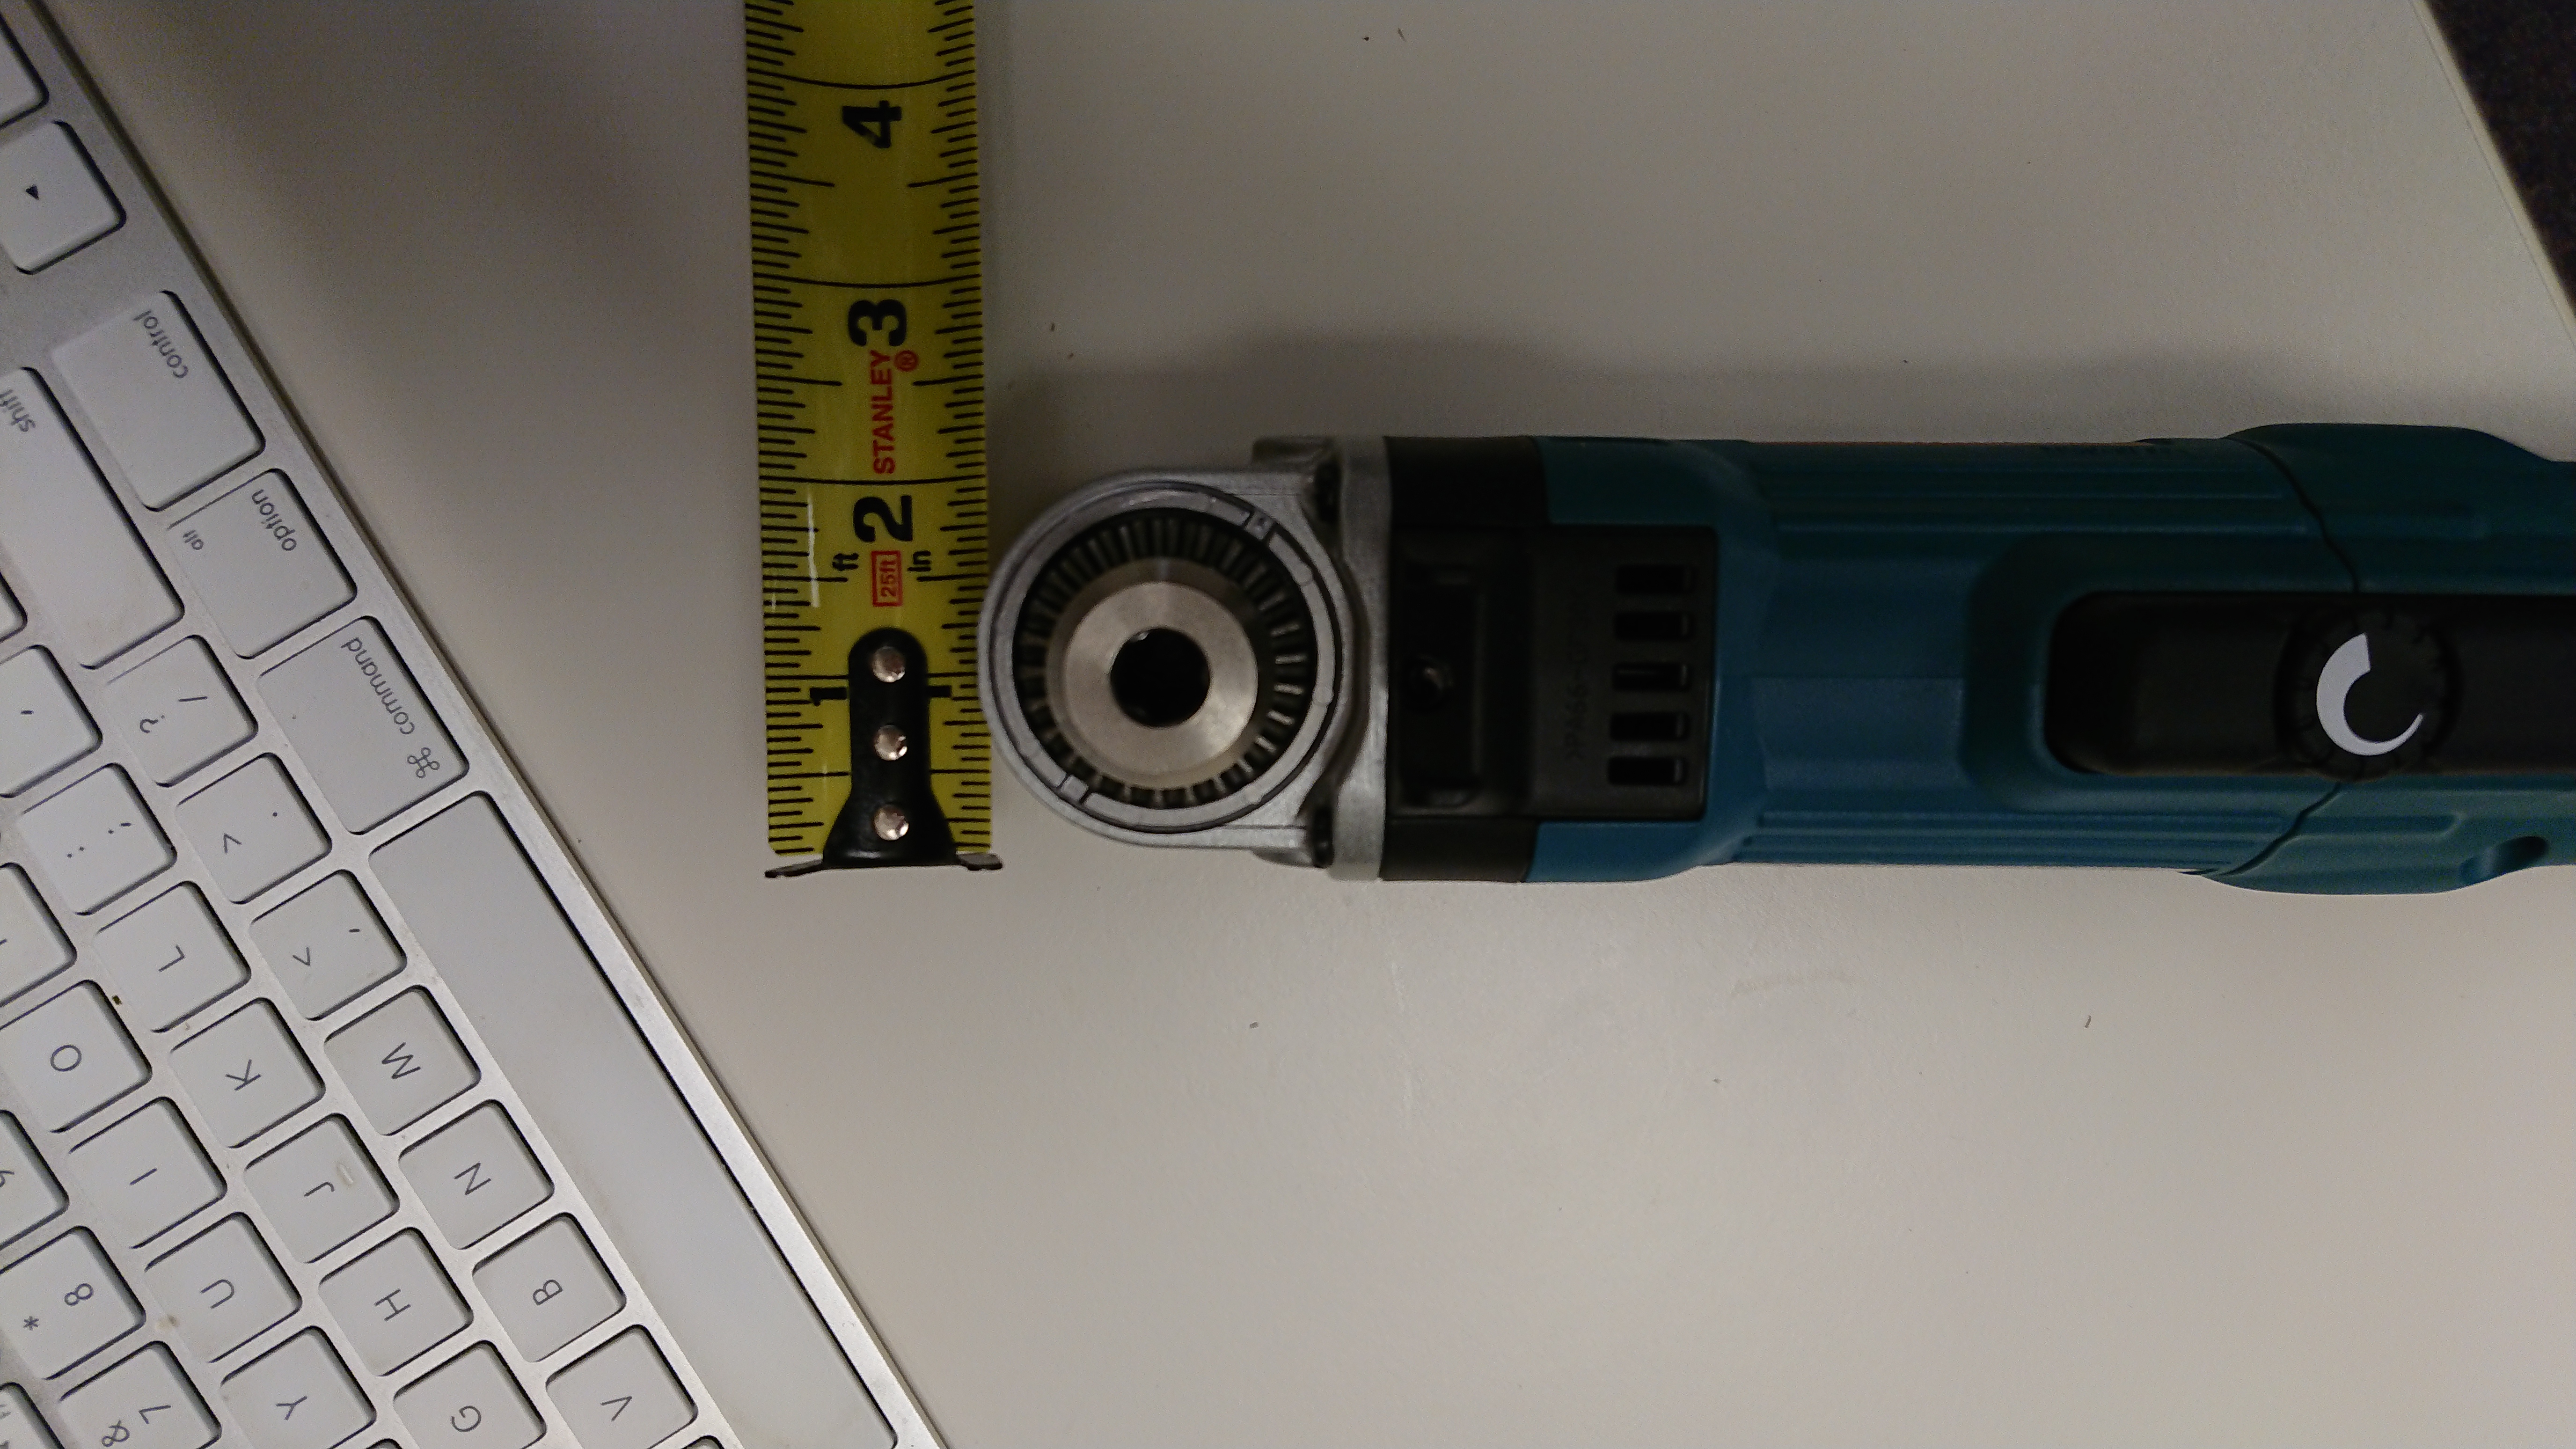
We have also found that the 90 degree angled drill we inteded to use will not be suitable for this job as it is a snug fit to get the drill into the space, without any drill bits in it. We will order a lower profile drill that will be capable of drilling into the mild steel pier.
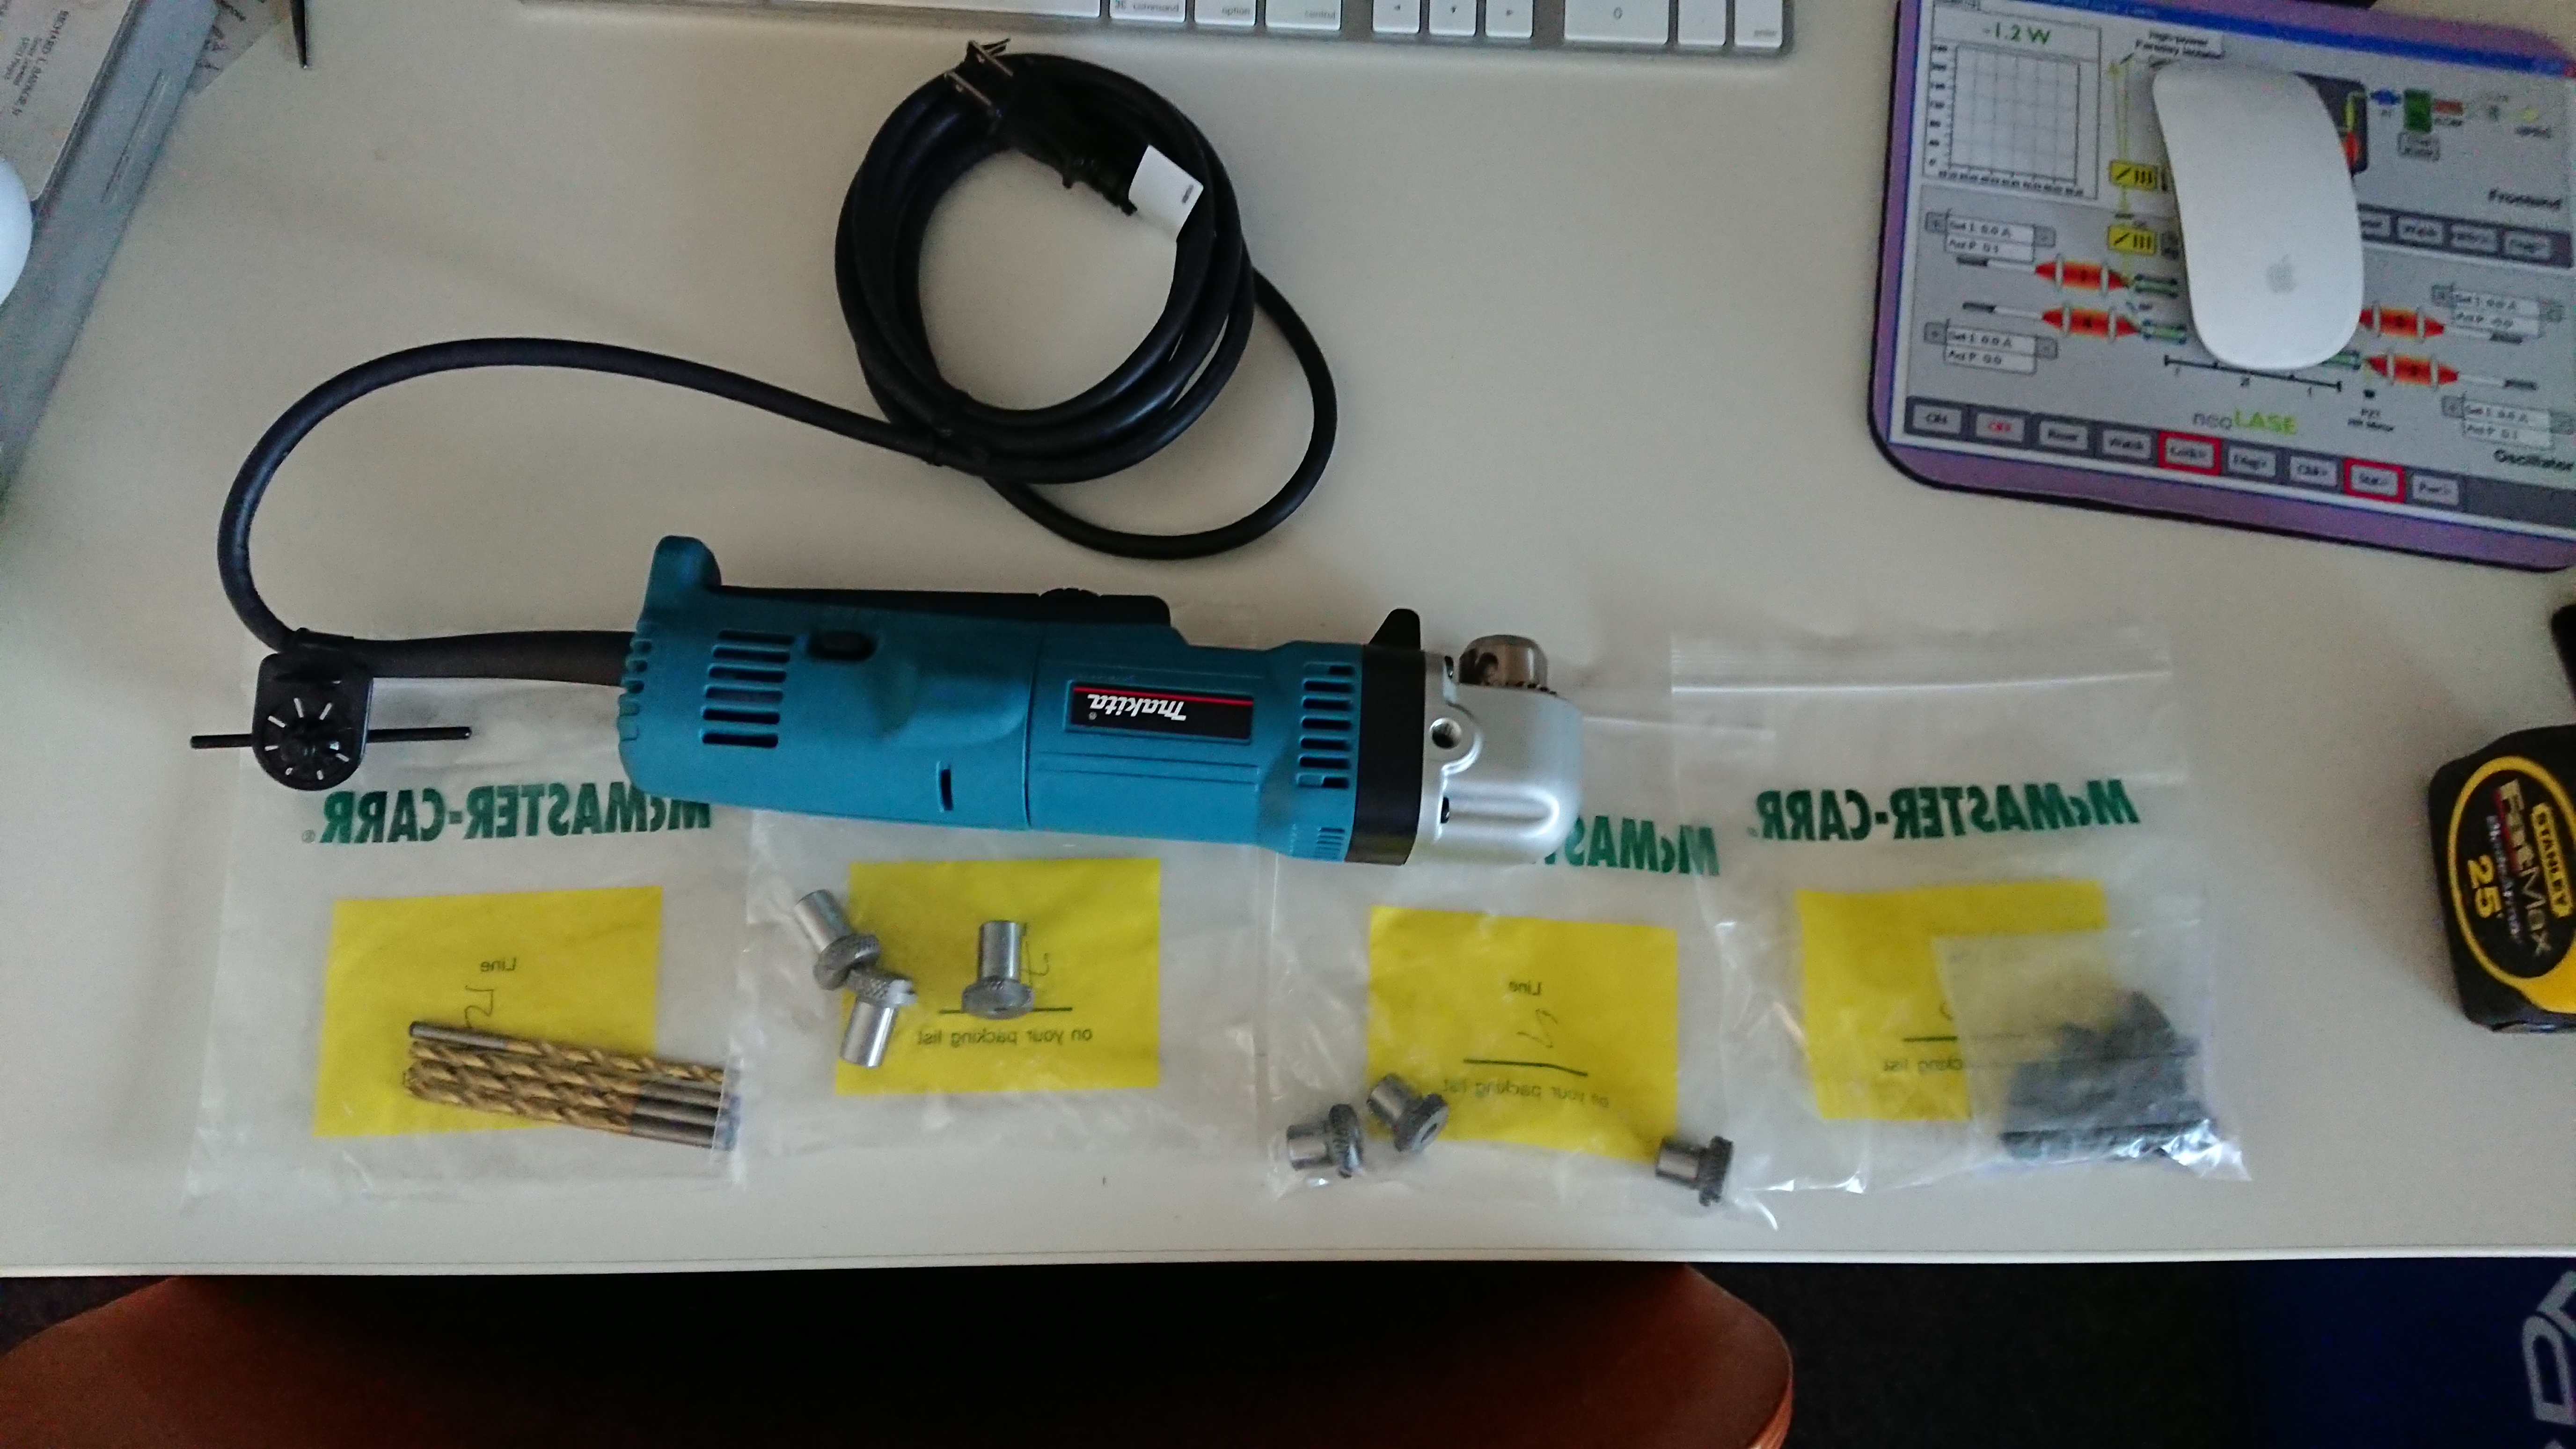
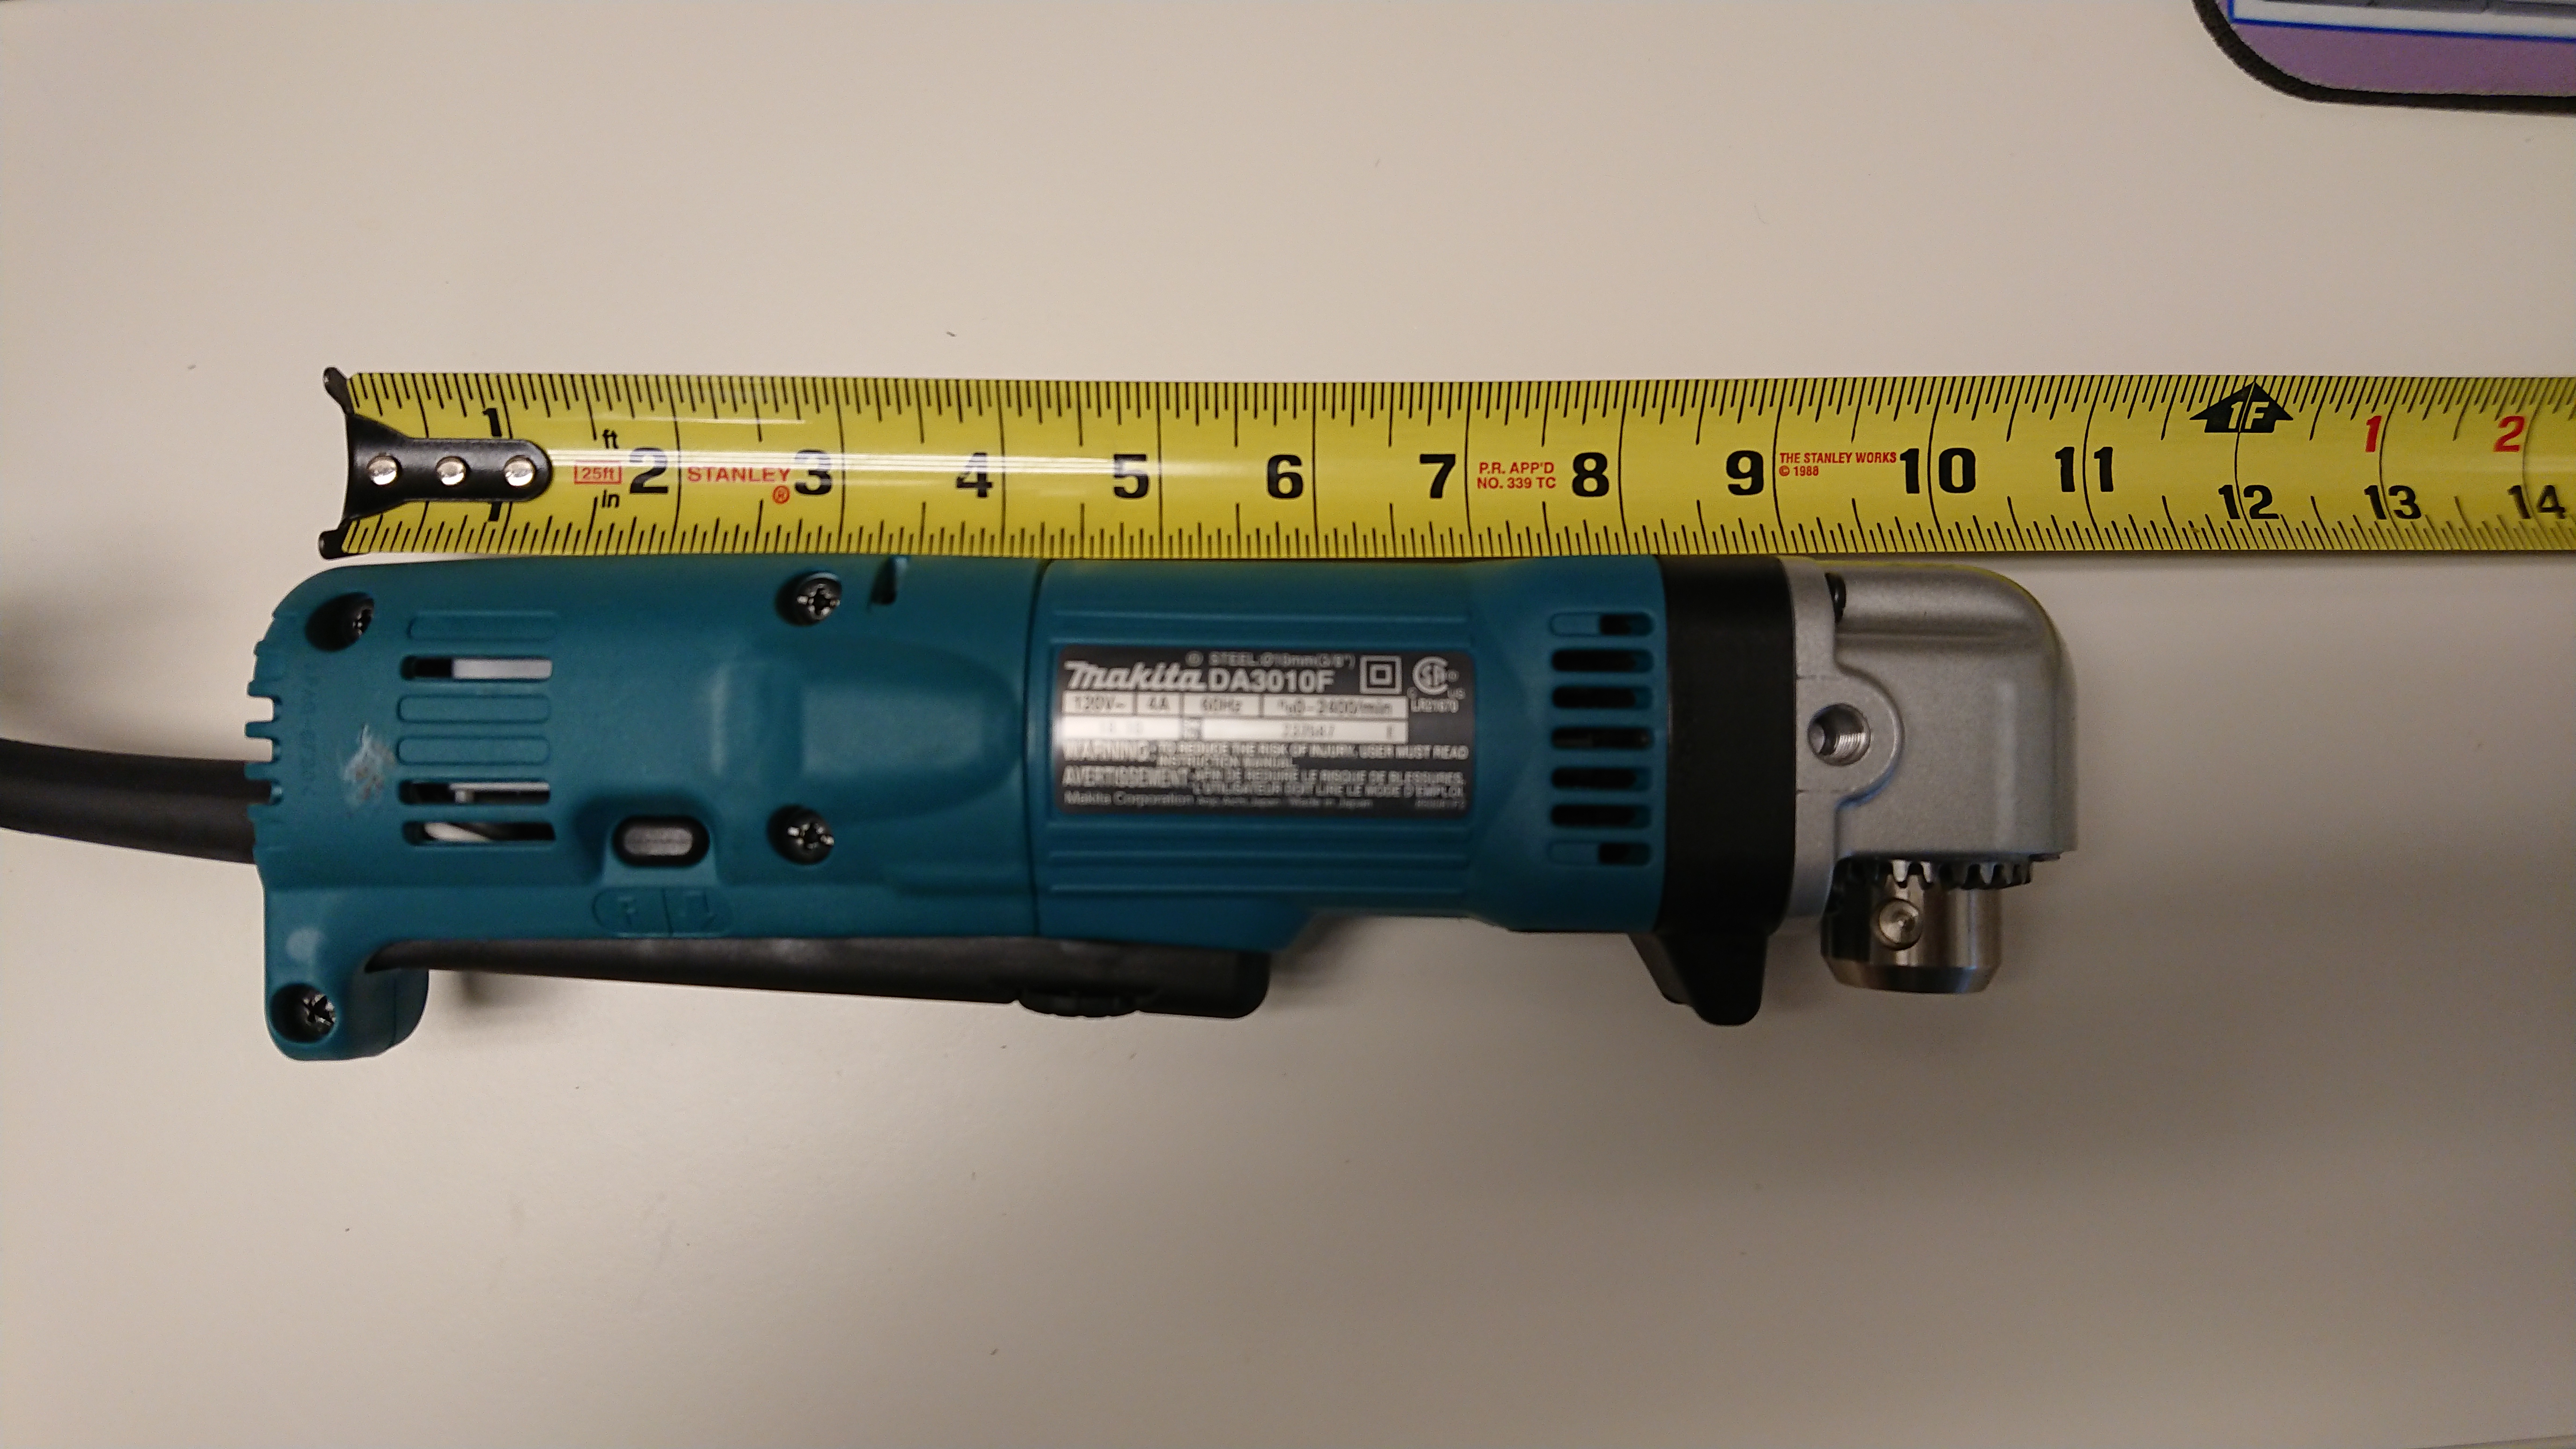
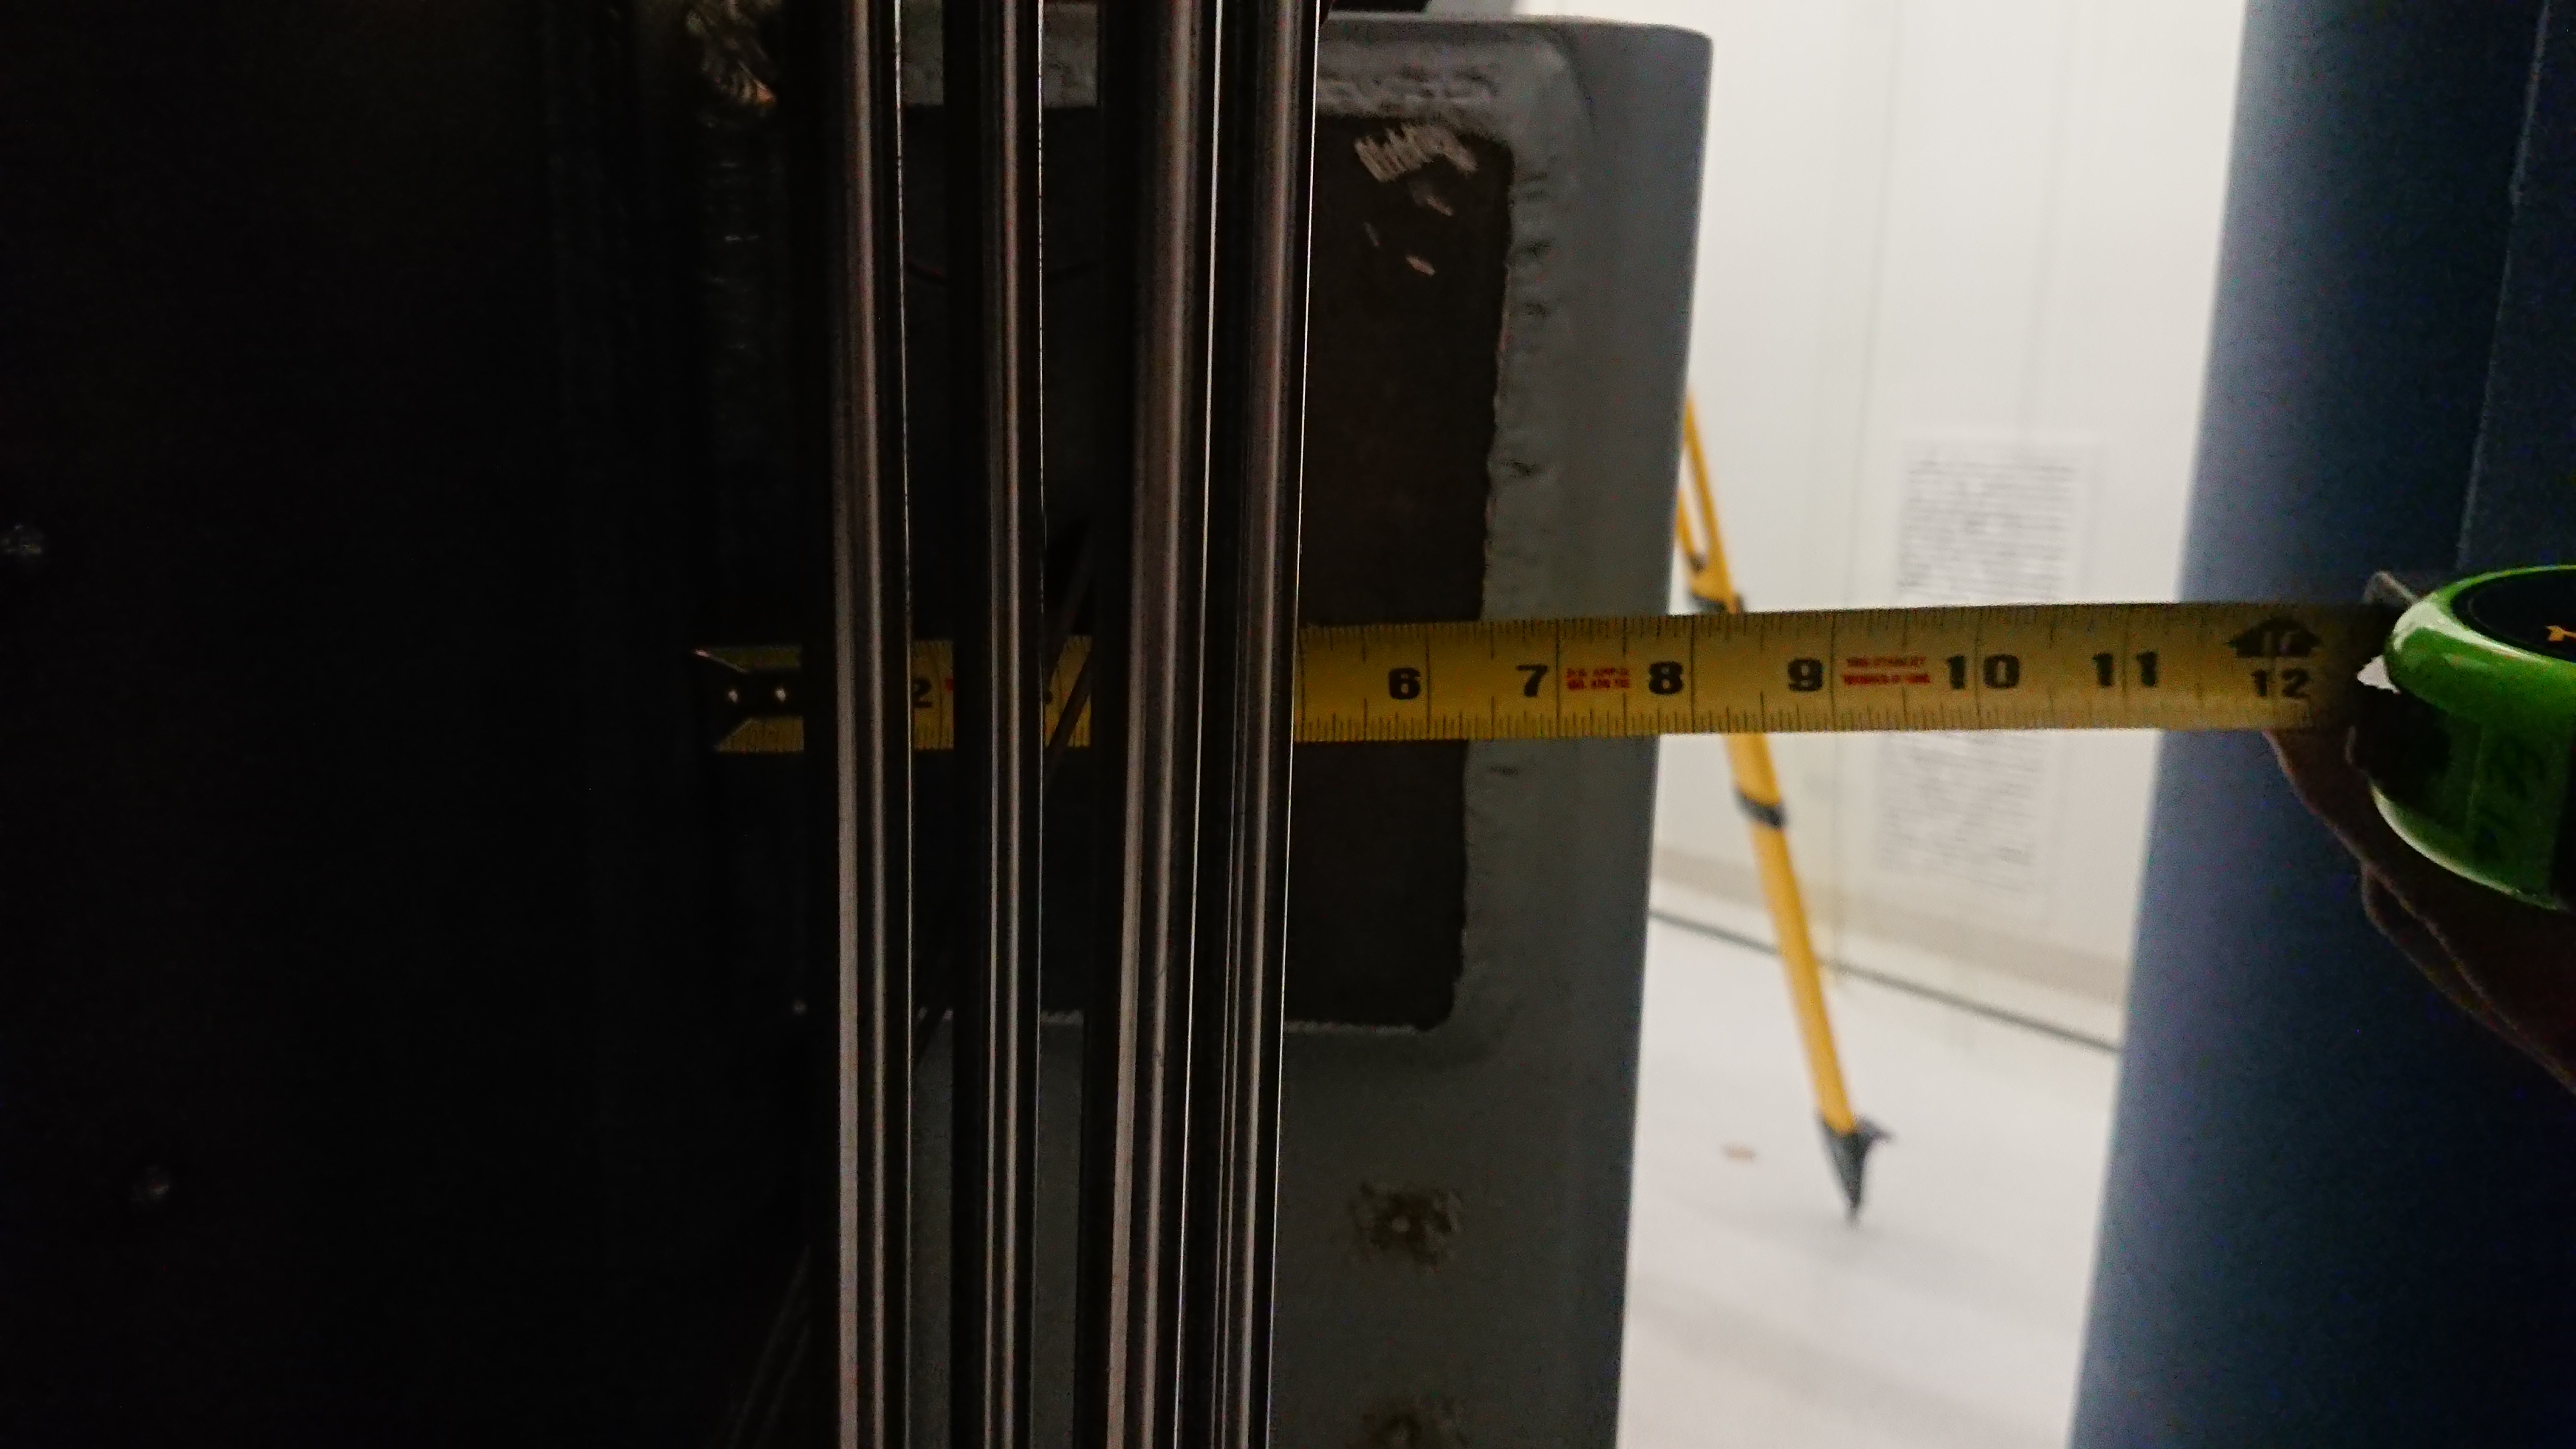
I have attached imaged of the drill bushings, the new drill and the how space available at EX at LHO as a results of the new drill.
The first two images (DSC_1529.jpg and DSC_1530.jpg) show the dimension of the drill head.
The third and fourth images (DSC_1538.jpg and DSC_1539.jpg) show the clearance around the BSC pier
The fifth image (DSC_1543.jpg) shows how close one can get to the chamber flange.
The sixth image (DSC_1545.jpg) has the parts that have been ordered (Drill, drill bushings, captive screws and the drill bits).
The seventh image (DSC_1525.jpg) has the full length measurement of the drill.
Consulting with Bubba, the process of drilling into the BSC pier should now be possible. We are awaiting on a final design of the jig that will help locate precisely locate the holes and ensure straight holes. The other challenge will be not breaking any taps due to the thickness of the BSC pier (especially on the sides).
[Laurance Datrier, Dripta Bhattacharjee, Timesh Mistry]
We went to the X end to take some more pictures of the BSC ISI pier. They are attached to this comment. We have the side view of the pier, measuring the span of the pier from the chamber. This should also give better measurement of the hole in the pier.
Matthew Ball, Adrian Helmling-Cornell, Jim Warner, Robert Schofield
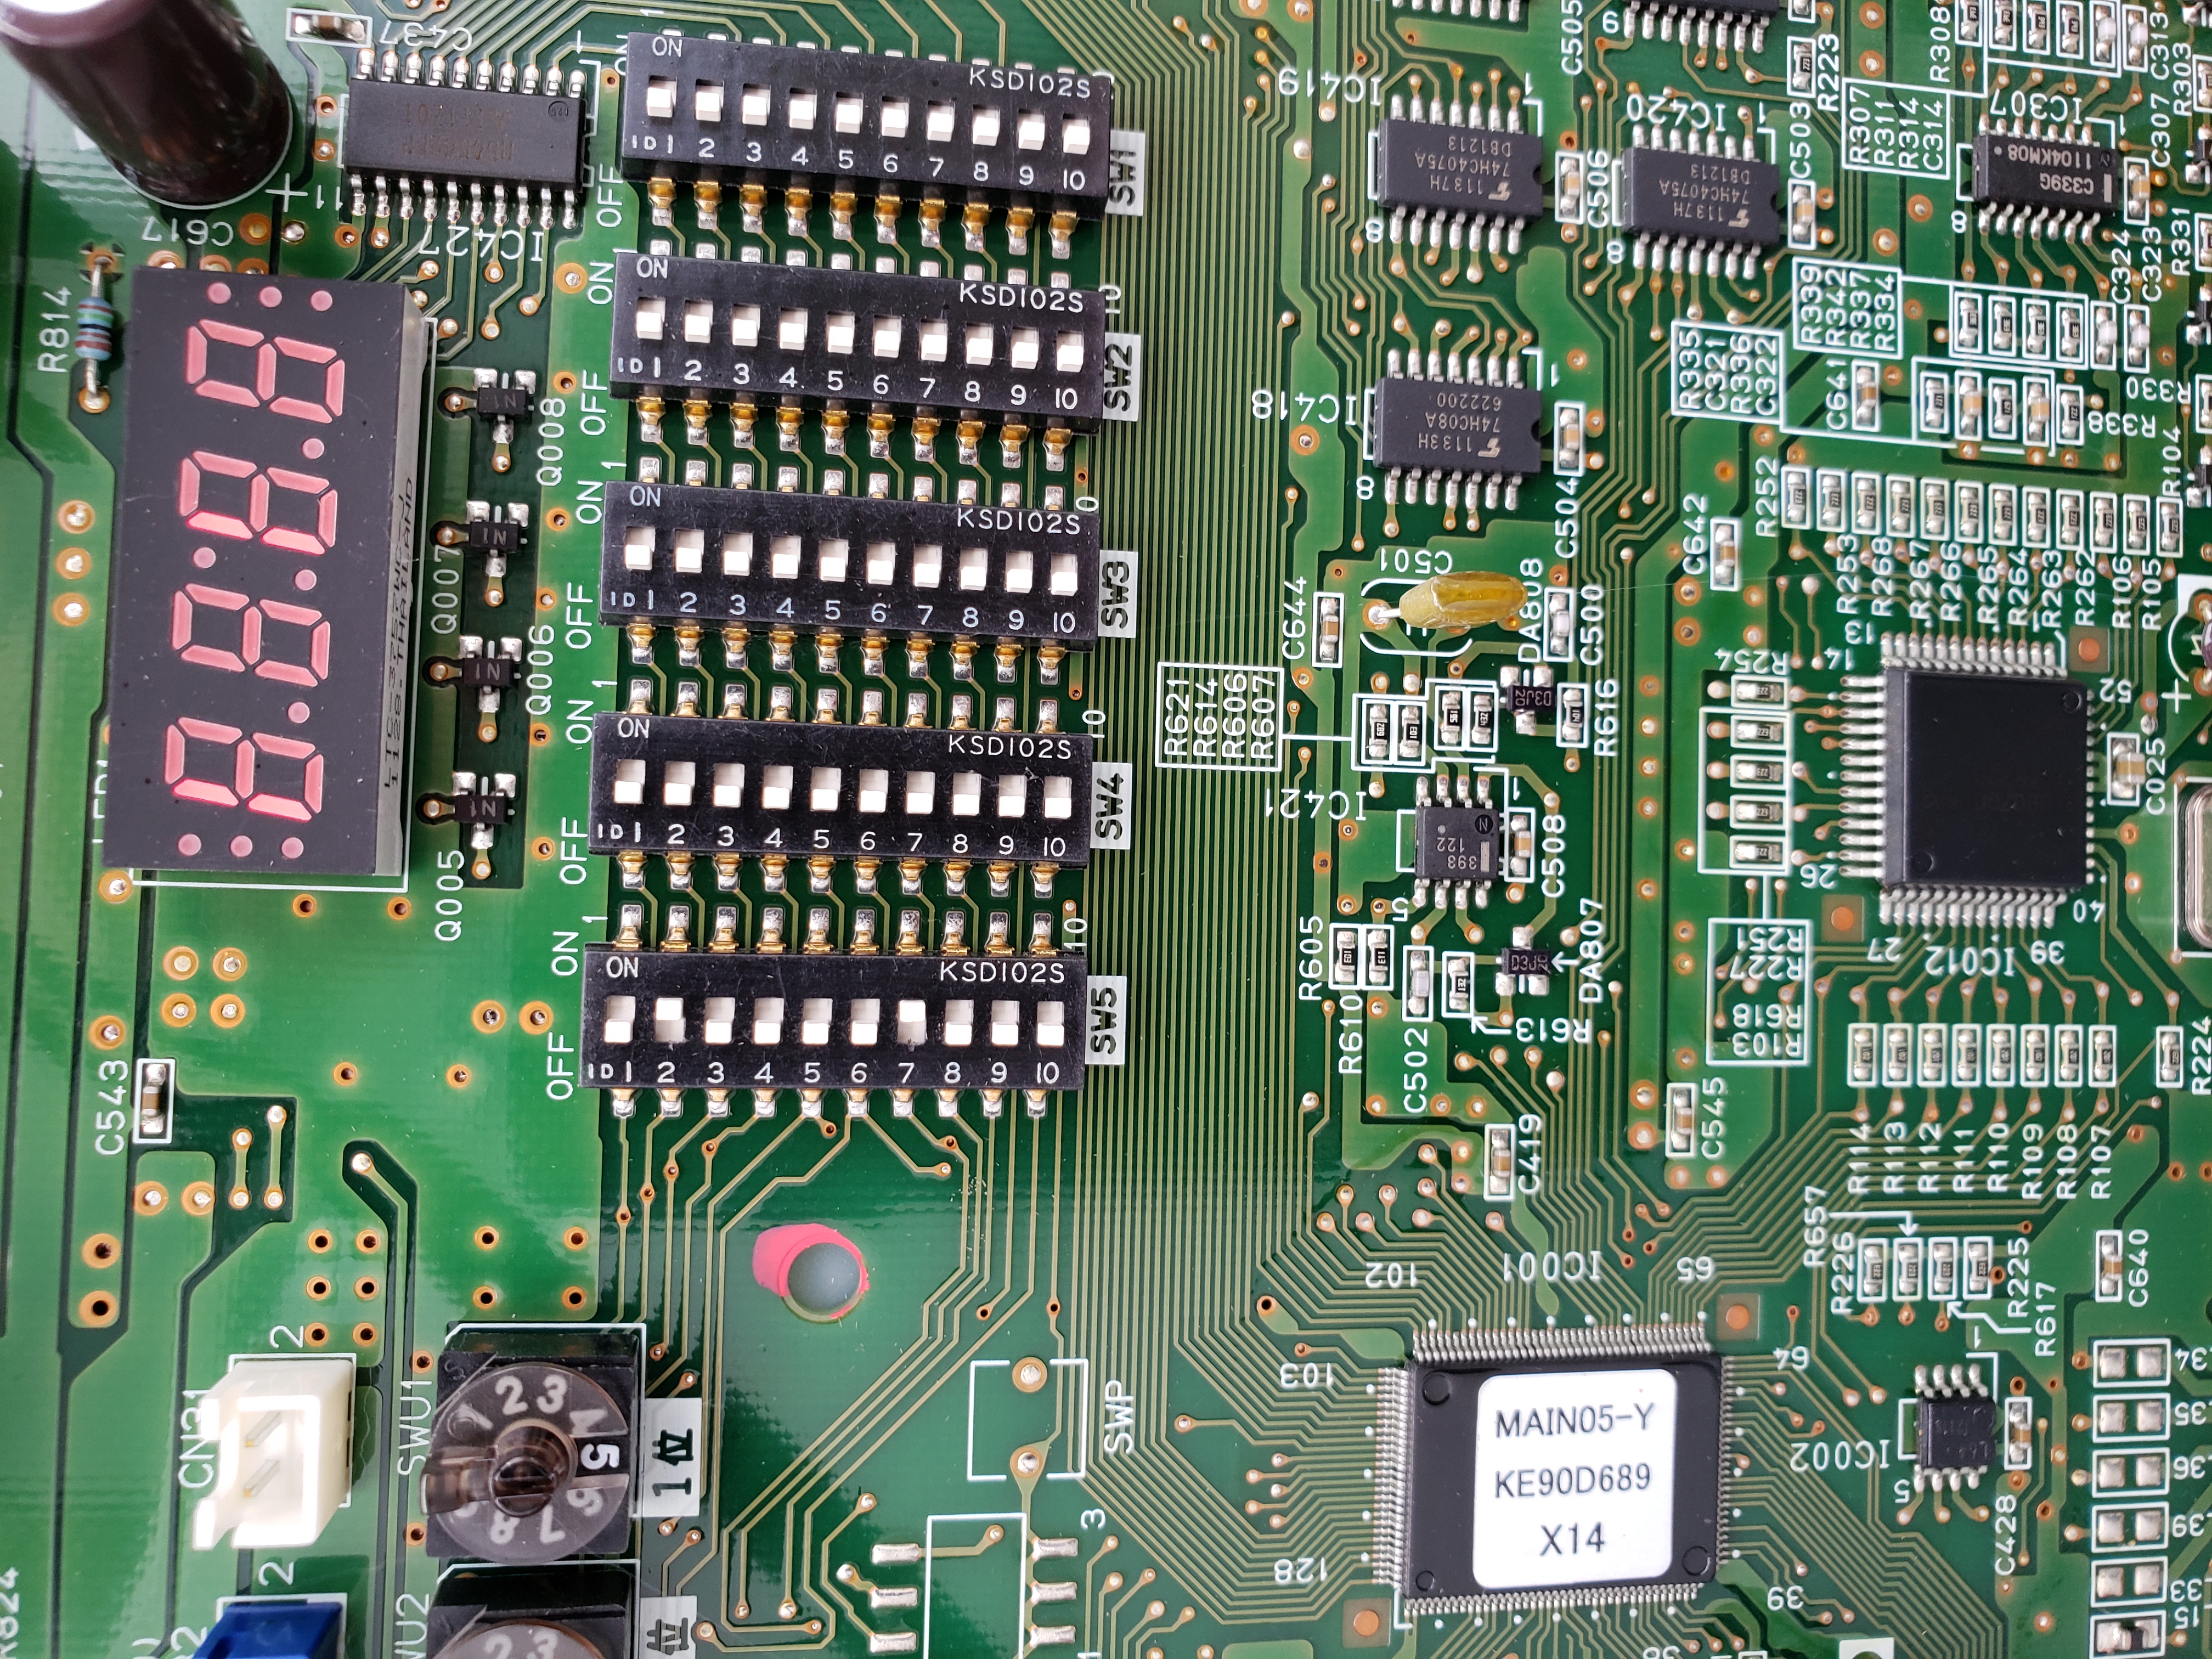
Noise around 48 Hz in DARM is often driven by variable frequency fans of chiller units; dip switches could be changed to eliminate high fan frequencies when not necessary.
The 48 Hz band in DARM is often increased by variable frequency HVAC fans that step through this band (see Figure 1). We tracked one of the intermittent signals to a particular HVAC unit CU-2A, that I think is cooling the electronics bay (Figure 1). These and many of the other units that are stepping in frequency are Mitsubishi model PUHY-P, or similar units. I think we can prevent the fans from stepping into the 48 Hz band by setting Dip SW4-4 to “off” to put it in low-noise mode (uses lower fan frequencies), and, if we are worried about capacity, set Dip SW5-5 to “off” so that "capacity priority" mode overrides "low-noise" mode in certain conditions (https://planetaklimata.com.ua/instr/Mitsubishi_Electric/Mitsubishi_Electric_PUHY-P_YJM-A_PUHY-EP_YJM-A_Service_Manual_Eng.pdf).
Laser vibrometry of the X and Y TCS 2 mirrors does not show 48 Hz resonance
We were able to point the laser vibrometer at the struts of the large TCS mirrors in BSC2 using the illuminator and camera viewports of BSC2 (for the Y-arm mirror), and the illuminator viewport of BSC3 (for the X-arm mirror). Spectrograms in Figure 2 show that the vibrometer detected fan vibrations exciting the mirror in the 48 Hz region, but not a 48 Hz resonance.
Does not appear to be related to 48 Hz peak on ISI tables
We also found a peak that was very similar to the DARM 48 Hz peak on the Z-axis of GS13s in all LHO (not LLO) ST2 ISI signals. But injections that increased the 48 Hz motion of each of the tables individually by an order of magnitude did not appear in DARM. In addition, changing the isolation gain from 1 to 0.7 on the BS ST1 ISI isolatiobn and shutting down FF01 individually on all tables did not change the 48 Hz peak in DARM.
Sheila, Georgia
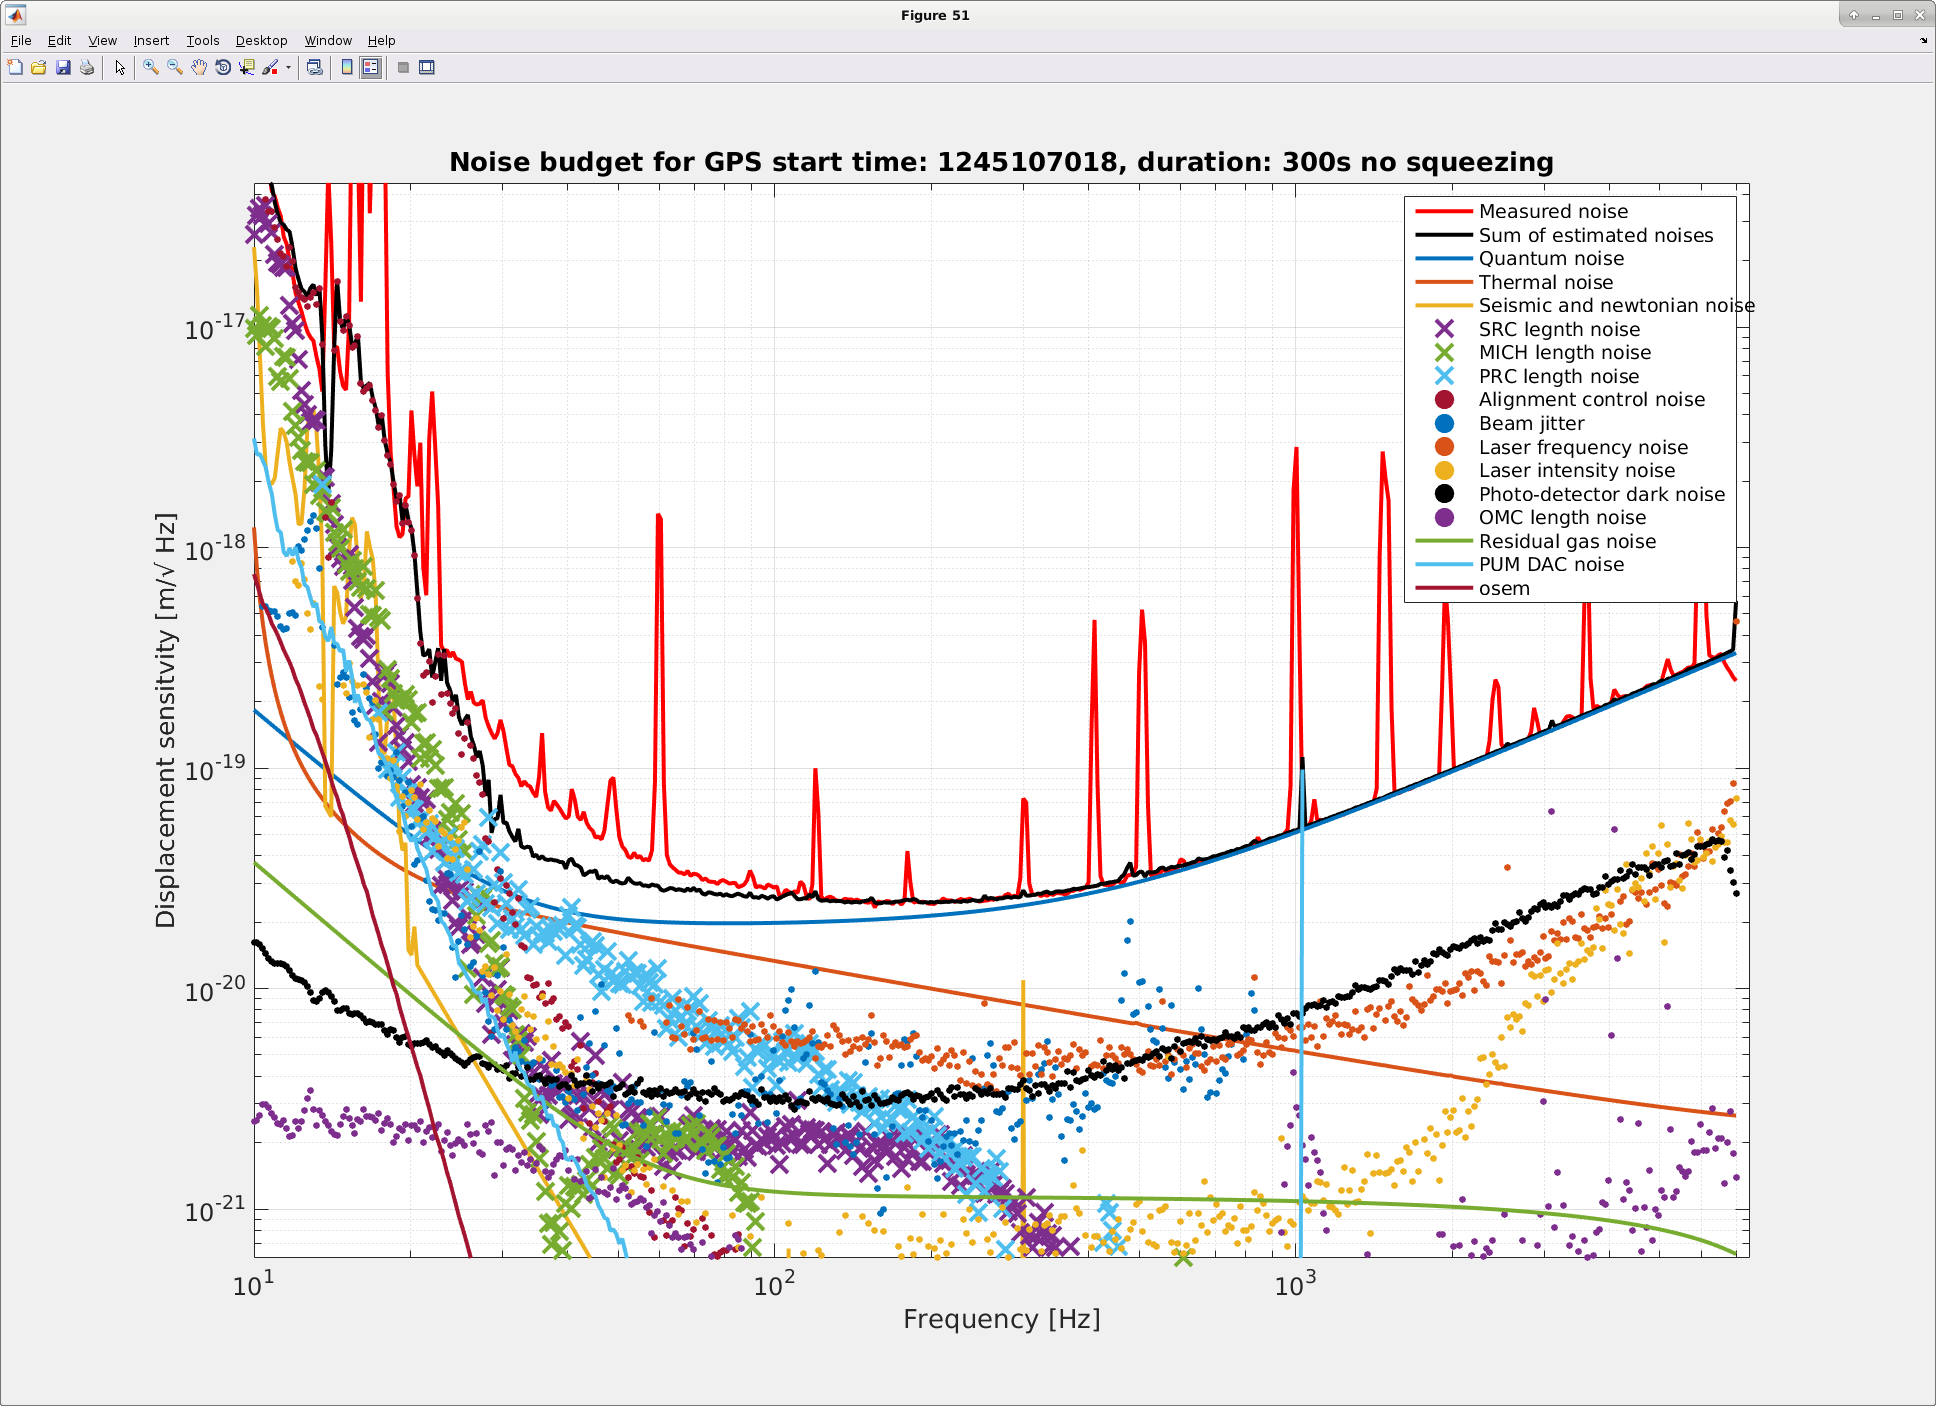
Yesterday we re-ran the noise budget templates for the following noises:
Only the frequency noise changed dramatically since the old noise budget, it is significantly lower now - presumably due to the increase in CO2_X power.
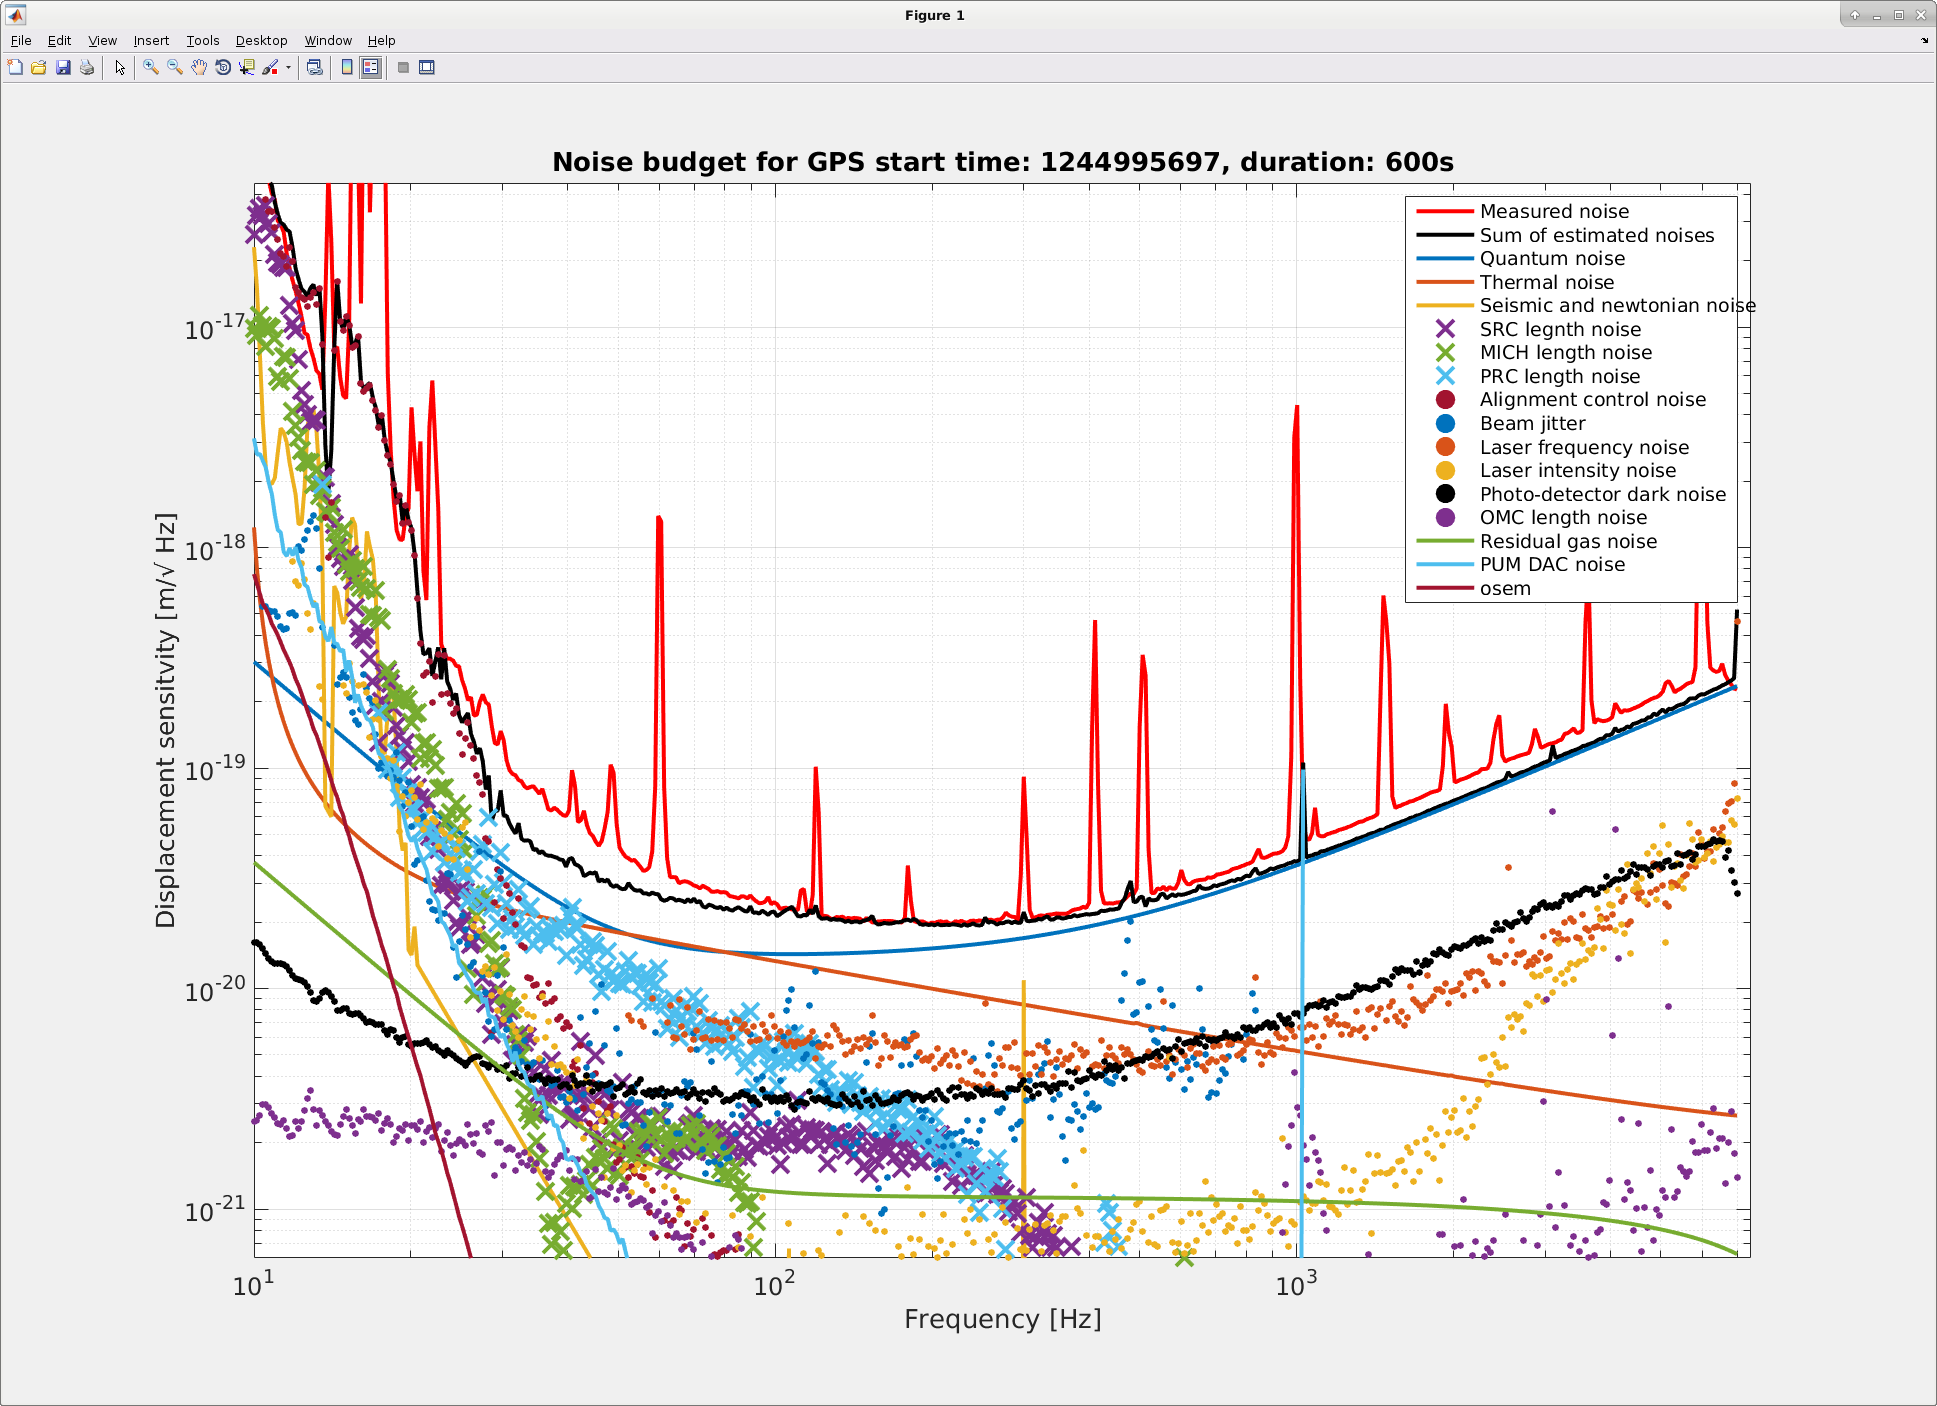
The updated noise budget, for a time when squeezing is injected, is shown in the first attachment. We are clearly underestimating our shot noise above a few hundred Hz, though between 10 and 300 Hz we estimate the noise well.
To look further into shot noise, today we let the ifo run for 10 mins without injecting squeezing. The noise budget for this time is shown in the second attachment. Without squeezing on our shot noise is correct at all frequencies.
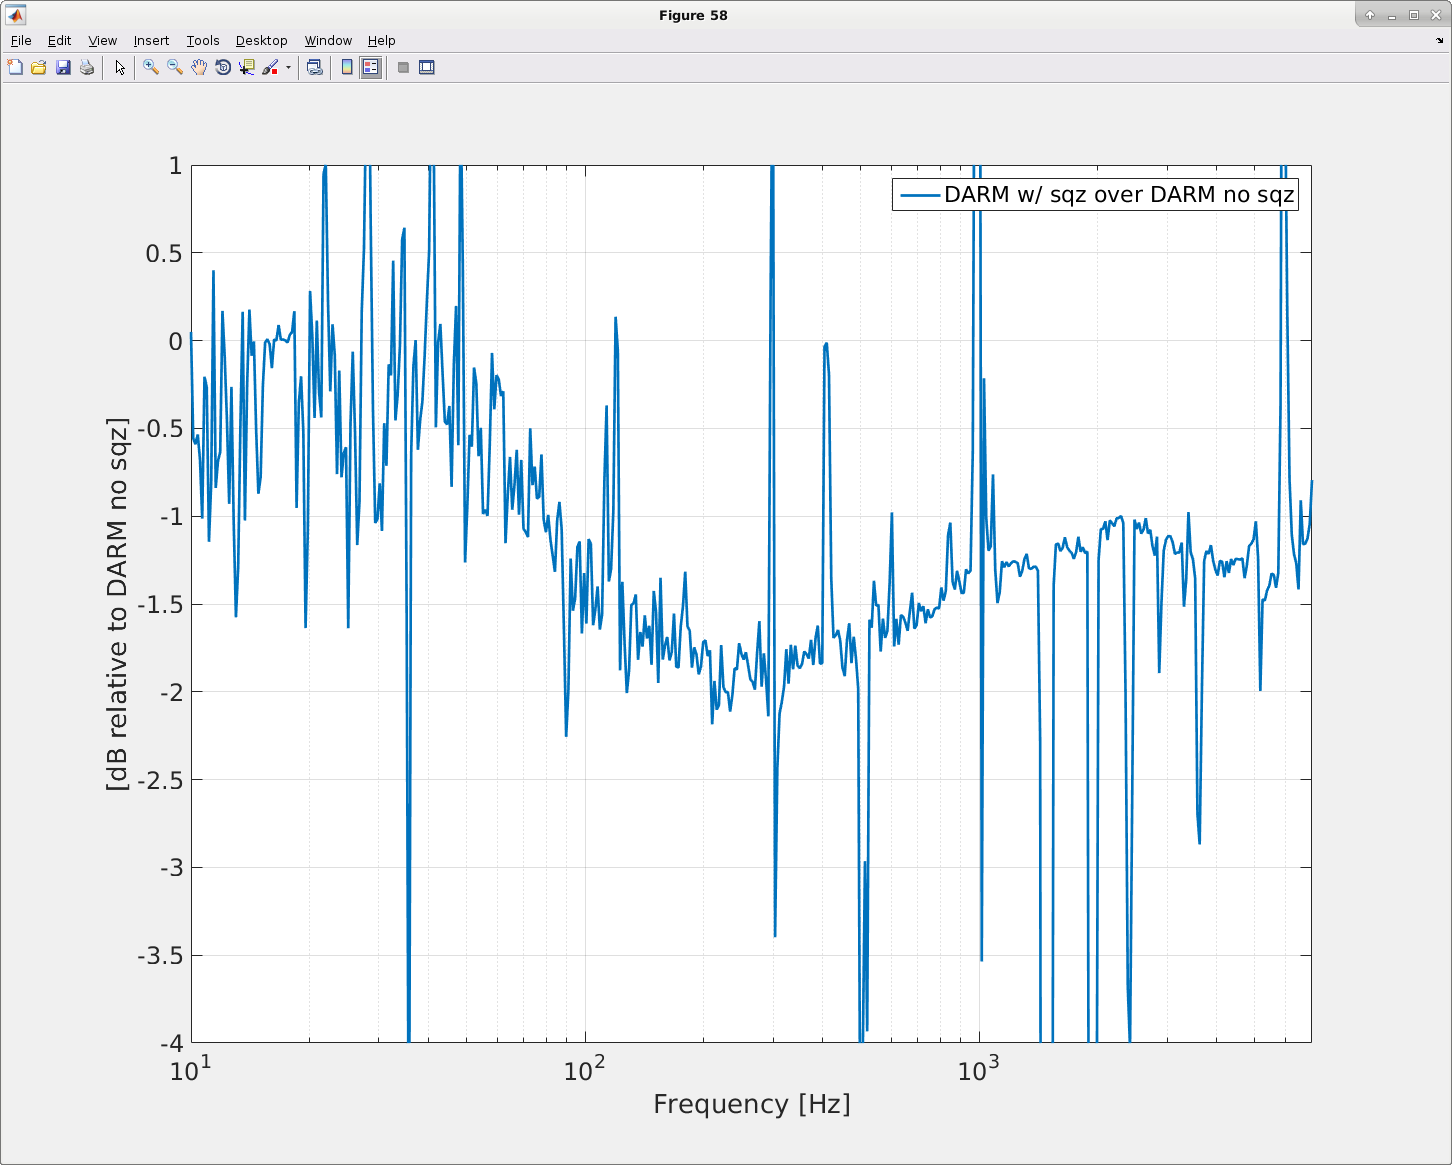
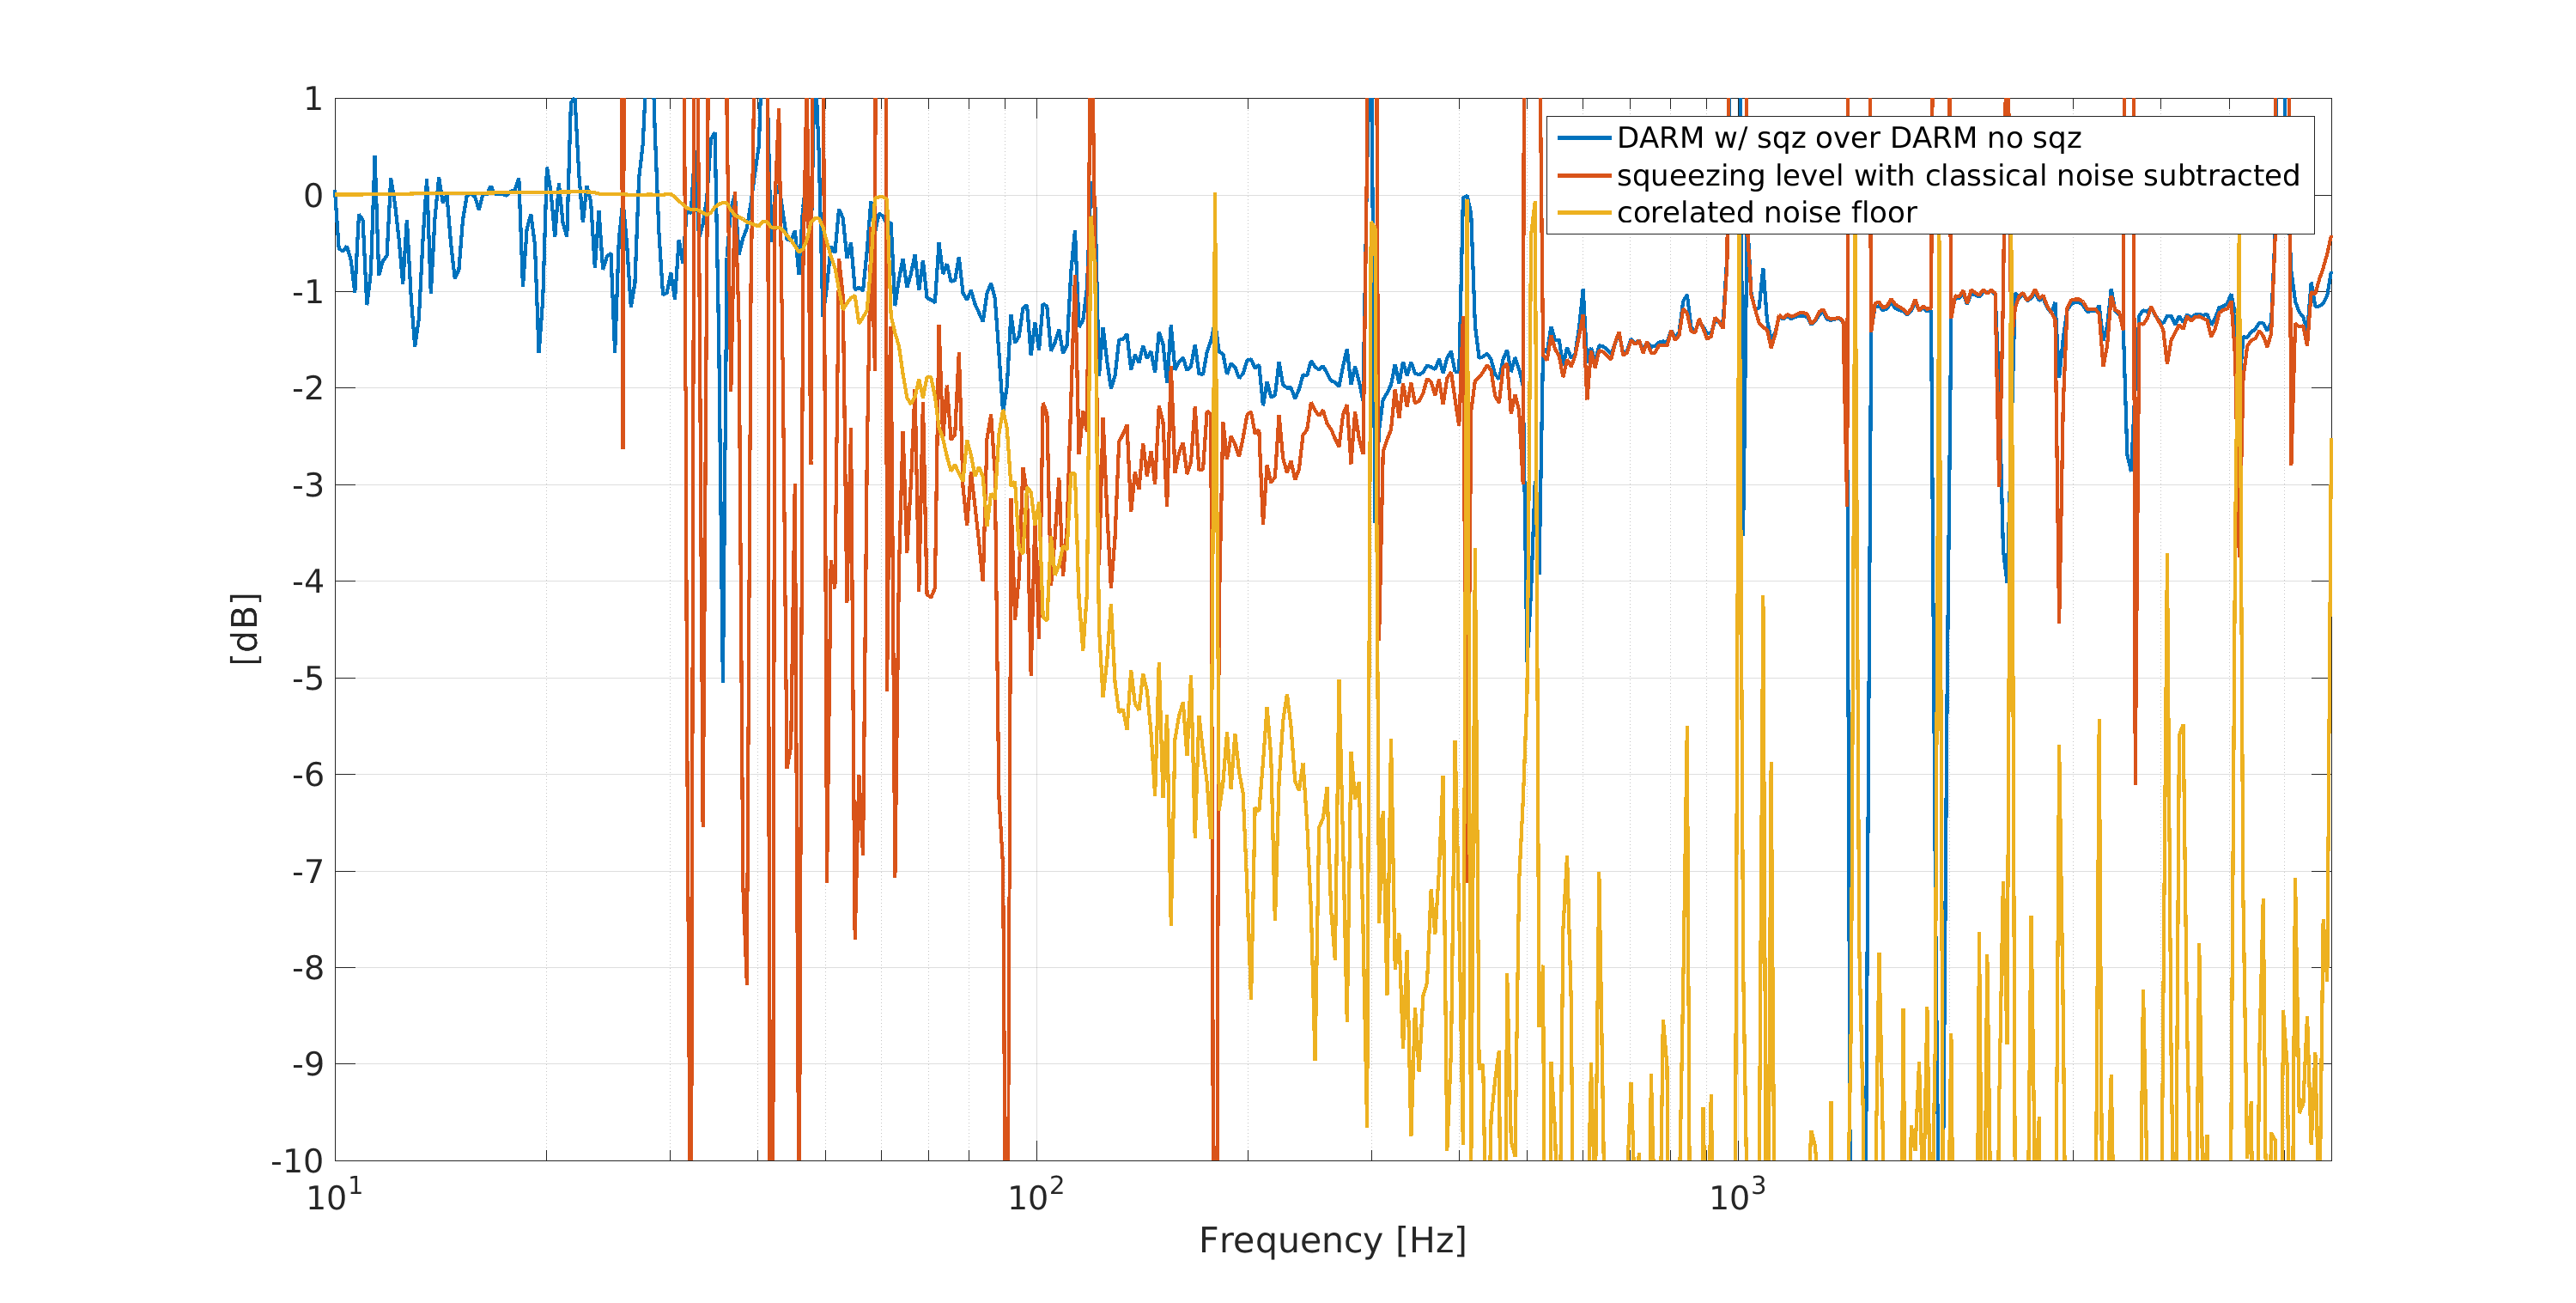
In the first noise budget we assume a constant (frequency independent) squeezing level, calculated from the DCPD BLRMS, which reported 2.9 dB of squeezing. The third attachment compares DARM with squeezing and DARM without squeezing. Squeezed-DARM sits ~2dB below normal shot noise at 200Hz, but only 1dB at 2kHz. This frequency-dependence was attributed to bad frequency noise in the past, but is still present with improved frequency noise. Perhaps we need to look at whether we have a SRCL offset?
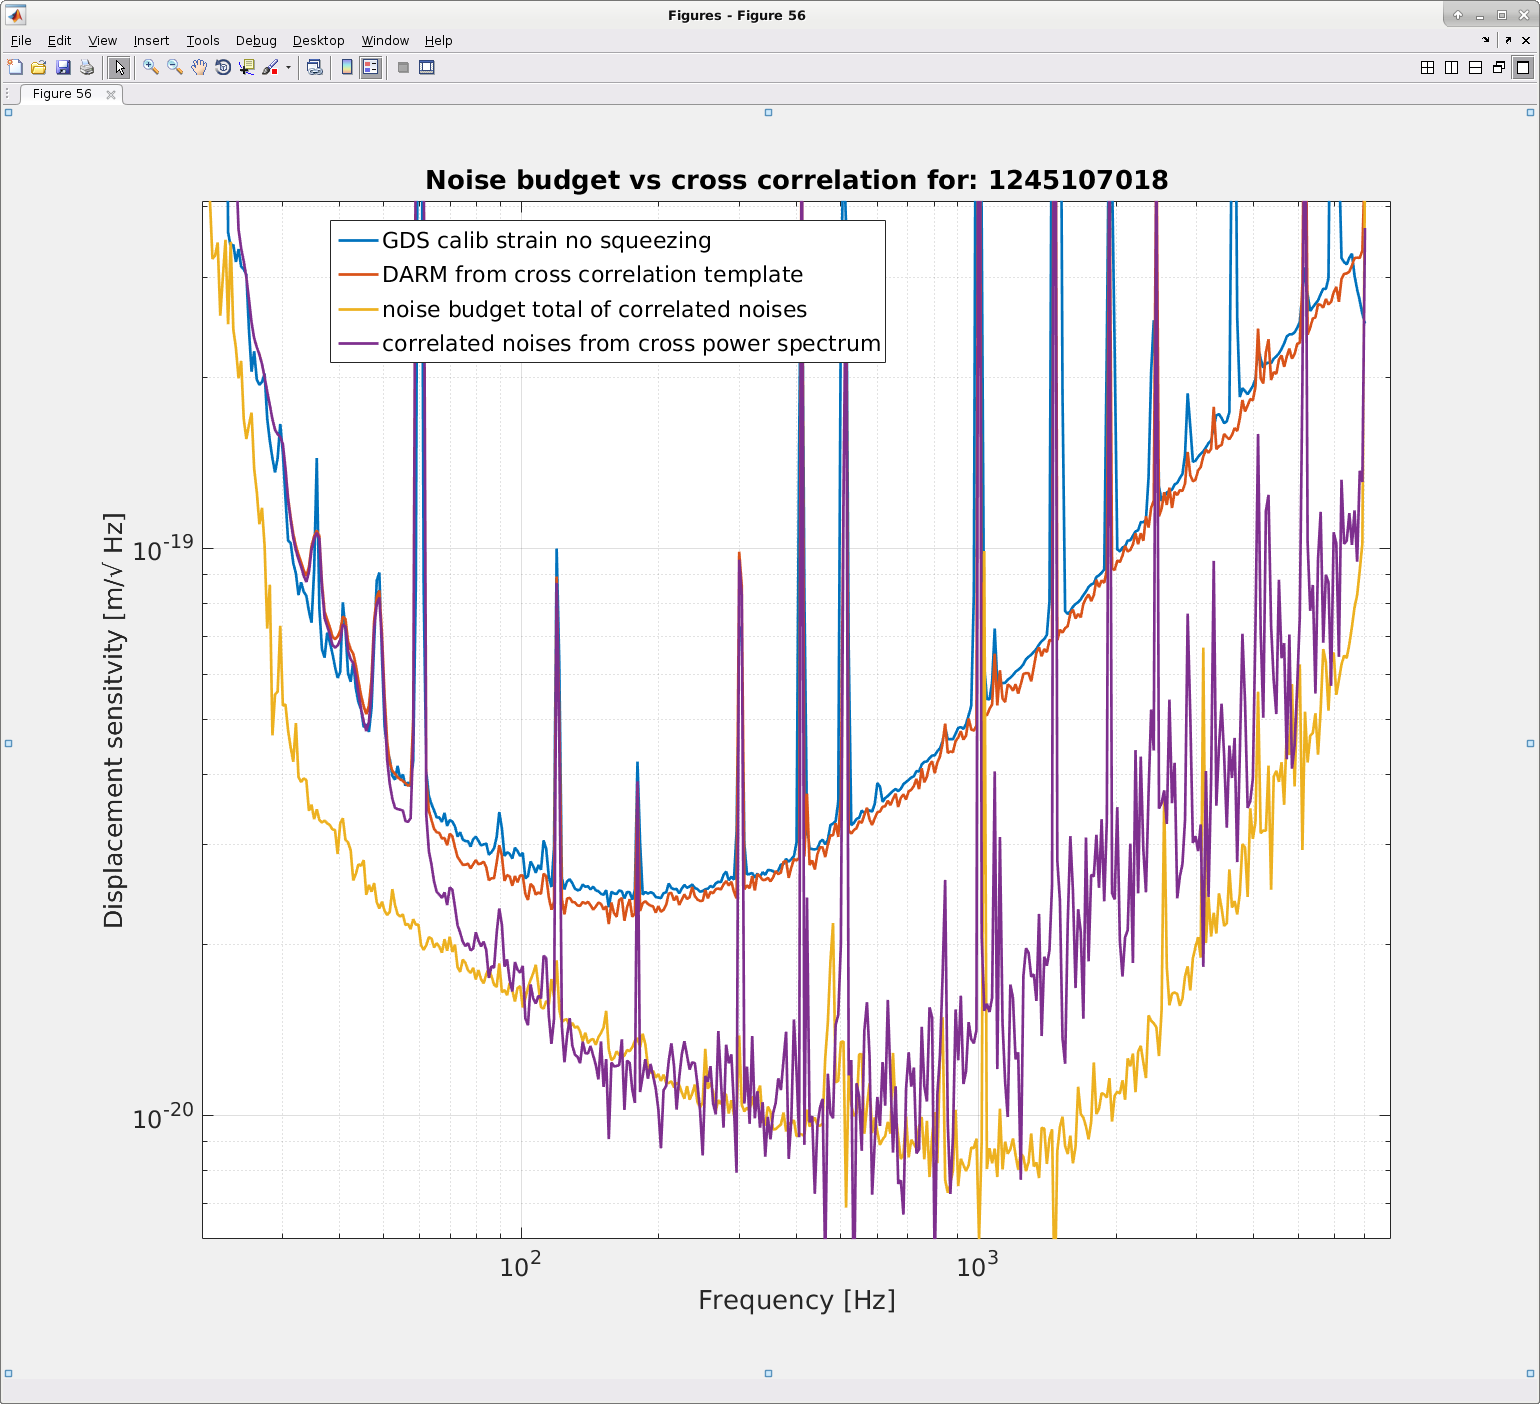
We ran the DCPD cross-correlation template during our time without squeezing, to see if this worse sensitivity at high frequency is due to classical noise that is not in the noise budget. The fourth attachment shows correlated noise based on the noise budget (removing the shot noise and dark noise from the unsqueezed noise budget) in yellow, and the correlated noise from the DCPD cross correlation template in purple. We seem to be under-estimated our cross correlated noise by a factor of ~2 at 2kHz. (The discrapancy between DARM from the noise budget and DARM from the cross-correlation template is the difference between the GDS calibration and the CAL-DELTAL_EXTERNAL calibration). This is not enough to explain our mismatched shot noise.
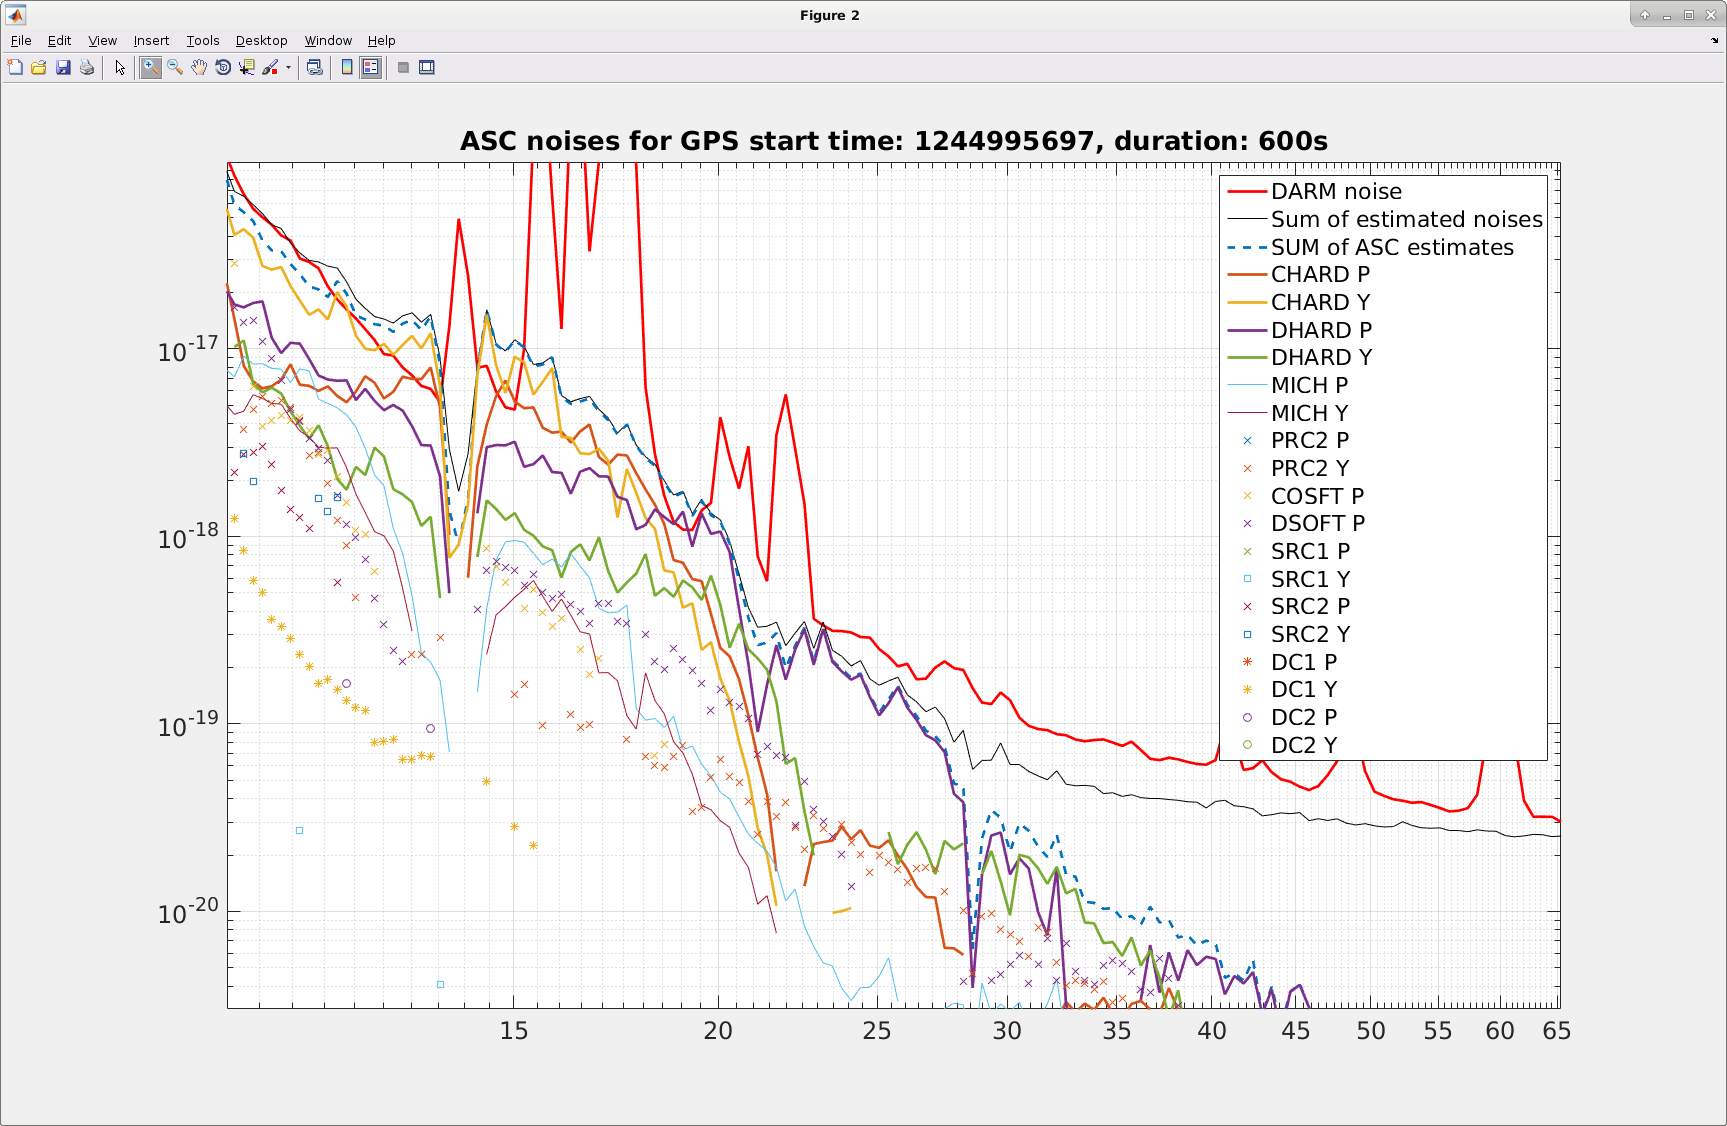
The fifth attachment is the updated ASC noise budget. We are over estimating our noise a bit between 10 and 20 Hz, one explanation could be that the noise budget templates we use to measure coupling functions were run yesterday when the wind was high, while the Measured Noise trace is from the previous lock, which had lower ground motion. We also want to check the PUM DAC noise.
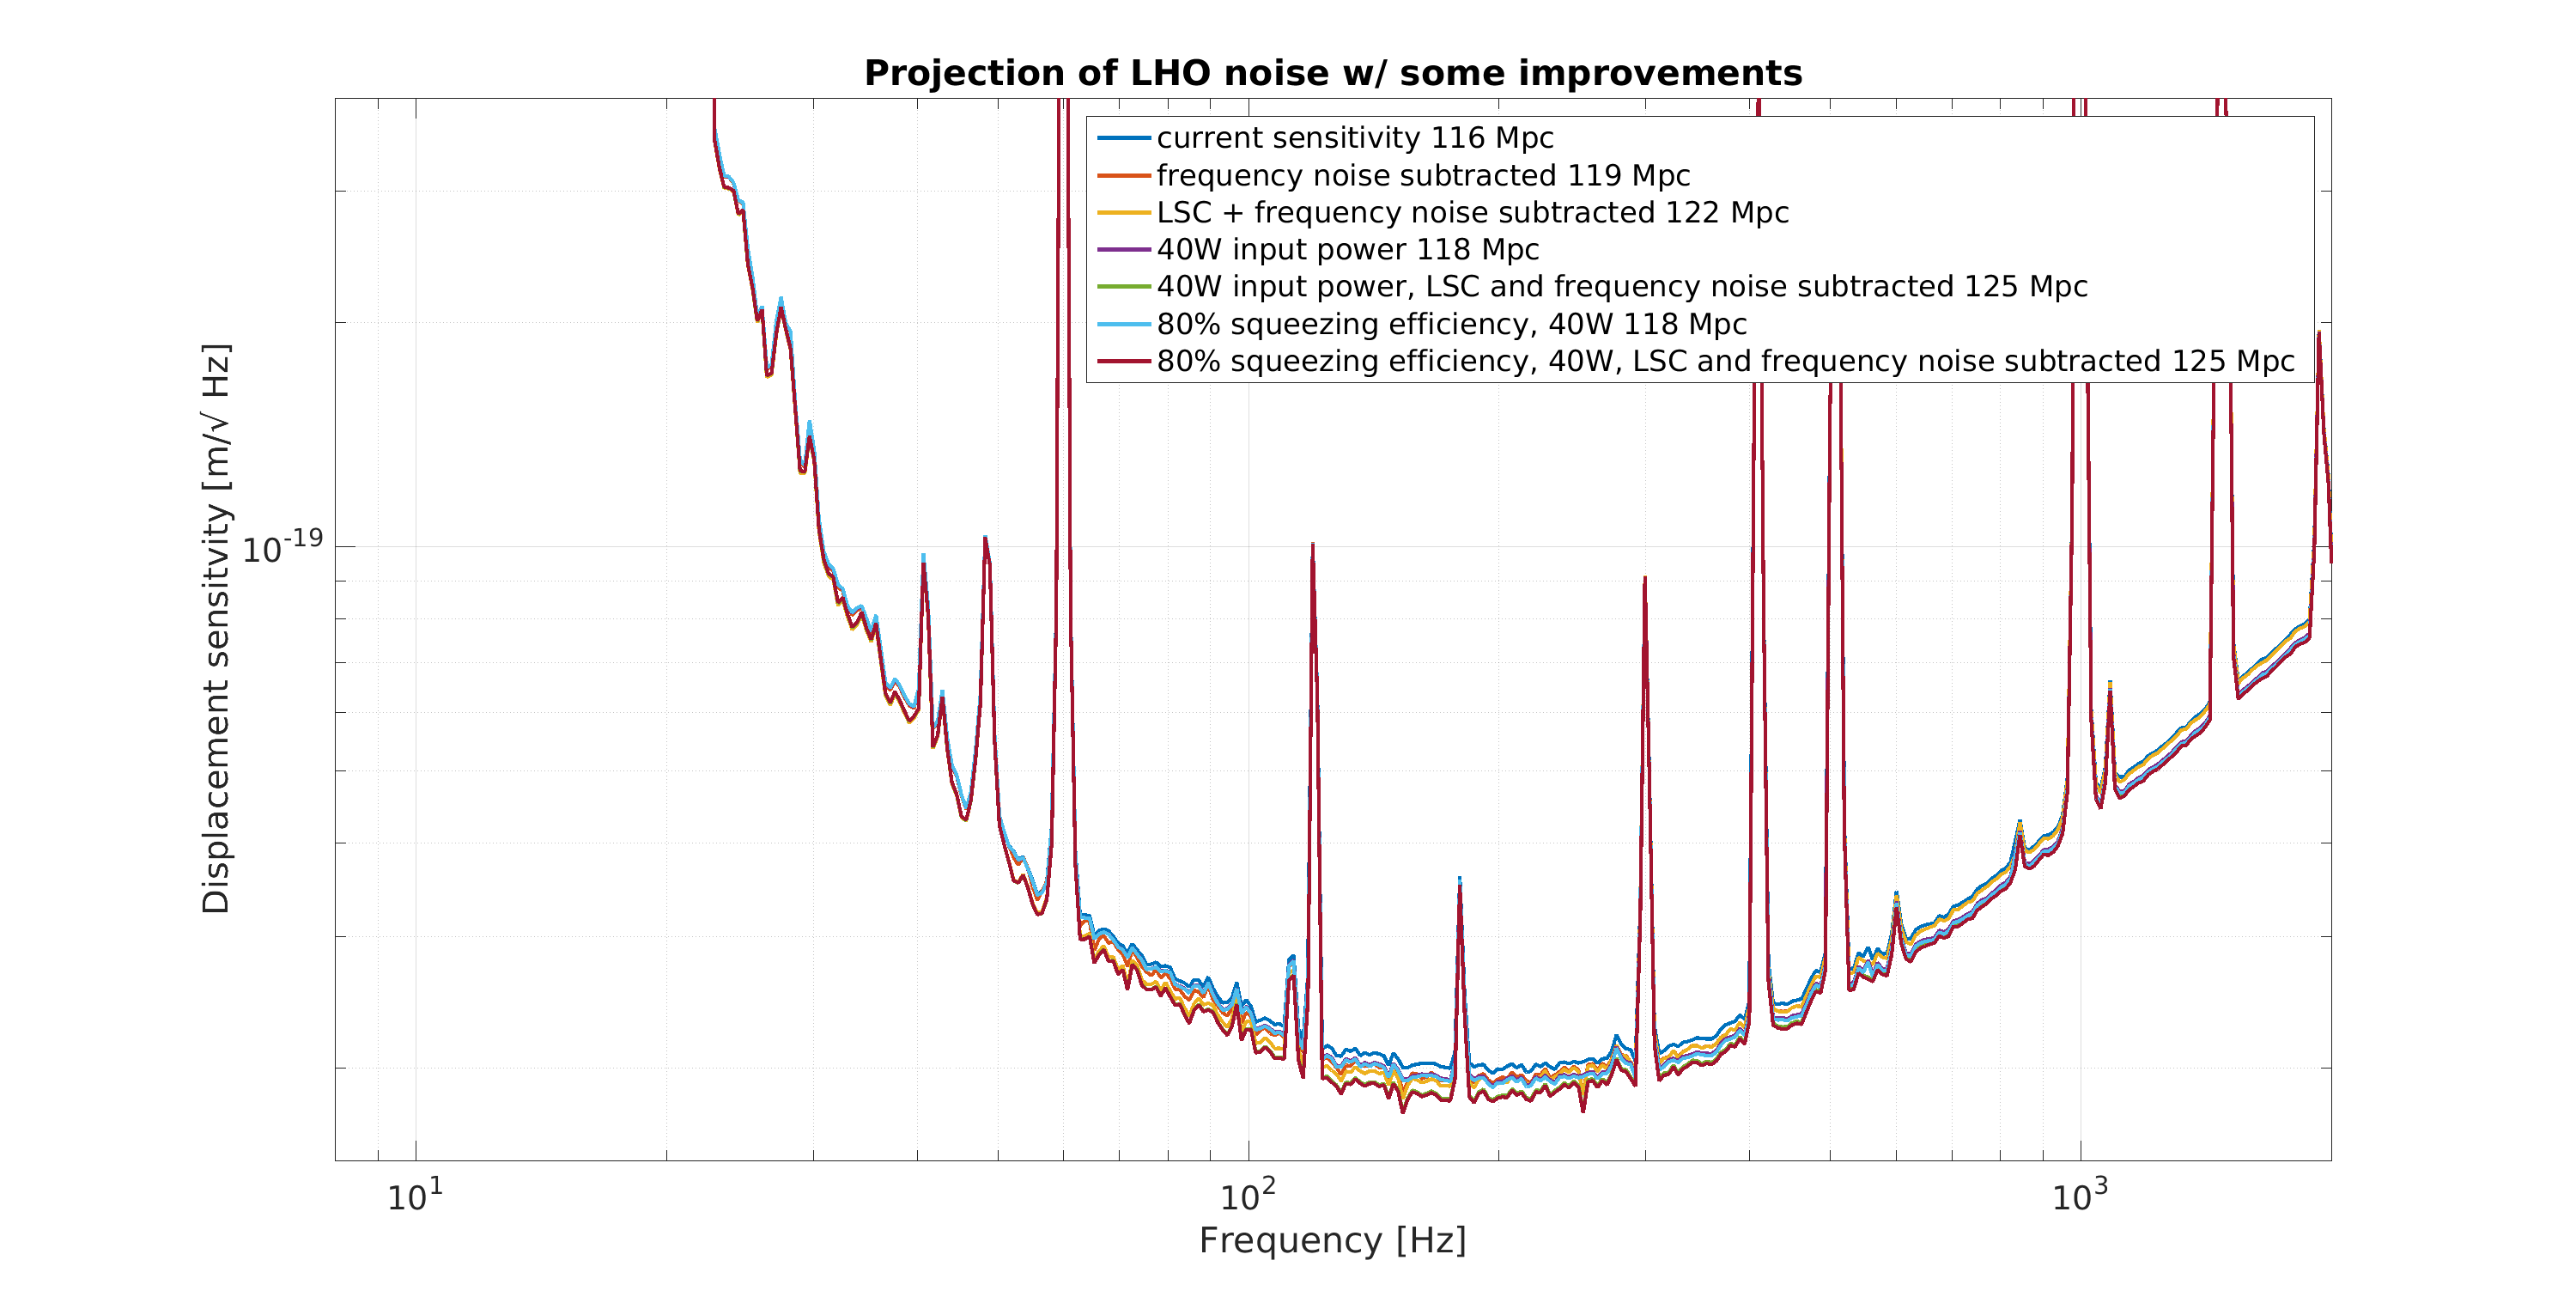
I'm attaching a couple of other figure that were generated when Georgia ran this noise budget that might be useful for reference. The first is the same as Georgia's third plot, but also shows the frqeuency dependence with an attempt at subtracting the correlated noise. This is the correlated noise from the online cross correlation, so the calibration issue shown in Georgia's 4th plot is impacting the subtraction. We did some follow up measurements for this frequency dependence that are shown in 50591 there I did the cross correlation offline which should avoid the calibration issues (or, would have a different calibration issue, in the offline one the subtraction will be limited by the accuracy of the DARM loop model, not by the discrepancies between the online and offline calibration).
The second attachment shows some projections, the ones that involve squeezing should be interpreted with caution.
/ligo/gitcommon/NoiseBudget/simple-noise-budget/restructured_nb/