Displaying reports 41361-41380 of 88808.Go to page Start 2065 2066 2067 2068 2069 2070 2071 2072 2073 End
Reports until 15:31, Wednesday 01 May 2019
H1 DetChar (DetChar, PEM, SUS)
evan.goetz@LIGO.ORG - posted 15:31, Wednesday 01 May 2019 (48903)
First 4 weeks of O3 spectral artifacts overview
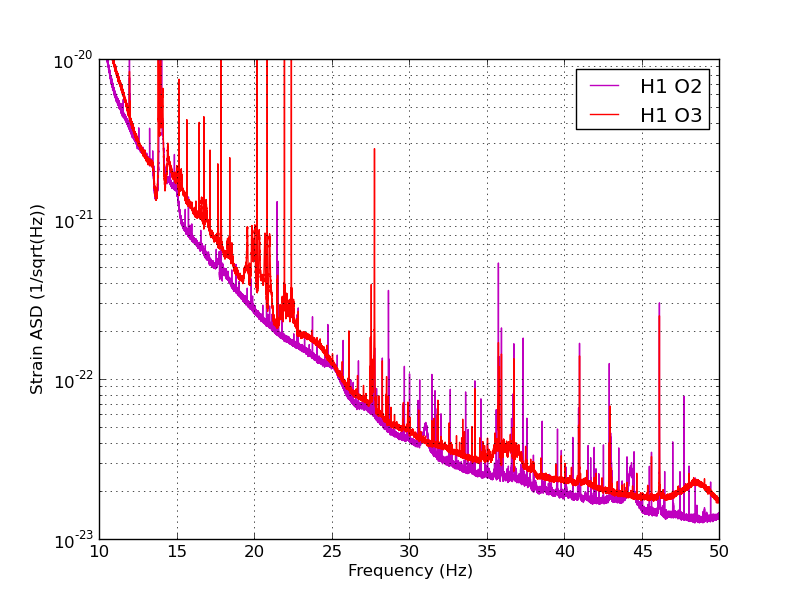
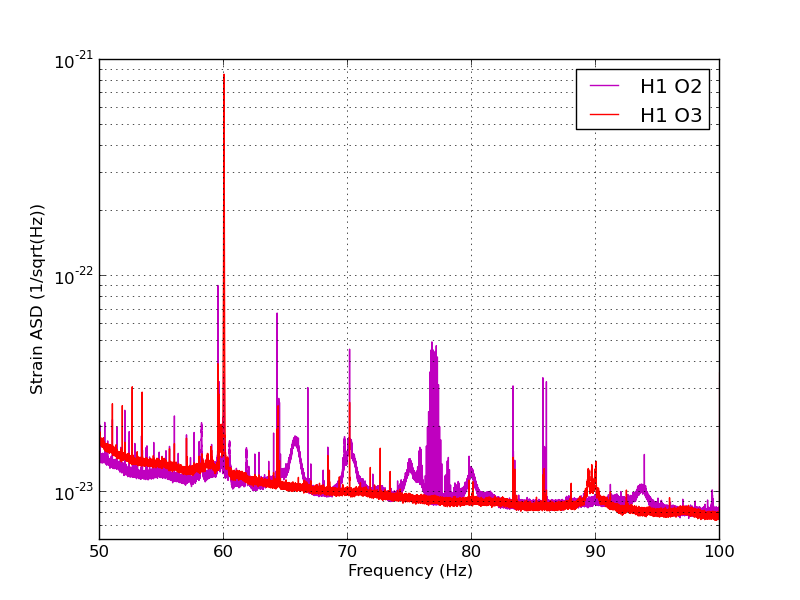
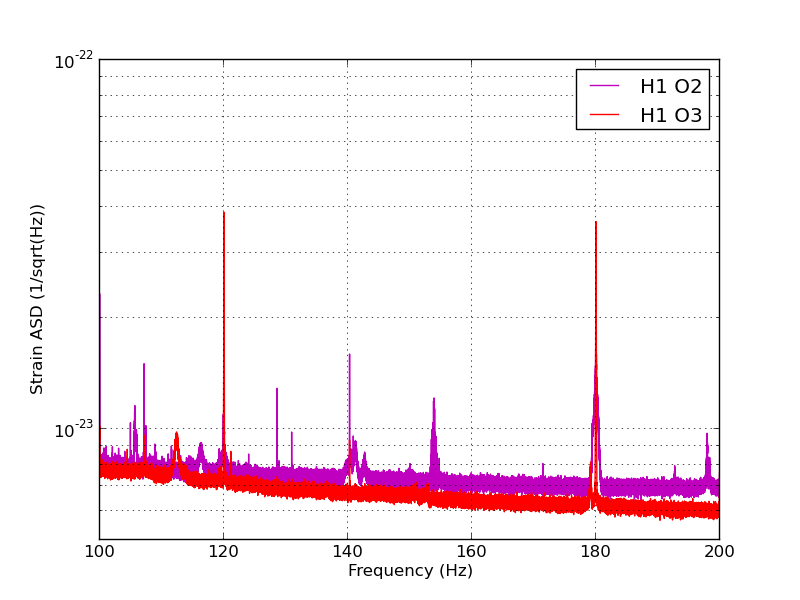
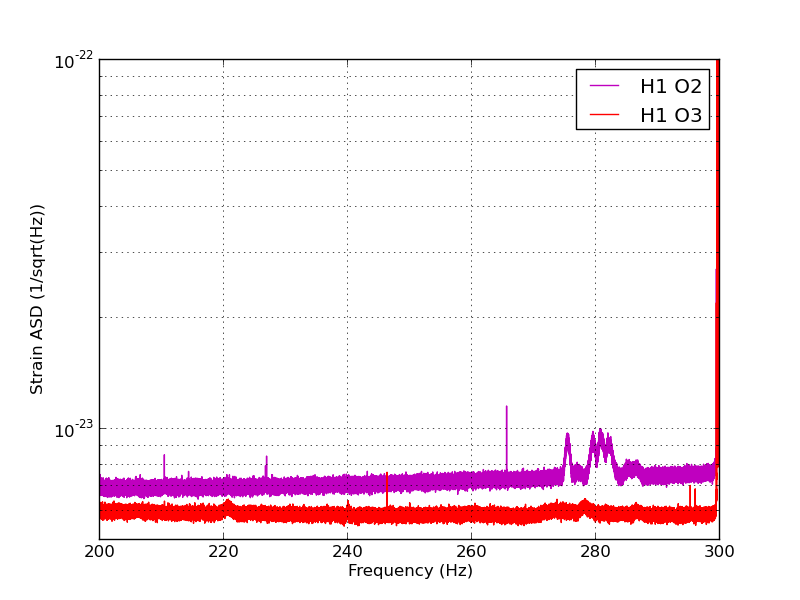
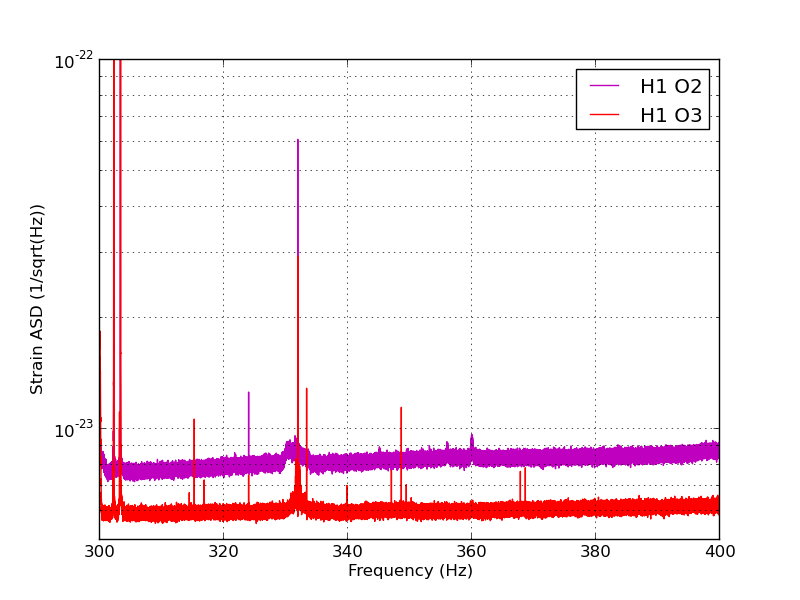
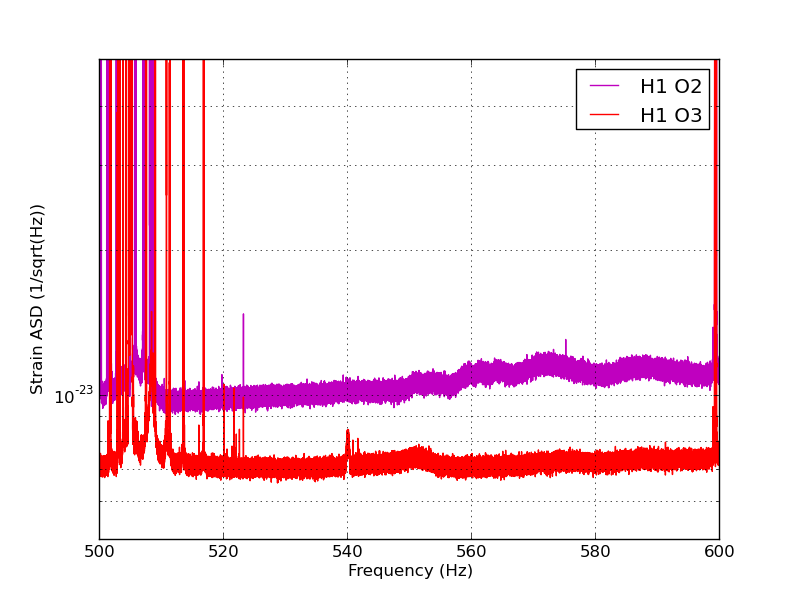
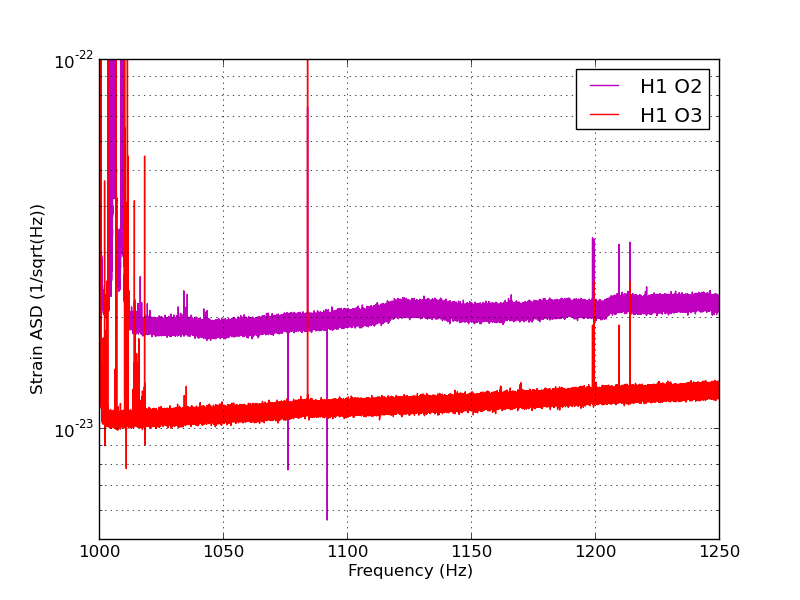
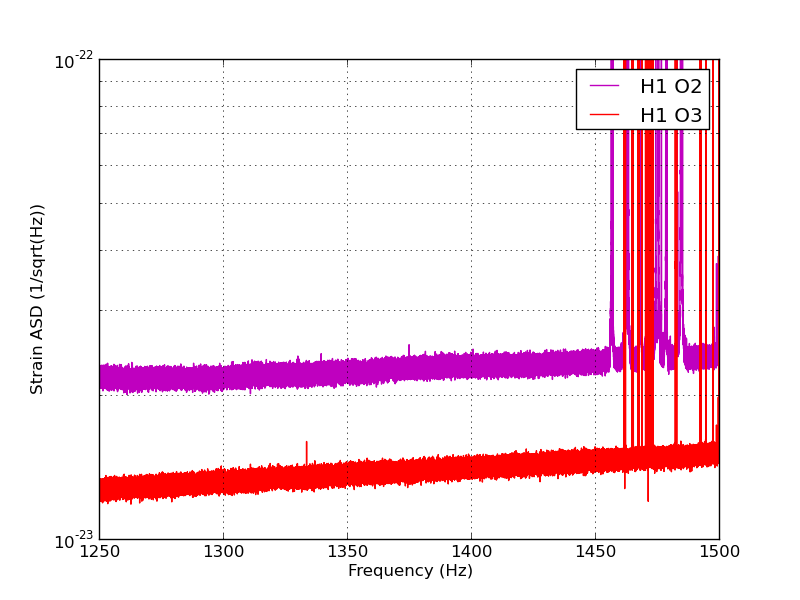
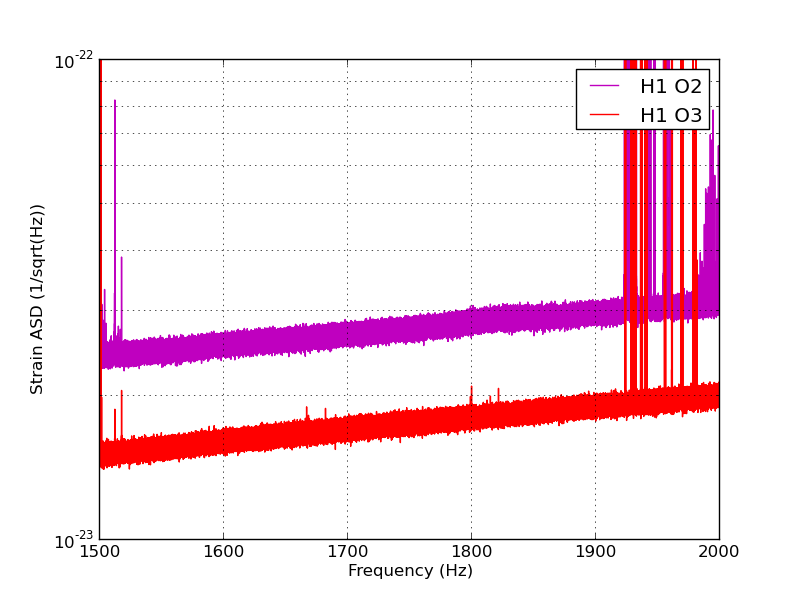
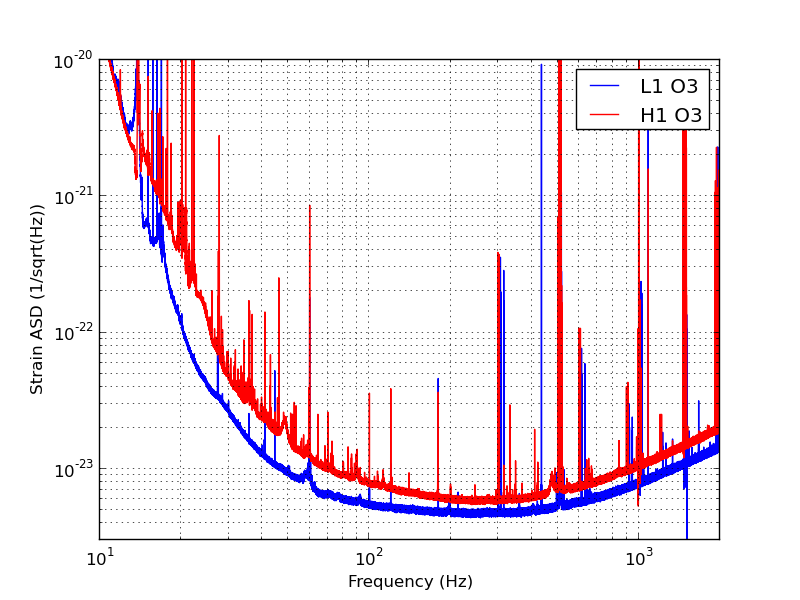
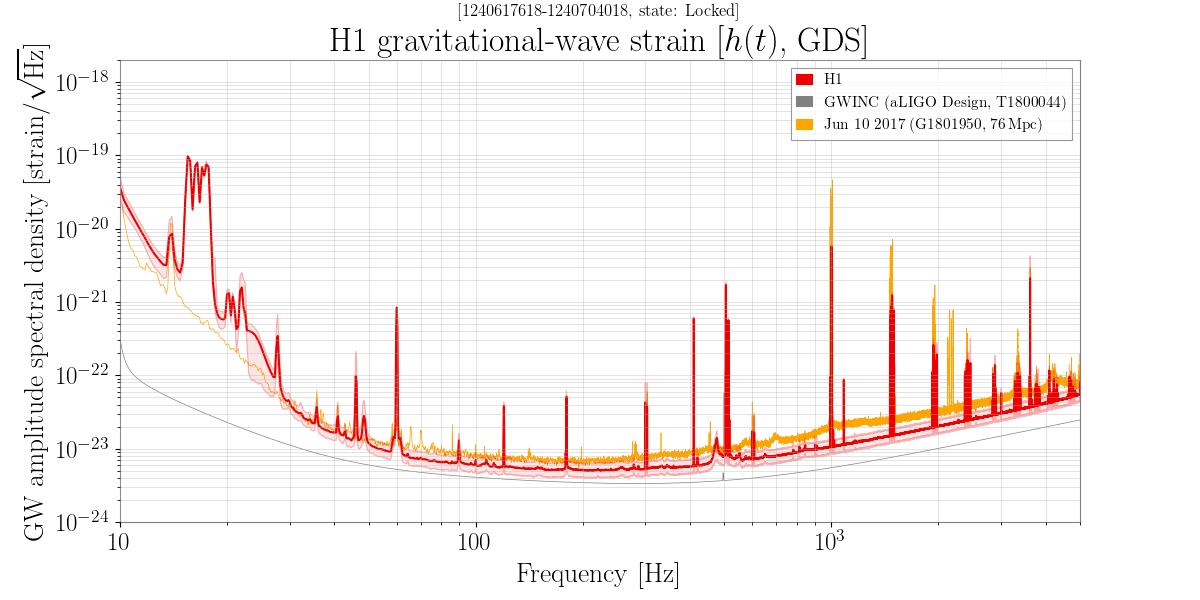
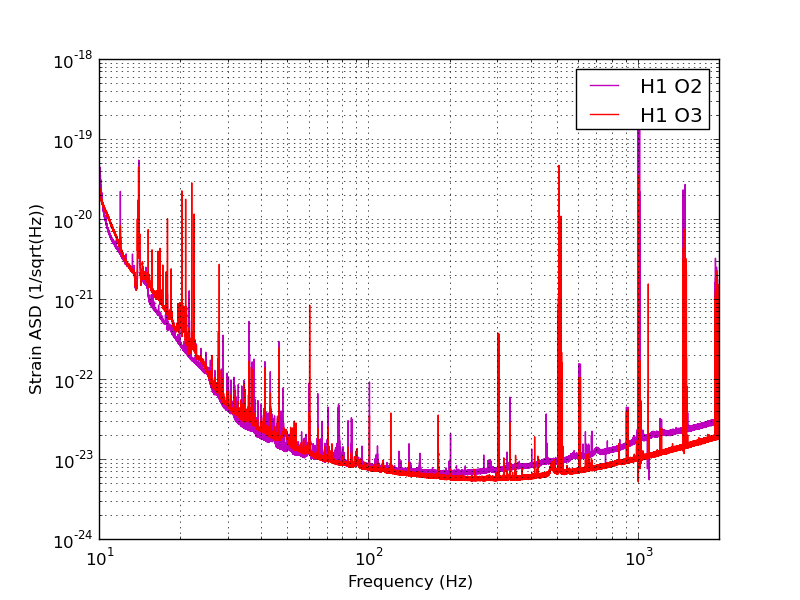
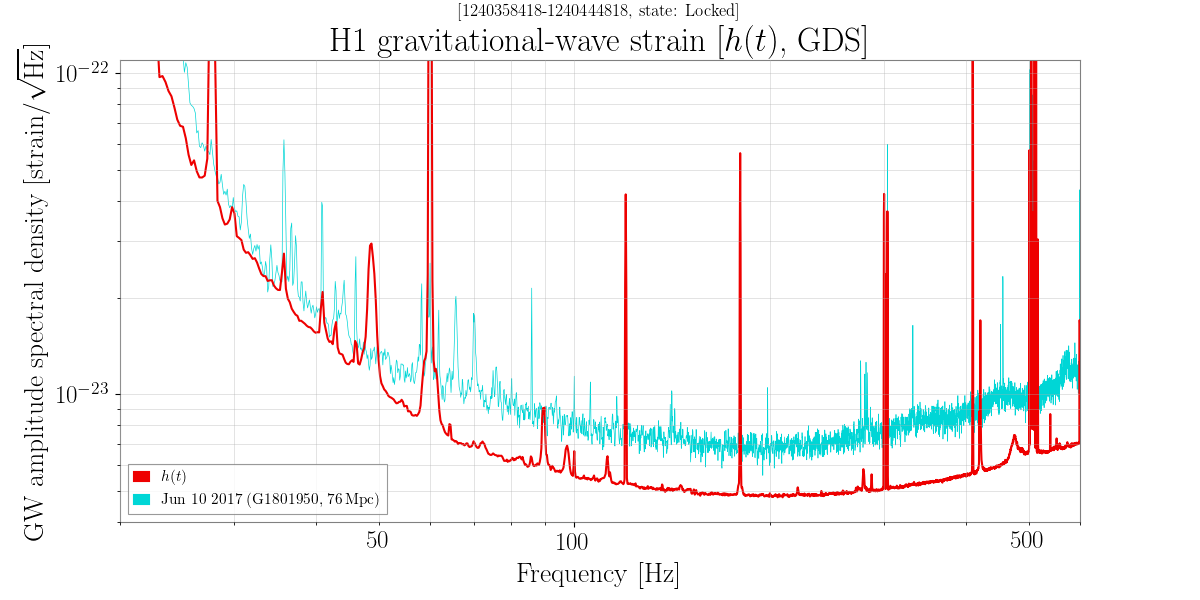
This is a summary of the first 4 weeks of O3 on narrow spectral artifacts that degrade astrophysical search sensitivity to long duration narrowband signals (CW and/or stochastic GW searches). All search groups can be happy that the detectors are performing better than ever, so well done to commissioning teams!

Overall, there is a general reduction in spectral artifacts over O1 and O2, but there is still more work to do, especially when comparing H1 to L1. The 10 - 100 Hz band remains problematic, but there is good improvement in most of the rest of the frequency band. 

Data is taken from the Fscan automatically-generated SFTs of GDS-CALIB_STRAIN that are 1800 s long and use Tukey windowing. These SFTs are processed using the lalapps_spec_avg_long tool to generate the data files below.

O3 data can be found on the LHO cluster under:
~evan.goetz/CWDQ/O3/O3_[H|L]1_April2019.txt
where columns are given by
frequency, arithmetic mean PSD, arithmetic mean ASD, noise weighted PSD, noise weighted ASD

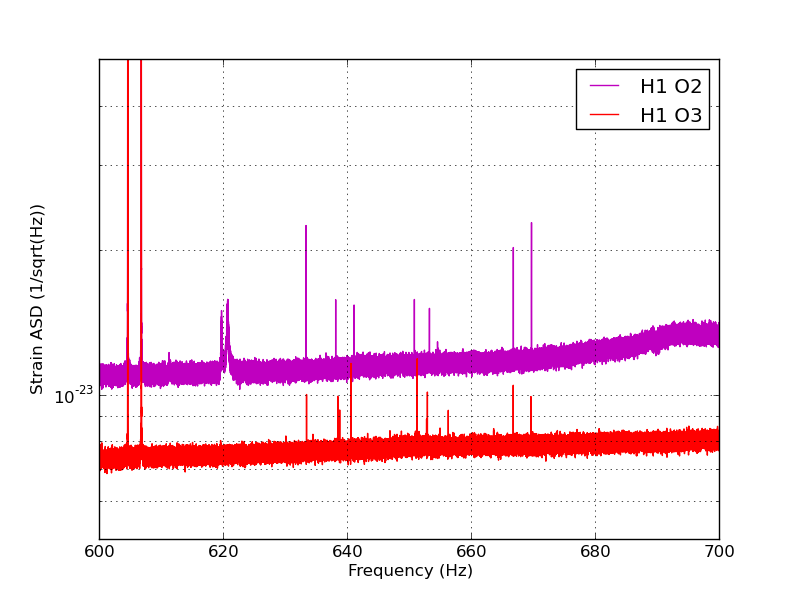
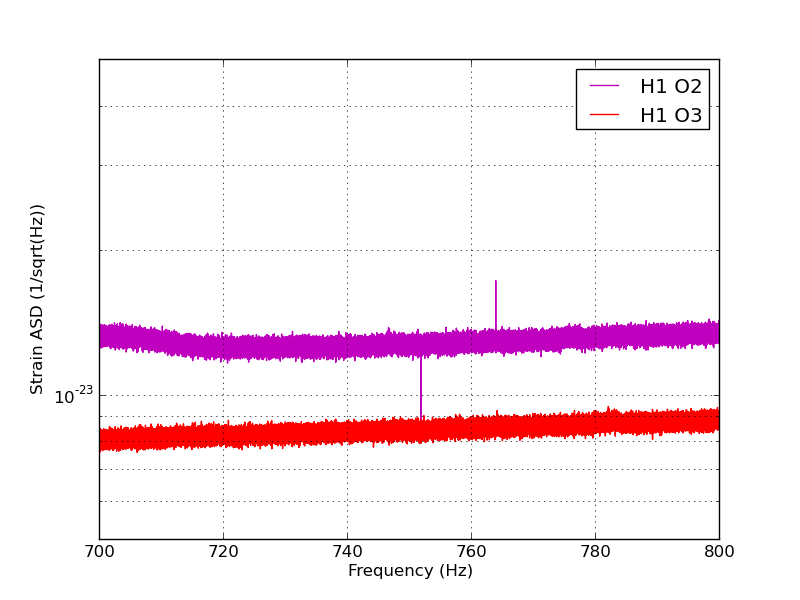
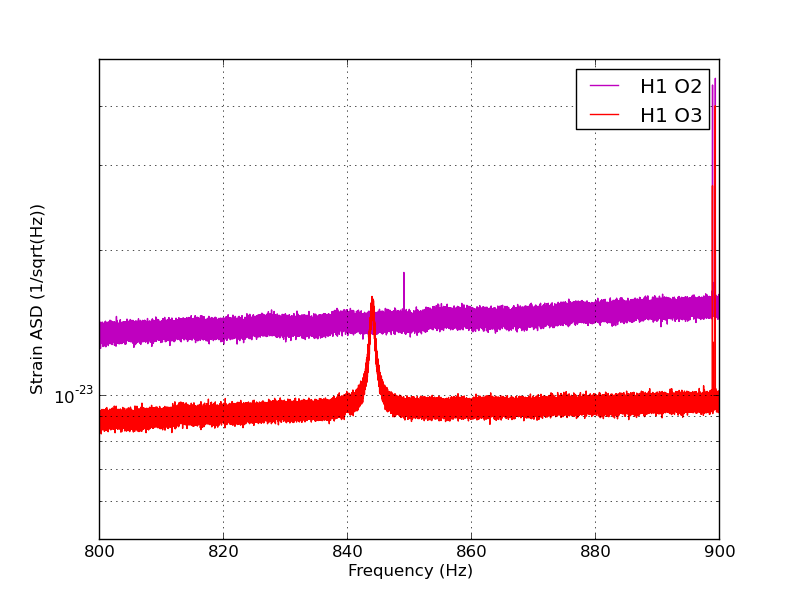
Attached are figures plotting this data showing the 10 Hz - 2 kHz band, and then zooms on specific regions (10-50 Hz, 50-100 Hz, 100 Hz bands from 100 Hz up to 1 kHz, 1 kHz - 1.25 kHz, 1.25 - 1.5 kHz, and finally 1.5 - 2 kHz). All plots show a comparison for H1 between O2 (June 2017 only) and O3 (first 4 weeks only). A final plot shows an O3 (first 4 weeks only) comparison between H1 and L1.

Some general points:
o While improved over O2, the 10 - 100 Hz band remains problematic for H1. Maybe there are some things done at L1 that can be applied also at H1 to improve this low frequency data
o There is good improvement in many bands; even as the broadband noise improved, more noise lines were not revealed. Good!
o Some new lines are present that were not there in O2 (dang, can't have everything...)
o Violin suspension resonances are spaced out more than in O2 (by design, I believe), but I can't tell if there is work to actively damp them during observing. The shoulders of the resonances are not too terrible, so maybe that implies some amount of damping work is in-place. When these ring up, lots of new lines can appear due to these loud peaks beating against other noise lines and introduce new noise into h(t). Keeping the violin line amplitudes to a minimum can help mitigate this effect.
o Some comb-like structures in the mid-600 Hz band seems to remain but with lower amplitude

Highest priority is to figure out coupling mechanisms of 10 - 100 Hz lines/combs and see what possible mitigation can be done. LLO may have some suggestions to assist with that.

Second priority is to understand some of the other line structures observed. Perhaps solving the low frequency line issues may also mitigate some of the higher frequency lines/combs

We will continue to monitor the data and provide further updates. Hopefully mitigations will help improve the spectrum! 
Images attached to this report
H1 ISC
jenne.driggers@LIGO.ORG - posted 13:48, Wednesday 01 May 2019 (48902)
Rephased AS WFS during DRMI-only lock

We struggled to reacquire after Georgia rephased the AS_A_RF36 WFS on Monday (alog 48857), even though her rephasing clearly made the ASC oscillations go away and improved some POP18 buildups.  Yesterday after maintenence I reverted the Monday rephasing, which enabled us to get locked.  At the beginning of the lock, we did not see the ASC oscillations, but after the IFO thermalized they were clearly there, and remained there throughout the rest of the lock stretch. 

I just gave a shot at rephasing the AS WFS that we use for BS, while we were locked with the arms still held off resonance.  BS ASC was using RF45 Q for its error signal (I had asked TJ to stop at ENGAGE_DRMI_ASC so that we were still on AS 45), and I drove BS in length (600 counts at 8 Hz in the BS M2 L2L filter bank).  I only changed AS_B_RF45 by +6 degrees, but I changed AS_A_RF36 by -20 degrees.  This is pretty different from Georgia's change of +25 degrees; our phasing results are 45 degrees different in DRMI-only versus full 35W IFO.  Interesting, and probably not so good.

H1 General
thomas.shaffer@LIGO.ORG - posted 12:40, Wednesday 01 May 2019 (48900)
Lock Loss 1859 UTC

Cause unknown so far. Bubba reported a dust devil heading toward the LSB OSB right around the time of the lock loss, interesting.

ETMY seemed to have moved a large amount after the lock loss. On the oplev, it went from +4 to -19 in pitch. I haven't checked the TMSY yet, but I had to move that a bit as well.

H1 General
thomas.shaffer@LIGO.ORG - posted 09:48, Wednesday 01 May 2019 - last comment - 17:20, Thursday 02 May 2019(48897)
Briefly out of Observing for small change

LLO informed us that they would be out of observing for ~20 min while they damped violin modes. Virgo was also down, so we got the okay to make a small change.

1639 Out of Observing

1645 Observing

Comments related to this report
jenne.driggers@LIGO.ORG - 11:35, Wednesday 01 May 2019 (48898)

I took this opportunity to change the MICH and SRCL feedforward, with some new fits to the data I took on Friday after we'd thermalized with the SR3 heater at 4W (alog 48792). 

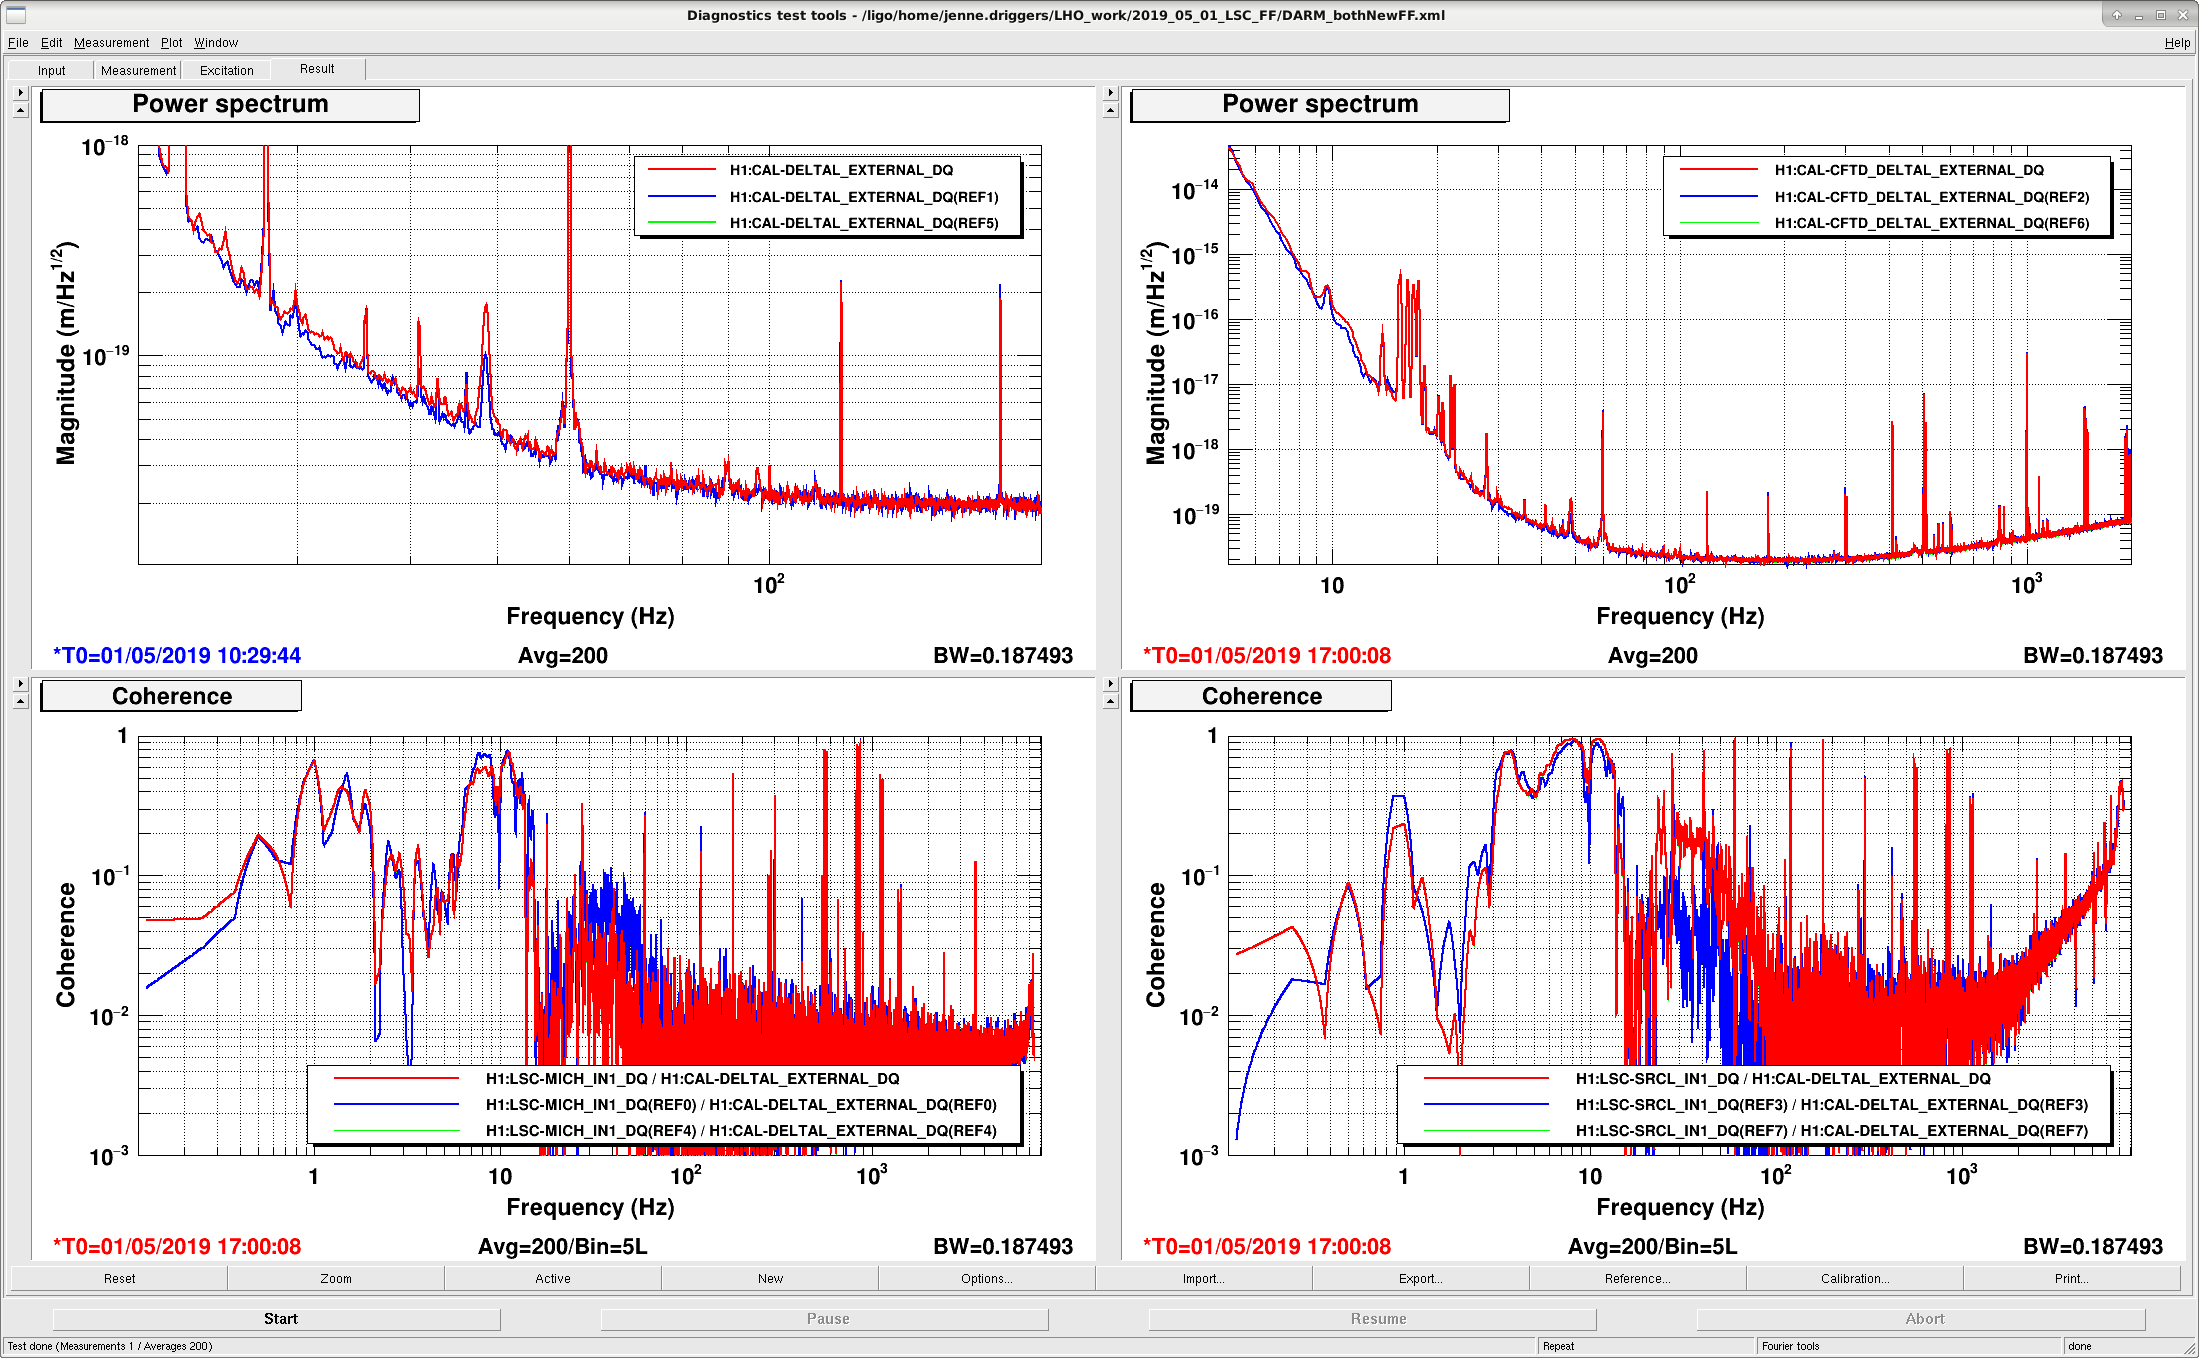
Unfortunately, I don't think it's actually better. In the attached figure, blue is a reference from earlier in this lock, and red is after I'd switched both MICH and SRCL feedforward filters to the new fits.  The MICH coherence went down, but that could be just because the SRCL made things a bit worse?  We lost about 3 Mpc with the new feedforward.

Images attached to this comment
jenne.driggers@LIGO.ORG - 17:20, Thursday 02 May 2019 (48950)

This afternoon, while working on some ASC things, I reverted the SRCL FF to the old nominal Feb28 filter.  I don't see a change in the DARM spectrum, but the coherence between DARM and SRCL has decreased.  MICH is still using the new fits.

LHO General
thomas.shaffer@LIGO.ORG - posted 08:08, Wednesday 01 May 2019 (48893)
Ops Day Shift Transition

TITLE: 05/01 Day Shift: 15:00-23:00 UTC (08:00-16:00 PST), all times posted in UTC
STATE of H1: Observing at 113Mpc
OUTGOING OPERATOR: Travis
CURRENT ENVIRONMENT:
    Wind: 9mph Gusts, 7mph 5min avg
    Primary useism: 0.01 μm/s
    Secondary useism: 0.10 μm/s
QUICK SUMMARY: Locked for 16.75 hrs, calm environment. The ASC Y oscillation is back, as expected after yesterday.

H1 DetChar (DetChar, ISC, SQZ)
andrew.lundgren@LIGO.ORG - posted 07:55, Wednesday 01 May 2019 - last comment - 17:19, Thursday 02 May 2019(48892)
Some Diagnostics of Squeezer Noise in h(t)
Andy, with input from Beverly, Laura, and Josh

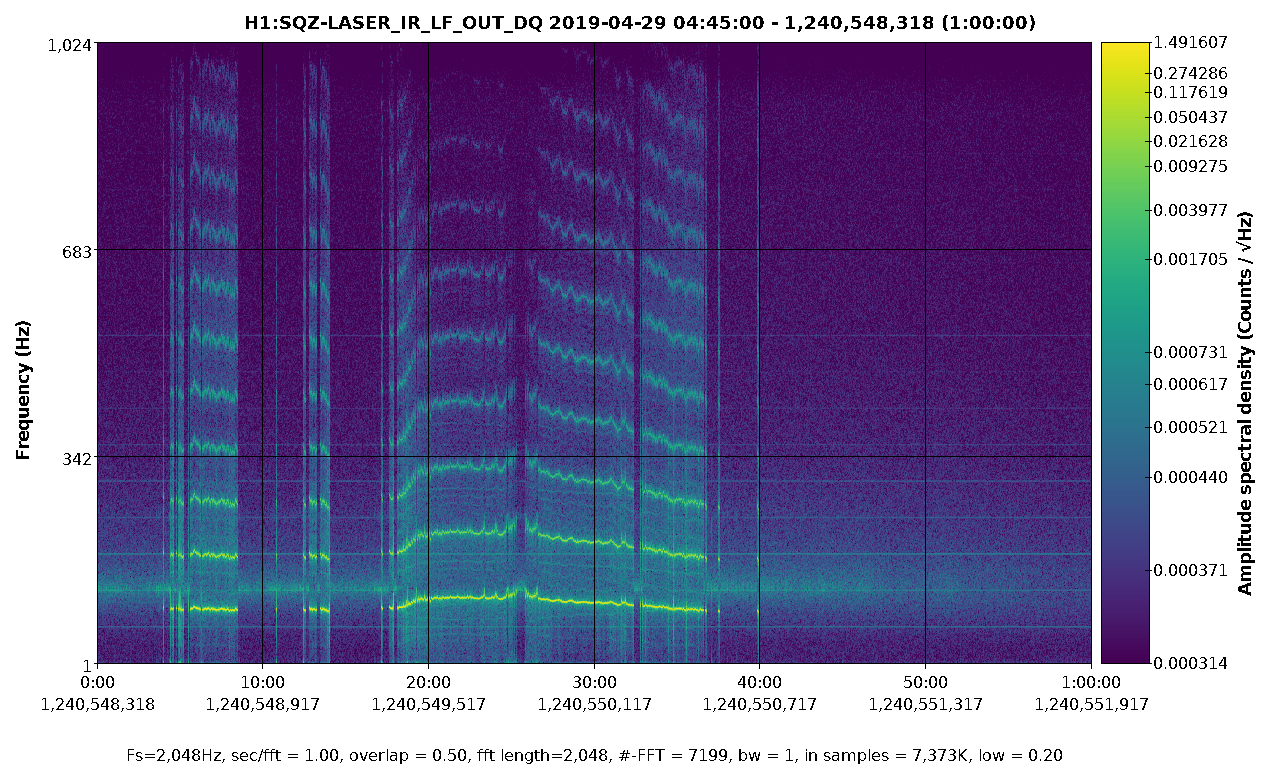
The strong wandering lines in h(t) caused by the squeezer are becoming more frequent and more severe. This seems like it could be quite a problem for the searches, so I'm putting some information here to hopefully push this to be diagnosed and resolved.

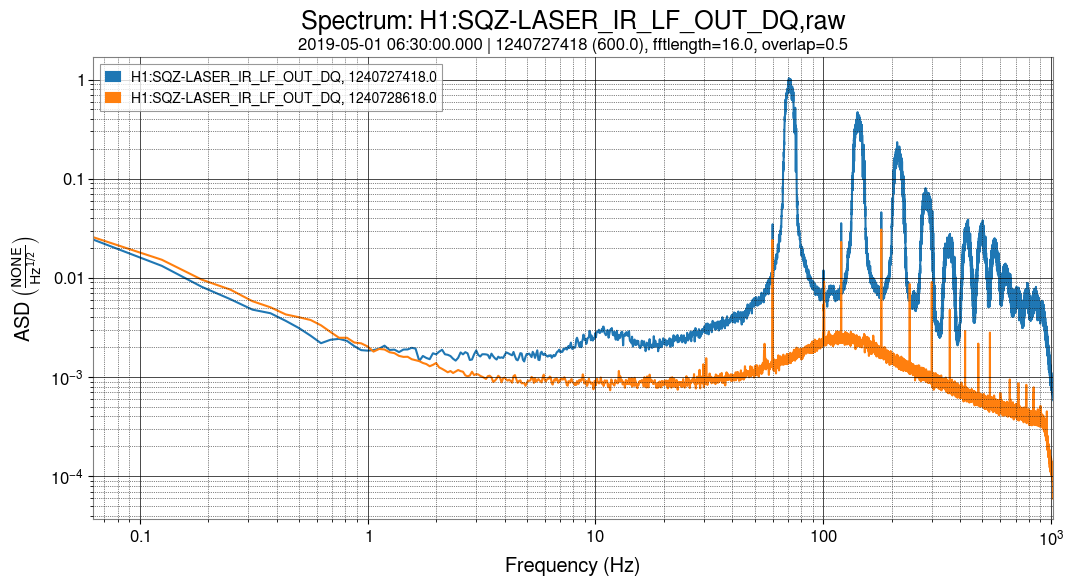
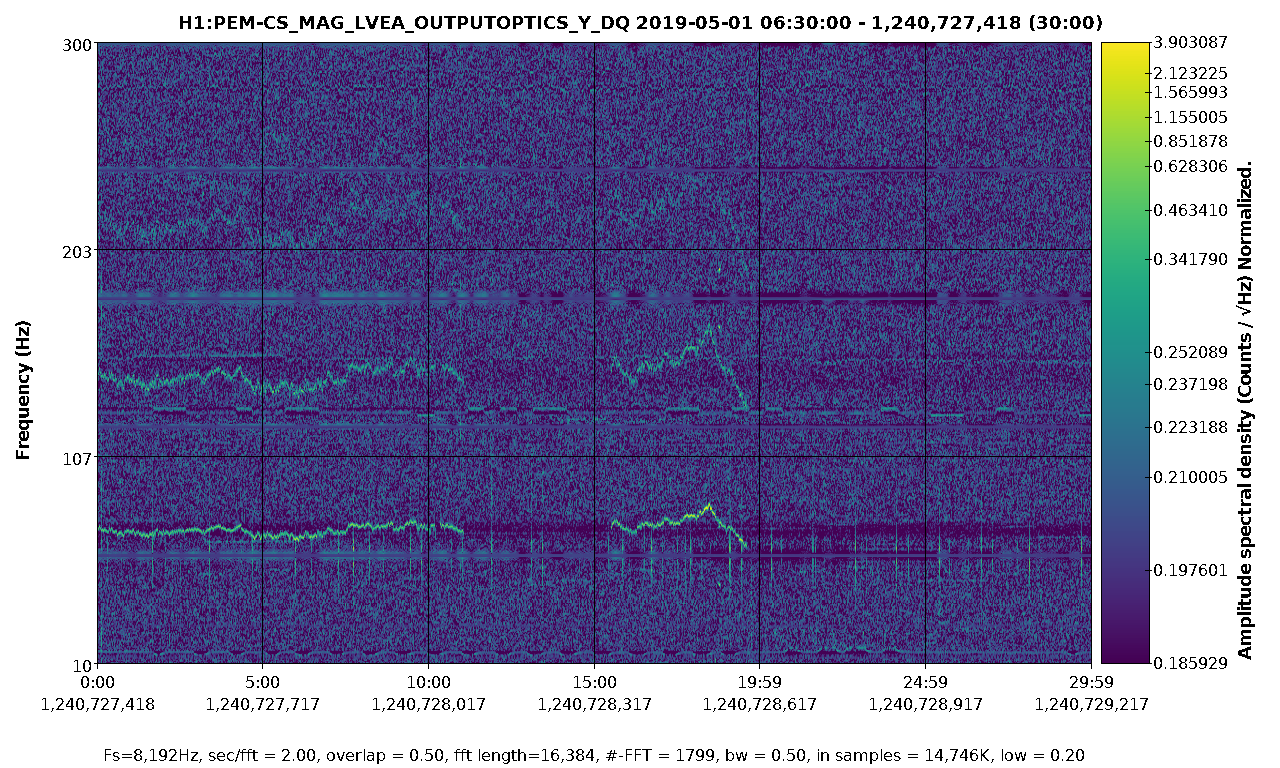
The wandering line was noticed a week ago (alog 48772). It comes and goes, both in h(t) and in the squeezer channels. In the squeezer, it's an equally spaced comb of lines, with the first wandering from about 80 to 140 Hz. The line comes and goes quite suddenly. The first attachment shows what it looks like in one of the squeezer channels.

This seems similar to the 200 Hz wandering line from the LLO squeezer. The solution (LLO alog 43837 was a highpass before the TTFSS.

The attached PDF has spectra of several channels during the noise compared to a reference time. Nothing is visible on the fiber transmitted PD, but it is on the fiber PD, the IR laser LF, and a bunch of mixer channels.

Also of note is that the CLF RF6 and REFL RF80 RFMONs both get much noisier when the lines appear. There's a very small bit of extra noise also seen on FIBR_SERVO_DEMOD_RFMON.

I would speculate that this looks like a loop that's not quite stable, but everything is so coupled it's hard to tell where. Is it possible that the harmonics are generated by the noisy line going through the SHG and getting mixed with itself repeatedly?

Images attached to this report
Non-image files attached to this report
Comments related to this report
sharan.banagiri@LIGO.ORG - 09:11, Wednesday 01 May 2019 (48894)
A couple of other things about this line. 

1) When the line acts up, It is clearly visible in the OUTPUTOPTICS magnetometer channel which is the closest to ISCT6

2) Yesterday, the line came back as soon as got to NLN after maintenance. With Jenne's help, we closed the SQZ beam diverter  -  to use it as an opportunity to confirm that the squeezer was causing it. Closing it causes the line to go away in DARM, although the line is still visible in the magnetometer channel and some of the squeezer channels. The line came back when we turned it back on a minute later. 


Relevant spectrograms in slides 10 - 13 of the attached pdf

Non-image files attached to this comment
daniel.sigg@LIGO.ORG - 08:42, Wednesday 01 May 2019 (48895)

The high pass filter in TTFSS was added at LHO, alog 47296.

lee.mcculler@LIGO.ORG - 09:07, Wednesday 01 May 2019 (48896)SQZ

The real solution at LLO was to disable the laser noise eater on the SQZ laser. The high-pass allowed us to make that switch without other consequences.

andrew.lundgren@LIGO.ORG - 13:39, Wednesday 01 May 2019 (48901)DetChar, ISC, SQZ
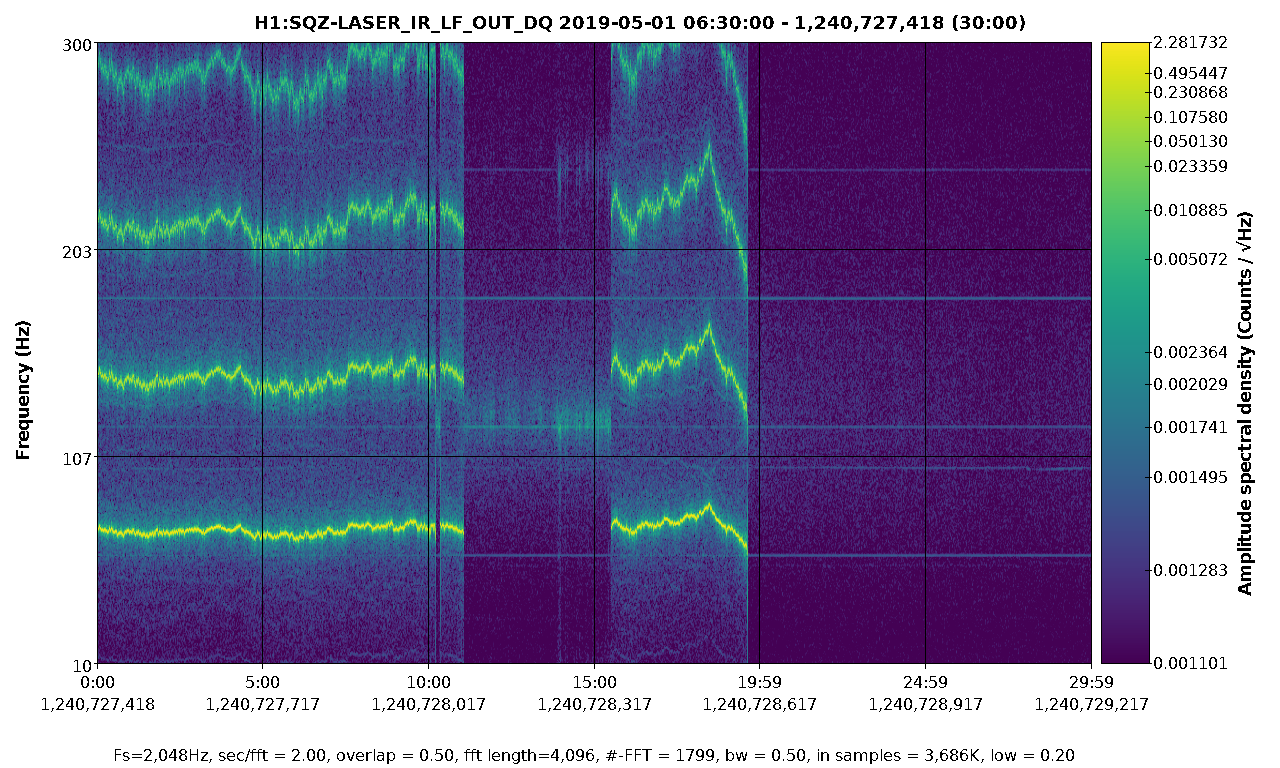
The lines aren't the only excess noise. LASER_IR_LF has a jump in the broadband noise floor when the lines appear. I've attached a spectrogram and a spectrum.

The magnetometer sees the main line and its first two harmonics. They disappear instantly whenever the lines in the squeezer do - see third attachment. It seems like this is more likely to be pickup from a problem in the squeezer, because having all of the line harmonics be EM noise seems unlikely, and there would also likely need to be broadband noise.

Was there any change to the outputoptics magnetometer during maintenance yesterday? The coupling of the squeezer lines into the magnetometer is much stronger starting from the first lock after maintenance.
Images attached to this comment
sharan.banagiri@LIGO.ORG - 15:50, Wednesday 01 May 2019 (48904)
No, I don't think there was any change either with the squeezer or the magnetometer. 
sheila.dwyer@LIGO.ORG - 20:10, Wednesday 01 May 2019 (48910)

The noise eater could be toggled off and on again, using the switch on the controller mounted on top of ISCT6.  It looks just like the noise eater switches on the PSL and ALS laser controllers.  (Toggling it might not fix the problem, it might need to be off but it’s probably worth trying to toggle it first.) 

sharan.banagiri@LIGO.ORG - 09:19, Thursday 02 May 2019 (48927)DetChar
Jenne and I went in to the LVEA and discovered the noise eater control on ISCT6 was hooked up to a remote system. Jenne toggled it off from the control room, and turned it back on ~ 30 seconds later at 16:14:55 UTC. Lets see if it works!


jenne.driggers@LIGO.ORG - 17:19, Thursday 02 May 2019 (48949)

The noise came back, and doing an on/off test a few times indicated clearly that turning the SQZ laser noise eater off made these lines go away, so the noise eater is now off.

H1 OpsInfo
richard.mccarthy@LIGO.ORG - posted 06:10, Wednesday 01 May 2019 (48891)
Morning Update on Owl Shift
Ops Shift Log: 05/01/2019, Owls to 13:10 UTC
State of H1: Locked at NLN for almost 14:40 hours
Intent Bit: Observing
Support: N/A
Incoming Operator: Not Yet
Shift Summary: IFO has been locked and Observing. Wind has been moderate the last 6 hours,  microseism has been low. The range is 111+Mpc. 
Oscillation on ASC is very consistent.
 
H1 General
jeffrey.bartlett@LIGO.ORG - posted 00:01, Wednesday 01 May 2019 (48889)
Ops Envening Shift Summary
Ops Shift Log: 04/30/2019, Evening Shift 23:00 – 07:00 (16:00 - 00:00) Time - UTC (PT)
State of H1: Locked at NLN for almost 9 hours
Intent Bit: Observing
Support: N/A
Incoming Operator: Travis
Shift Summary: IFO has been locked and Observing for entire shift. Wind has been up and down most of the evening, keeping primary microseism moving around as well. The range is 111.7Mpc. Running a monitored test of the Guardian Automation. The ASC control signals and DARMblrms have been active all shift, but seem to not have affected operations.    
 
Activity Log: Time - UTC (PT)
23:00 (16:00) Take over from TJ
07:00 (00:00) Turn over to Travis
H1 General
jeffrey.bartlett@LIGO.ORG - posted 20:41, Tuesday 30 April 2019 (48888)
Ops Evening Mid-Shift Summary
   IFO has been locked and Observing for the past 4.25 hours, with a range of 111.3Mpc. The wind has dropped to under 10mph and primary microseism is down as well. Smooth first half of the shift. 
H1 DetChar (DetChar, ISC)
sumeet.kulkarni@LIGO.ORG - posted 19:56, Tuesday 30 April 2019 (48864)
DQ Shift: LHO O3 Week 4 Monday 22 April 2019 00:00 UTC - Sunday 28 April 23:59 UTC

Shifter: Sumeet Kulkarni

Fellow/Mentor: Ling Sun

Summary:


Complete details can be found at https://wiki.ligo.org/DetChar/DataQuality/DQShiftLHO20190422.

Images attached to this report
H1 DetChar (DetChar, ISC)
sumeet.kulkarni@LIGO.ORG - posted 19:53, Tuesday 30 April 2019 - last comment - 13:57, Thursday 02 May 2019(48863)
Whistle glitches in LHO


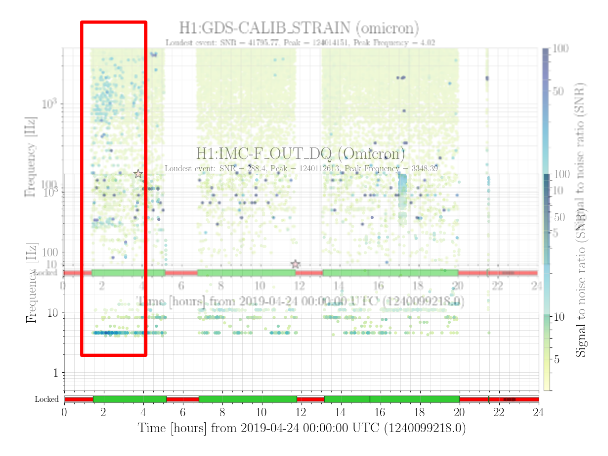
Whistle glitches are being seen with an increasing frequency of occurrence starting from April 22.

The stretches of time when they were seen over the last week are as follows:

* April 22 (Monday): between 09:00-11:00 UTC; this coincided with an Earthquake.

* April 24 (Wednesday): between 01:45-02:30 UTC

* April 26 (Friday): between 13:00-16:30 UTC; this coincided with a period of high winds.

Today (April 30), they can be seen throughout the stretch of Lock between 02:00-15:00 UTC.

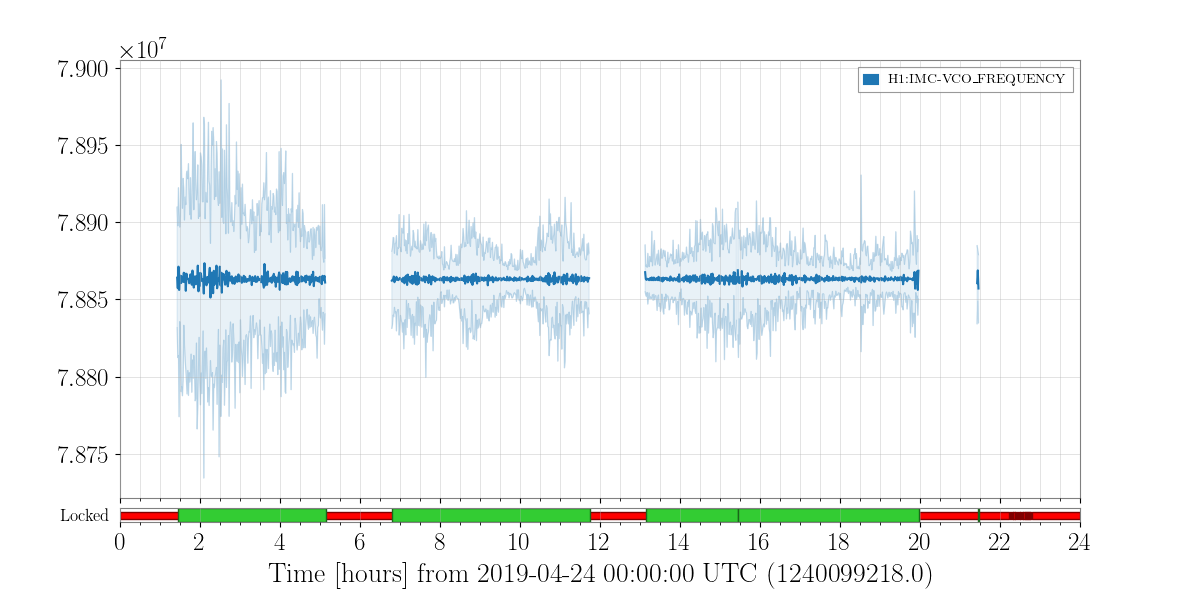
The whistles are accompanied by an increase in variance of the VCO frequency and a corresponding low-frequency (4-5 Hz.) glitching in the IMC-F motion. (plots attached from Wed. April 24).

While high winds and an Earthquake might have been the cause on a couple of instances listed above, whistles have also been seen when the wind and ground motion has not been high. It is not known what causes the increased VCO motion at other times.

Images attached to this report
Comments related to this report
kentaro.mogushi@LIGO.ORG - 13:57, Thursday 02 May 2019 (48939)DetChar

I have noticed that the variance between ASC DHARD increases when that of VCO frequency increases, for example, on the following days,

* April 22 (Monday)

* April 24 (Wednesday)

* April 26 (Friday)

* April 29 (Monday).

Please let me know if someone has known this correlation. 


H1 PEM (DetChar)
robert.schofield@LIGO.ORG - posted 17:32, Tuesday 30 April 2019 (48886)
Impulse injection techniques point towards septum as being main source of HAM5/6 scattering at LLO and at LHO

Sharan Banagiri, Corey Austin, Philippe Nguyen, Anamaria Effler, Robert Schofield

Summary: For impulse injections from multiple locations, signals from accelerometers mounted on the HAM5/6 septum are the best match to DARM in arrival time, have the most consistent amplitude ratios with DARM, and have the most similar frequency structure to the effect of the impulse in DARM. Together with shaking data, this suggests that the septum is the dominant vibration coupling site in the LVEA at both sites. These vacuum enclosure impulse techniques promise to be a useful new tool for diagnosing scattering noise.

Shaking injections made throughout the corner station have shown, in recent PEM injections, as well as for some time before that, that above a few Hz, motion of the vacuum enclosure couples most strongly to DARM in the HAM5/6 area of both LHO and LLO. We have had trouble narrowing down the coupling site further using the shaking amplitude technique because the HAM5/6 region is relatively small and interconnected (if you shake one side of HAM5, the opposite side of HAM6 moves almost as much).

Impulse injection delays

To provide extra information, we investigated the use of impulse propagation delays to help identify coupling sites. In the past, we have narrowed down coupling sites by looking for the microphone that detects an acoustic impulse at about the same time that the signal appears in DARM. And, of course, we have tapped on the vacuum enclosure. But we hadn’t tried using propagation delays from impacts on the vacuum enclosure to accelerometers mounted on the enclosure. While the vacuum enclosure is made of steel, the propagation velocity of waves on the steel membrane and structure is much lower than the velocity for bulk steel, resulting in tens of millisecond delays for propagation between HAM5 and 6.

Figures 1 and 2 show, for LHO and LLO respectively, examples of impulse injection data. These and other injections indicate that vacuum enclosure impulses show up in DARM about the same time as it shows up on the septum accelerometer.

The down side to the impulse timing technique is that higher frequencies are needed in order to discriminate arrival times (here we have used a 70-200 Hz band). Thus, there is the danger that a coupling site that dominates at low frequencies is not the dominant site at high frequencies. However, we have checked bands at lower frequencies and not seen obvious differences and results from two other impulse-based techniques are consistent.

Impulse injection amplitudes

In addition to arrival timing, we also used the amplitude of the prompt impulse vs. the amplitude of the prompt signal in DARM to discriminate coupling locations. The examples in Figures 1 and 2 show that the amplitude in DARM is most consistent with the amplitude of the signal on the septum accelerometer. An advantage of the impulse technique over our usual shaking is that there appears to be a greater difference in amplitude between accelerometers on HAM5 and those on HAM6 for an impulse injection than for a steady state injection. This may be because, for the steady state, the many late reflections have built up the amplitude to nearly the same at all locations in the region (in equilibrium, the energy gets distributed more evenly).

Impulse injection frequency content

A third impulse technique that points towards the septum at both sites, is a comparison of the frequency structure of the impulse signal in DARM to the frequency structure of vacuum enclosure resonances at the various accelerometers. Figure 3 shows that, for both sites, the frequencies that appear strongest in DARM are also the frequencies with the greatest motion in the signals from the beam-axis accelerometers on each site’s septum. That is, the septum resonance pattern appears to best match the frequency pattern produced by the impulse in DARM. 

While results from these three techniques are not individually overwhelming evidence that the dominant coupling site is the septum, together they build a strong case.

We started out using soft hammers to impact the vacuum enclosure, but this evolved into using a long rod, with an inch-thick soft rubber pad mounted at the end, that could reach the tops of enclosures and keep the user further away from sensitive regions. In addition, the extended impact associated with the pad and the flexing of the long rod helped emphasize lower frequencies. A photograph is shown in Figure 4.  For this study, all impulse injections were analyzed by hand. It may be worth beginning to automate these techniques.

In addition to the HAM 5/6 area, we also made impulse injections at end stations and other LVEA locations during the PEM injection program, which will be discussed in a future log (preliminary: at LLO EY impulse injections are consistent with coupling at the manifold).

Non-image files attached to this report
H1 DetChar (DetChar, ISC)
andrew.lundgren@LIGO.ORG - posted 15:39, Tuesday 30 April 2019 - last comment - 02:01, Wednesday 01 May 2019(48881)
AS-A Rephasing Degraded Sensitivity
The rephasing of AS-A, since reverted, caused a big bump in h(t) from 20 to 30 Hz that I think was responsible for the drop in range by 10-15 Mpc.

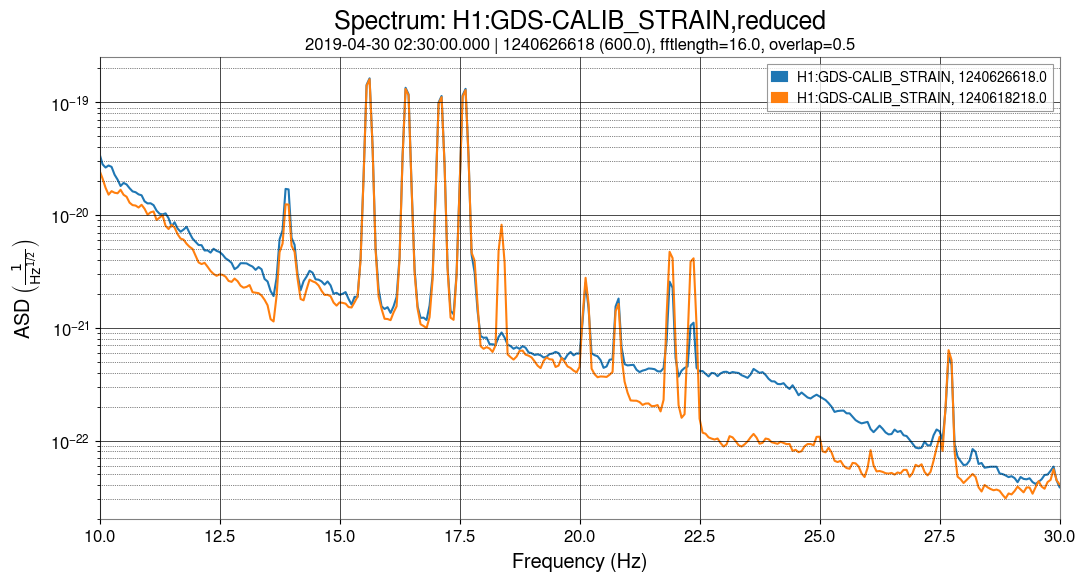
The rephasing (alog 48857) improves the 9 MHz buildup and the slow yaw oscillation. But the range (plot 1) drops from 115 to 105 MPc (roughly) due to a feature from 20 to 30 Hz (plot 2). It looks a bit like a scattering shelf but has a featureless spectrogram - no arches.

I don't see any coherence of the new noise with the MICH_P or Y channels. I've set up a BRUCO run that might help figure out where the excess noise comes from.
Images attached to this report
Comments related to this report
georgia.mansell@LIGO.ORG - 16:05, Tuesday 30 April 2019 (48882)

When we rephrased rf36 we changed the pointing of the beamsplitter. The extra noise looked a bit like bad A2L decoupling to me. I think maybe we should phase rf36 so the 9 MHz build ups are good and then revisit the A2L to fix the low frequency noise?

andrew.lundgren@LIGO.ORG - 02:01, Wednesday 01 May 2019 (48890)DetChar, ISC
The Bruco results show big coherence with REFL_A RF45  yaw (both I and Q). The spectrum of REFL LF is elevated after the rephasing and has coherence in the same place. So A2L or touching up the alignment after the beamsplitter moves seems like it would help.

Note: My first Bruco run failed (user error), so here's the new link.
H1 ISC
jenne.driggers@LIGO.ORG - posted 13:04, Friday 26 April 2019 - last comment - 12:34, Wednesday 01 May 2019(48792)
Fresh LSC feedforward measurements taken

I have taken fresh LSC feedforward measurements, after the IFO had been at 35W for about 2 hours, and the SR3 heater had been at 4W for at least 2.5 hours.  This used about 30 min of commissioning time. 

Note to self for the future: All of the FF_to_DARM templates should give identical results, since the feedforward signals go through the same path to DARM (via differential ETM output matrix elements), so make sure that the frequencies that have coherence are good enough in one template for all 3 LSCs, then we only have to take one version of this measurement, rather than the 3 I took today.

Since we haven't had a PRCL FF measurement before, I copied templates from MICH and SRCL FF, and then used the PRCL excitations from Sheila's noise buget folder.  I also set the PRCL FF elements of the LSC output matrix to match the MICH and SRCL values of ETMX=+1, ETMY=-1.  I'll try to find a moment to fix the screen, but the FF output matrix screen doesn't display the PRCL column of the matrix, so these are currently hidden.

Data is saved in the usual place: /opt/rtcds/userapps/release/lsc/h1/scripts/feedforward/ , and it's all checked into the svn.  I did update the references in all of the templates, since I can't remember how old they are, but they're pretty old.

Comments related to this report
jenne.driggers@LIGO.ORG - 12:34, Wednesday 01 May 2019 (48899)

I spent some time figuring out the ipython notebooks for MICH and SRCL feedforward fitting, then reorganized them, removed a lot of unused code, and added a bunch of comments, so that hopefully it is a little more user friendly.

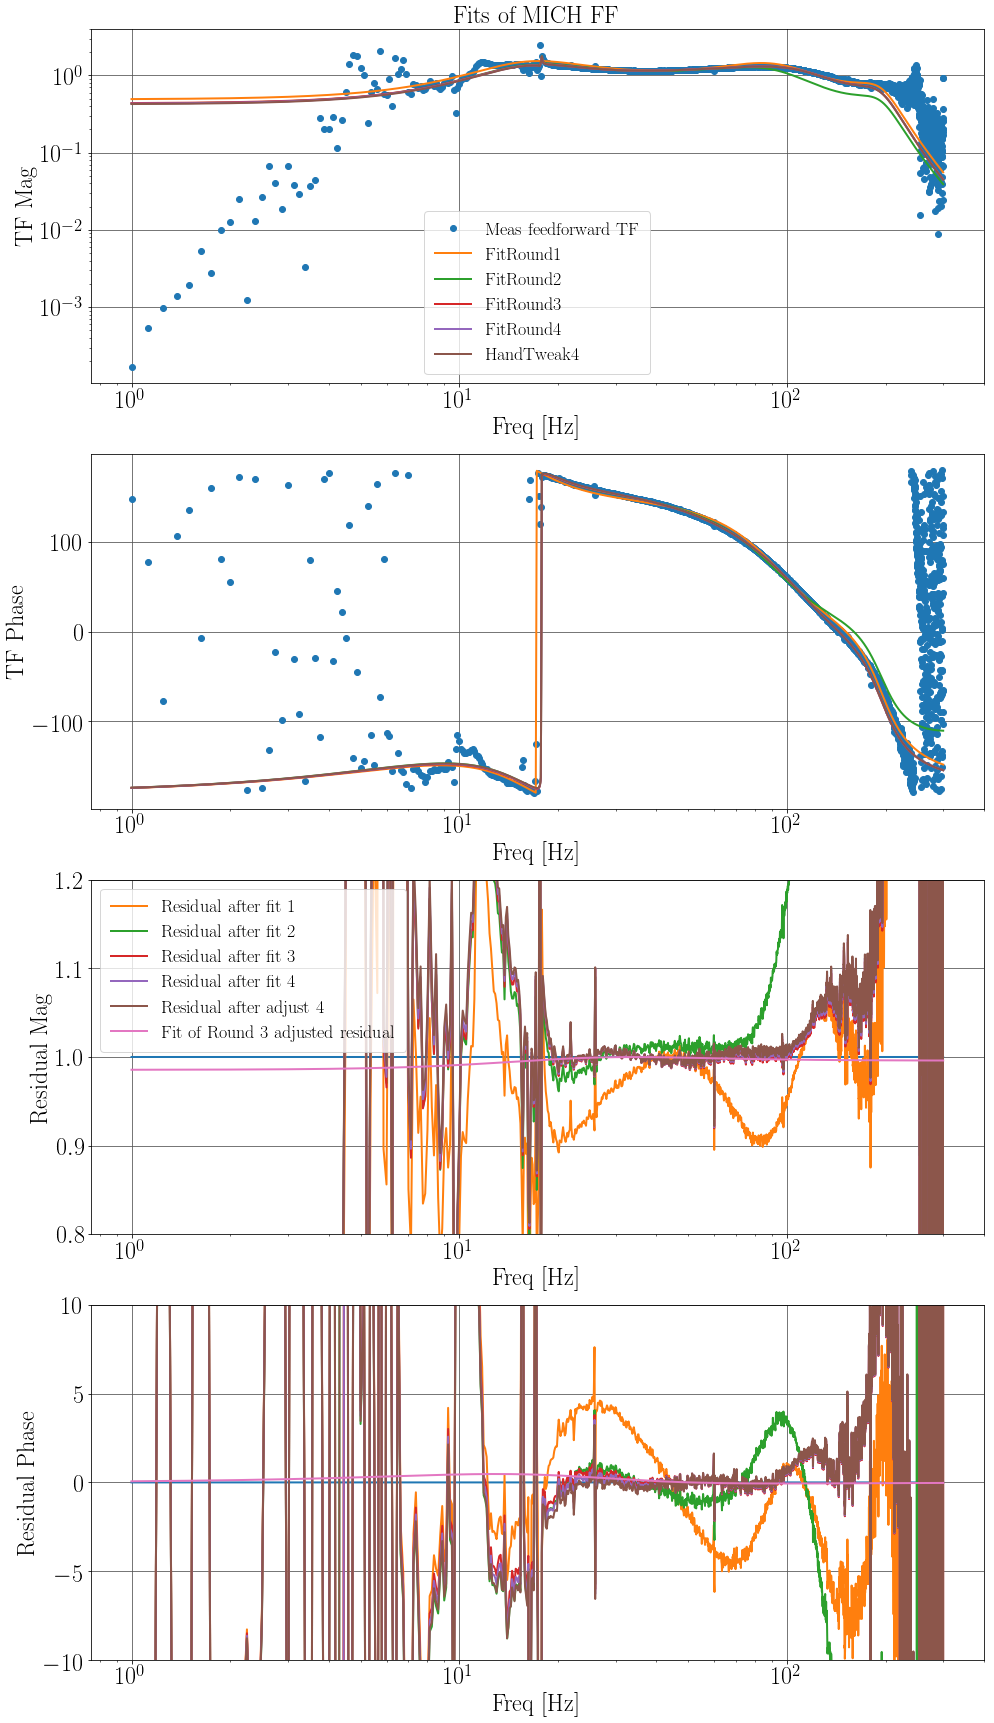
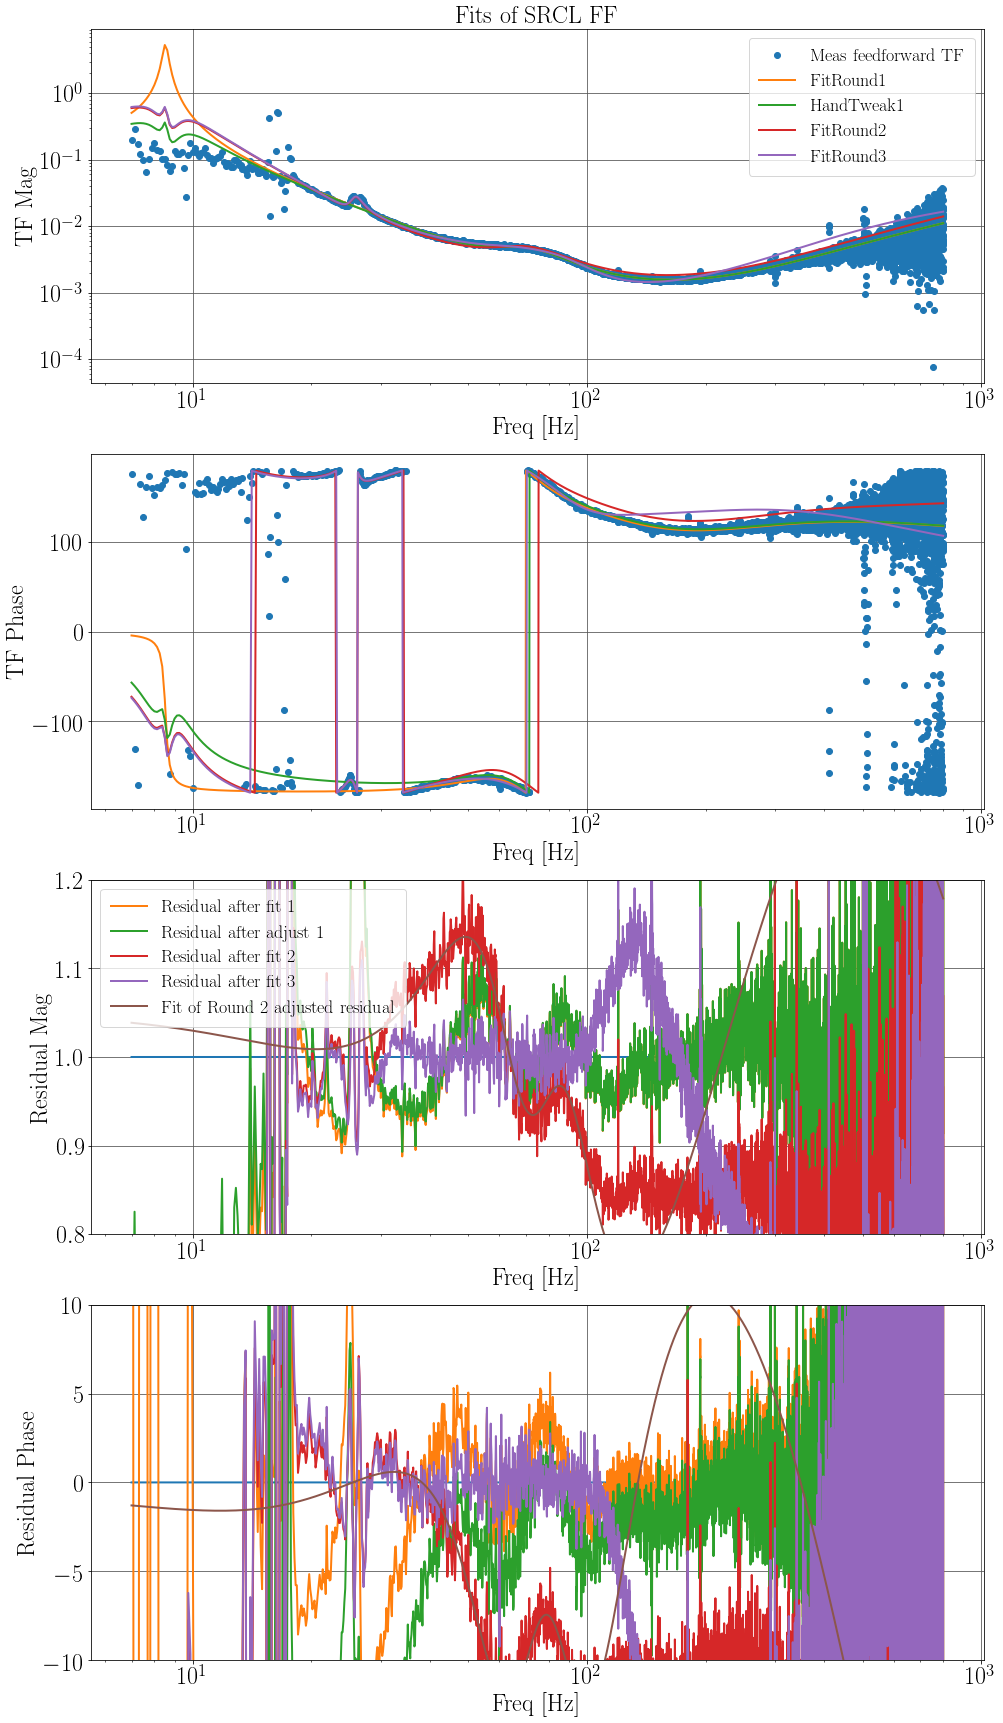
One of the big changes I made was iterating on the fits.  I let iirrational run and get a good fit, then I apply that filter to the measured feedforward transfer function, and redo the fitting.  I repeat this several times until the residual between the measured TF and the fit is very nearly unity in the band that we care about.  Note that, as Danny and others had found, I do have to fiddle with the frequencies, coherence threshold, and fit order for each of my rounds of fitting, so this is not yet an automated process.  Perhaps this is something that we can ask the CSWG to look into making more automated by iterating over different fitting parameters and then keeping the one with the lowest residual. 

The first two attached figures are the results of my fits for MICH and SRCL.  The blue dots are the measured feedforward transfer functions, and the colors are the fitted filters or residuals after different rounds of fitting.  Orange is after the first fit, then green, red, purple, and brown.  For MICH I am using the brown result, and for SRCL am using the purple. 

Unfortunately, these didn't seem to help a whole lot. The third figure is DARM and coherence of DARM with MICH and SRCL with blue being earlier in the lock and red after I changed both MICH and SRCL to the new filters.  I do wonder a bit if part of the reason that it doesn't look so great in these long averages is that the ASC is oscillating and the IFO is moving around with a ~2 minute period.  For just a few averages, it seems like there is a bit of an improvement in DARM around 30 Hz, but it goes away after a few averages.

Images attached to this comment
Displaying reports 41361-41380 of 88808.Go to page Start 2065 2066 2067 2068 2069 2070 2071 2072 2073 End