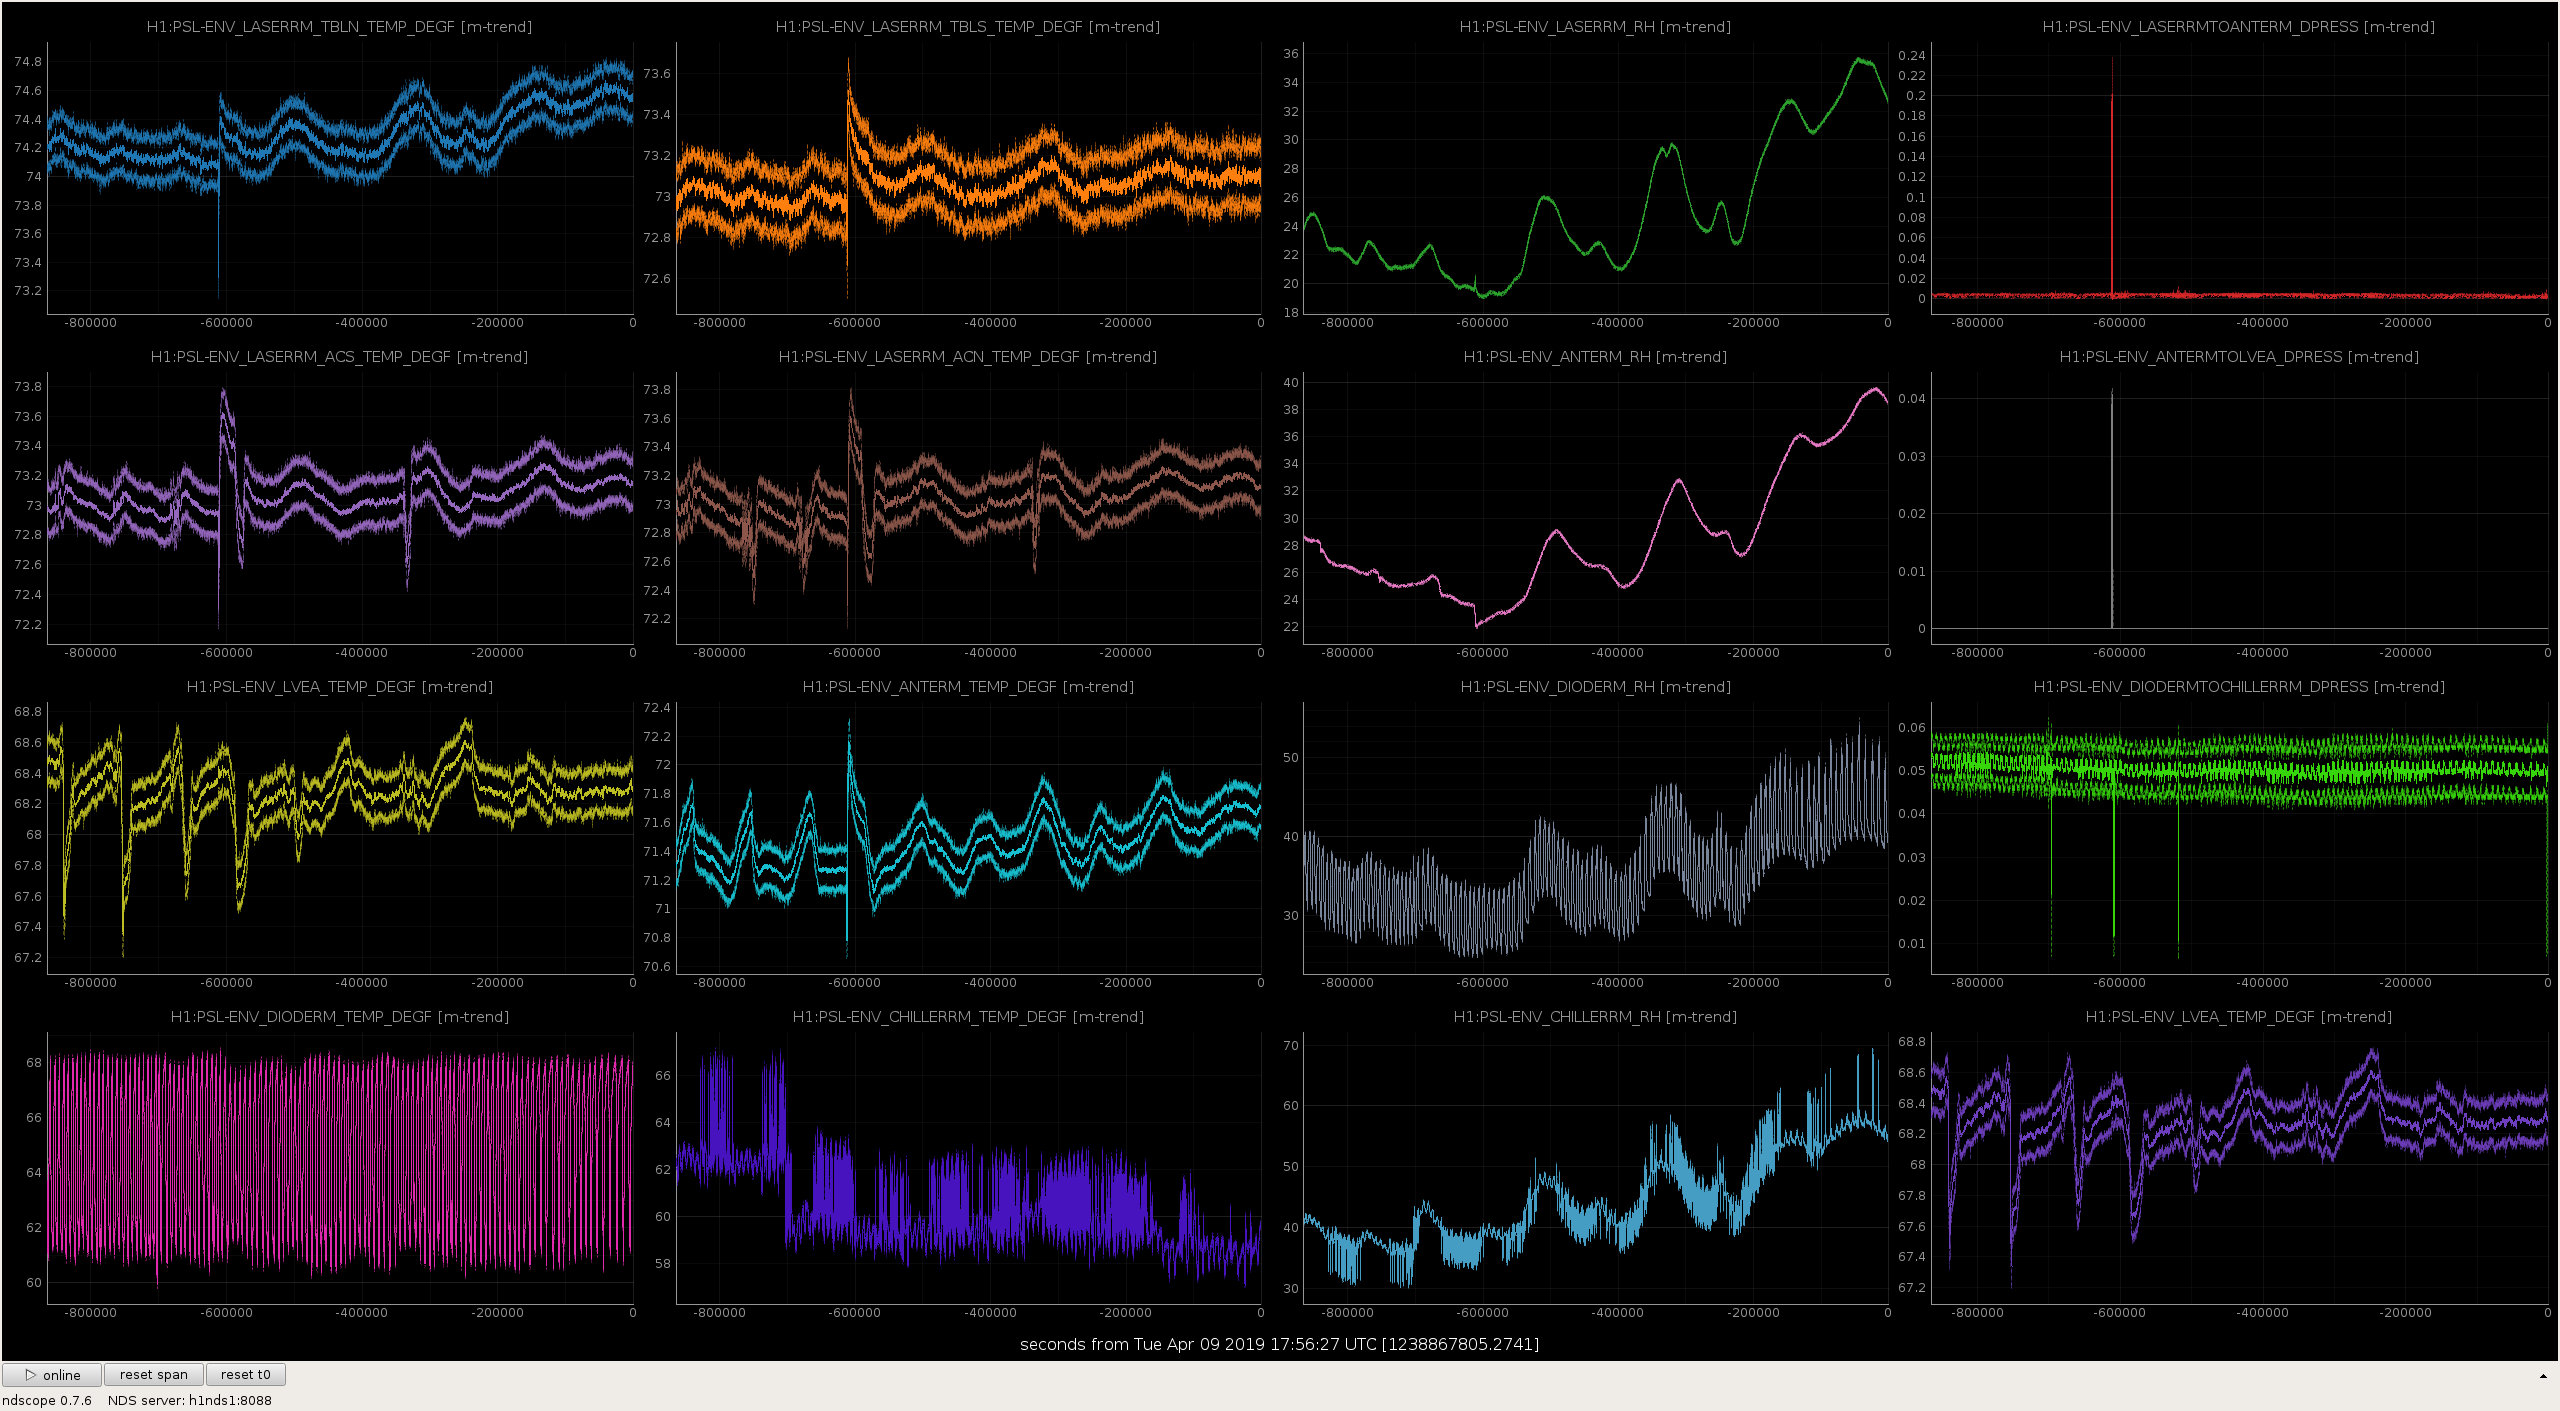
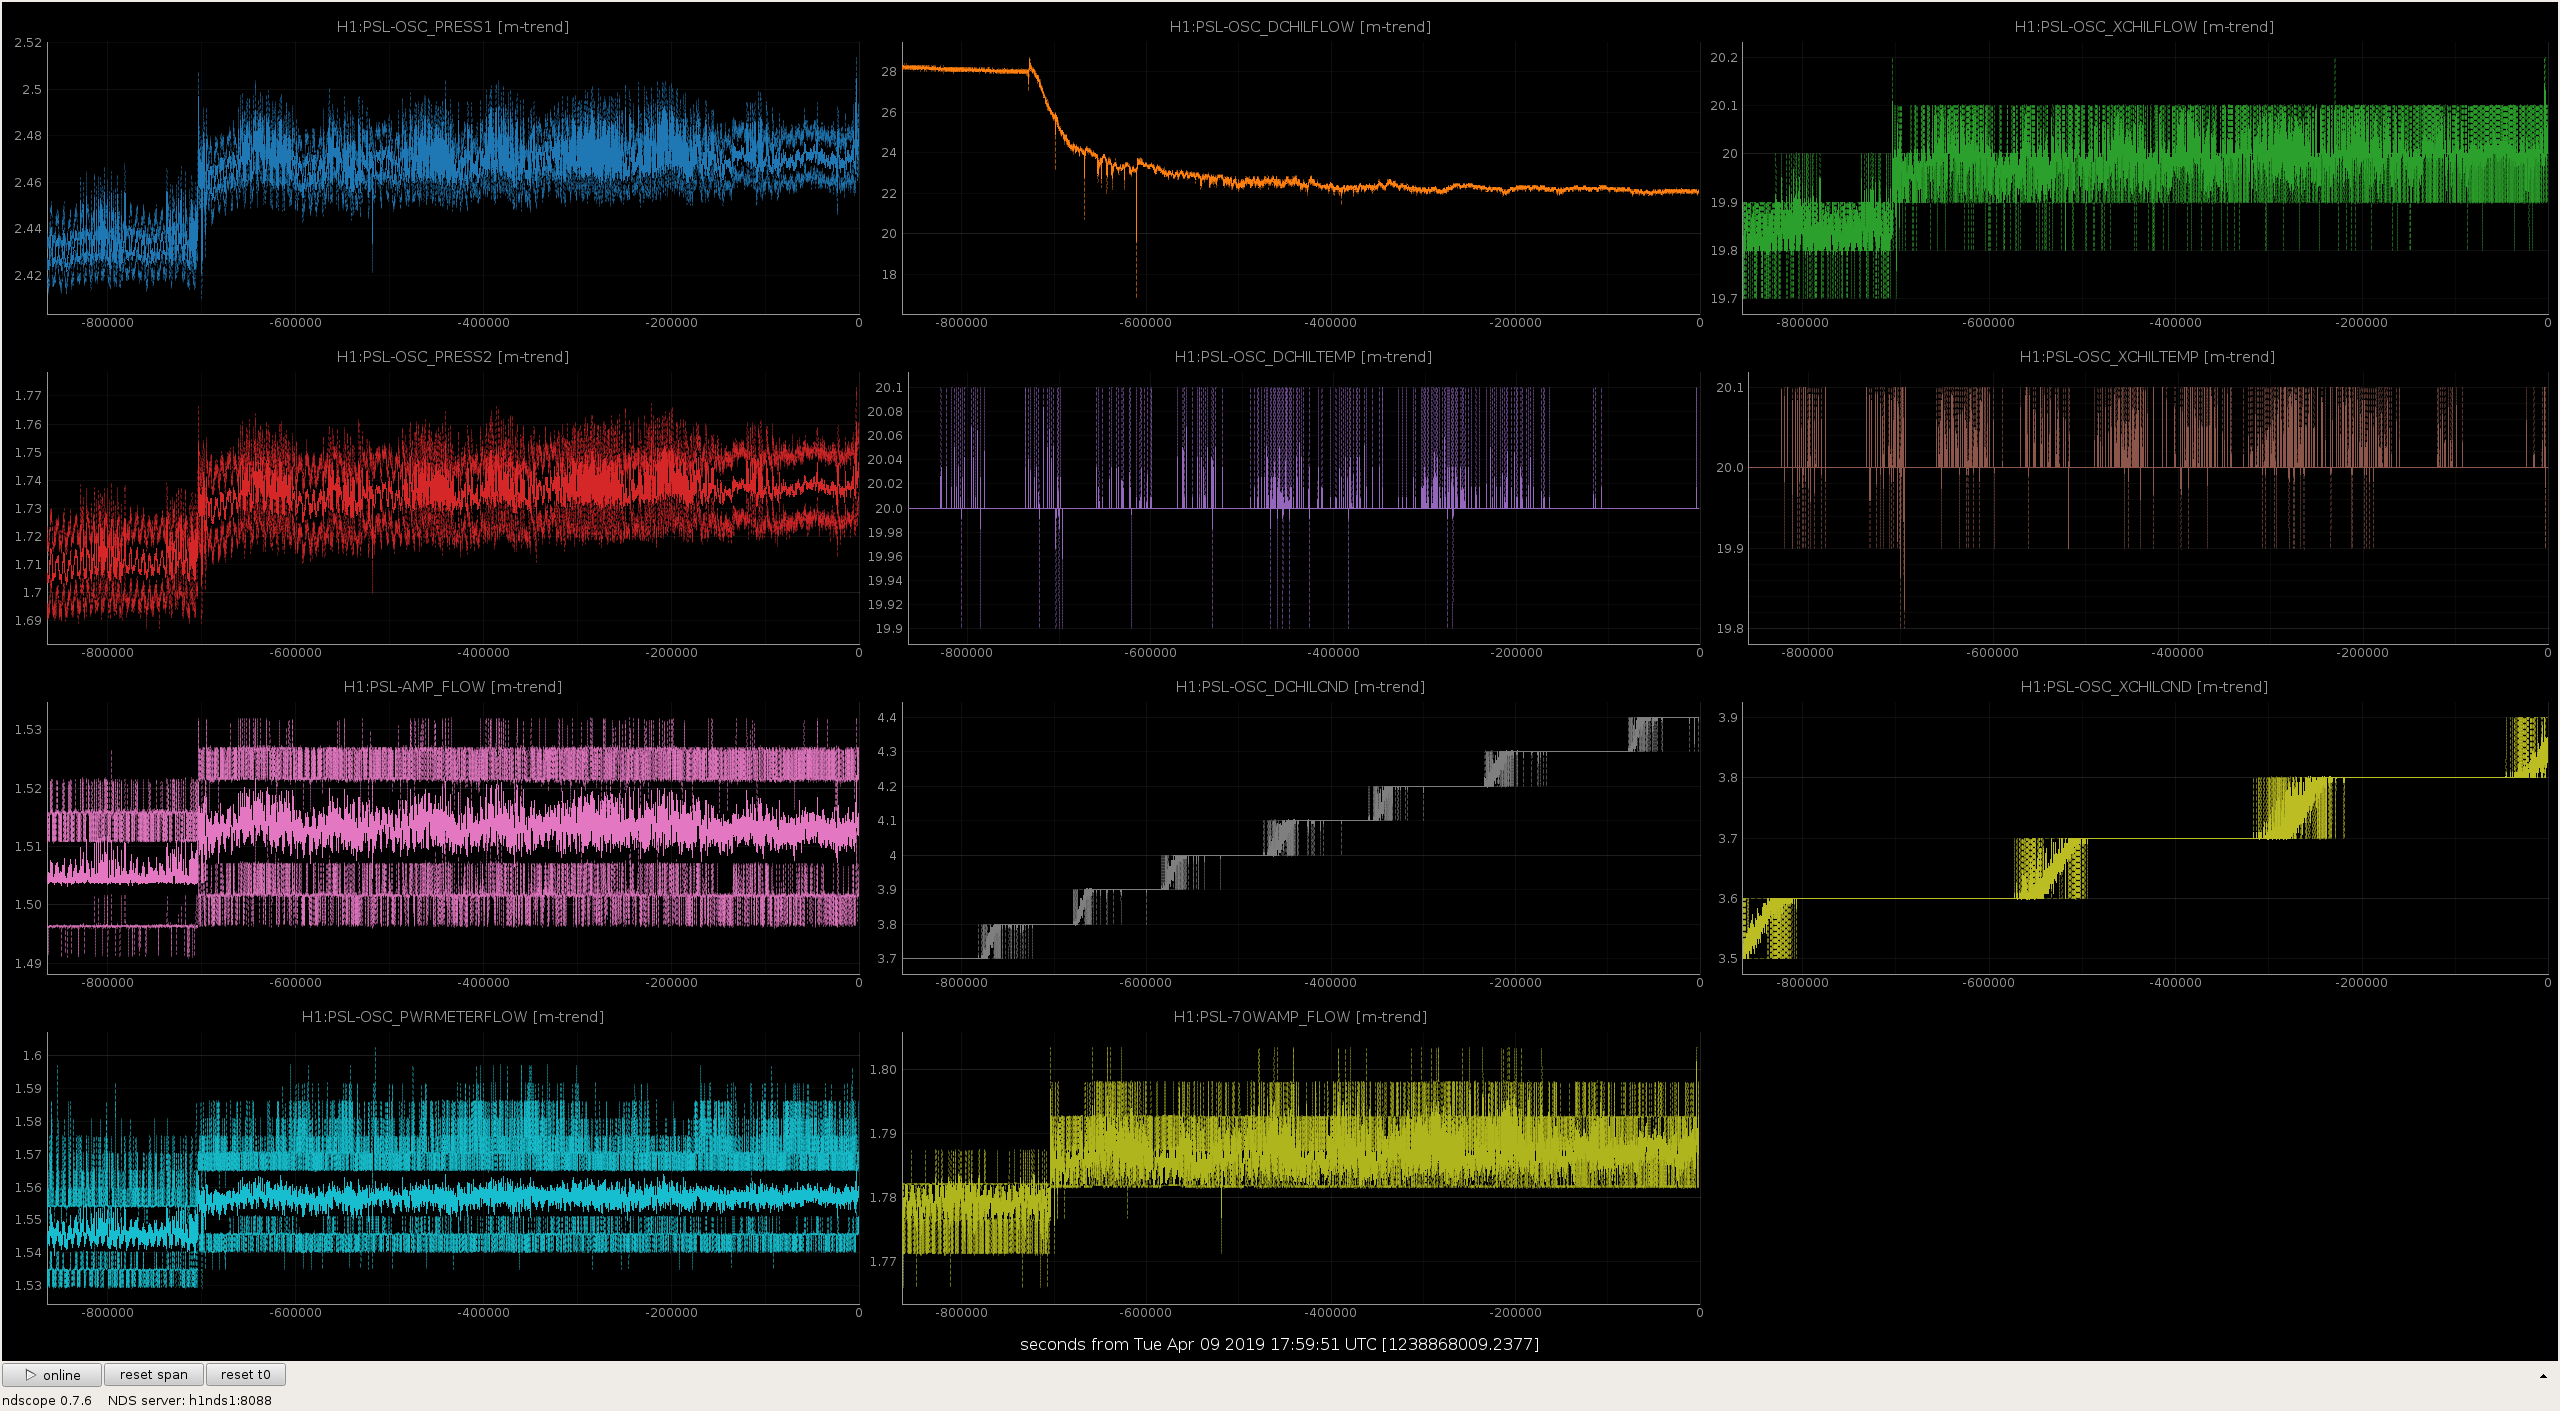
Danny and I completed the LVEA sweep. Things we noted:
TITLE: 04/09 Eve Shift: 23:00-07:00 UTC (16:00-00:00 PST), all times posted in UTC
STATE of H1: Wind
OUTGOING OPERATOR: Travis
CURRENT ENVIRONMENT:
Wind: 35mph Gusts, 28mph 5min avg
Primary useism: 0.26 μm/s
Secondary useism: 0.25 μm/s
QUICK SUMMARY: Wind is blowing and we have not been able to lock successfully since the end of maintenance. I have changed the ODC bit to Environment: Wind.
TITLE: 04/09 Day Shift: 15:00-23:00 UTC (08:00-16:00 PST), all times posted in UTC
STATE of H1: Lock Acquisition
INCOMING OPERATOR: TJ
SHIFT SUMMARY: It has been a fairly typical (unfortunately) maintenance day and recovery. Locking efforts after noon were stymied by IMC locking issues which have since been resolved, an EQ that arrived right around the same time as recovery was to begin, and SRC ALIGN issues that Sheila tracked down to a mysterious offset change in the POP signal used for triggering. Winds are in the 40 mph range which isn't helping. Have made it briefly to NLN, but lost lock before any SDF cleanup or LVEA sweeps could be completed.
LOG:
15:02 Daniel to LVEA for SQZ work
15:18 Chris to all end and mid stations for maintenance checks
15:24 Gerardo to both ends for property inventory
15:29 Ed to EY to center Oplevs, Chandra to LVEA measuring chilled water temp, Fil to CER AI chassis work
15:30 Dick to CER RF investigations
15:31 Betsy, Nichole, Christina, Elizabeth to LVEA for 3IFO inventory
15:34 Richard back from EY, Niko and Sharan to EY PCal work
15:34 Bubba to both ends hanging AEDs, Peter to optics lab
15:41 Jason adjusting PSL FE diode current
15:41 Richard to CER
15:49 Niko and Sharan back
16:05 Marc to SQZ bay for AOM swap
16:27 Jeff B both ends swapping in-chamber booties
16:29 Bubba back from ends, to LVEA
16:30 Ed back
16:31 Jason done
16:42 Ed to LVEA centering Oplevs
16:44 Chandra to MY
16:50 Cheryl to LVEA labeling 3IFO equipment
17:13 Hugh to LVEA
17:13 Richard to EY
17:22 Niko and Sharan to EY for PCal meas.
17:25 Chandra back
17:28 JeffB to LVEA
17:30 Ed out
17:31 EY to laser hazard, Richard back
17:39 Cheryl out
17:41 Cheryl to MY
18:13 JeffB done
18:16 Ed to EX
18:31 Marc out
18:40 Ed back
18:44 Georgia and Danny to CO2Y
18:45 Cheryl back
18:52 Patrick to MY
19:26 Patrick back
20:22 Dick and Marc out
20:28 Patrick to MY
20:48 Patrick back
21:39 Kyle to MY
21:53 Daniel and Nutsinee out
22:05 Kyle back
22:30 Betsy and Nichole to MY
Marc Nutsinee Daniel
All common mode boards in the squeezer rack (CLF S/N S1700344; OPO S/N S1700345; SHG S/N S1700346; LO S/N S1700348) as well as the 2 spares (S/N S1700347 & S/N S1700349) were modified according to E1900103 (high pass filtering of DAQ channels to avoid slew rate limitations in the AA chassis).
Installed the AM modulated AOM driver chassis D1900045 (S/N S1900202) and removed the temporary ifr RF synthesizer and Mini-Circuits RF amplifier.
Updated the model to add a dedicated integrator at the output of the green pump power stabilization. This prevents the filter output from increasing to very large numbers, when the actuator is out of range. The servo can now be turned on and off with a trigger from the OPO transmitted power.
When we tried to relock the squeezer, we had to fix several problems with broken equipment!? Cause unknown.
J. Kissel While digging through the details, I found that the CAL-CS was compensating and old value for the high frequency, ~3.2 kHz, pole in the ESD low-voltage low-noise driver that results from the PI summing node. What was in place: 3323.421 Hz -- comes from Evan updating the number for ETMX based on the mean of measured poles from 07 June 2016 of the ETMY driver (see LHO aLOG 44469 for when the filter was last updated, which cites the measurement in LHO aLOG 27619) What is no in place: 3226.75 Hz -- comes from the mean of the ETMX driver poles measured on 04 February 2019 shown in the "summing node" column of LHO aLOG 46773. This is a small change (0.3% / 0.5 deg at 1 kHz in the TST actuator), bit it was an inconsistent detail that I'd rather reconcile in a see of confusion about small numbers. We'll be updating the remaining calibration later this afternoon, so one should just consider this a part of that.
I was struggling to get past SRC_ALIGN during initial alignment after maintenance day. Sheila noticed that the offset of H1:LSC-POP_A_LF_OUT_DQ had changed for some reason during the course of maintenance day. She took an average of the offset value and updated it in the filter module. This will inevitably cause an SDF diff that will need to be accepted before going to Observe.
Don't forget that all the models on h1lsc0 had to be restarted this morning due to a timing glitch.
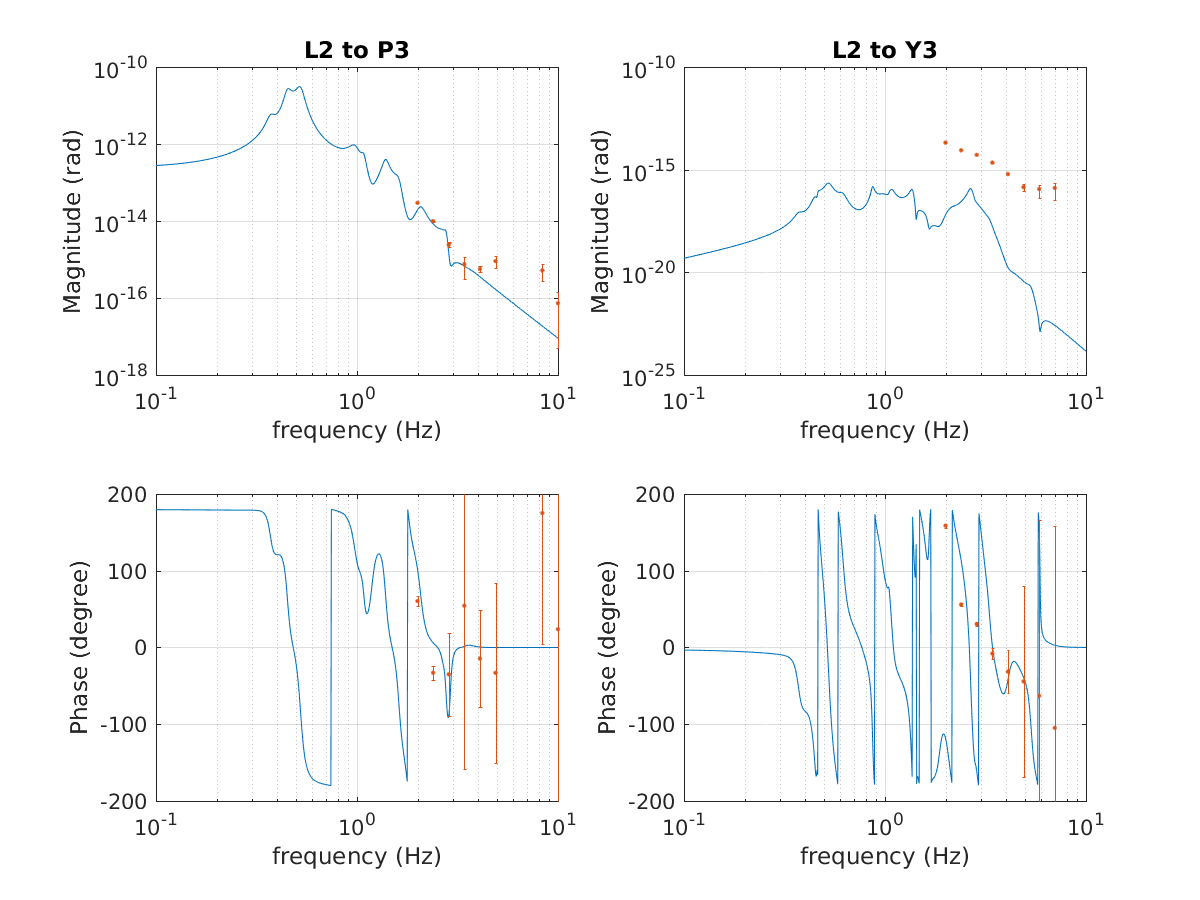
Sheila, Sundae During the maintenance, we did a measurement on coupling between the L2 Length (L2) to test mass pitch (P3) and yaw (Y3) between 2 Hz and 10 Hz. We excited the length at L2 and measured the L3 pitch and yaw change with swept sine response. The plot shows the measurement data compared with the model. The coupling from L2 to P3 agrees with the model as expected between 2 Hz and 4 Hz. Above 5 Hz, the coherence dropped below 0.1 indicates that we did not have enough driving on L2 to see the coupling. We did not have a good model for L2 to Y3 coupling yet, so we did not expected a good agreement for the L2 to Y3 coupling. Measurement with more points need to make in the future with higher driving above 5 Hz.
After the maintenance the IMC didn't lock.
No signal was observed in digital world (IMC-I, IMC-F etc.) so I went to the ISC rack, but the analog signals coming from the MC CM board were all healthy.
Fil checked CER, and it turns out that a wrong SCSI cable was plugged in when they worked on AA chassis in CER. Plugged the right one in and MC is back.
Squeezer Model Change
Daniel, Dave:
A new h1sqz model was installed (when all h1lsc0 models were restarted due to glitch). A DAQ restart was needed.
Adding h1edc DAQ status channels to h1edc
Dave:
To trend DAQ-CRC errors from h1edc which started this weekend, these channels were added to h1edc (H1EPICS_DAQ.ini file change). Number of channels increased by two from 40,086 to 40,088.
DAQ Data Concentrator system time fixed
Jonathan, Dave:
during the weekend's GPS week number rollover Jonathan noticed that the system time on h1dc0 was slow. As part of the DAQ restart we got the ntp-client running on h1dc0.
DAQ Restart
Dave:
New h1sqz channel list
New h1edc channel list
Fixed system time
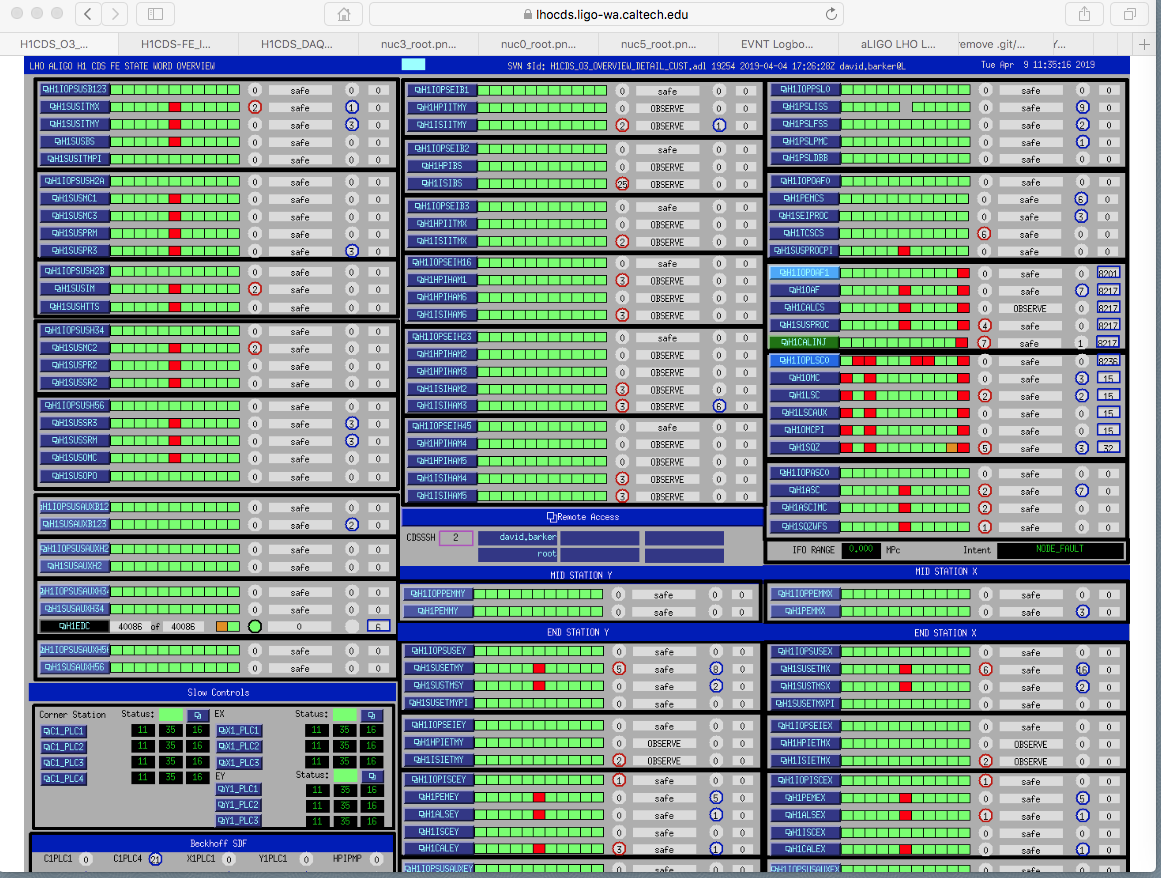
h1lsc0 glitch recovery
Dave:
at around 11:35 h1lsc0 mysteriously gliched, taking its models down and DAQ data from h1oaf1 models. See associated alog for more details.
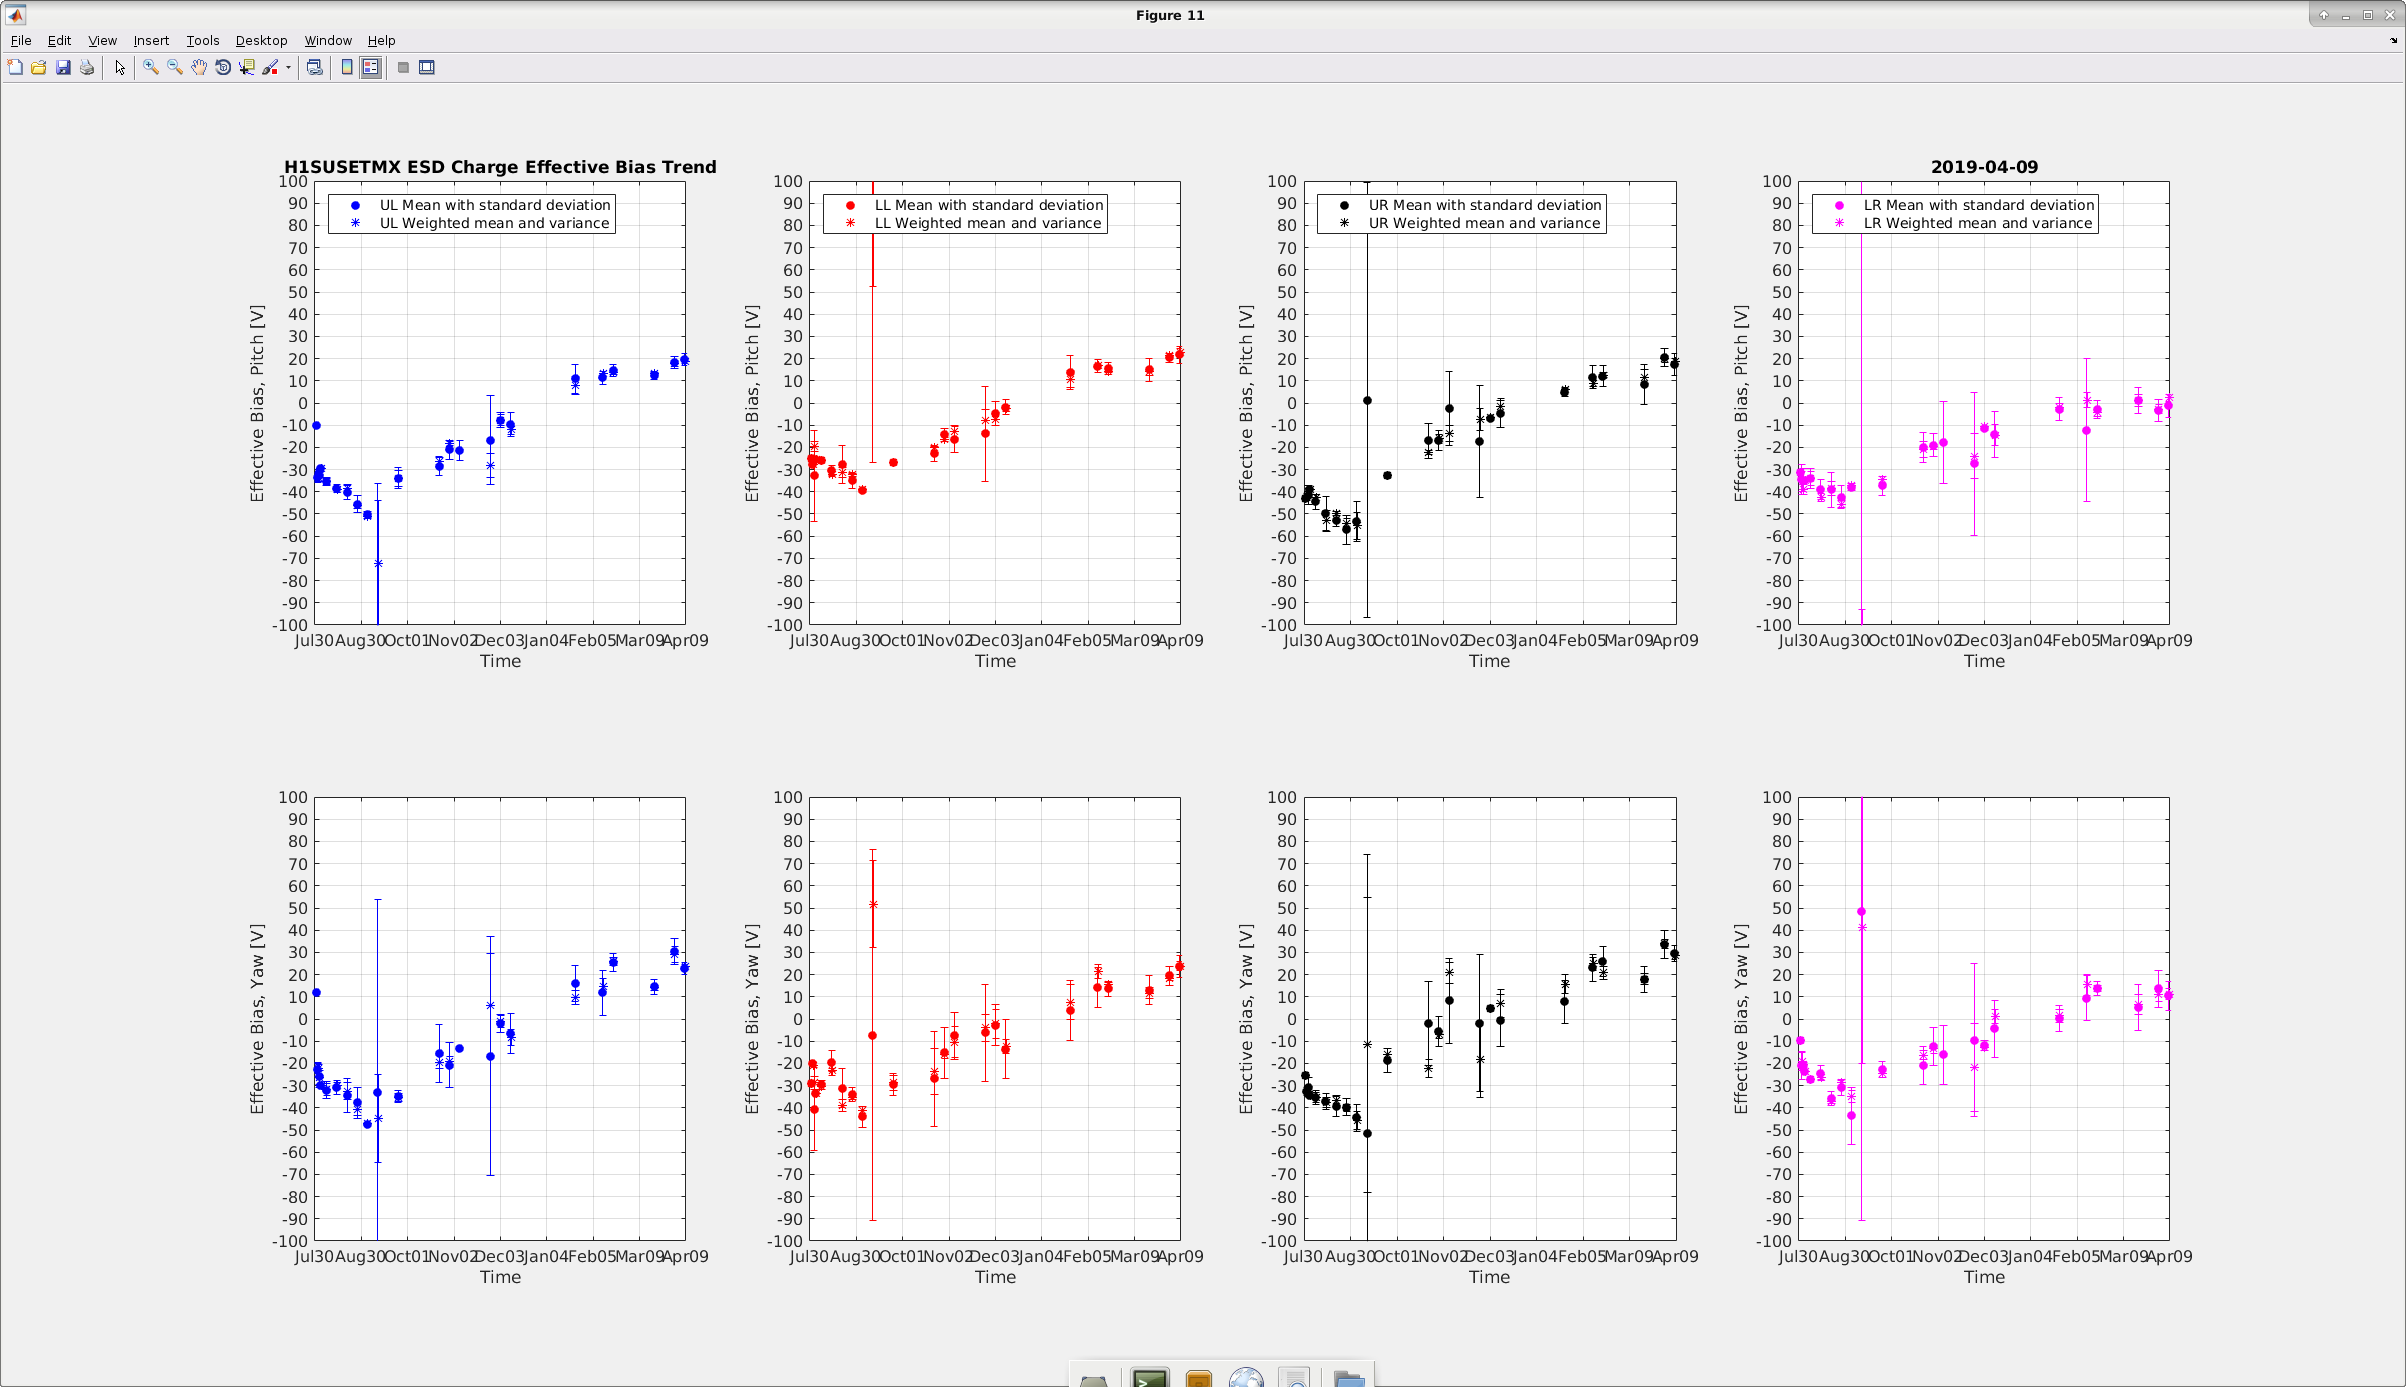
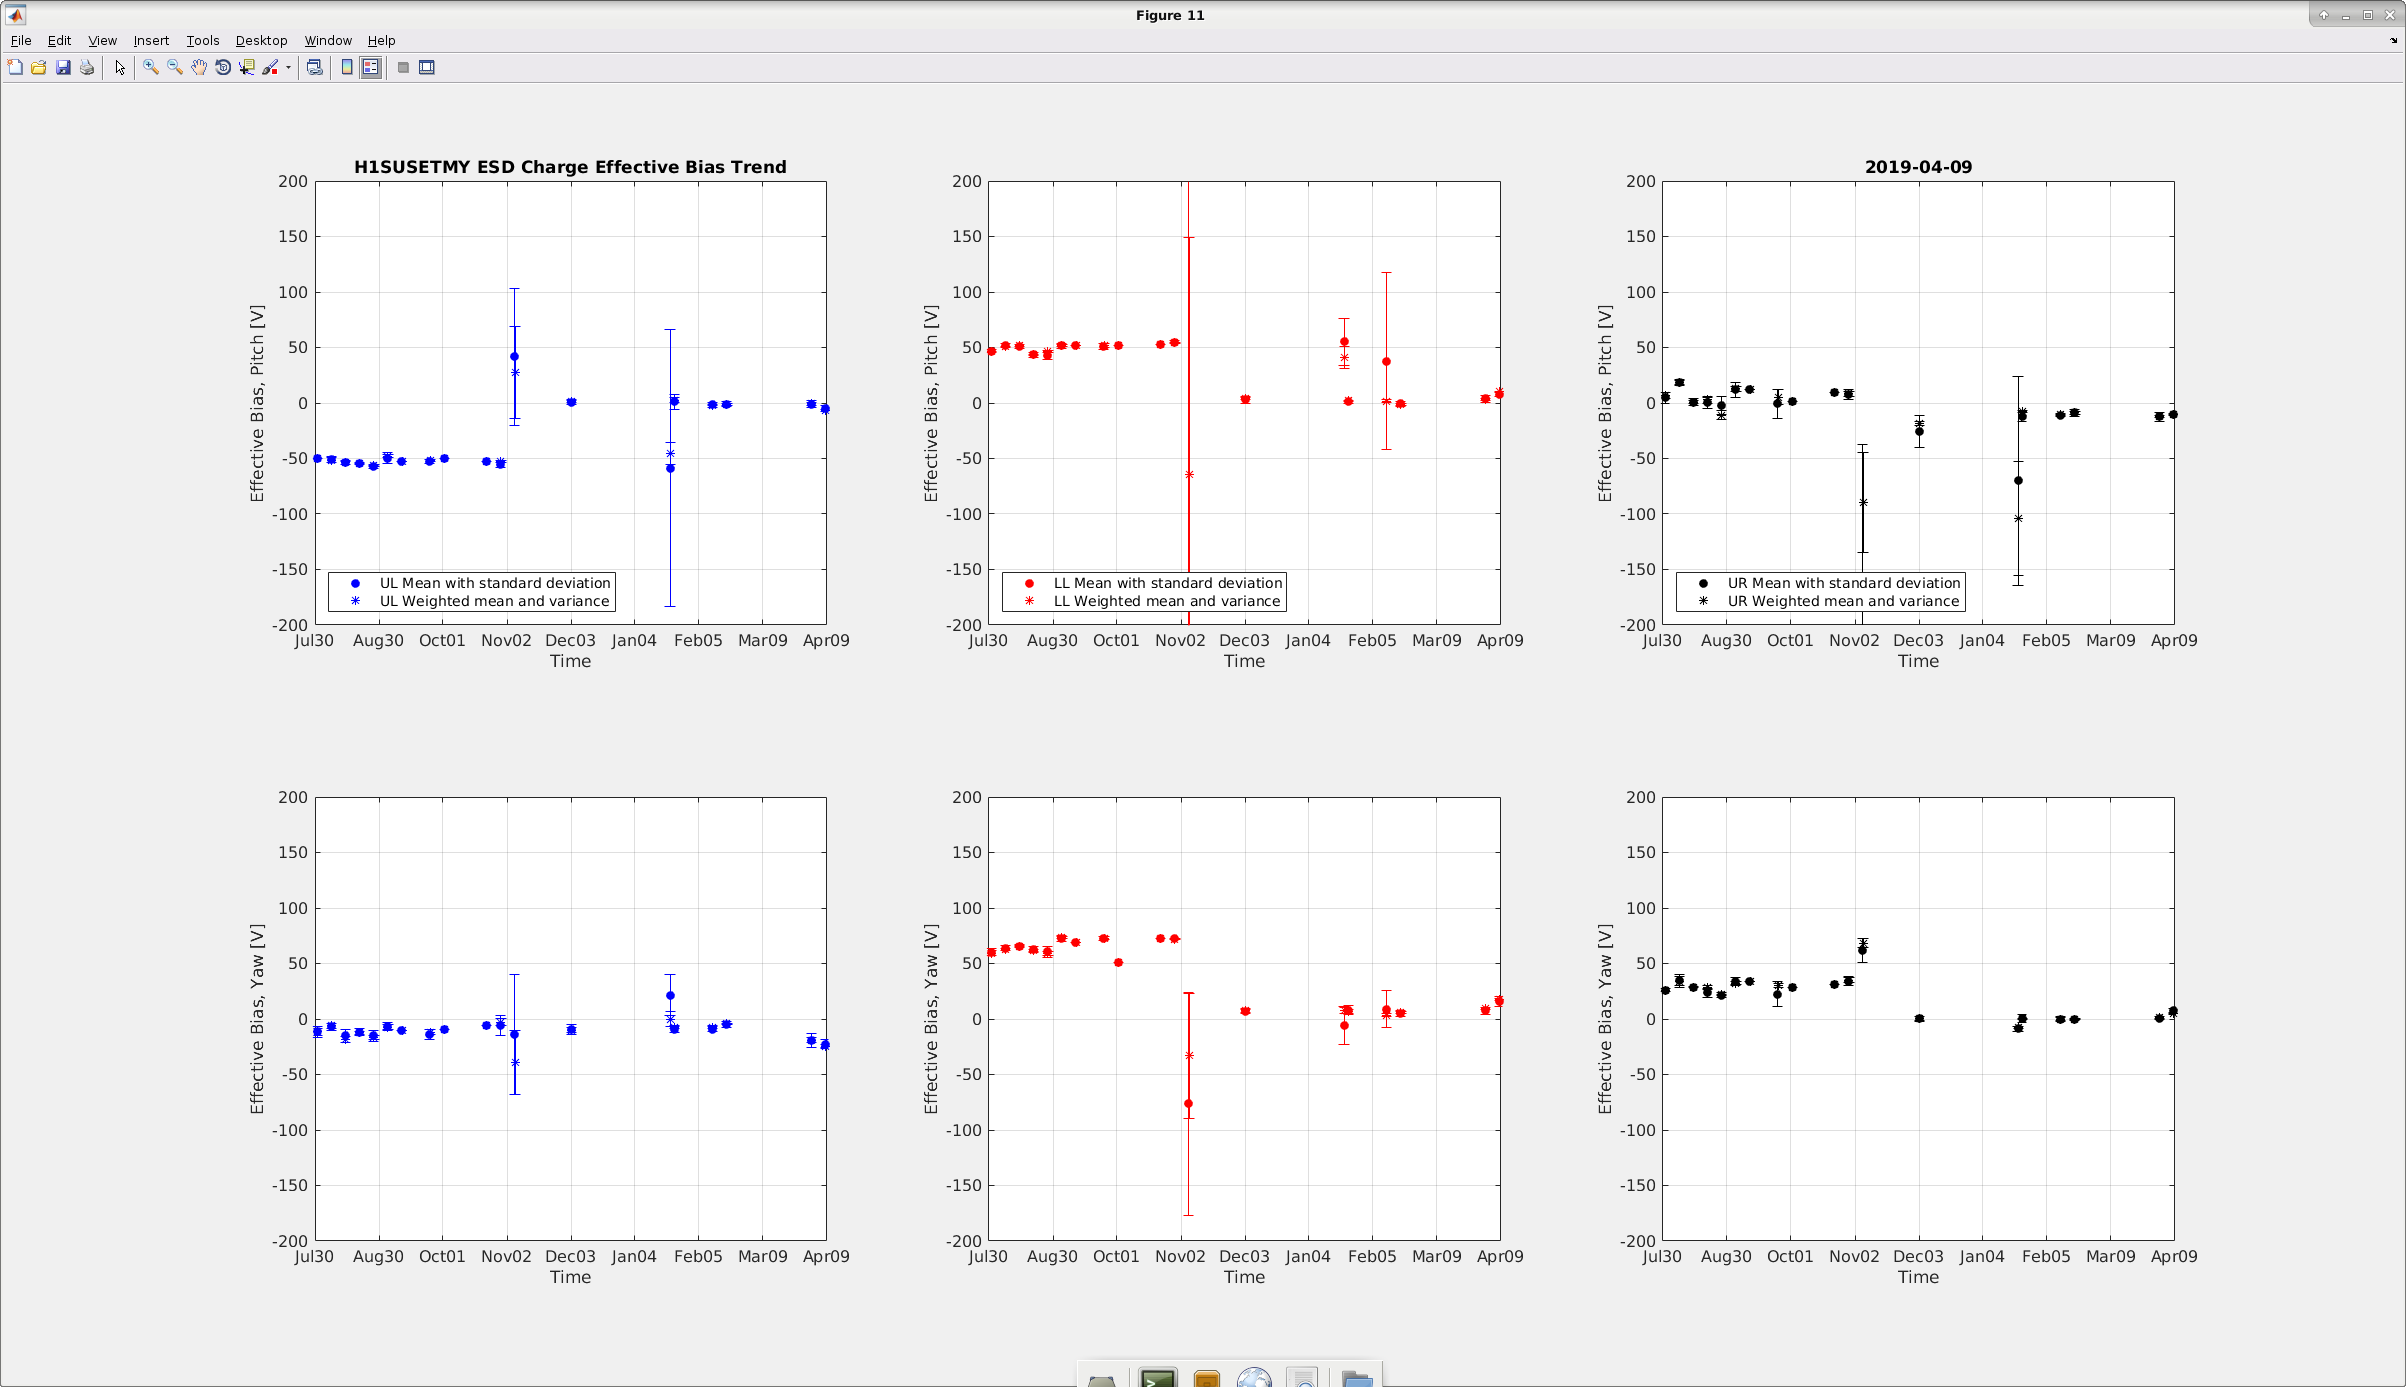
Charge measurements for the ETMX and ETMY were performed today during the scheduled maintenance and the plots are attached below. The effective bias for the ETMX looks to be within +-20V. During last week's measurement the Yaw for the 1st and 3rd quadrant was a bit high (around 30V), however now they are trending towards 20V (although for the 3rd quadrant it is still hovering around 30V (down from 35V last week). For the ETMY, the effective bias for the three quadrants is within the permissible limits and trending towards zero.
All the slider values were restored after the measurements were finished and the osc amplitude for the L3 calibration line was set back to 0.55 for ETMX (was already at zero for ETMY, hence I did not make any changes over here).
SDF showed a difference (OFF) in the bias voltage (SUS_CUST_QUAD_L3_Lock.adl) for the ETMX, I have switched it back ON.
All plots are in nominally good shape.
Sitewide centering has been done on al OpLevs except the BS
h1lsc0 has just glitched, cause unknown. I'm starting the recover process. We will get the new h1sqz model and a DAQ restart will be needed.
On h1lsc0 its IO-Chassis looked good. I restarted all the models (startWorld) and all came back OK, including the bad DAQ status of the h1oaf1 models. At this point the only RED on the overview was h1sqz (new DAQ config following code change) and h1calinj (missing psinject hardware injection).
These were cleared by : DAQ restart and ps_inject restart on h1hwinj1.
WP 8158
AA chassis S/N S1102788
Channels 13-16 were modified with faster OpAmps for U2 and U3. New opAmp installed ADA4075-2ARZ. Same mods as were done with the CM SQZ readback channels, alog 47459.
Verified the following capacitors for the Twin T notch were all removed as mentioned in alog 28010 (CH15 & 16): C1, C3, C4, C5, C6, C7, C9, C10, and C11.
F. Clara, J. Kissel, D. Sigg
While the team had the OMC DCPD's AA chassis out in the shop, I gathered transfer functions each channel,
(a) to confirm their functionality after the ECR change (E1900105)
(b) to understand the DC gain of the chassis better, given the recent confusion about AA chassis gains (see LHO aLOG 48272 and IIET Ticket 12642)
It turns out, in the heat of battle, I measured the wrong channels for the low-frequency (i.e. gravitational wave channel) versions of the OMC DCPDs -- CH13 and 14, I measured 4 channels over, CH09 and 10.
But I still learned a lot.
Here're my conclusions:
(1) The low-frequency channels I measured (CH09 and CH10 of the AA chassis) behave as expected, with a DC gain of 1.0 +/- 0.04%, and a butterworth lowpass with a notch at *roughly* 65 kHz (measured minimum magnitude's frequency within 2% of 2^16 Hz), and suppression *at* 2^16 Hz for both channels is -90 dB = 3e-5 V/V.
(2) The PI channels for the OMC DCPD (CH15 and 16 of the AA chassis) have had all anti-aliasing removed, and the through-signal has no modification of signal from DC to 10 kHz, and above 10 kHz, at MOST a 0.25% / 1 deg change up to 100 kHz.
(3) As far as measuring the low-frequency "DC" gain of the AA channels, electrical grounding of measurement equipment is very important. If one does *not* properly reference all equipment to a common ground, i.e. leaves the ground floating, then the data will errantly suggest that the DC gain of the AA chassis is 0.99, the frequency of the notch will shift, and the depth of the notch will also shift.
Check out the first attachment 2019-04-09_H1OMC_AAChassisTFs.pdf.
The first two pages shows the "final answer" for CHs 09, 10, 15, and 16 for the OMC AA chassis, as reported with correctly grounded test equipment.
The legend label "CHSGND" stands for "properly referencing the measurement equipment to the AA CHaSsis GrouND." "FLTGND" stands for "the ground of the measurement equipment is FLoaTing with respect to the chassis GrouND."
The third page shows what happens what you measure the coil driver test box (D1000931) with proper grounding (as was done in today's measurement) vs. the ground floating (i.e. as shown in all of the diagrams in -v1 of D1900027-v1). One can clearly a reported gain of 1.983 V_{se}/V_{diff} when the ground properly referenced, and a reported gain of 2.002 V_{se}/V_{diff} when floating.
The fourth page shows what happens when you measure the anti-aliasing channels with proper grounding (as was done in today's measurement) vs. with the ground floating. Here, one can clearly see that with the floating ground, the AA notch has far less Q and the notch frequency is much more variable.
Unfortunately with today's measurement, we had the rare treat of being able to pull the chassis out of the rack, pull off the lid, and directly access test points and grounding pins the filter board (D070081). Rarely do we get this luxury, as we're often stuck in the rack, at an end station, having to use the clumsy SCSI breakout board.
The second attachment (AAChassisSetup_20190409.pdf) shows the proposed method of performing this clumsy technique while paying much better attention to referencing a common electrical ground.
The third attachment (2019-04-09_AAChassis_Meas_Pics.pdf) shows some pictures of what it was like today, comparing properly grounded configurations and floating configurations that correspond to
I believe the lack of attention to (3) is what has lead LHO to measure a low-frequency gain of 0.99 back in ER7/ER8 (i.e. in 2015), and we've been using the model from that data set for both AA and AI filters for *anything* that has one since then. That model is
^/trunk/Runs/ER8/H1/Scripts/AAAI/20150813_H1ER7_AA_upto10kHzFitLTI.mat
which we used for O1 and O2, and has now been unceremoniously dumped into a new .mat file in a python compatible format, but in doing so lost its origin story,
^/trunk/Common/pyDARM/H1aa.mat
which is now used for O3.
I've followed the rabbit hole of that model, which lead me to the last time we systematically measured the PCAL AA chassis, in May 2015 (see LHO aLOG 18658), during Pre ER7 times, which was processed by the script
^/trunk/Runs/PreER7/H1/Measurements/ElectronicsMeasurements/process_H1PCALEX_AA_Measurements_20150527.m
which reveals a plot that I re-attach because I couldn't find the aLOG in which I said I'd write about it.
Check out the fourth attachment, 2015-05-26_H1PCALEY_AAChassis_S1203519.pdf.
It has a DC gain of 1.0 +/- 0.02%, which is *not* the case for the model we've been using for the AA chassis since ER7.
That model, came from Kiwamu's processing script,
^/trunk/Runs/ER8/H1/Scripts/AAAI/gen_H1ER7_AA_upto10kHzFitLTI.m
which took data from
^/trunk/Runs/PreER7/H1/Measurements/ElectronicsMeasurements
which just like above, uses the Coil Driver Test Box to create a differential signal, whose transfer function,
^/trunk/Runs/PreER7/H1/Measurements/ElectronicsMeasurements/TESTBOX_CH1In_Pins1-6Out_2015-05-19_092805.txt
you can clearly see has a gain of 2.002 V_{se}/V_{diff} instead of the properly grounded 1.983 V_{se}/V_{diff}.
No bueno!!
Well -- hopefully now this lesson has been learned -- we'll update our calibration group documentation in such a way that hopefully this mistake will never happen again. AND we'll save a new python-friendly model, likely based on the data that Joe / LLO originally put together in
^/trunk/Common/Documents/T1500165/
or we'll go around and measure every AA and AI chassis properly.
The message: AA and AI filters have a DC gain of 1.0 +/- 0.0(something)%, so we should stop treating them as otherwise.
Wrapping up loose ends from O3, I've plotted the 2019-04-09 measurements for channel 09 and 10 (i.e. OMC DCPD A and B) against the model of the AA chassis that we used throughout O3 in the calibration models. While one might immediately get alarmed by the 1.01 gain discrepancy with the measurement and the H1aa.mat model -- this is again a relic of the poorly grounded measurement that Kiwamu took as described above. The calibration group has danced around this H1 model issue by dividing out the DC gain of the model every time it appears in calculation of the sensing function or the corrections to the PCAL channels, as discussed in originally in IIET Ticket 12642, which has now been closed and transferred to the pyDARM 2.0 git repo's Issue 11. This is why I show the L1aa.mat model too -- which was created with the correct gain -- but is otherwise identical in frequency response. The conclusion remains the same: using the either model, as long as the DC gain normalized out, provides a good model of H1's measured response for either channel with negligible systematic error (growing with frequency only to 1.0005% / 0.1 deg by 1 kHz and only 1.004% / 0.6 deg at 5 kHz). In fact, because the systematic error for each channel coincidentally are in opposite directions, when averaged as is done in the control system (balanced with gains as mentioned in LHO aLOG 47217 and then further tweaked with the preceding filter modules as described in 47257), the frequency dependence of the two channels probably "cancels" to even smaller systematic error (tracing out all the digital gains, doing the math, and making some further plots is probably in order, but not worth it at this time.) Since the world has moved to python, the script to produce these plots is in the same folder as the previous study, but y'know, in python: /ligo/svncommon/CalSVN/aligocalibration/trunk/Common/Electronics/H1/Scripts/ plot_omcaachassis_20190409meas_vs_O3Bmodel_20200624.py (and, of course, uses the same properly grounded AA chassis data, divided by the properly grounded test box data.) The models live in /ligo/svncommon/CalSVN/aligocalibration/trunk/Common/pyDARM/ H1aa.mat L1aa.mat EDIT: As a bonus, I also plotted the H1 EY PCAL RXPD AA chassis channel as well (just modifying the python script called out above, which now isn't so accurately named, but so be it). I only divided it against the L1 model, since we now know the H1 model is just different by a gain. The H1 EY PCAL RXPD AA chassis channel is similarly, negligibly different from the L1 model. Note -- have this also be negligible is important for sensing function measurements, for which we divide DARM_IN1 by PCAL, and in doing so, we sneakily assume (because we assume AA chassis channels are the same) that the AA's cancel, and we don't have to account for this frequency dependence.
Made sure the grounded state of EY is the same as EX. A couple of supplies had been lifted during testing but all are identical to EX now with the ESD isolated from everything else.
Also looked at ways to isolate the racks from the cable tray so we can better define our ground points.
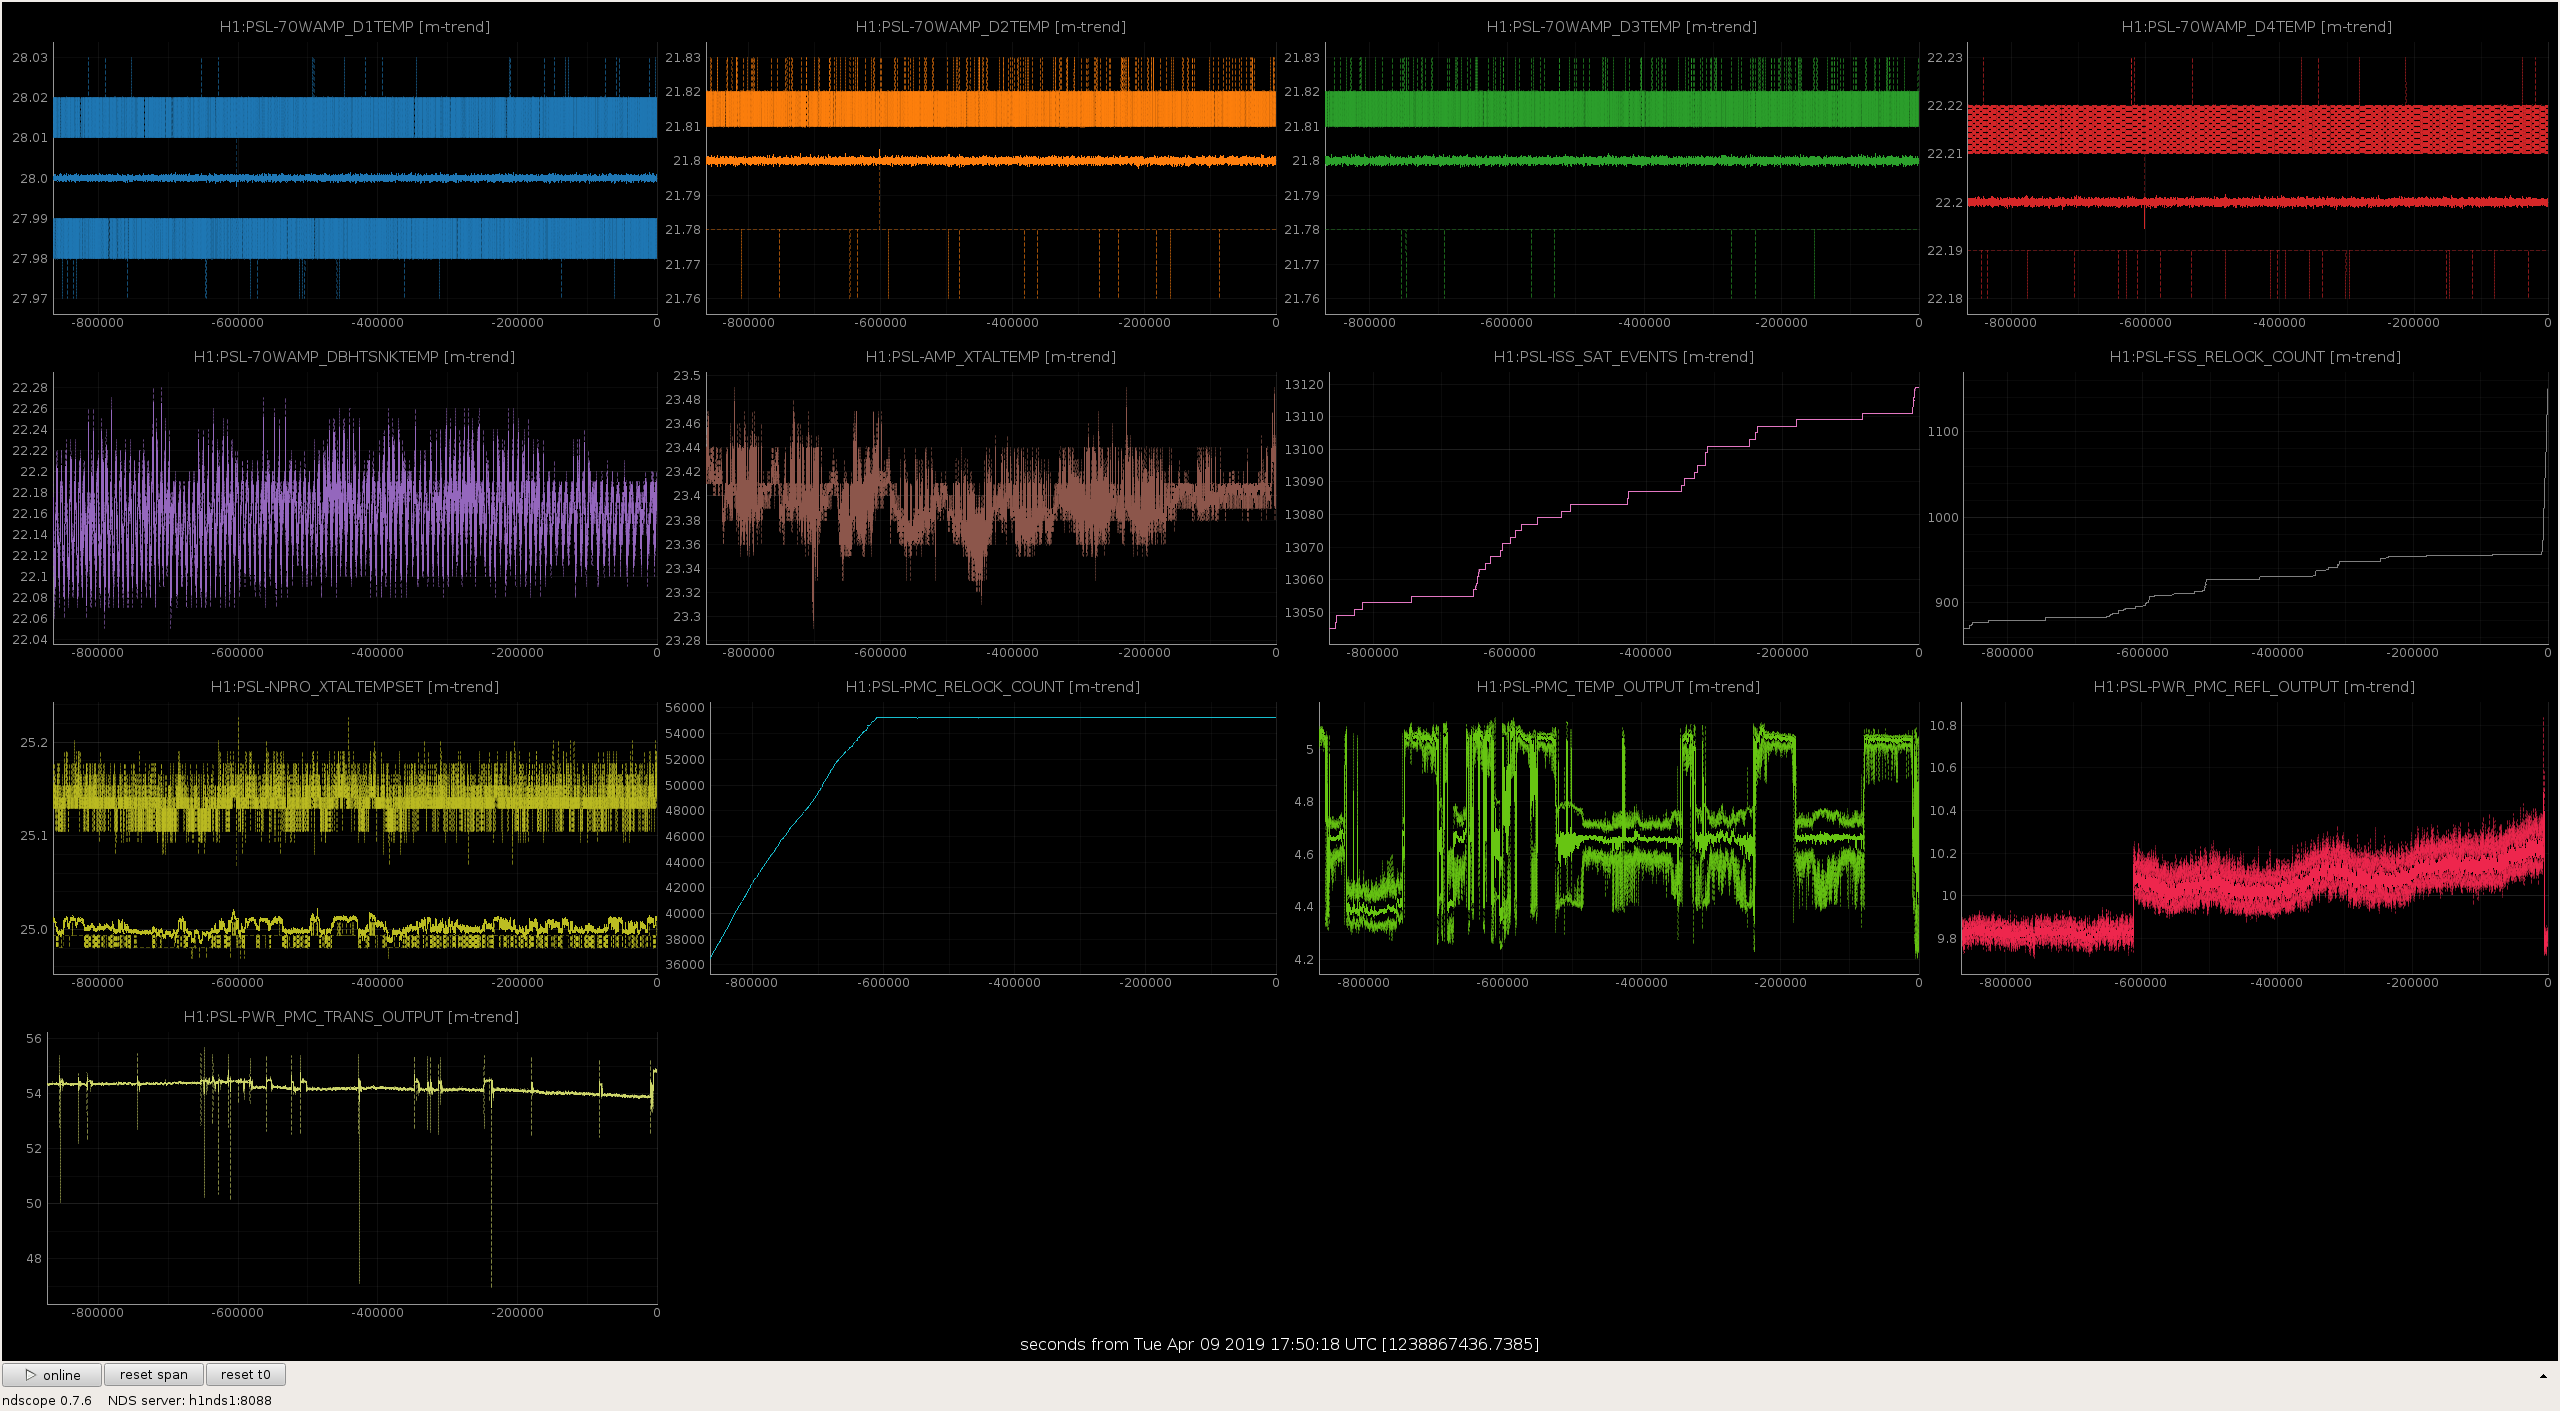
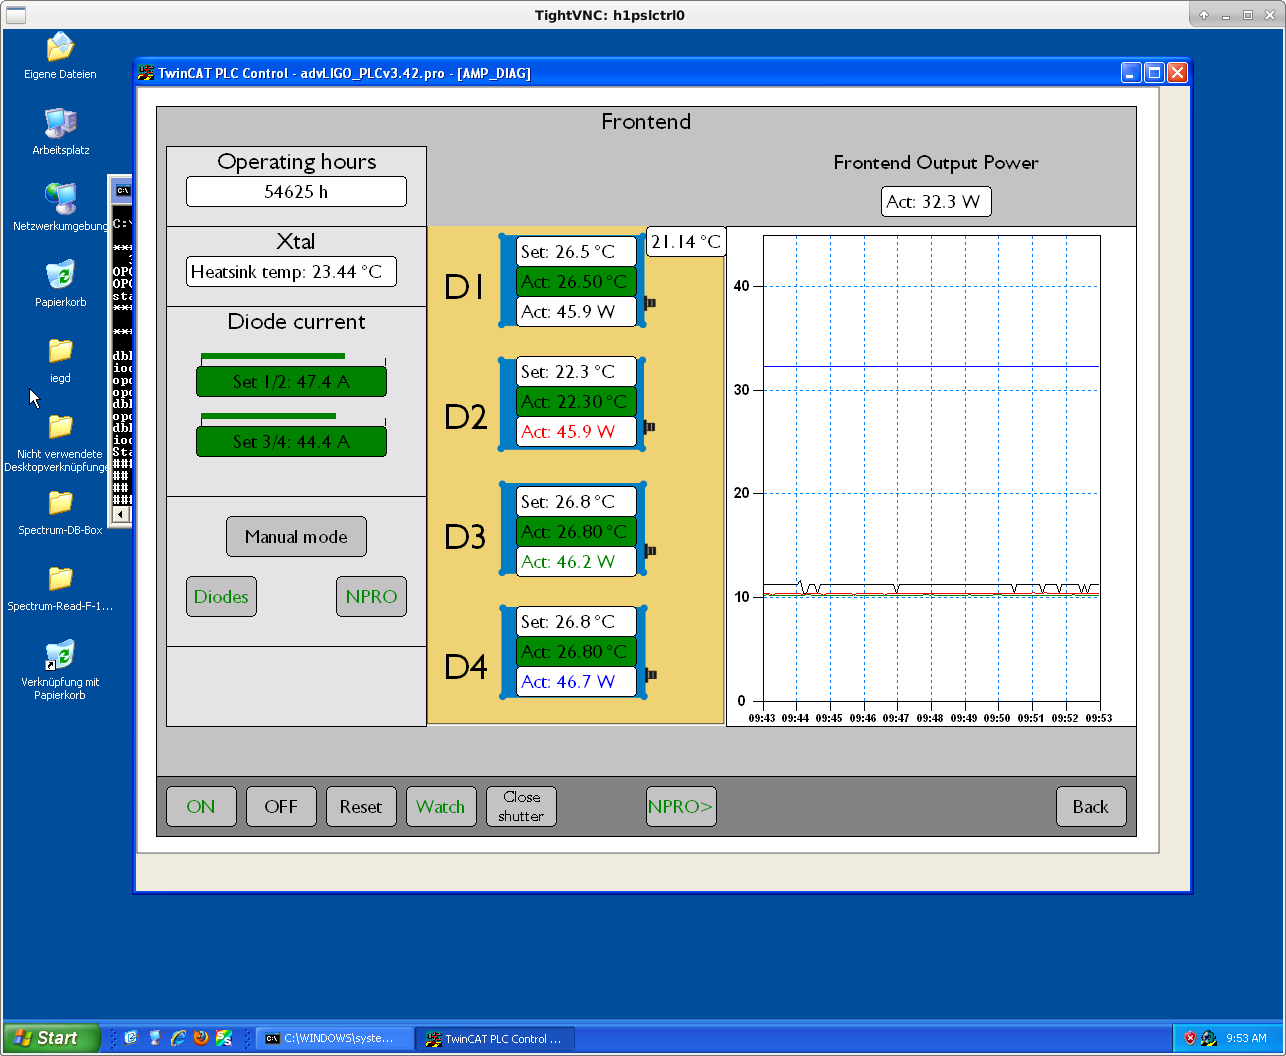
35W FE Pump Diode Operating Current Increase (WP 8154)
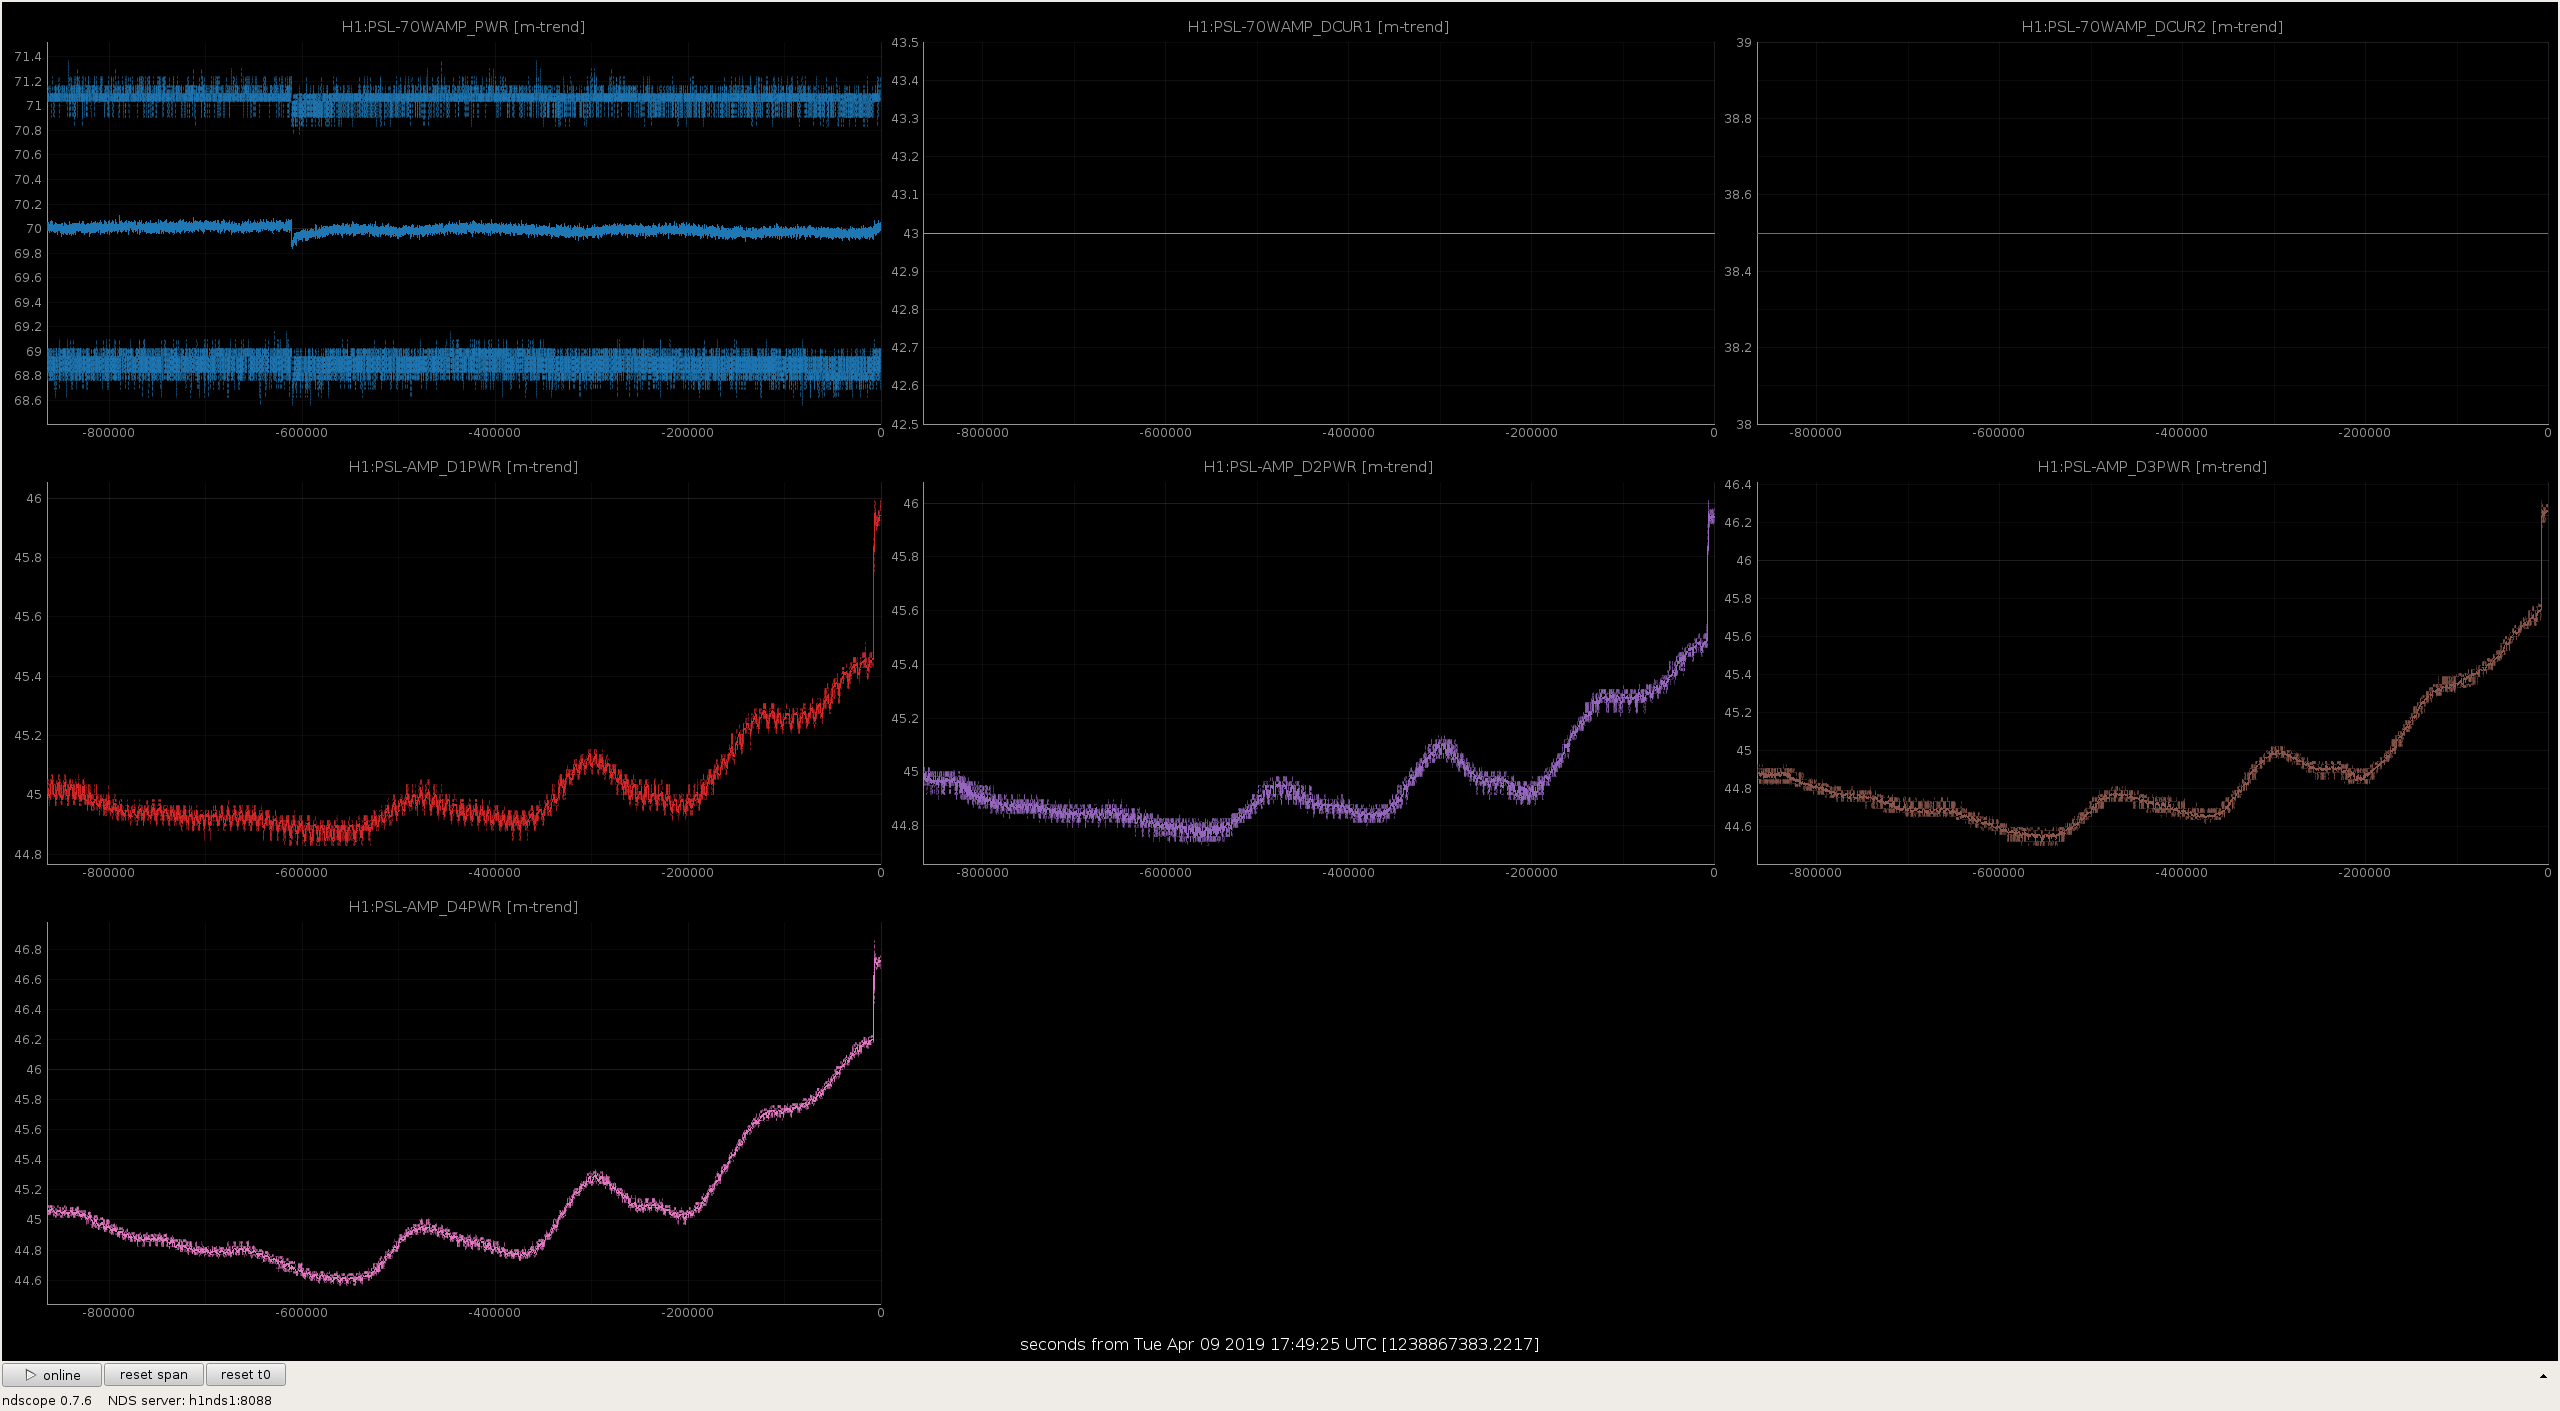
This morning I increased the operating currents of the pump diodes for the 35W FE; since this is the 1st adjustment in many months, I also tweaked the pump diode operating temperatures. All adjustments were performed with the ISS OFF. The changes are outlined in the table below:
| Operating Currents (A) | Operating Temperatures (°C) | |||
| Old | New | Old | New | |
| D1 | 47.0 | 47.4 | 26.5 | 26.5 |
| D2 | 47.0 | 47.4 | 22.3 | 22.3 |
| D3 | 44.0 | 44.4 | 26.8 | 26.8 |
| D4 | 44.0 | 44.4 | 26.7 | 26.8 |
The FE is now outputting 32.3W and the ISS is back ON; a screenshot of the PSL Beckhoff FE screen is attached for future reference. This completes LHO WP 8154.
Edit: Forgot to mention that when turning the ISS back ON, I had to adjust the reference signal to account for the increased power out of the PSL. The old value was -2.06V, the new value is -2.08V, and the diffraction percentage is ~2.2%. This change was accepted in SDF.
Weekly Power Watchdog Reset (FAMIS 10705)
The PSL power watchdogs were reset at 16:30 UTC (9:30 PDT). This completes FAMIS 10705.
One Other Item
While doing the above, I noticed that the FSS RefCav TPD had fallen from Ed and I's adjustment from last week; it had fallen from ~4.2V to ~2.9V. Seeing this, I gave the beam alignment a quick tweak. The RefCav TPD is now reading ~3.7V. We will continue to monitor this.
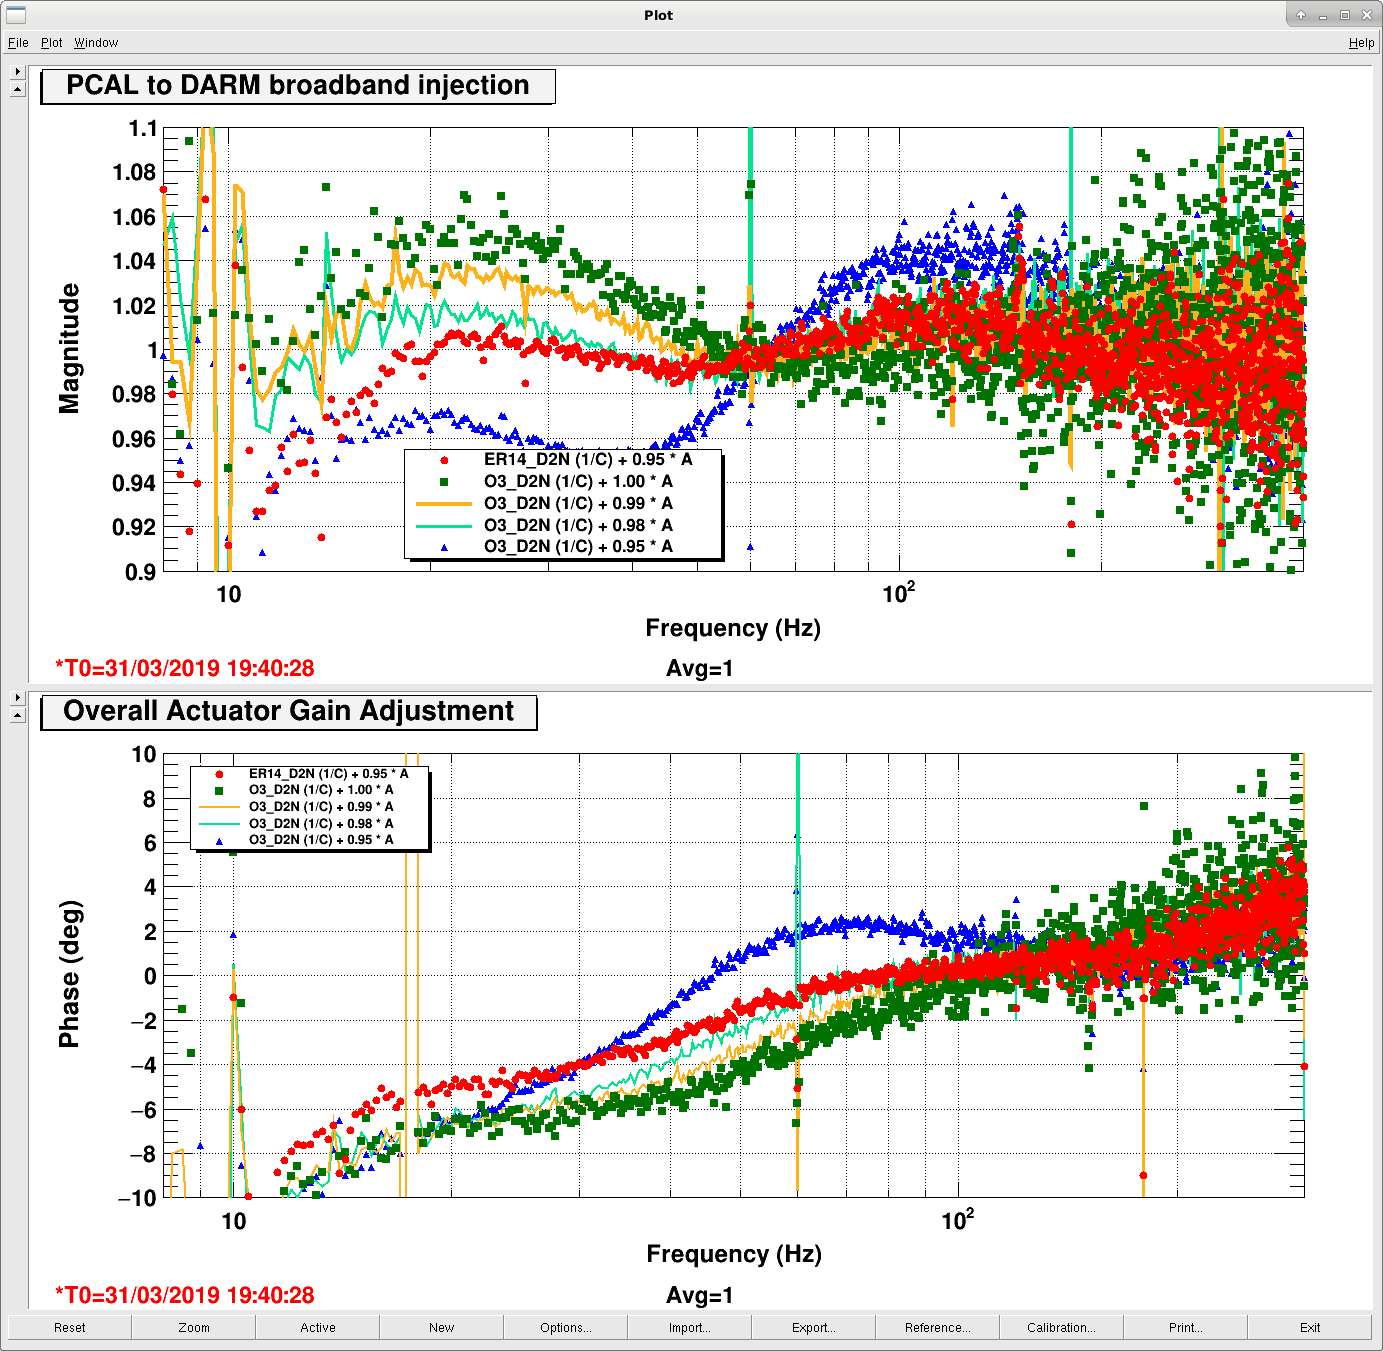
There are several things that the CALCS calibration doesn't correctly calibrate, which are corrected later in the GDS calibration. As Jeff and Lili wrote in a dcc document yesterday, T1900169, if the real sensing function C = dC*C' where C' is the sensing function implemented in CALCS, and A=dA*A', then the correction that needs to be applied to the front end calibration R/R' = 1/delC*(1+CAD)/(1+CAD/(delA delC)) What is currently implemented (for example in the calibration of dtt templates) is just 1/delC, which is fairly different from the R/R' correction. The first attached pdf shows the difference between 1/delC and the full response function correction for the pyDARM model from April 2nd.
On March 31st, 48102 CAL CS filters based on the sensing and actuation measurements were installed, and checked with a boardband pcal to DeltaL measurement. (green squares in this plot). We are now very unsure about the calibration applied in this DTT template, but last week it was used to adjust the calibration, all the acutator gains were scaled by 0.95 to make the result from this template seem closer to 1 (red dots in the plot).
Today we took the data from the time of the broad band injection with the correctly fit CALCS filters installed, exported it with no calibration applied by dtt, and removed the whitening and 2 1Hz poles for the pcal response in meters, which results in the orage dots in the second pdf (delta L/pcal meters without correcting R). This reproduces the result from the dtt template fairly well, with an apparent 4% systematic error from 20-30 Hz, where the dtt template shows 5%. Applying the R/R' correction to this measurement, the apparent systematic error is reduced.
The script used to produce this plot is in the CALSVN /O3/H1/Scripts/CALCS_FE/process_broadband_pcal_20190331.py I have used the outputs of pyDARM for the corrections to the sensing function and the actuation function, but the calibration group has been checking these functions throughly, and Jeff is writing an alog right now about what they have found. Once we are confident about the corrections produced by pyDARM we can rerun this script.
For now it seems like we can take the 0.95 scale factor out of CALCS.
I've added an updated plot including the results of correcting 1/deltaC only.
There are two minor updates, which do not impact the overall results:
1) R/R' should be 1/delC * (1 + CAD delA delC) / (1+CAD) rather than 1/delC*(1+CAD)/(1+CAD/(delA delC)) [see T1900169]
2) Using the 20190328springfix model, the one installed in CAL-CS when taking the green BB measurements.
The actuation correction only curve explains why the green squares became blue triangles in this BB plot when tuning the actuation amplitudes. But the phase still does not match what we see in this BB plot.
Clarification: the last comment "R/R' should be 1/delC * (1 + CAD delA delC) / (1+CAD) rather than 1/delC*(1+CAD)/(1+CAD/(delA delC))" was wrong. I misunderstood the original parameters. Sheila's equation was the correct one. But the results are still the same.
We replaced the PZT driver with the spare (S/N S1700172) which fixed the offset problem for the SHG.
We checked the CLF drive at the output of the AI board and found the same problem: both legs of the differential signal are pegged at -13V. This eliminates the cable as a problem.
Attached transfer functions of LO, OPO, and SHG board. CLF excitation didn't work.