TITLE: 03/08 Day Shift: 16:00-00:00 UTC (08:00-16:00 PST), all times posted in UTC
STATE of H1: Commissioning
INCOMING OPERATOR: None
SHIFT SUMMARY:
Locking went well with the exception of a couple of HEPI pump trips that were physically induced. It was a good exercise and allowed for a small update to the SEI>HEPI wiki instructions for those who are more in the dark about SEI than others
LOG:
16:45 Jeff out to LVEA - shooting pics of ITMs
17:16 Jeff Back
17:24 Kyle out to EY - mechanical room
17:35 Nominal Low Noise - 113.206 Mpc
17:49 LockLoss - EY mechanical room activity tripped HEPI
18:02 Hartmann team (TJ and Daniel) out to LVEA to check SLED
18:06 Jim and Fil to EY to recover HEPI
18:35 Hartmann team back
18:50 Kyle back
18:54 EY HEPI pump recovered - waiting for isolation to resume locking
19:10 EY SEI WDs tripped again
20:03 re-locking resumed
20:49 Nominal Low Noise - 100Mpc
21:33 LockLoss - high bounce mode
22:25 Begin Initial Alignment
22:52 Resume locking
23:50 H1 locked at NLN - 113Mpc
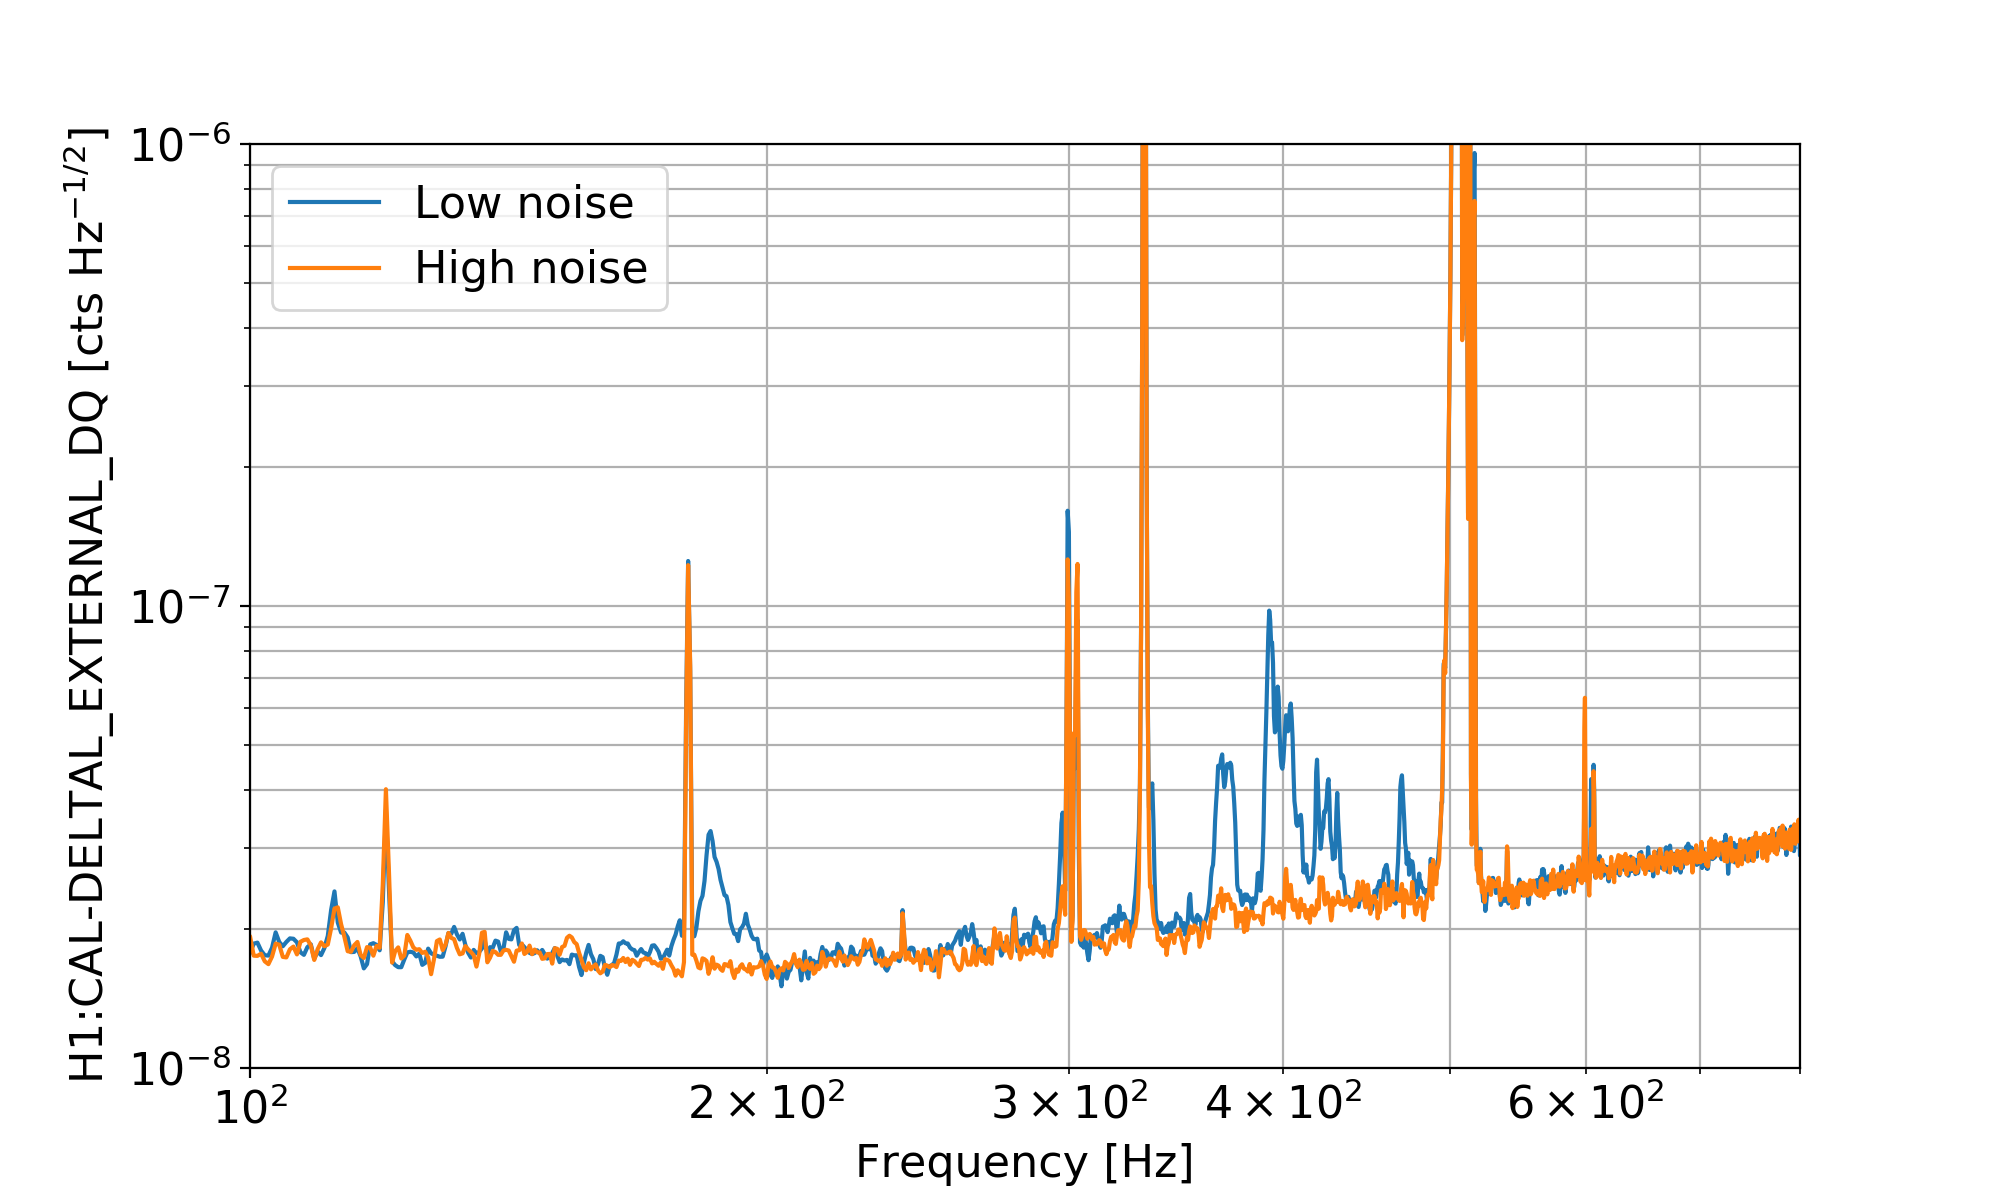
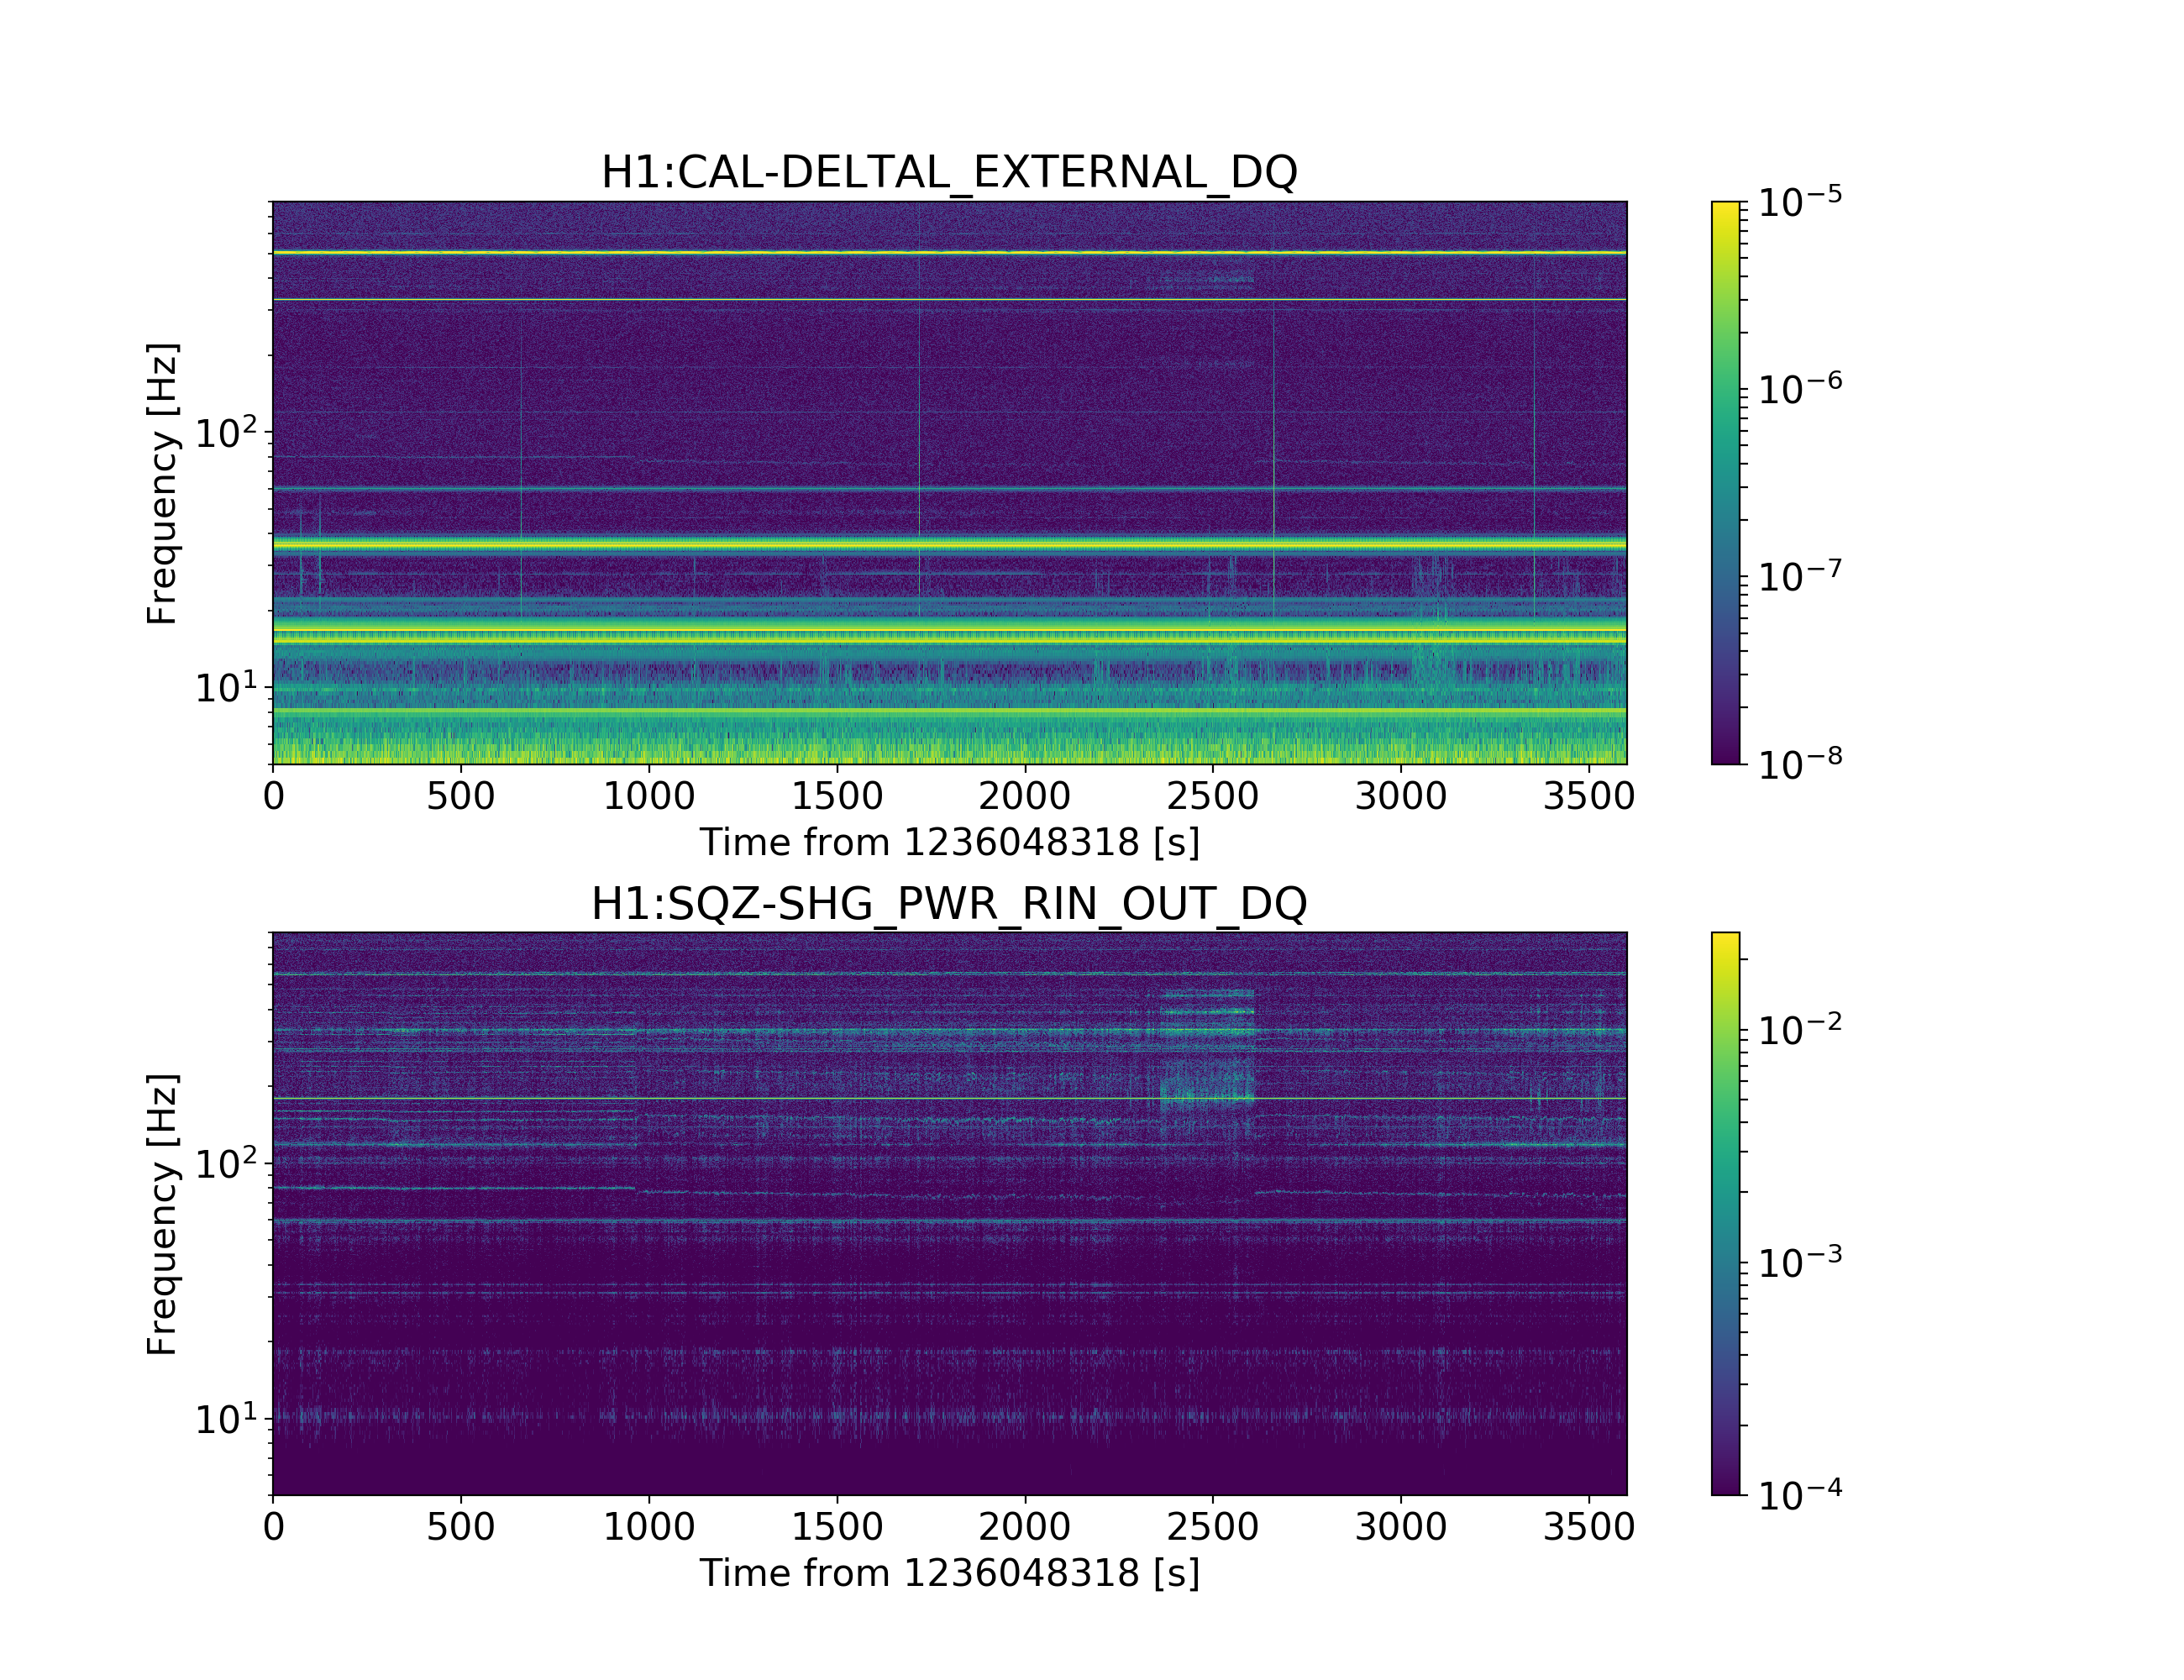
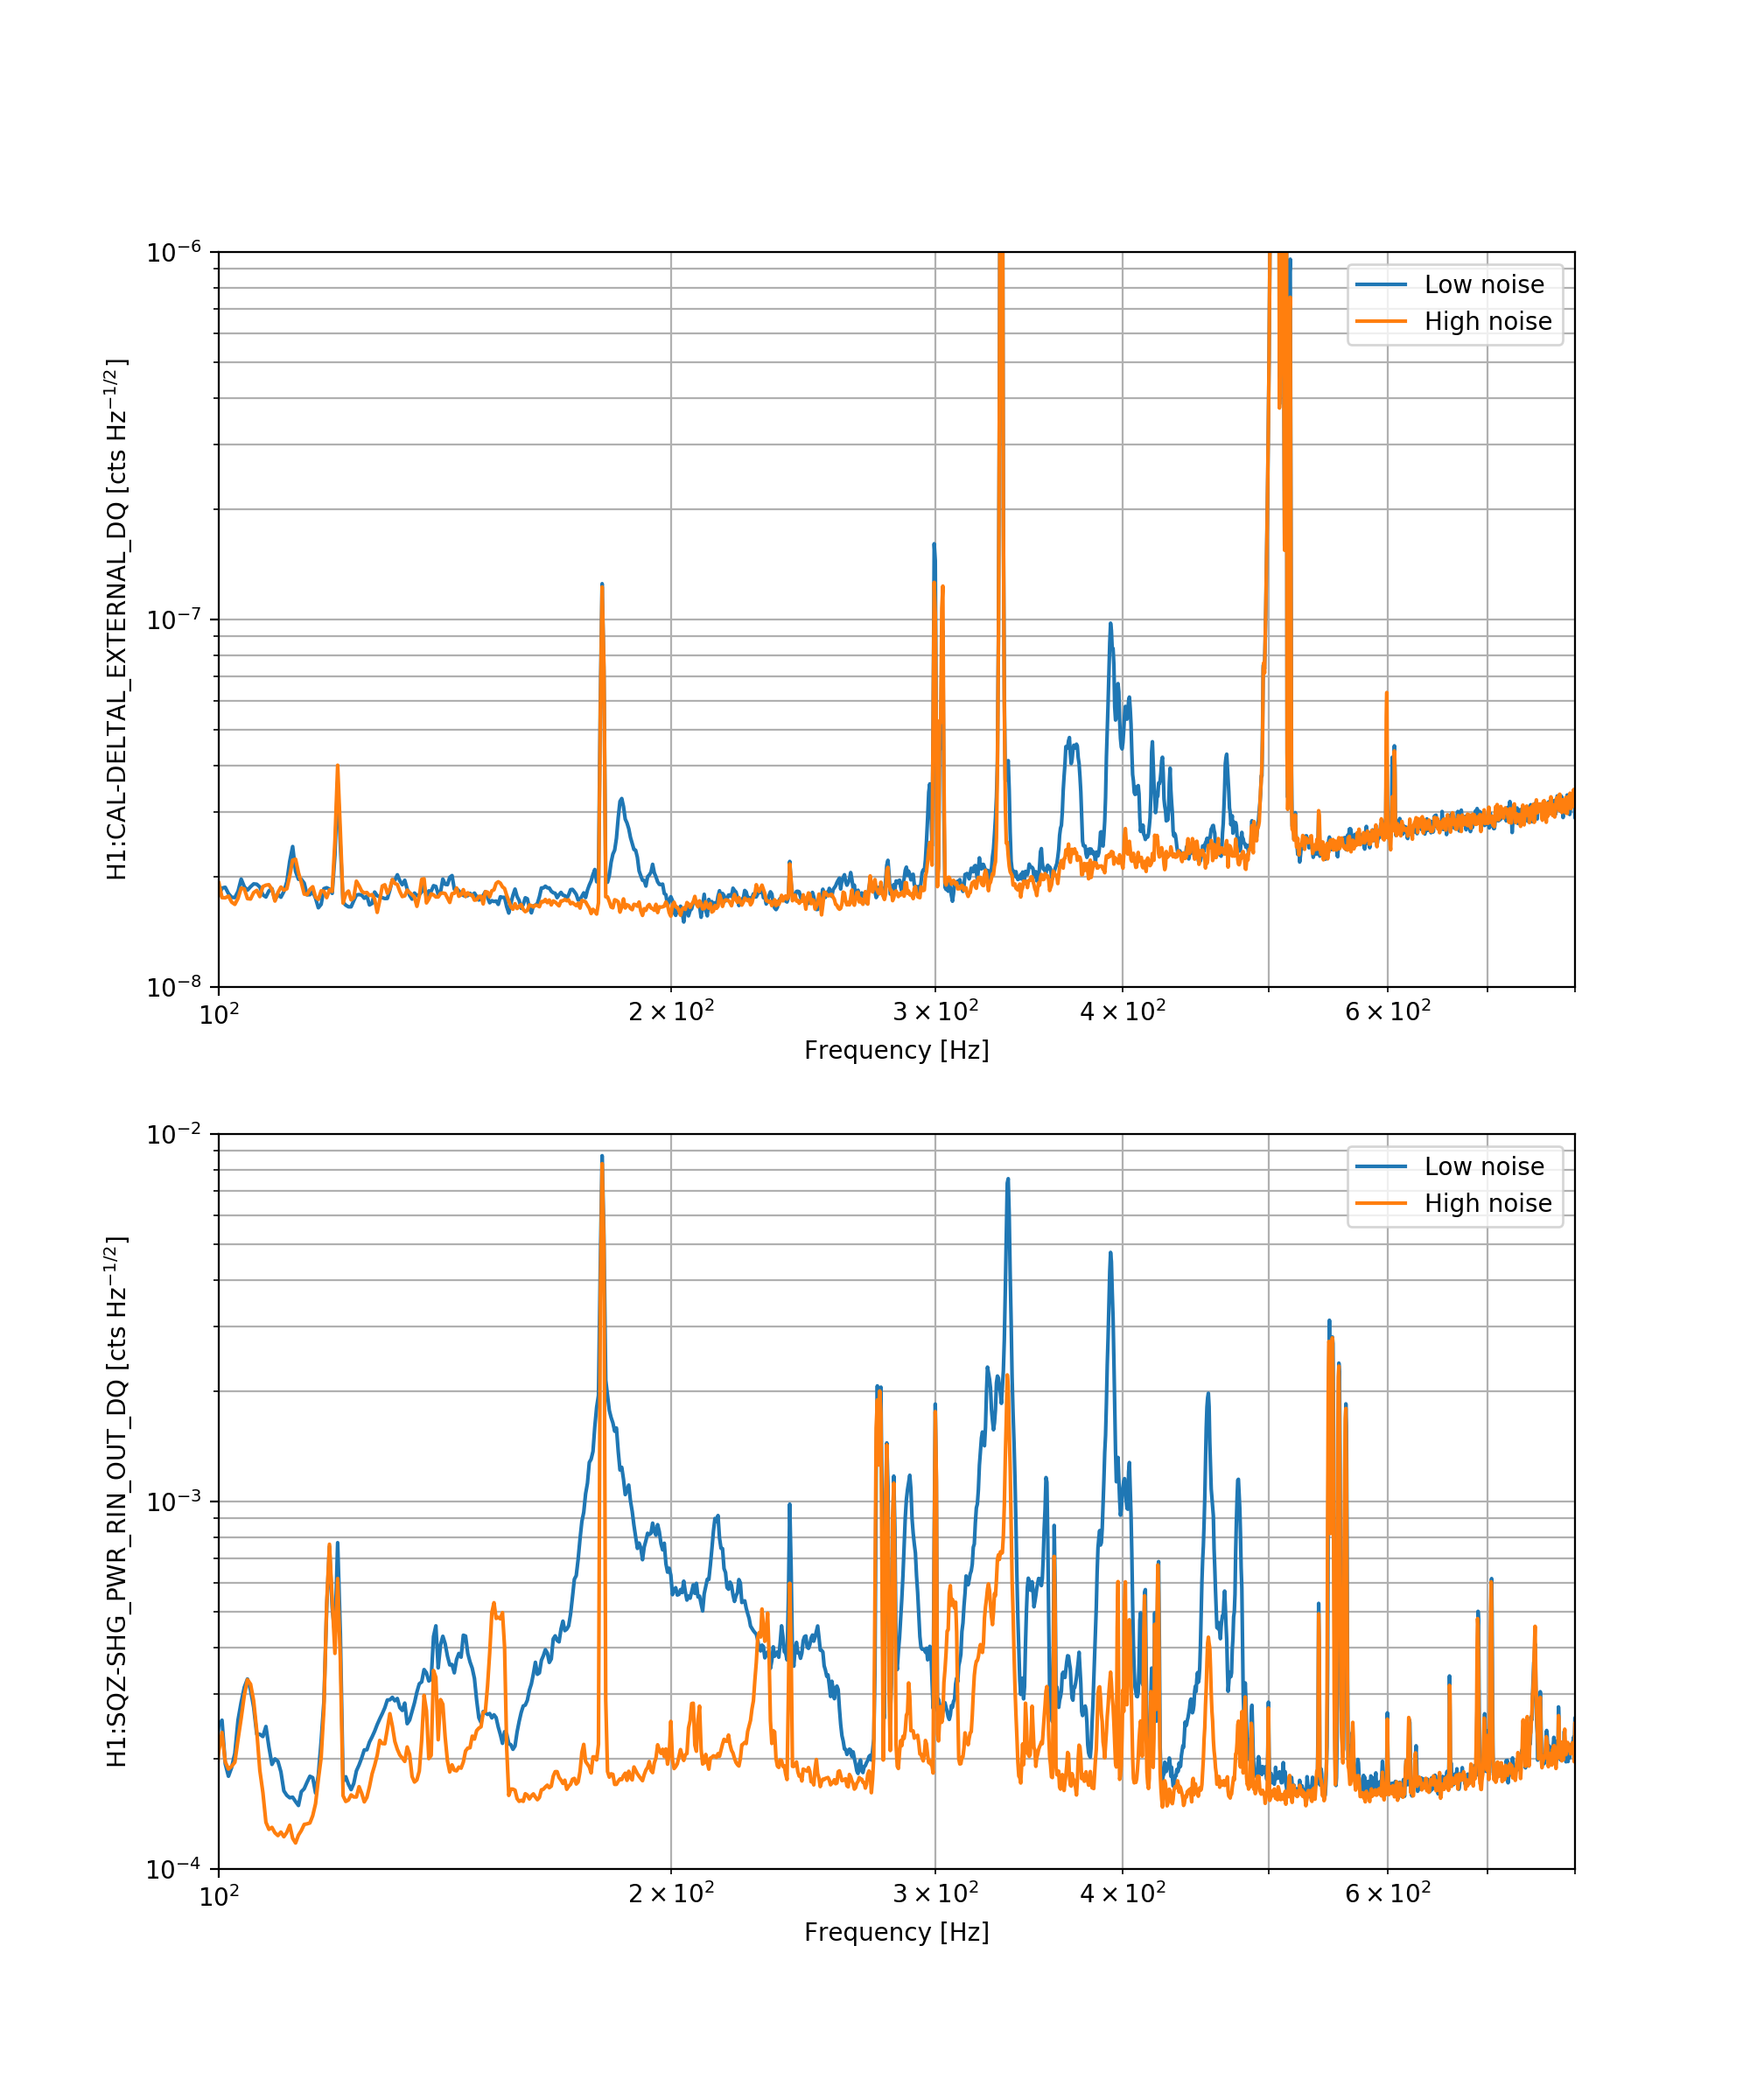
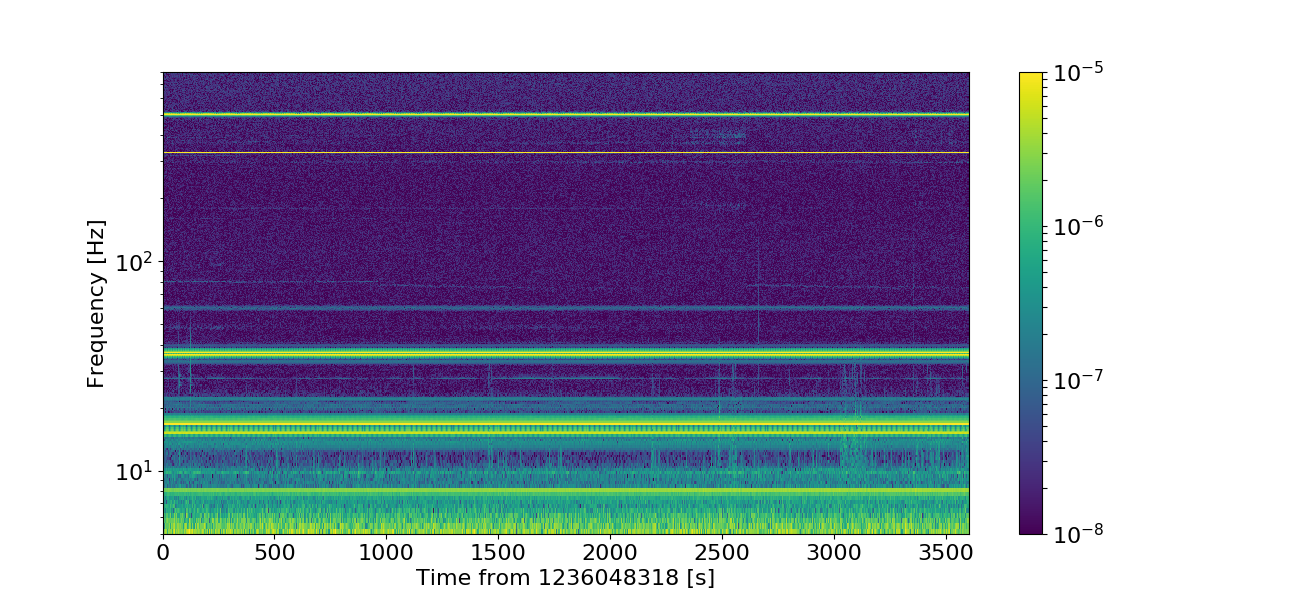
During last night lock, for a short period some excess noise appeared at around 185 Hz and 360-470 Hz. This is very visible in the spectrogram, and also in a direct comparison of the spectrum during the noisy period and a quiet period right after.
I ran two BruCo scans for the low and high noises. See
Low noise: bruco_lho_1236051018low
High noise: bruco_lho_1236050668high
The only noticeable difference is that in the high noise state, there is a teeny bit of coherence with squeezer signals. I picked one signal (H1:SQZ-SHG_PWR_RIN_OUT_DQ) and found that
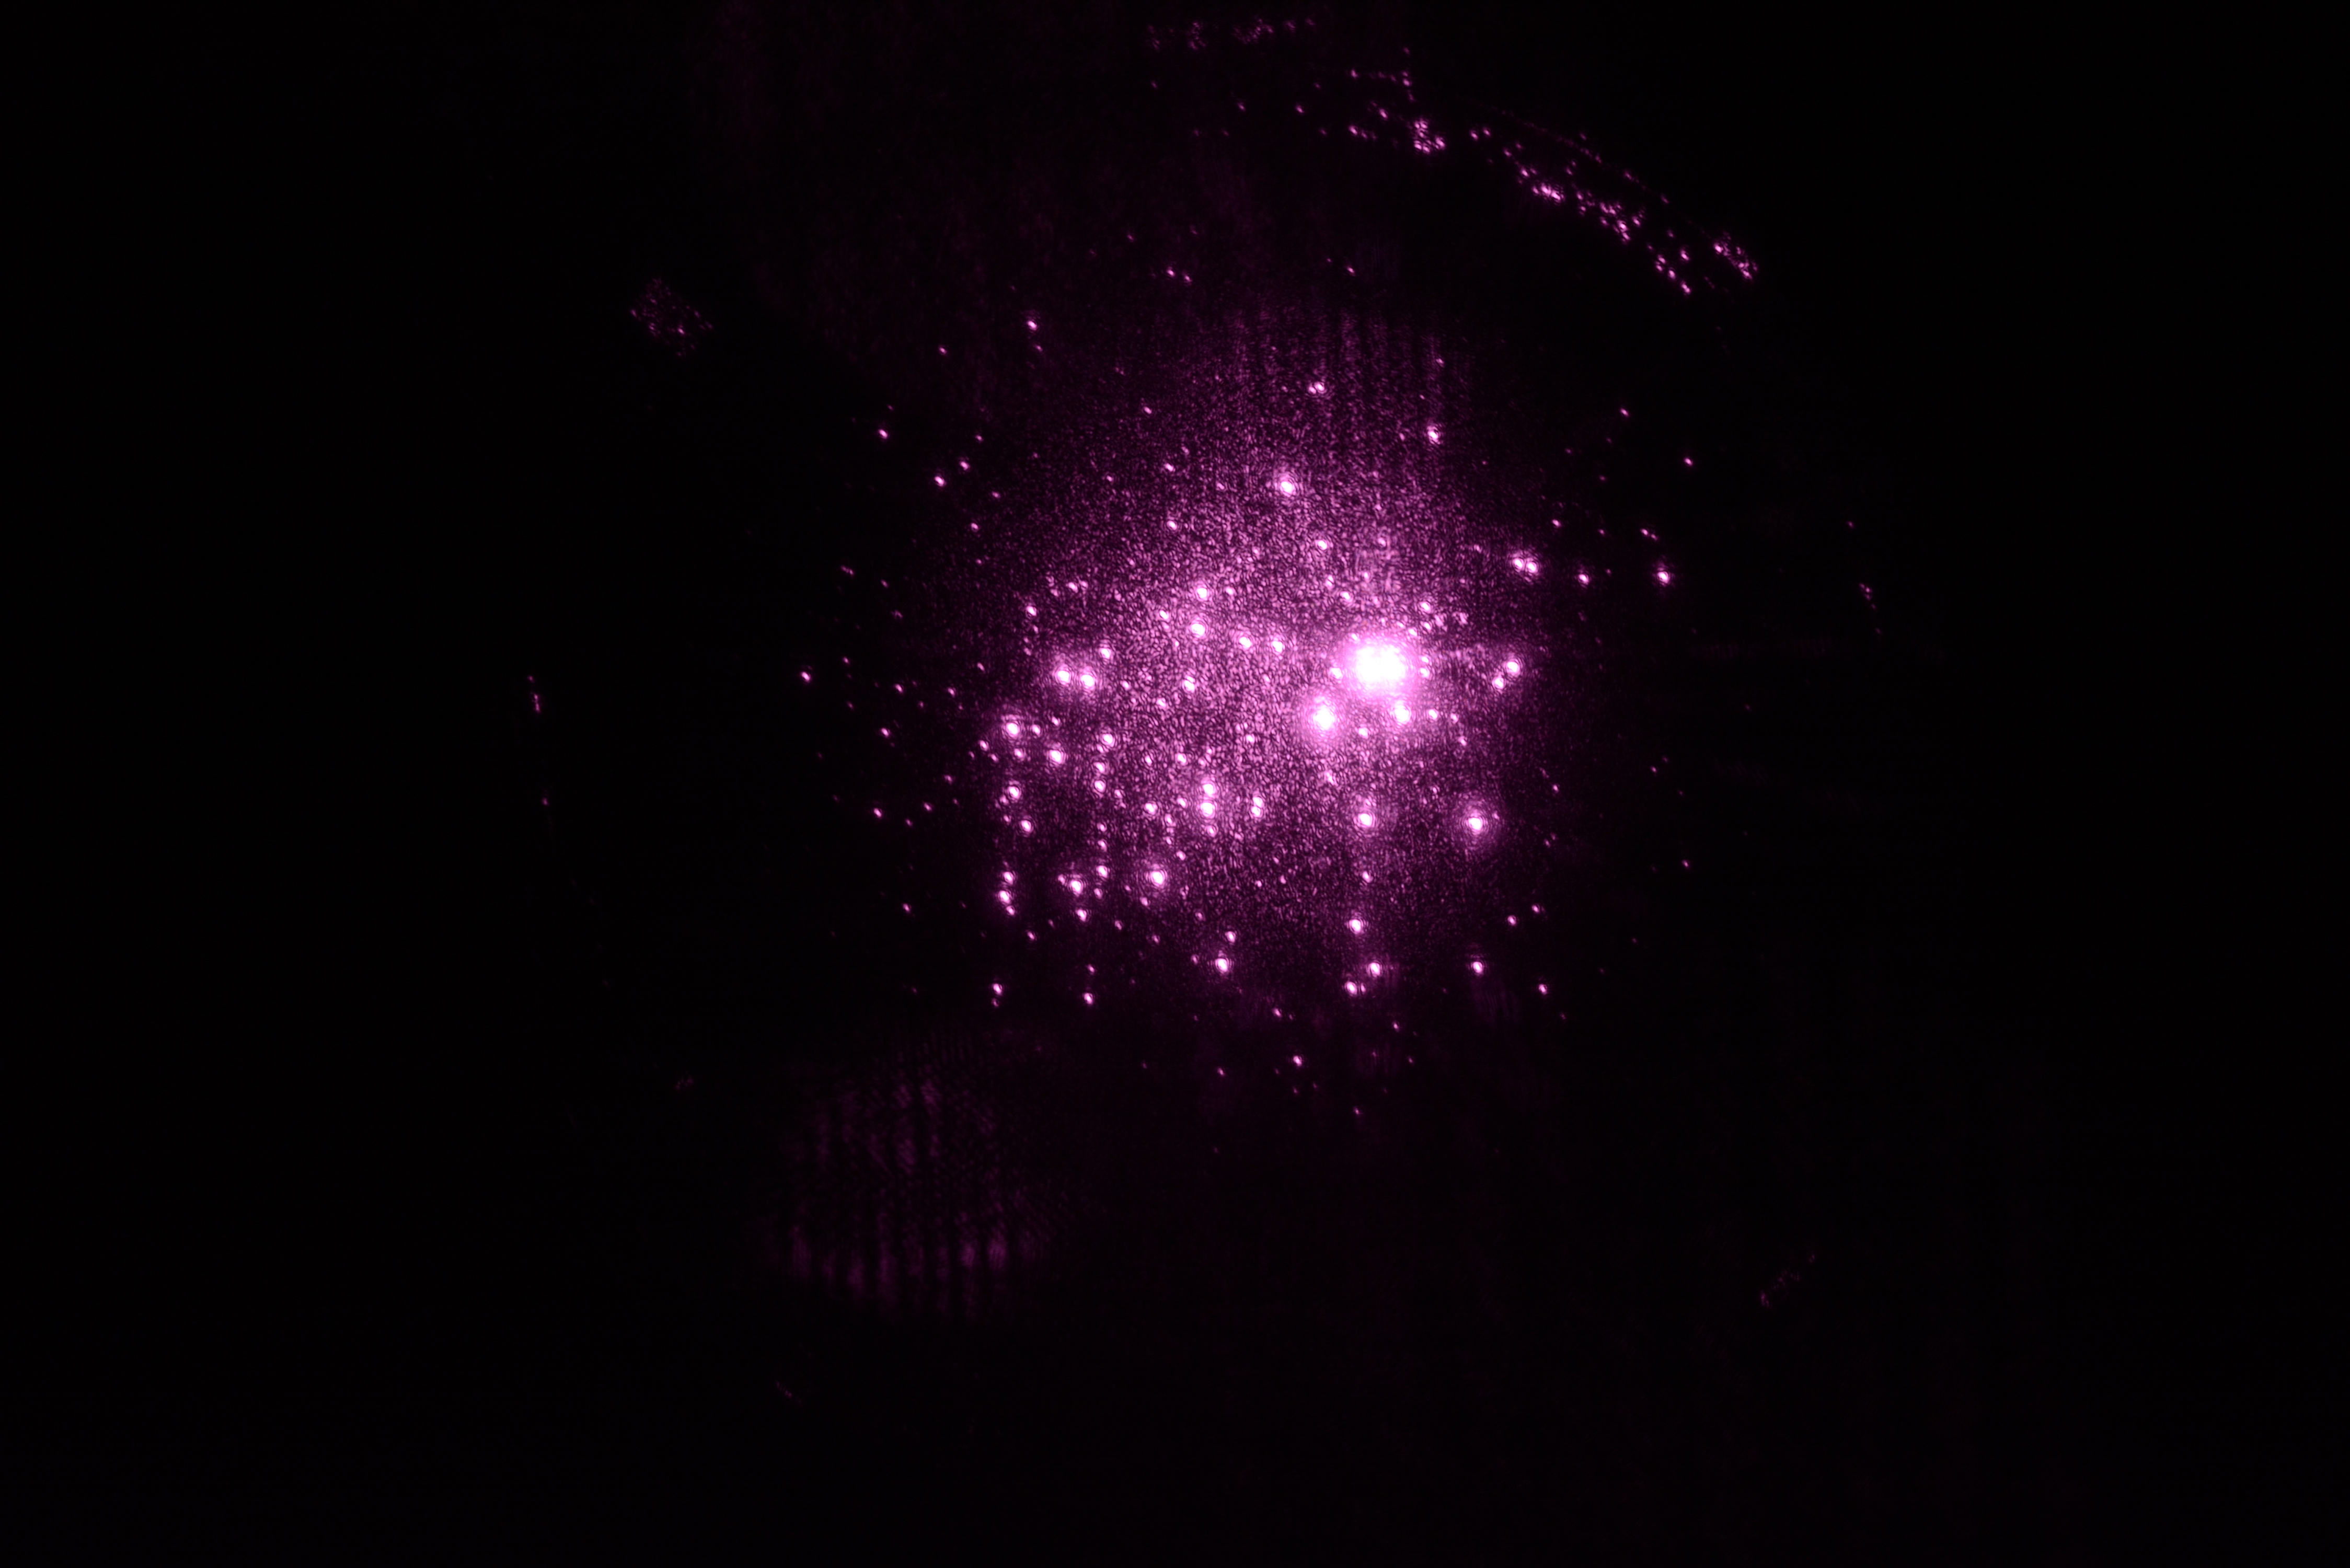
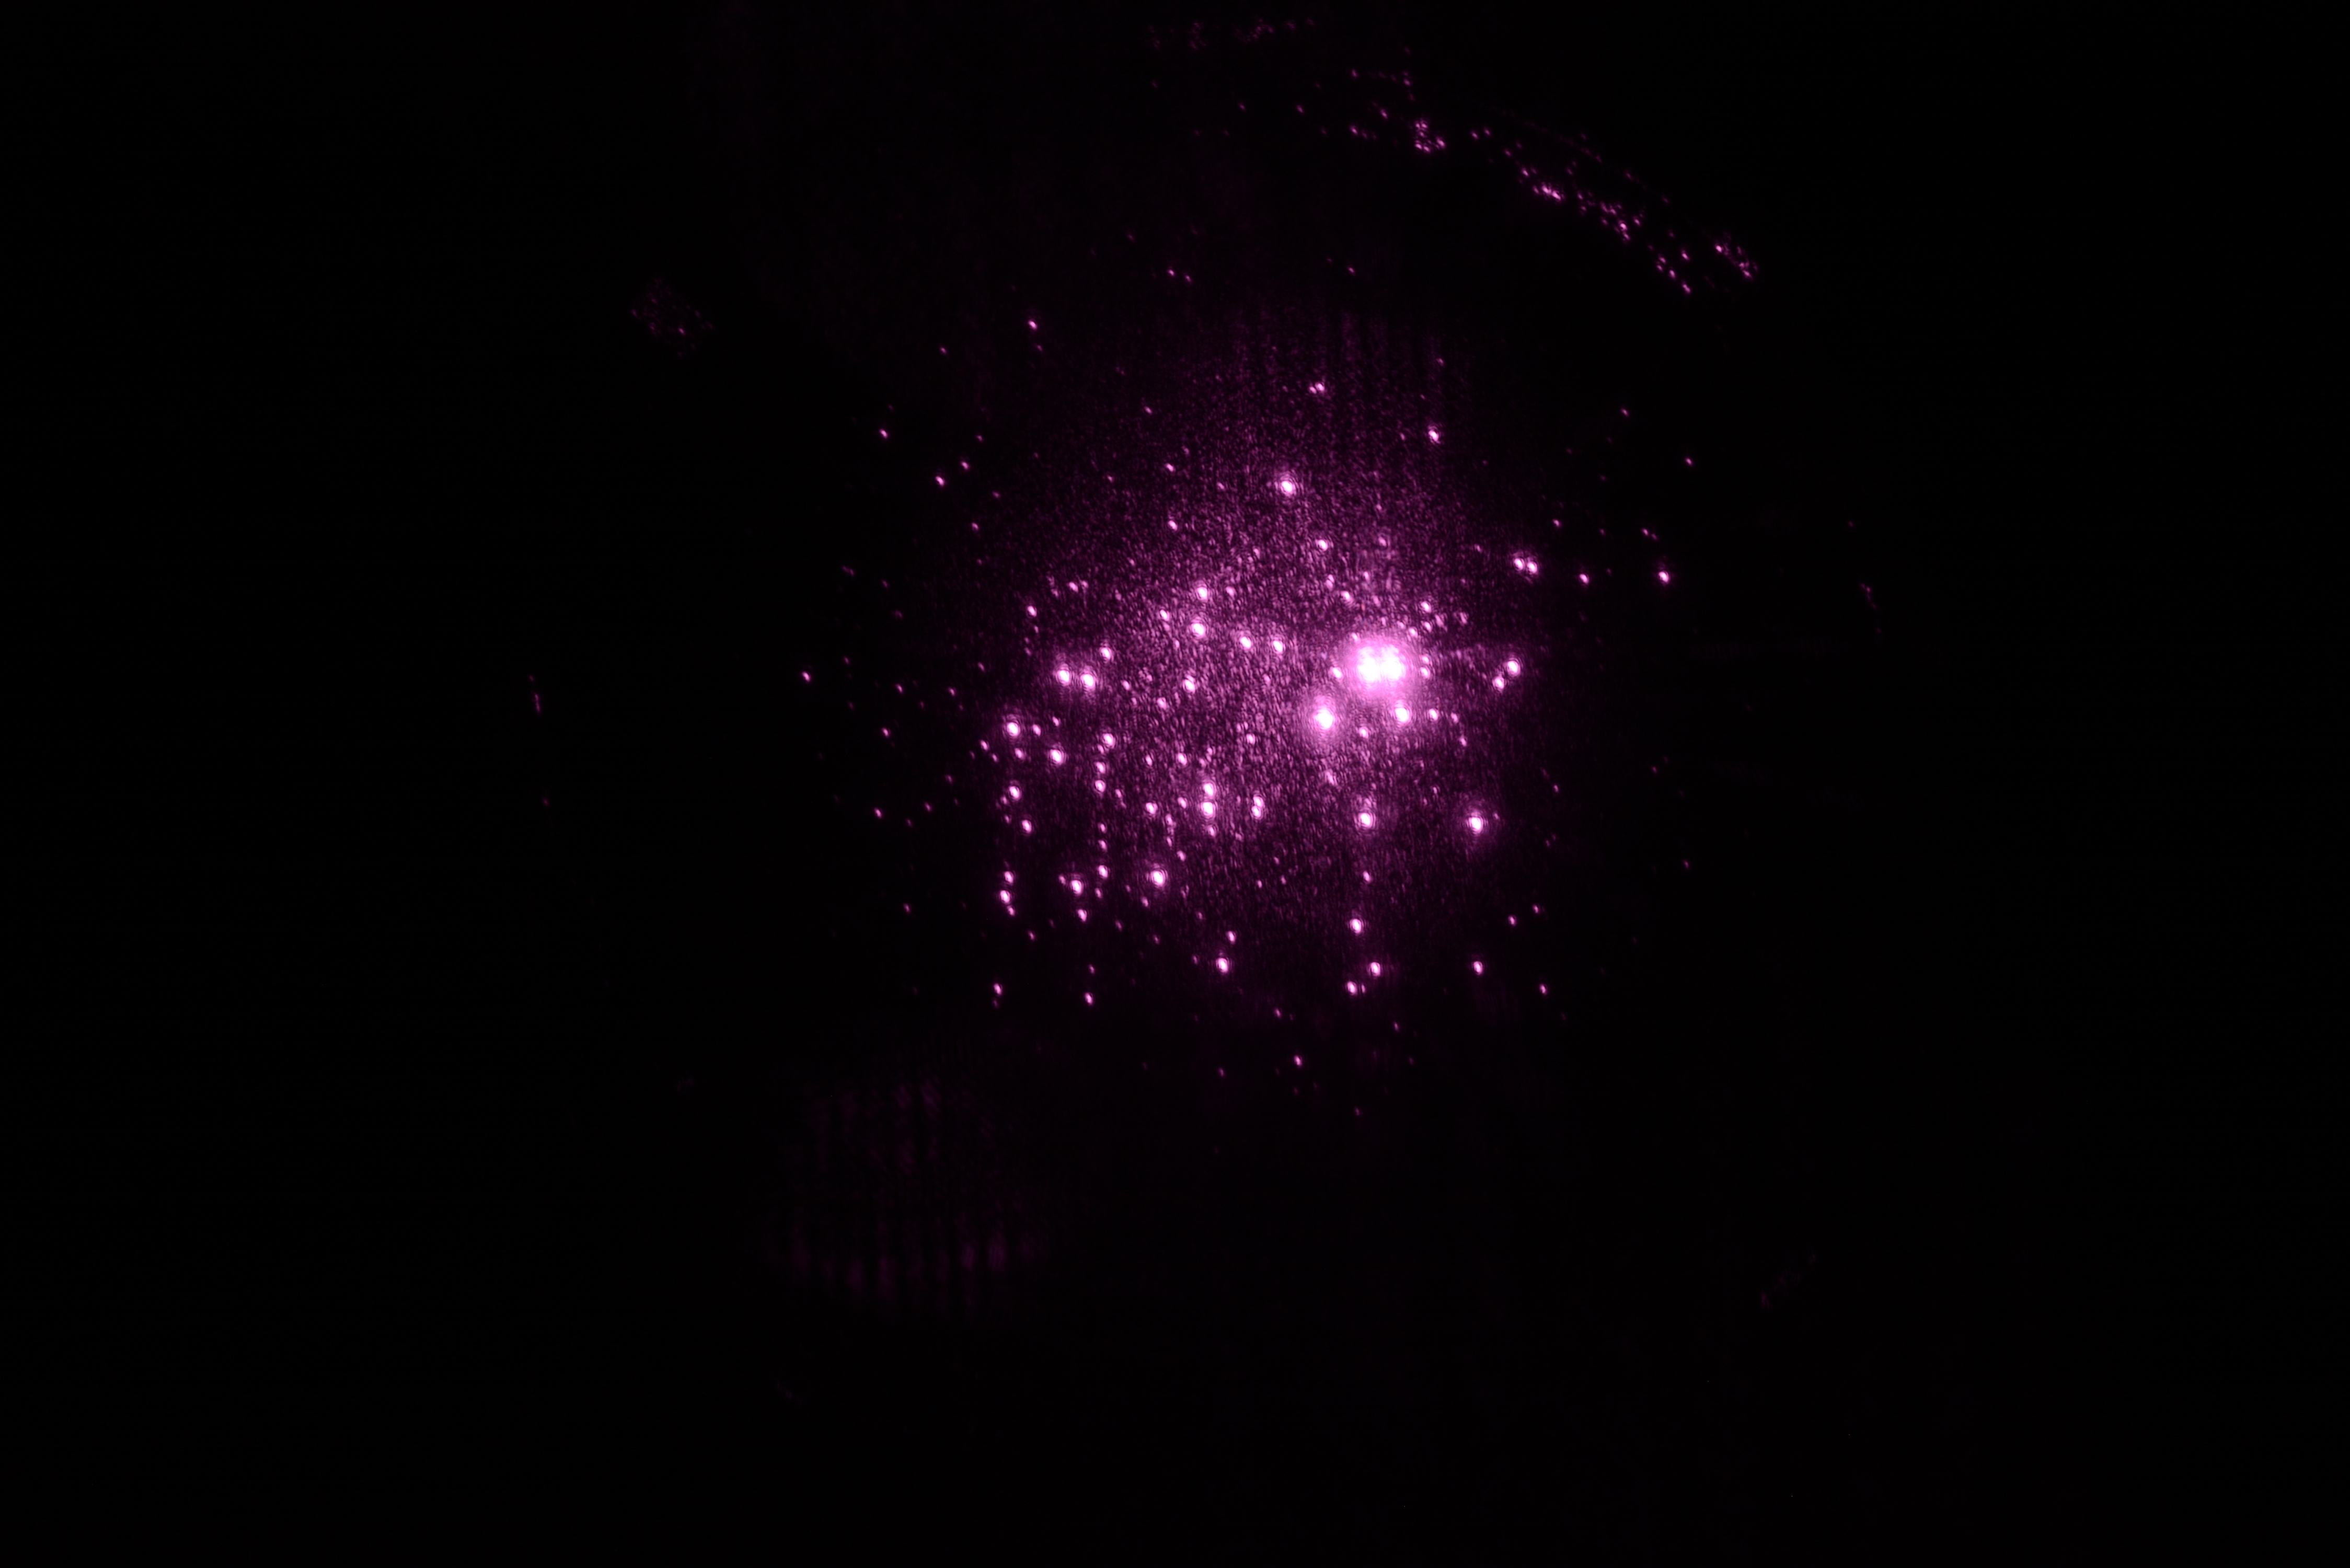
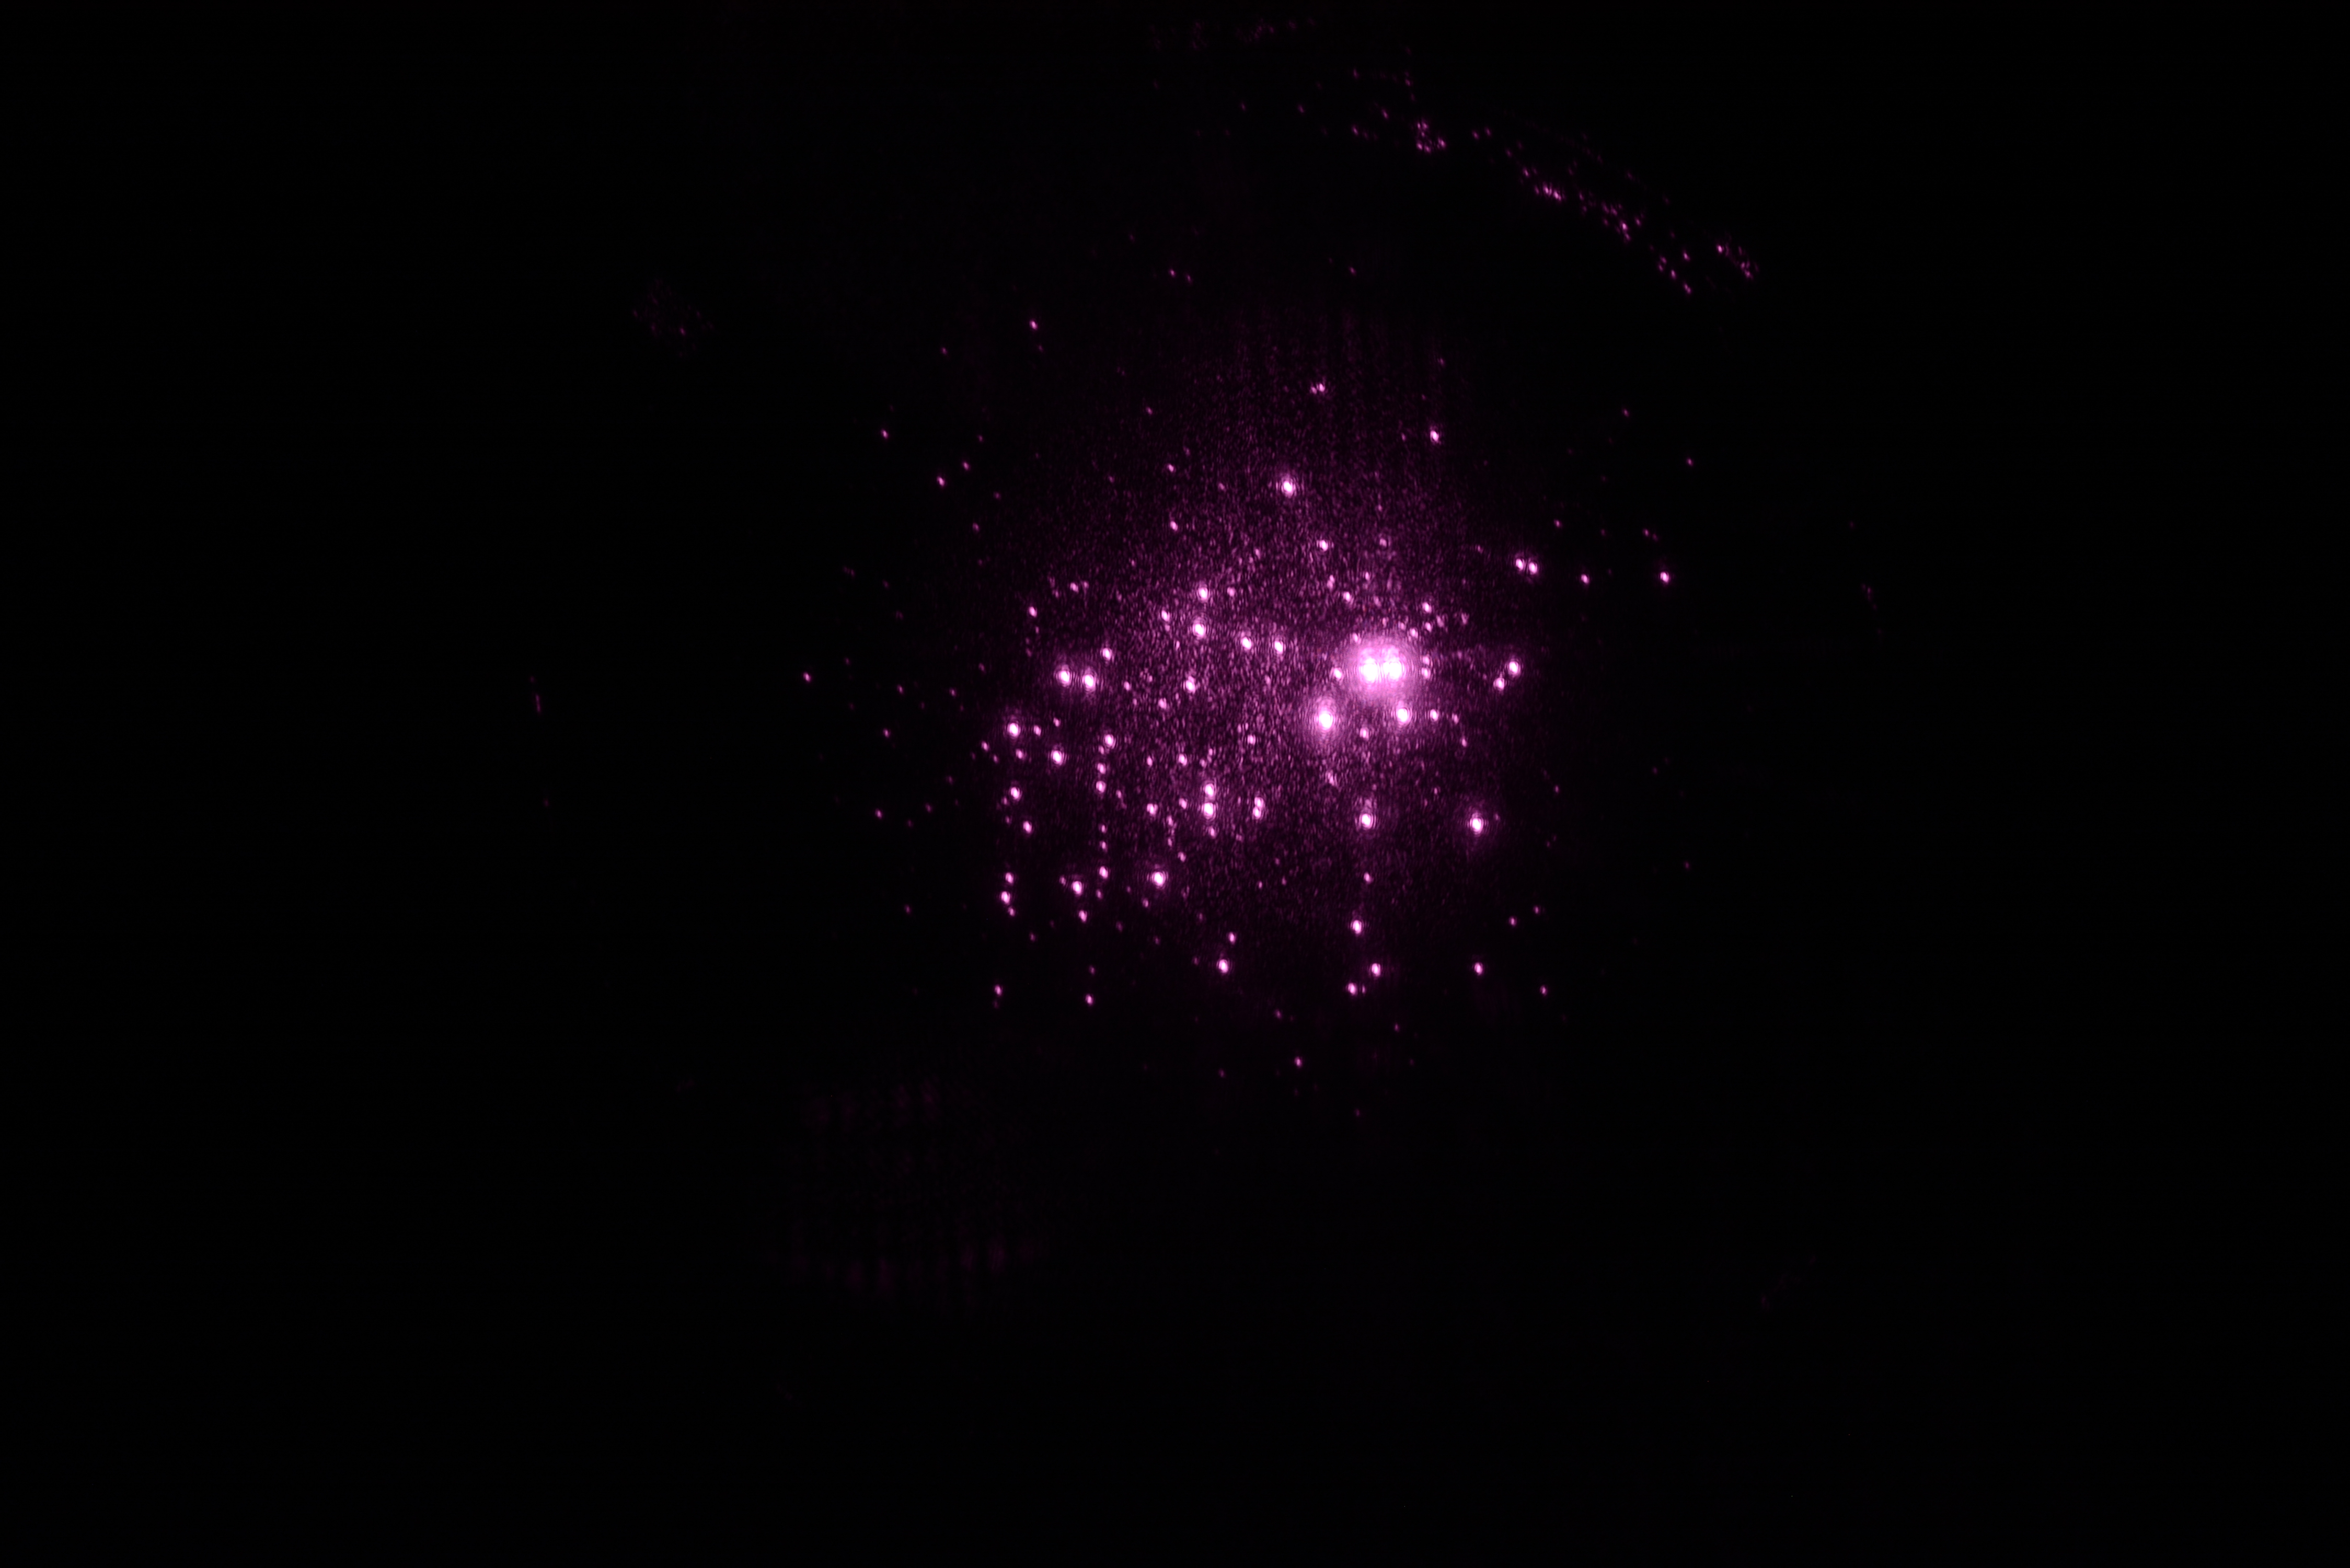
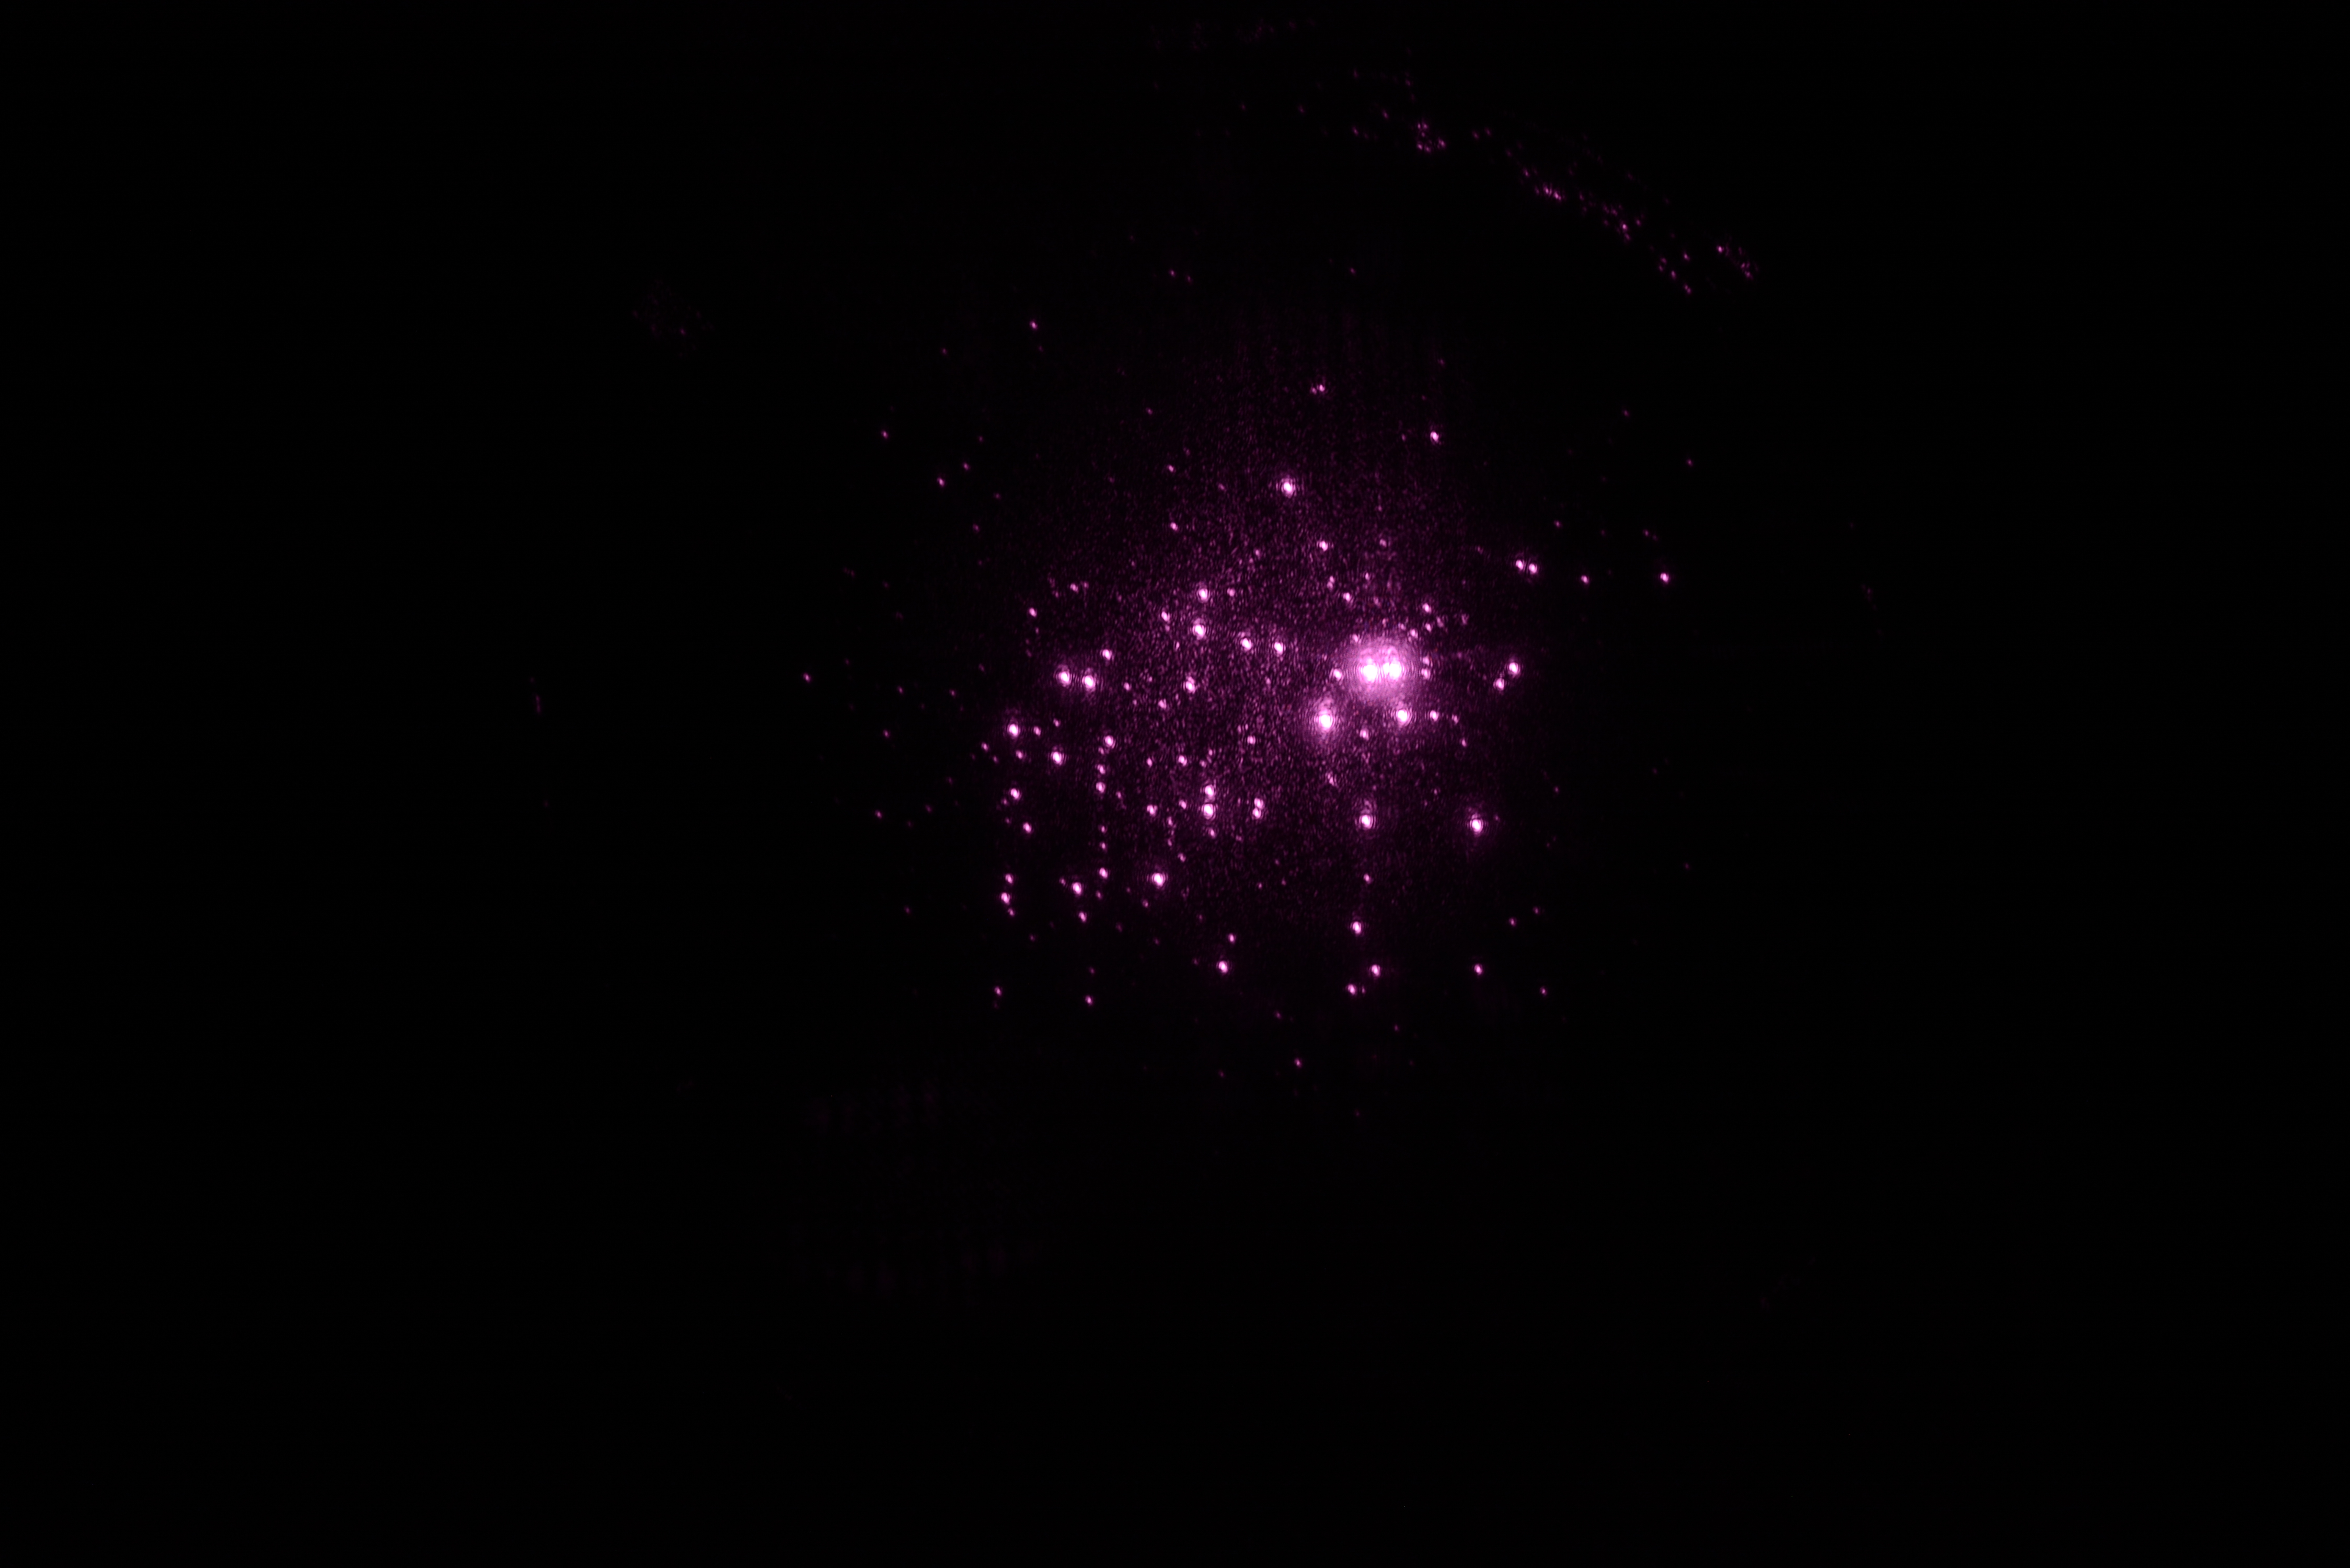
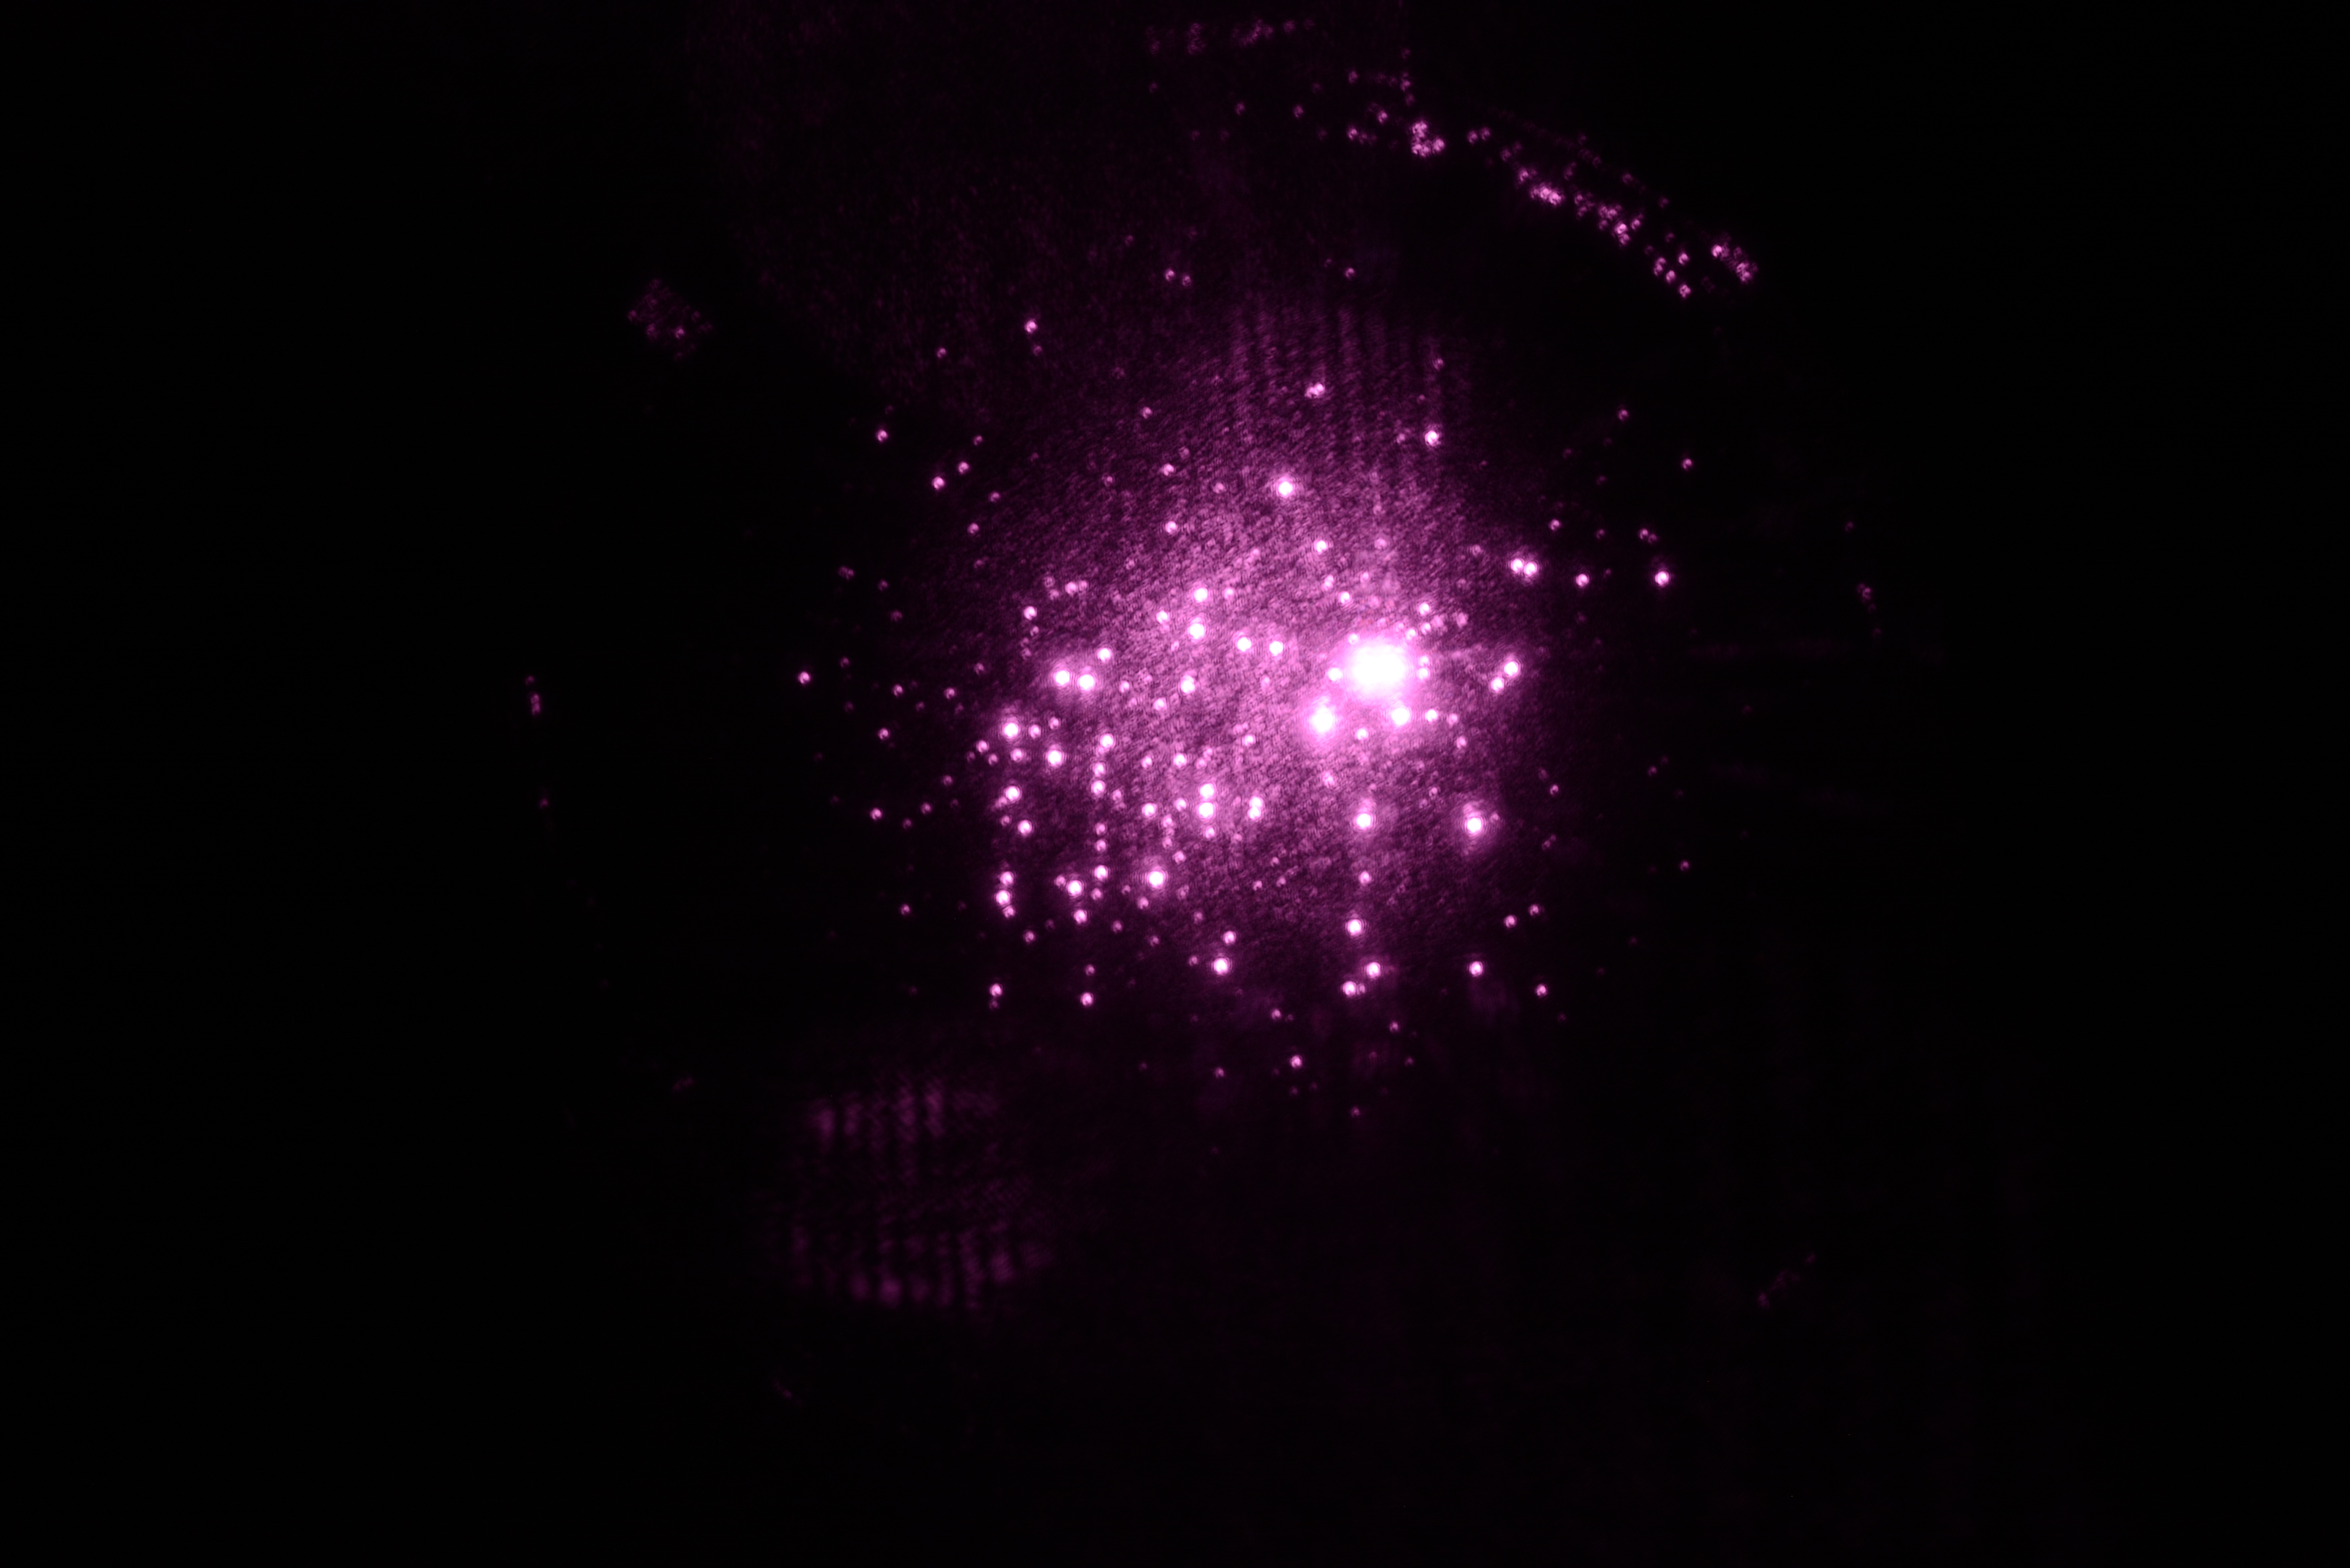
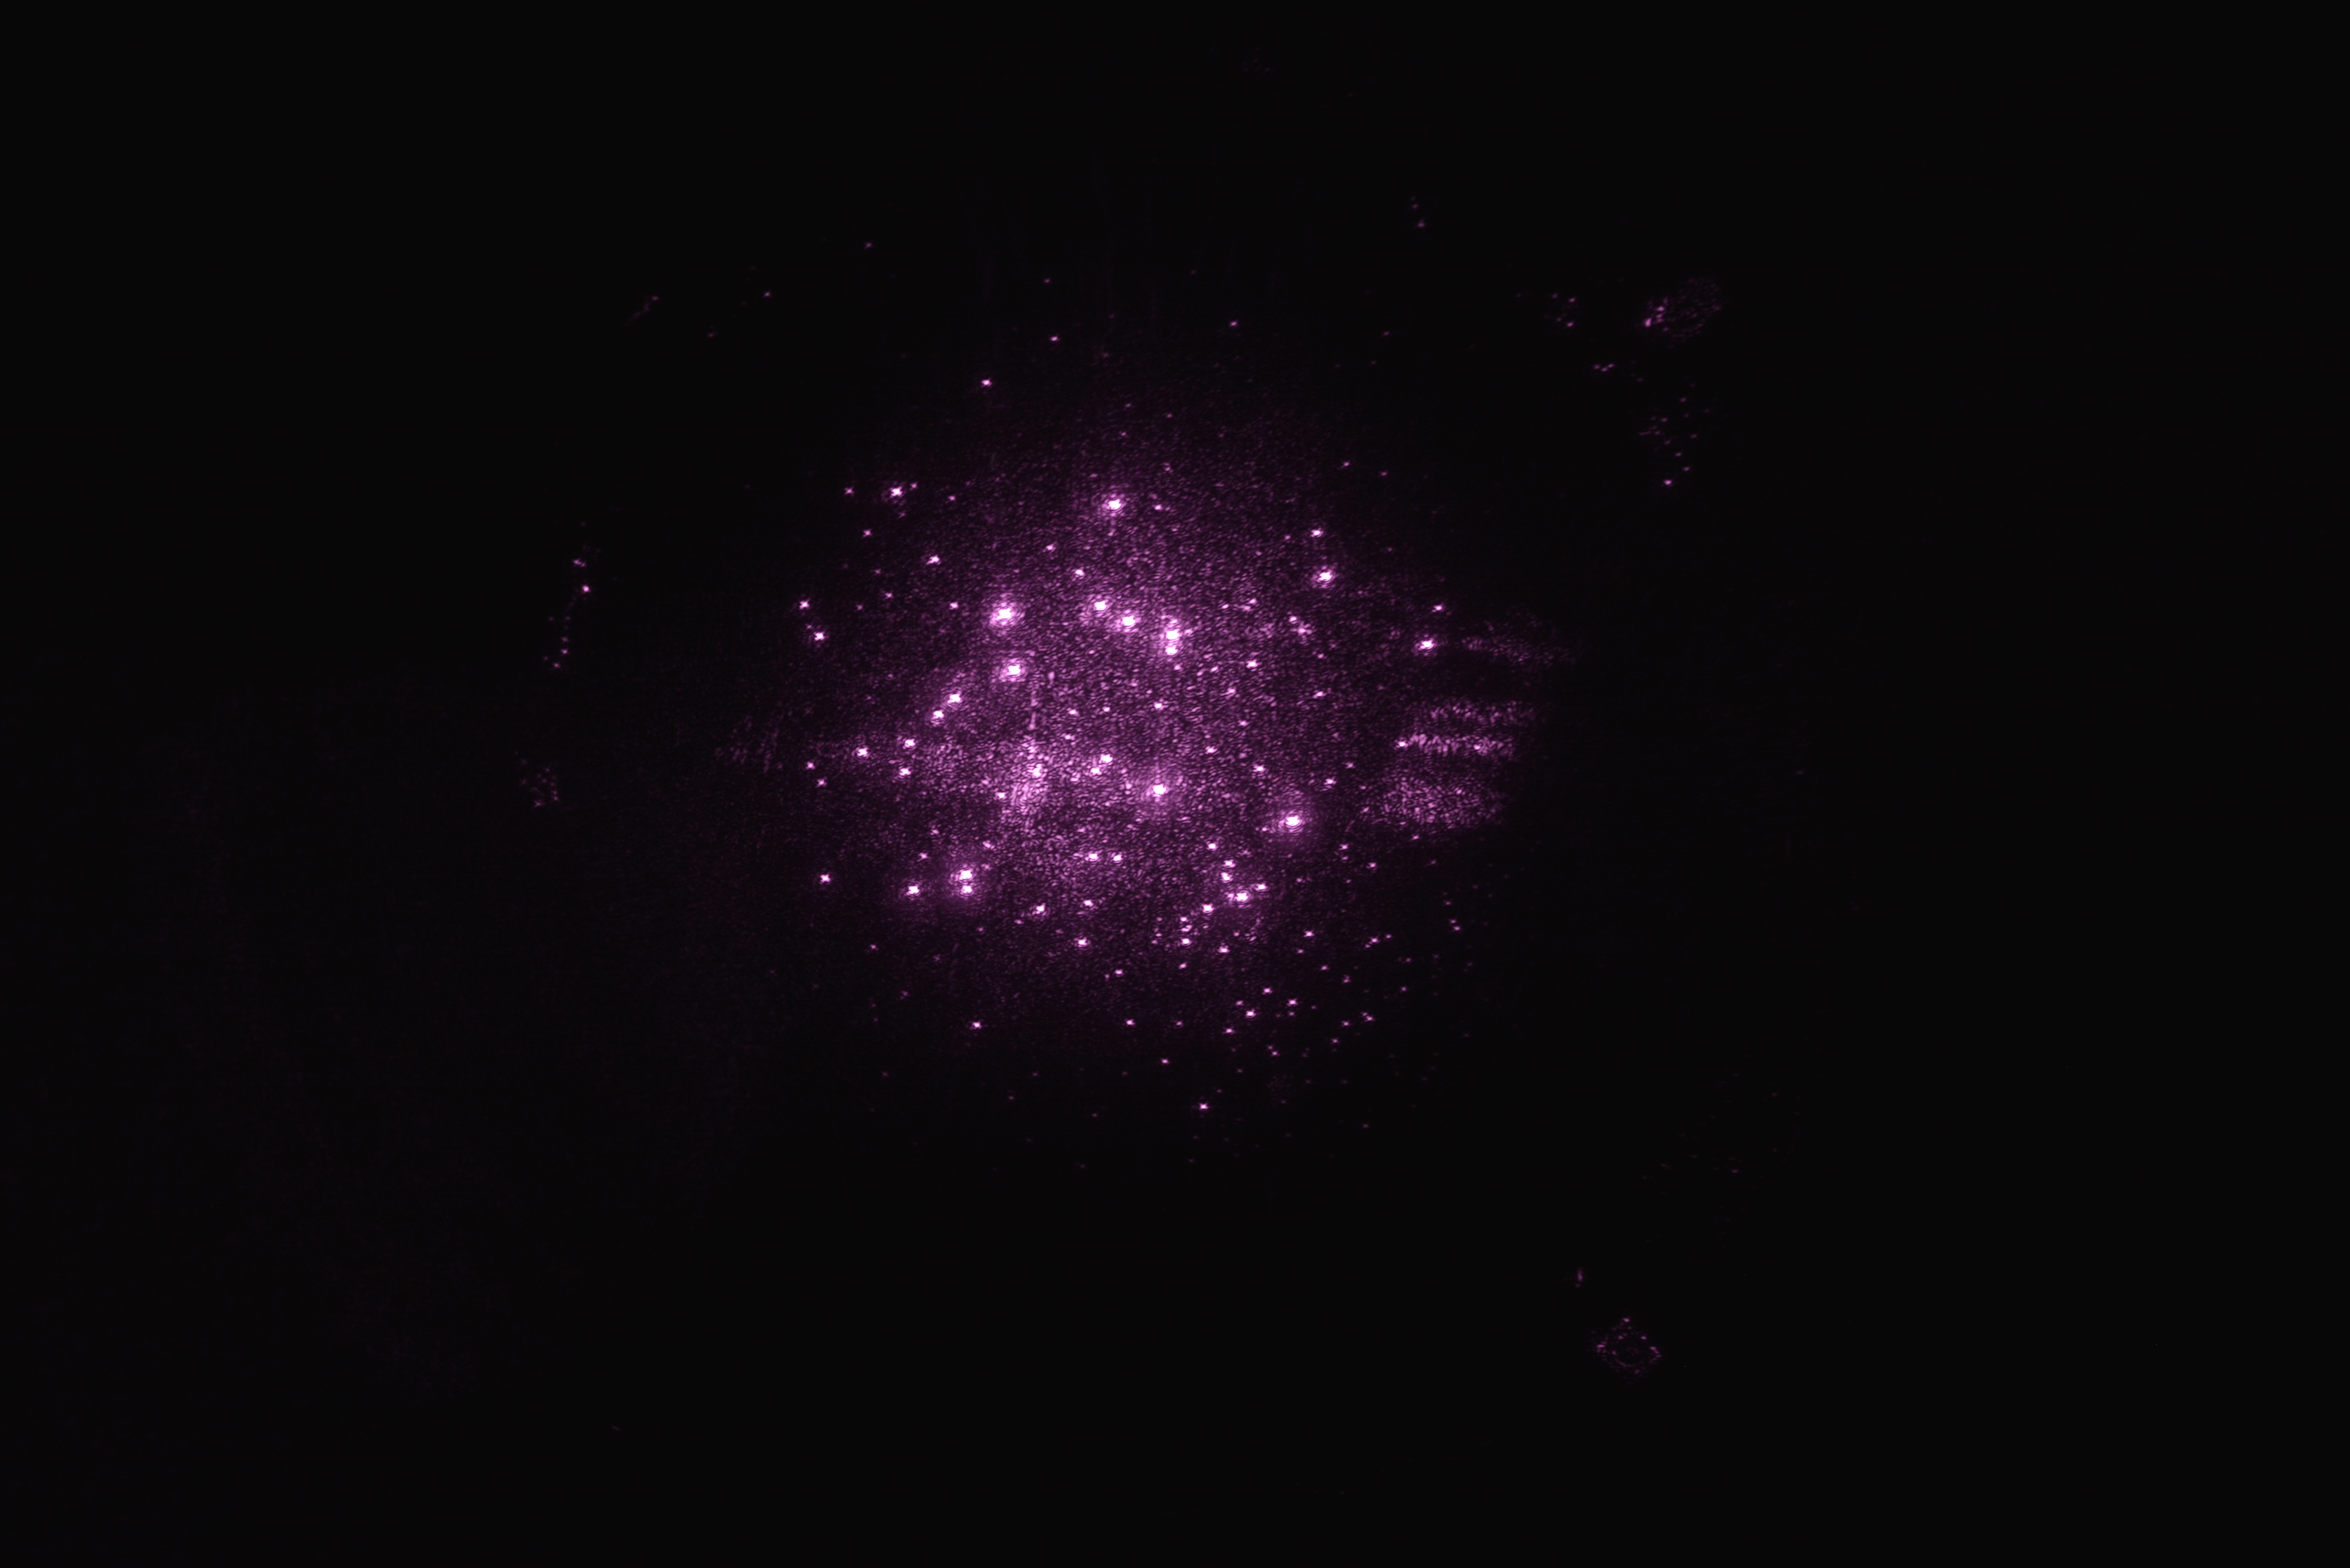
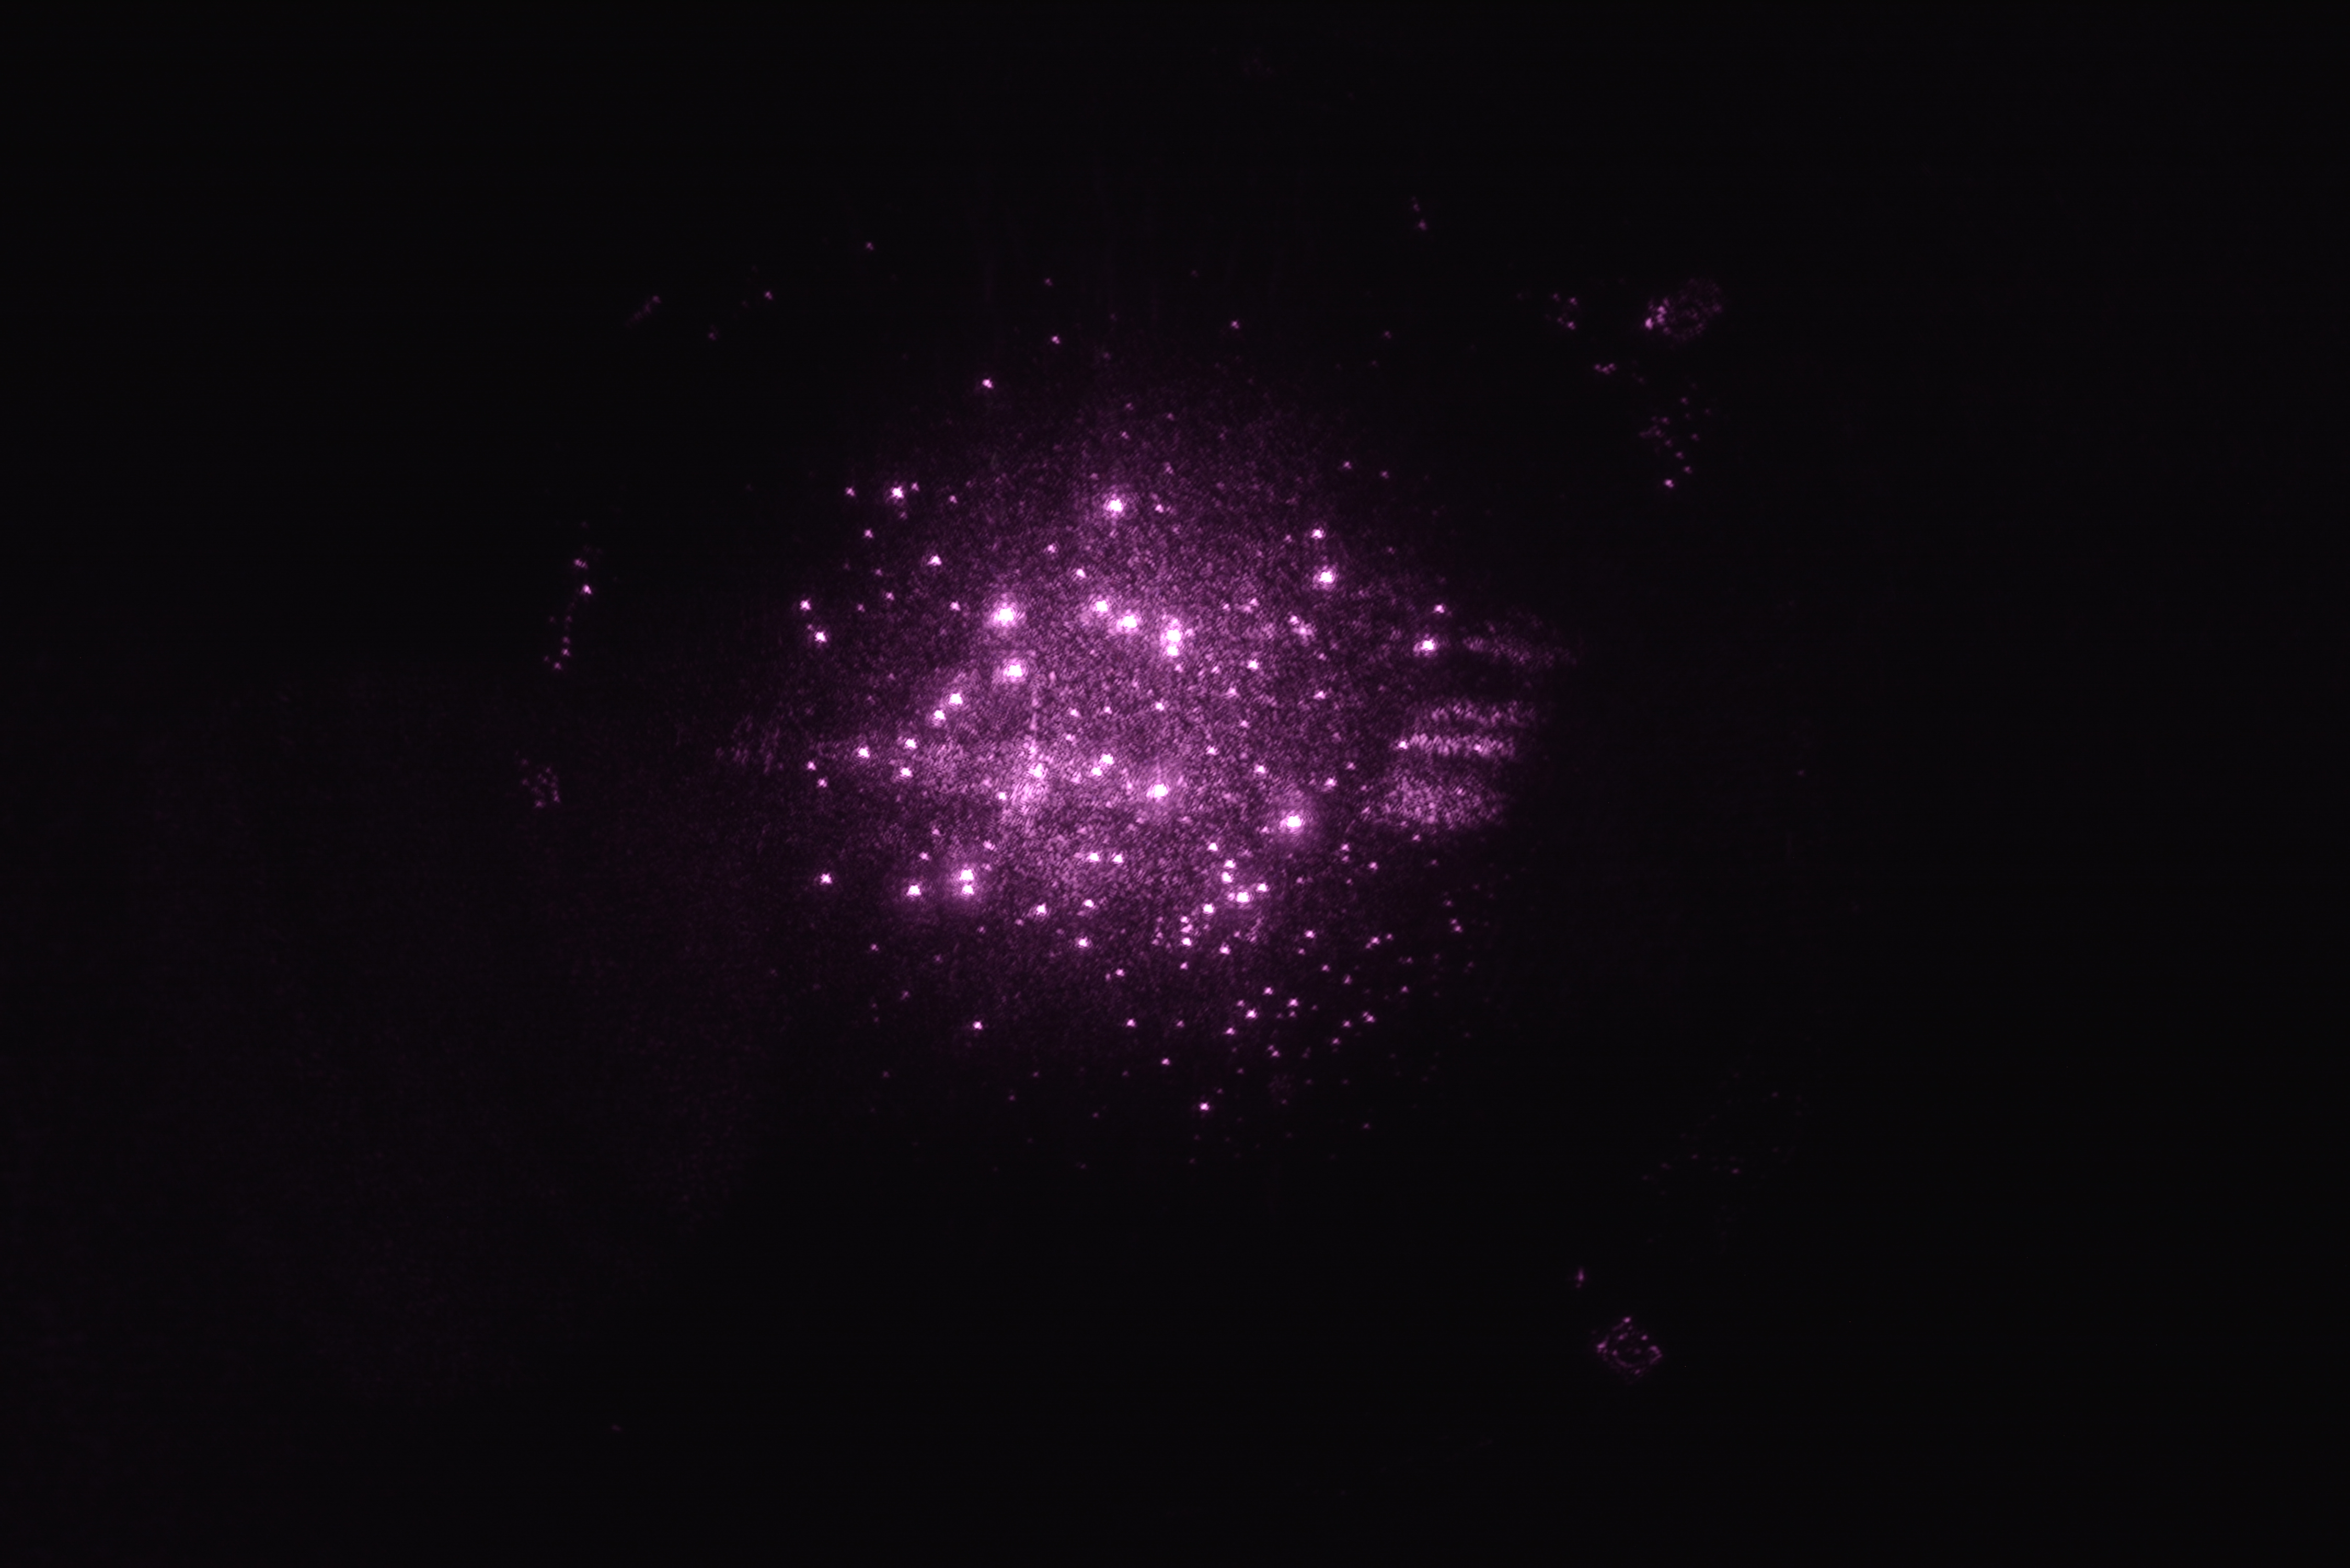
Got a minute this morning (thanks Jenne)to take some ITM photos under 30 watts laser. All frames were shot from a fixed point and focal length, so the images should be the same. I am looking into adding a grid or overlay to help with fixing location of the spots. Right now the best way to fix the spots locations is to use the image of the EQ stop, which one or two are visible in most frames.
These frames were shot varying the exposure and ISO to render a usable image. ITM-X frame #004 and ITM-Y frame #3 show the best resolution of the spots. However this is just my opinion.
Feedback to make these images more useful is always appreciated.
Looking at one hour of data during the good lock of last night (47384) we can see that there is a lot of non-stationary noise at low frequency (below 30-40 Hz) most likely due to scatter light driven by the OMC ASC loops (47321)
Here's a spectrogram of one hours of data from last night (using CAL-DELTAL_EXTERNAL and without compensating for the whitening, so that there's no spectral leakage from the low frequency motion).
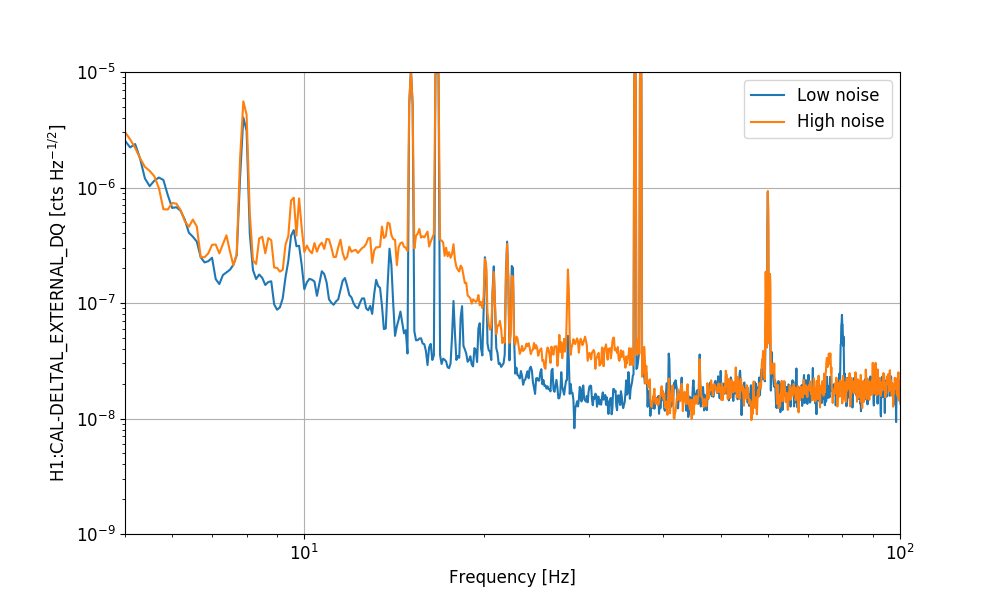
A direct comparison of a "quiet" period and a "noisy" period is shown below (quiet is +500s from start, noisy is +3035s from start).
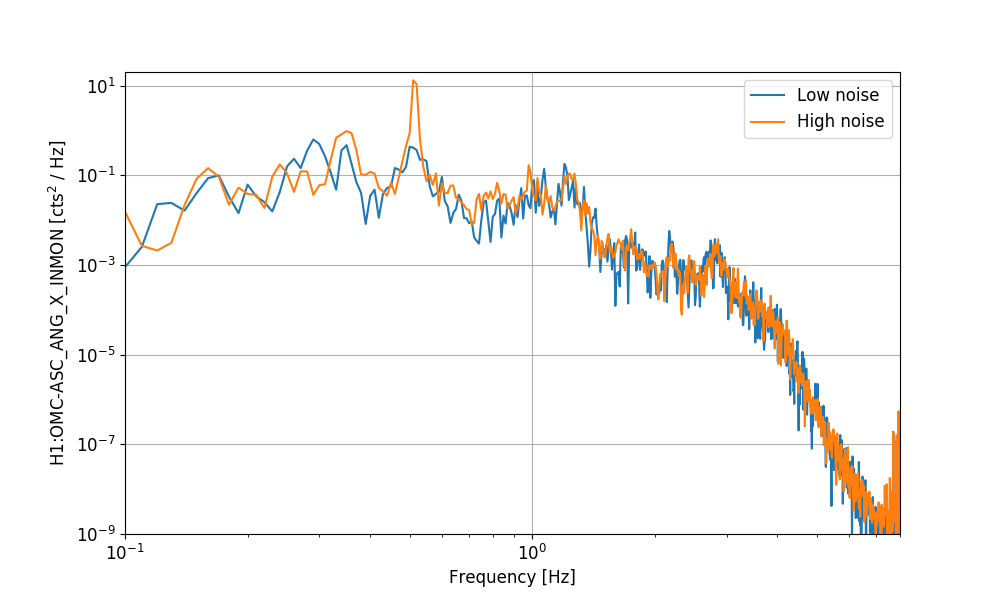
To better correlate the noise level with the OMC ASC motion, I computed band-limited RMS (BLRMS) of DARM in two regions: 10-14 Hz and 28-32 Hz. There is a correlation between the OMC ANG and POS signal RMS and the DARM noise. I compared the OMC ASC signals in the two "low" and "high" noise periods as above, and found that the main difference is in the amplitude of a 0.5 Hz peak:
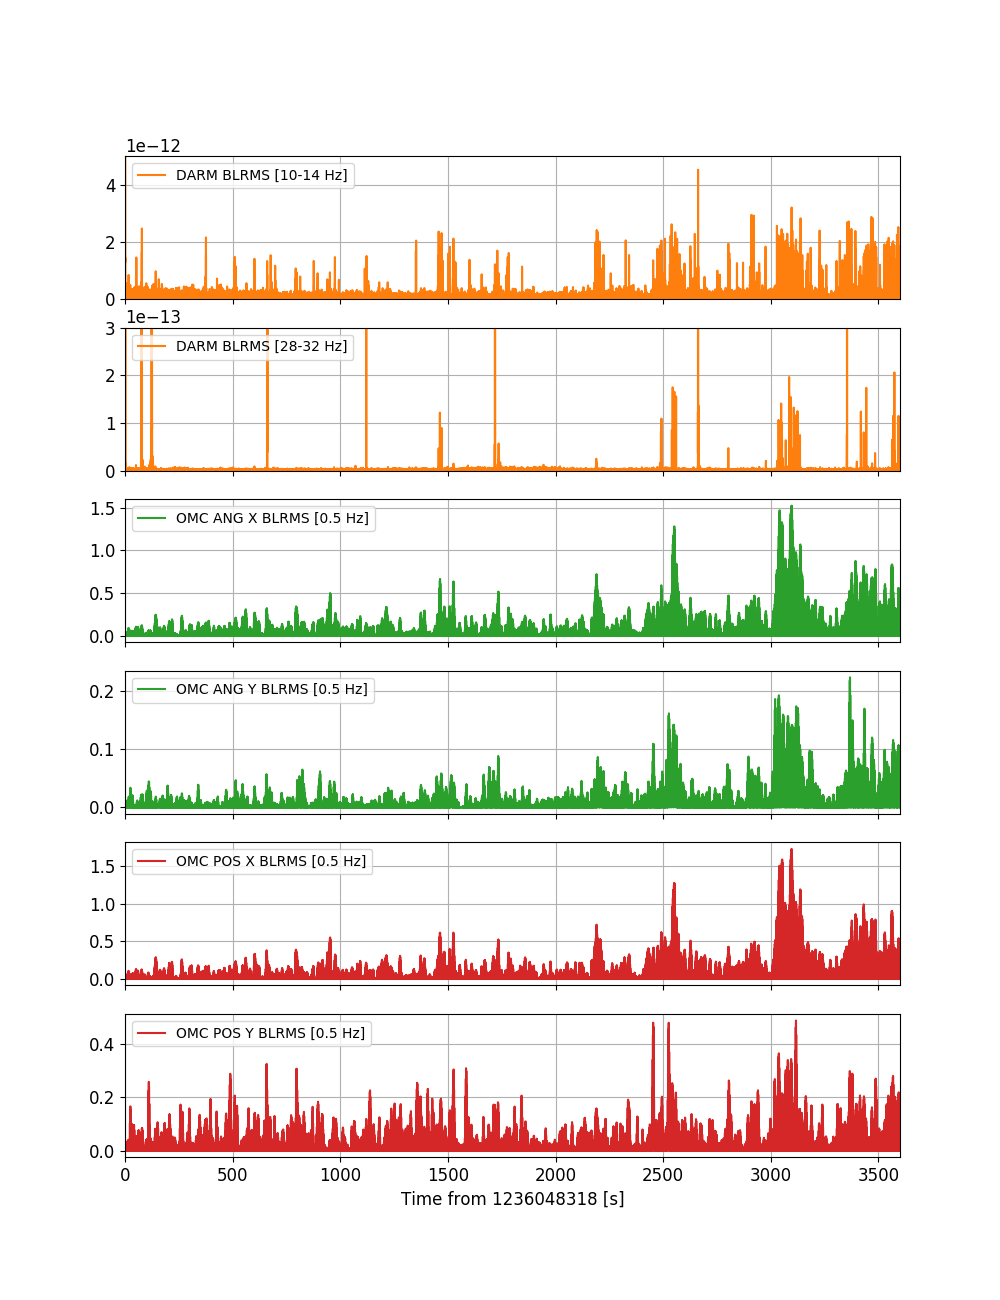
Therefore I computed the BLRMS of the OMC ASC signals around 0.5 Hz (between 0.4 and 0.6 Hz), and compared it below with the DARM BLRMS. There is an obvious correlation between times when the OMC ASC signals move more at 0.5 Hz and higher scattered light noise in DARM.
(see WP #8111)
I accidentally blew a fuse within the HEPI panel this morning by plugging a drill into a power strip which was being powered by the HEPI panel. Jim W. and Fil C. responded. The fuse wasn't serviceable at the time so the affected power supply was plugged into an extension cord as an interim solution.
TITLE: 03/08 Day Shift: 16:00-00:00 UTC (08:00-16:00 PST), all times posted in UTC
STATE of H1: Commissioning
OUTGOING OPERATOR: None
CURRENT ENVIRONMENT:
Wind: 7mph Gusts, 5mph 5min avg
Primary useism: 0.03 μm/s
Secondary useism: 0.16 μm/s
QUICK SUMMARY:
IFO unlocked. EQ around Phillippines hindering a bit. Jeff B recovered Green arm align and was waiting on DRMI. SRC (SR2) was found a bit off. It was corrected amd normal locking was resumed. We are currently at DC readout + 30W. Jeff B was in LVEA shooting the ITMs and Jenne is taking measurements.
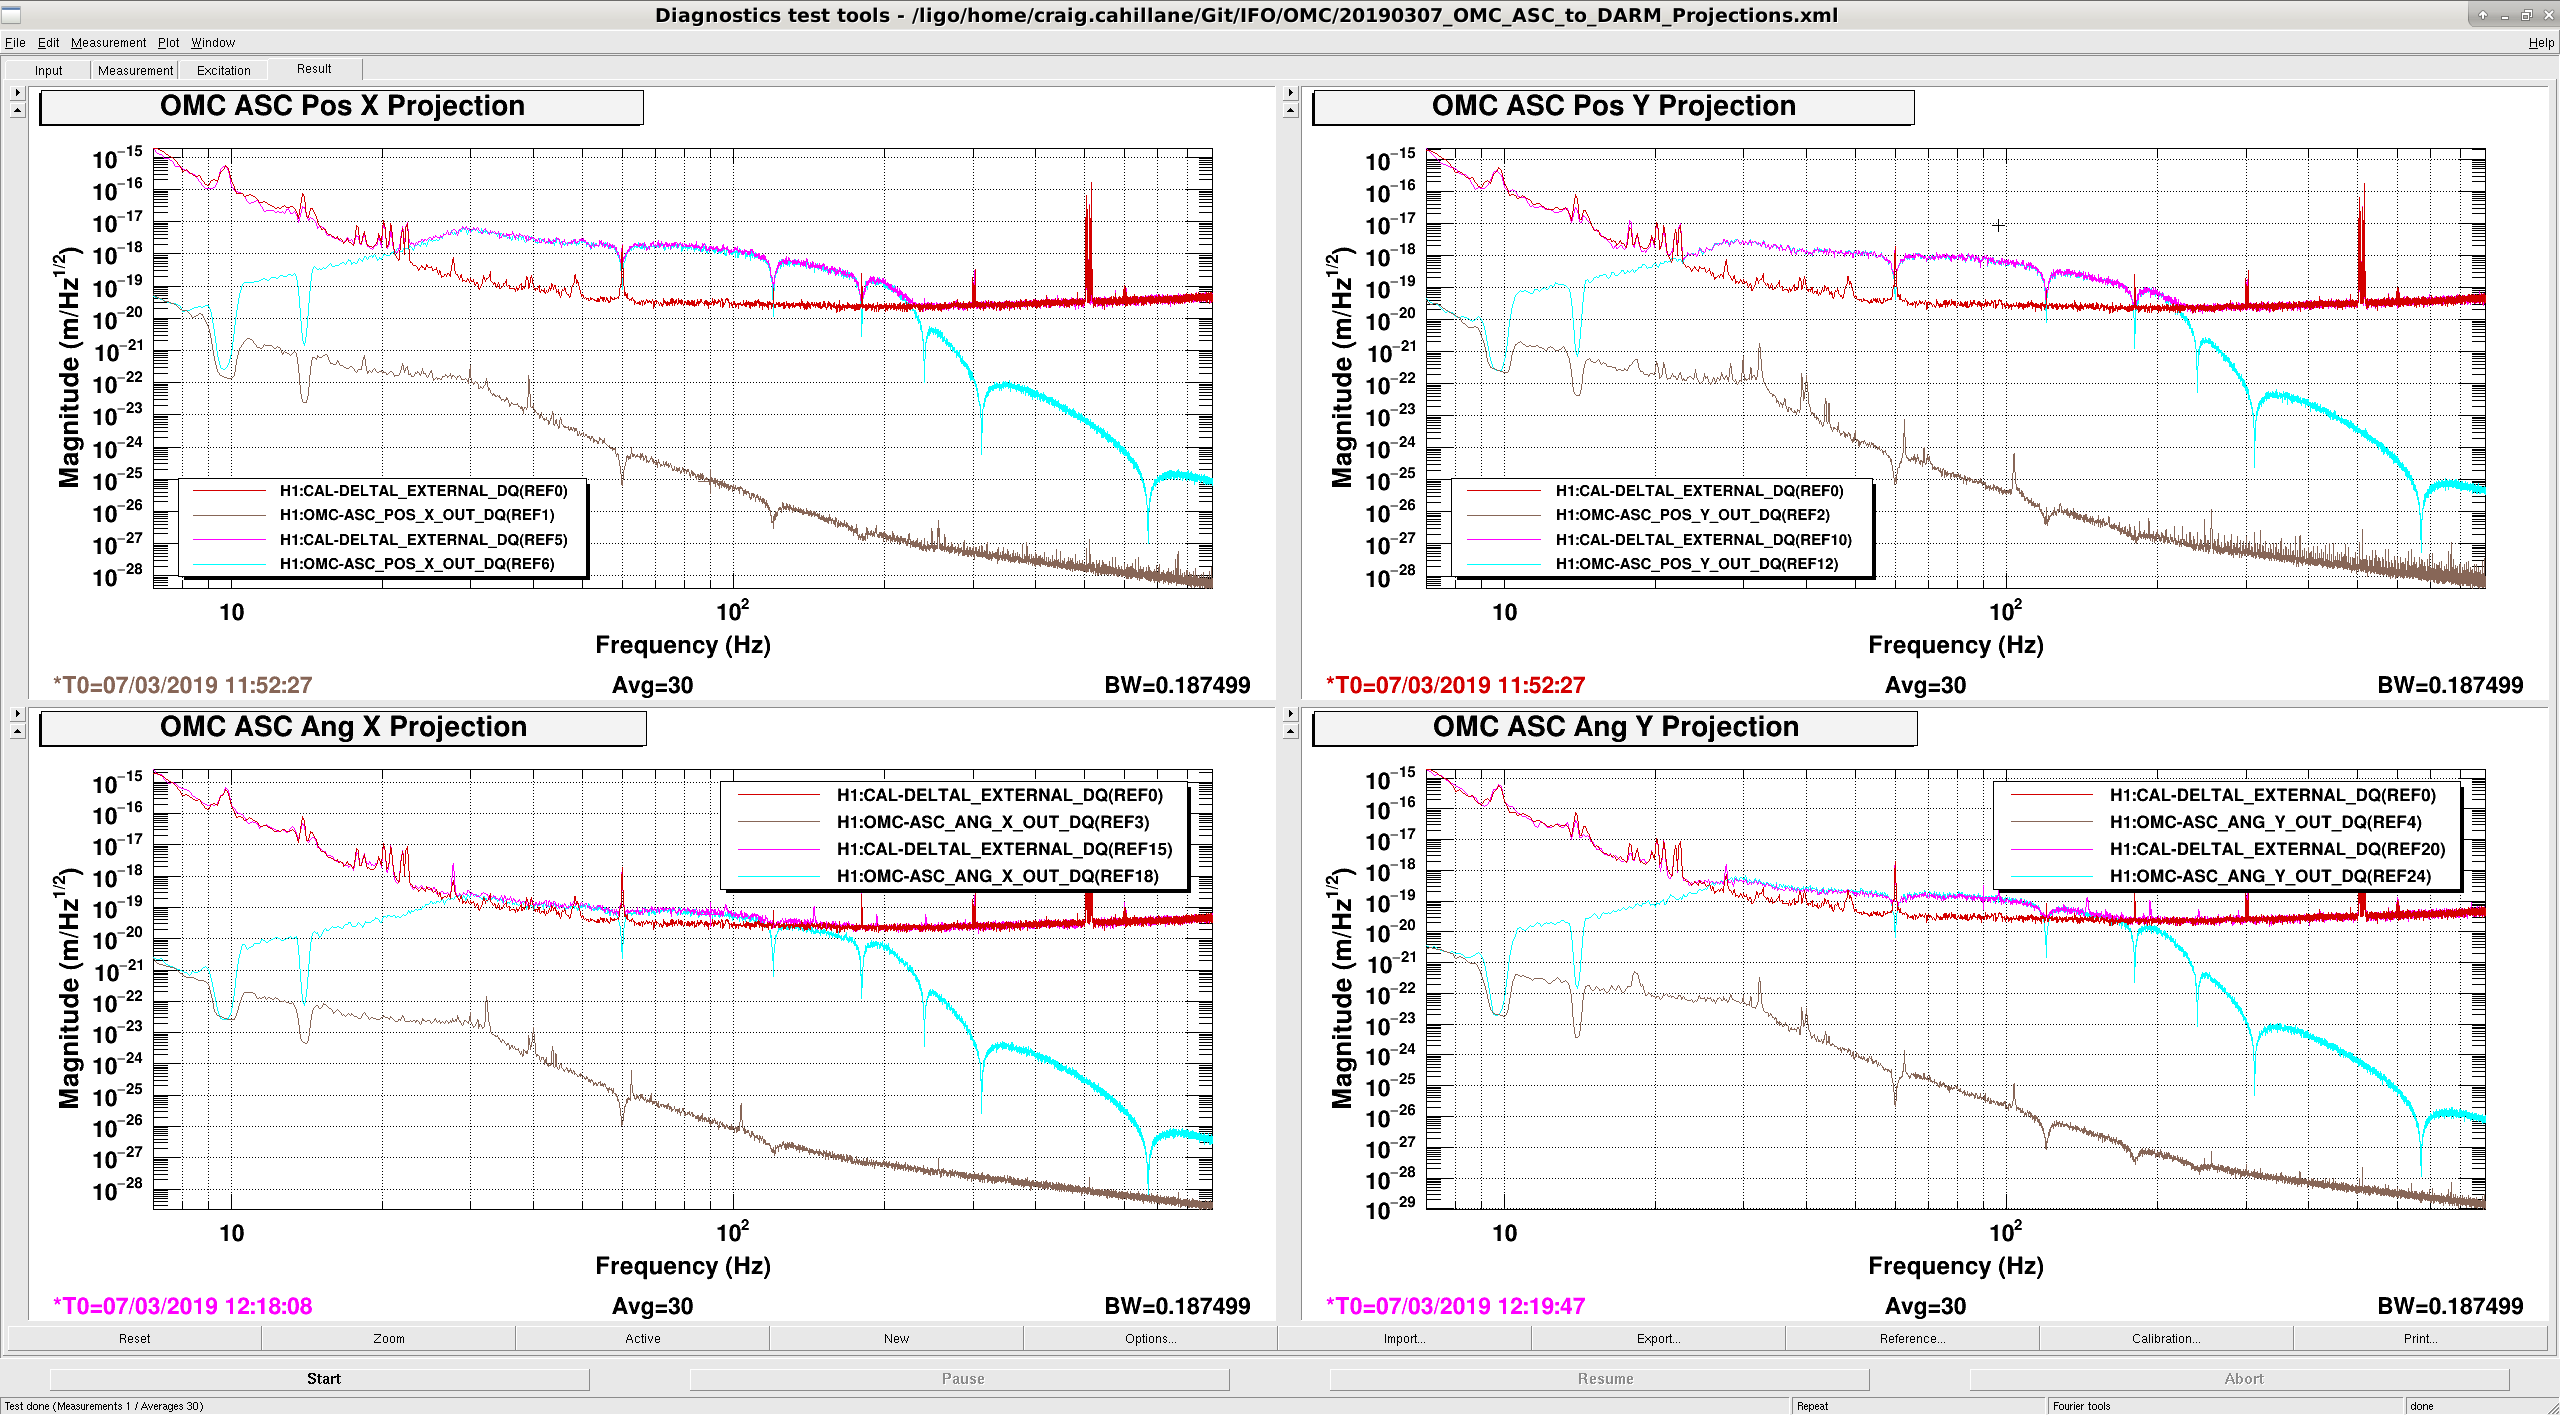
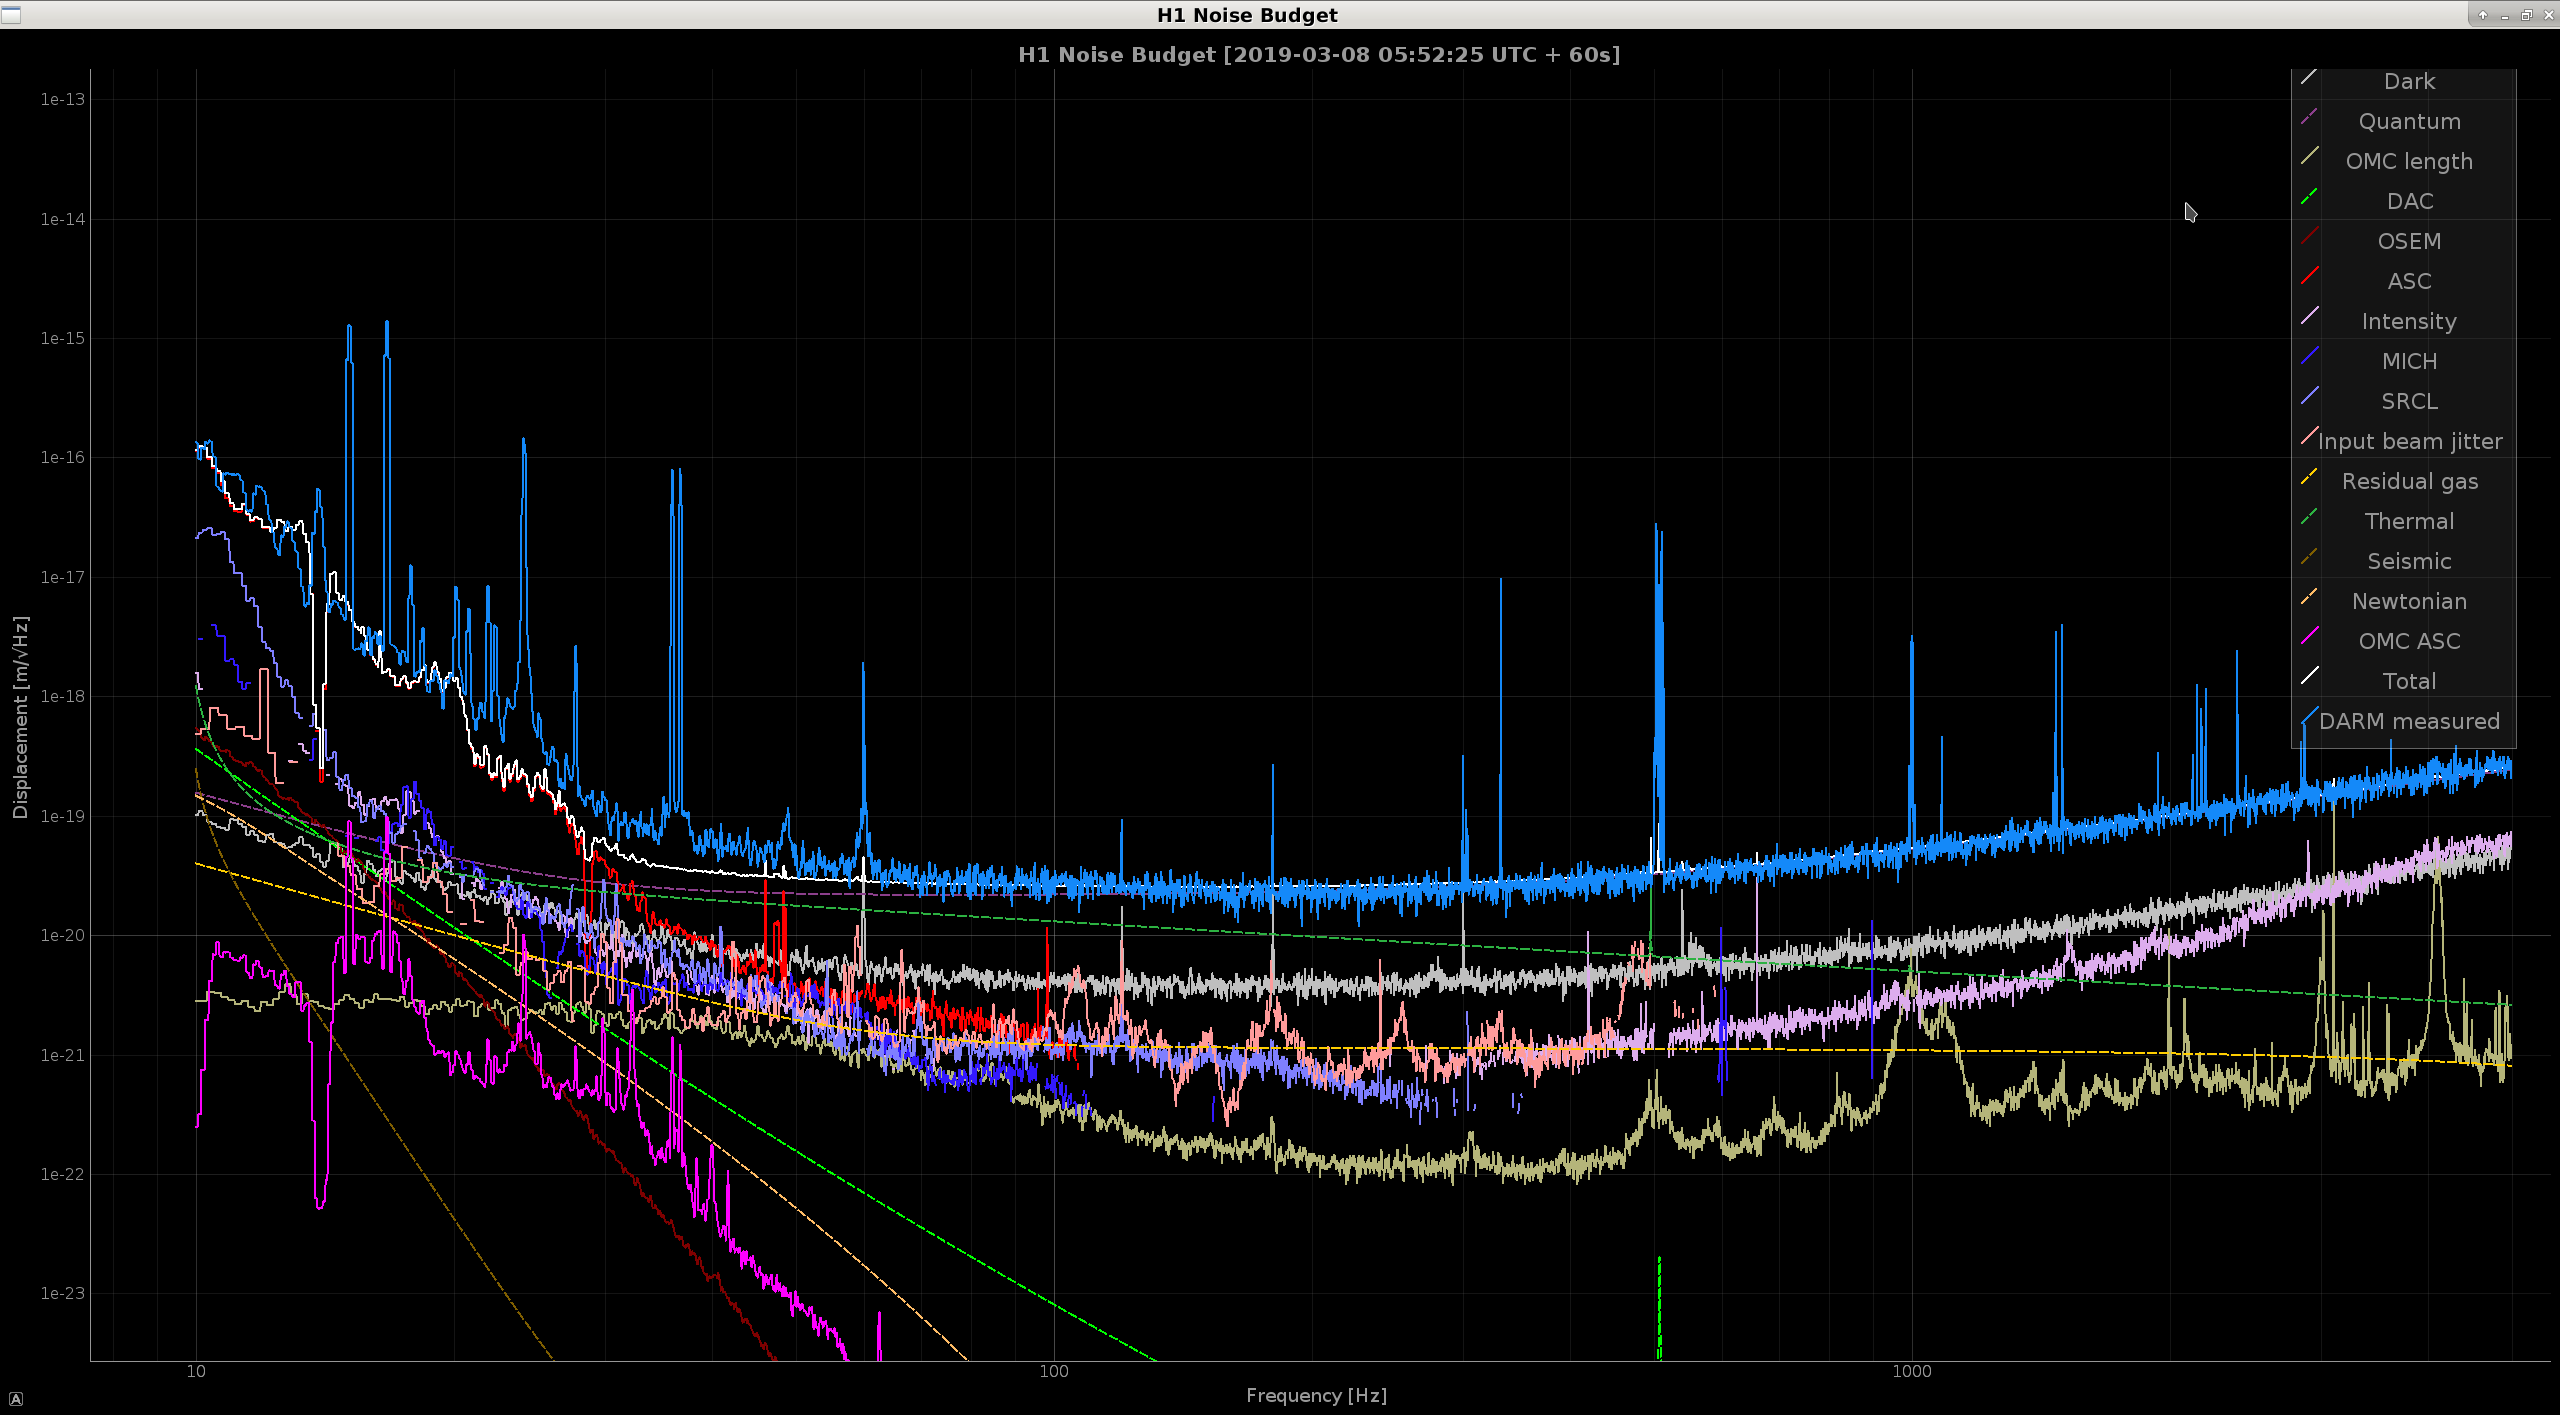
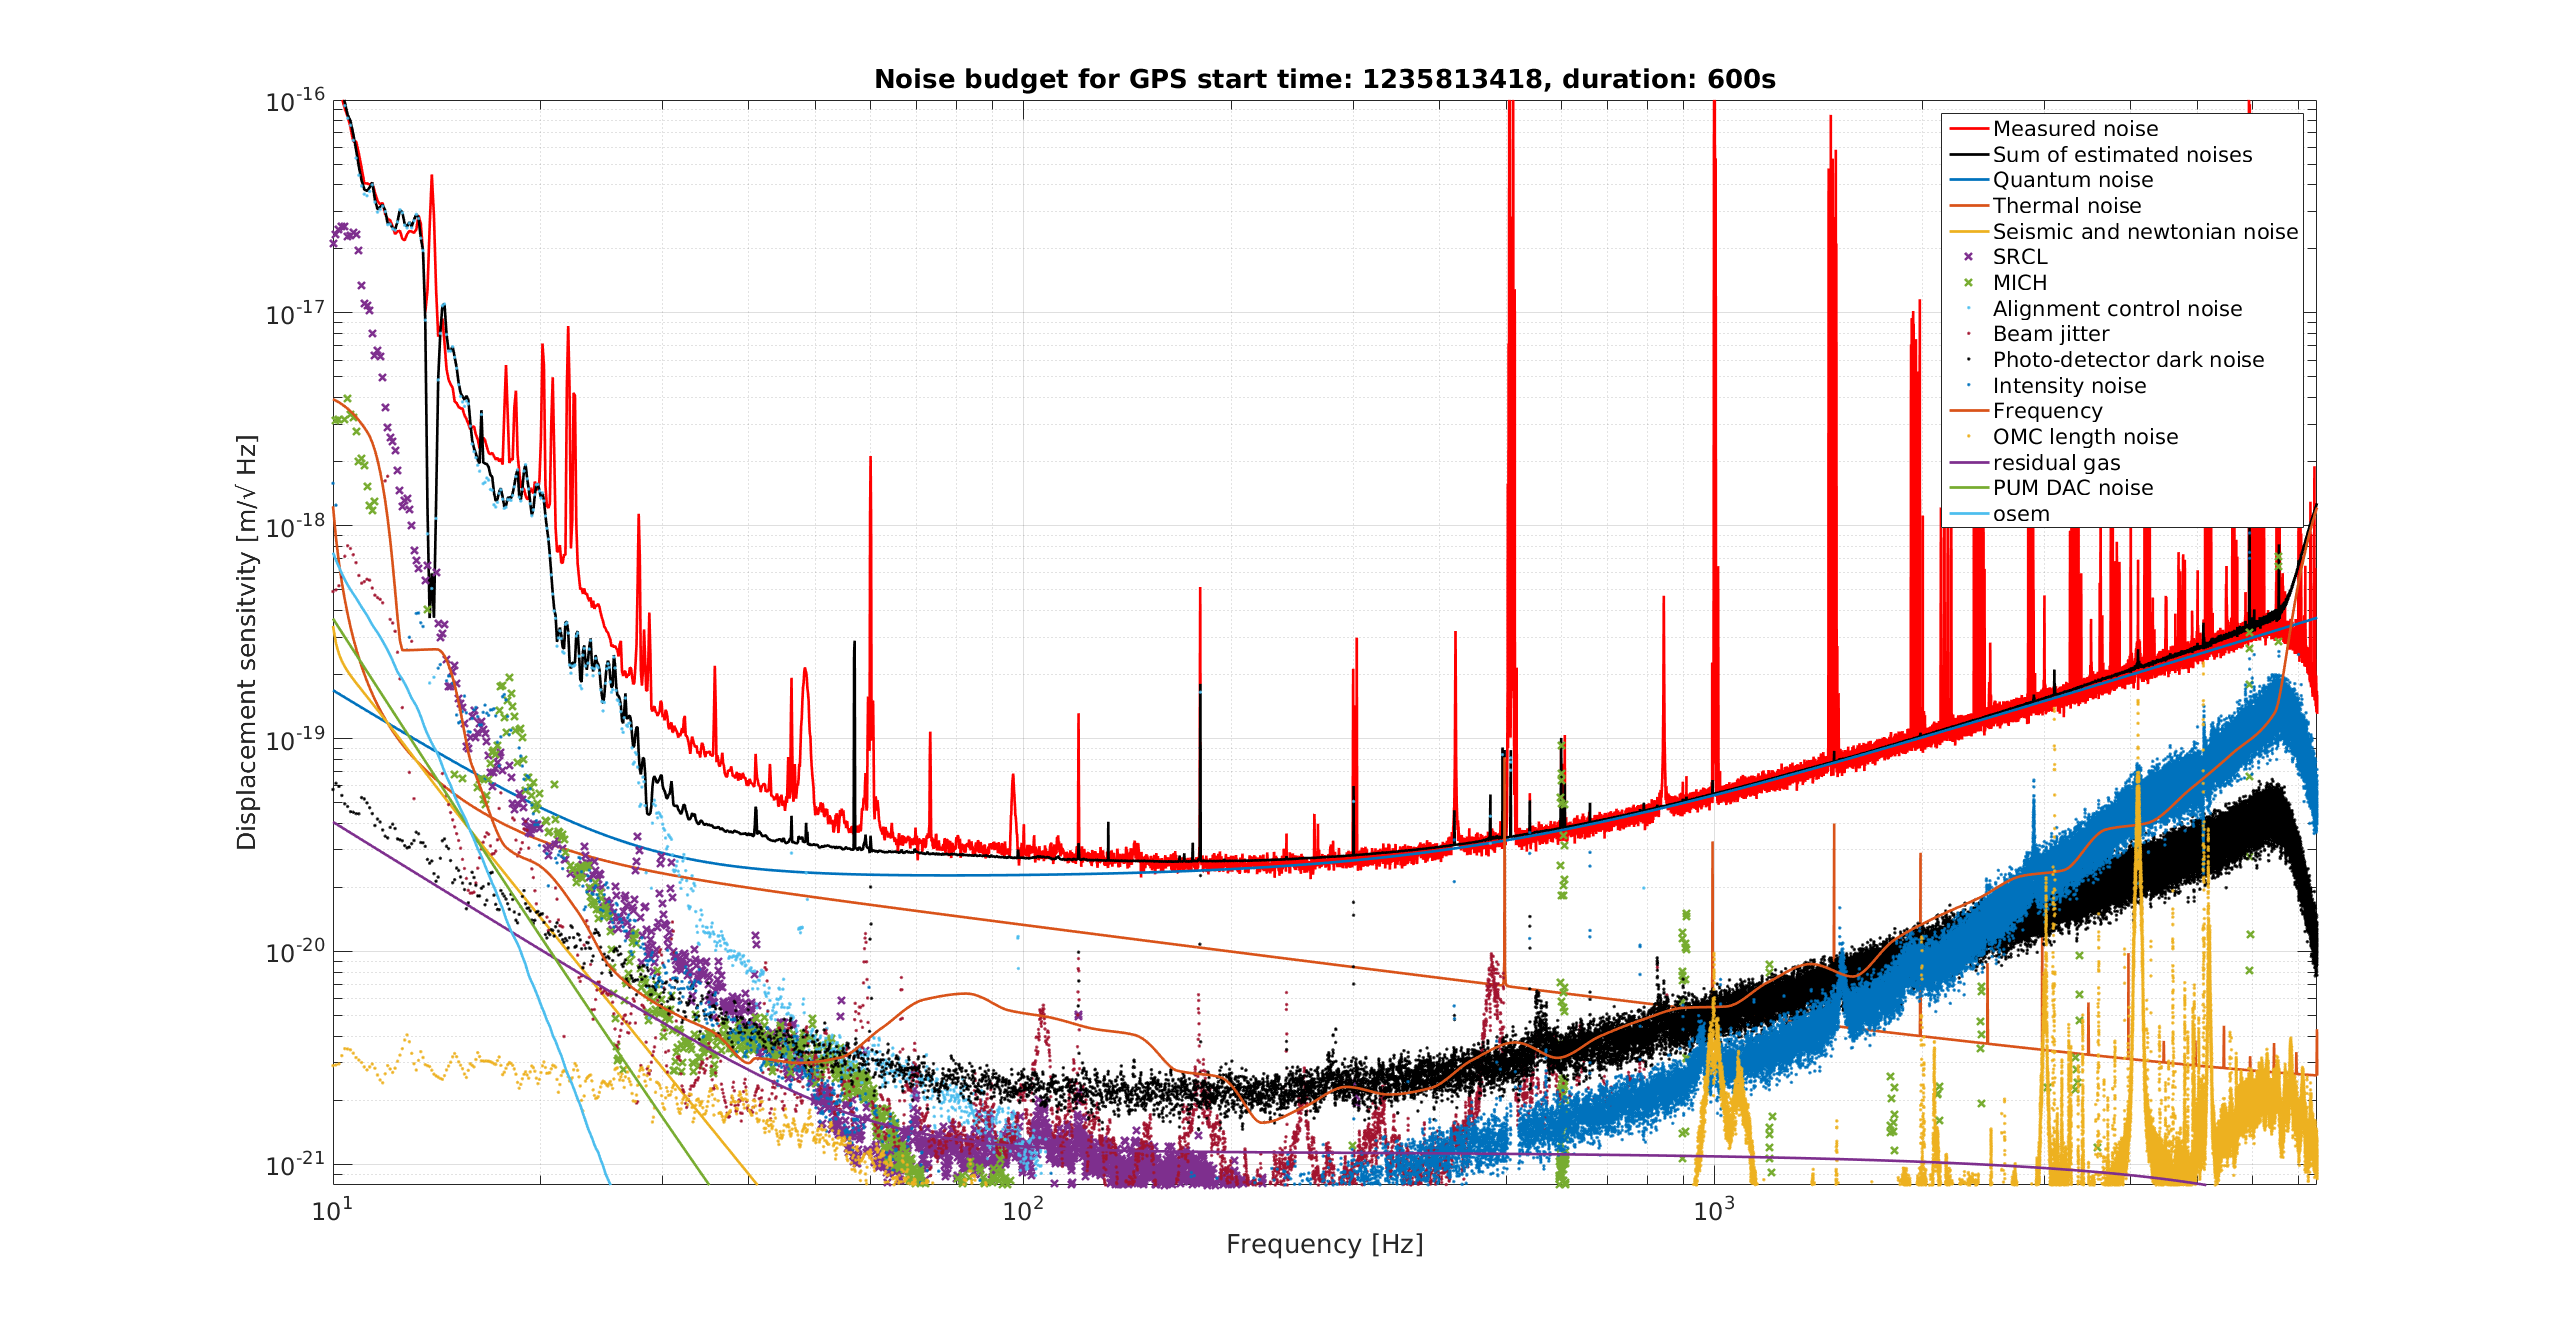
Added the OMC ASC controls noise projections into the live noisebudget. Projections are done by reading in the control signal of each OMC ASC loop (Pos X, Pos Y, Ang X, Ang Y), calibrating the control signal to DARM meters like a simple pendulum zpk during an excitation, then projecting the ambient control signal into DARM noise all the time. Each projection is shown in attachment one. The quadrature sum of each projection (OMC ASC) is shown as the pink curve in the second attachment. With the live noisebudget, we'll be able to tell if OMC ASC controls noise is ever unusually high. cool Problem with the live noisebudget: we cannot yet look at subnoisebudgets. So I cannot look at the four traces that make up OMC ASC in a second plot.
I turned up the gains of ASC-MICH pit and yaw, and gave them each a different lowpass, and was able to get our BNS range up a few Mpcs. I also switched to using a SOFT_P cutoff in both CSOFT and DSOFT with a corner at 10 Hz, rather than 14Hz. These 2 things combined give us about 110 Mpcs.
However, the ASC seemed more delicate in this situation. I'm not sure if it was Keita in the LVEA for DIFF VCO tests (likely not) or a small amount more ground motion, but the IFO wobbled at 0.5 Hz a few times, and then eventually had a ring-up of this frequency and lost lock.
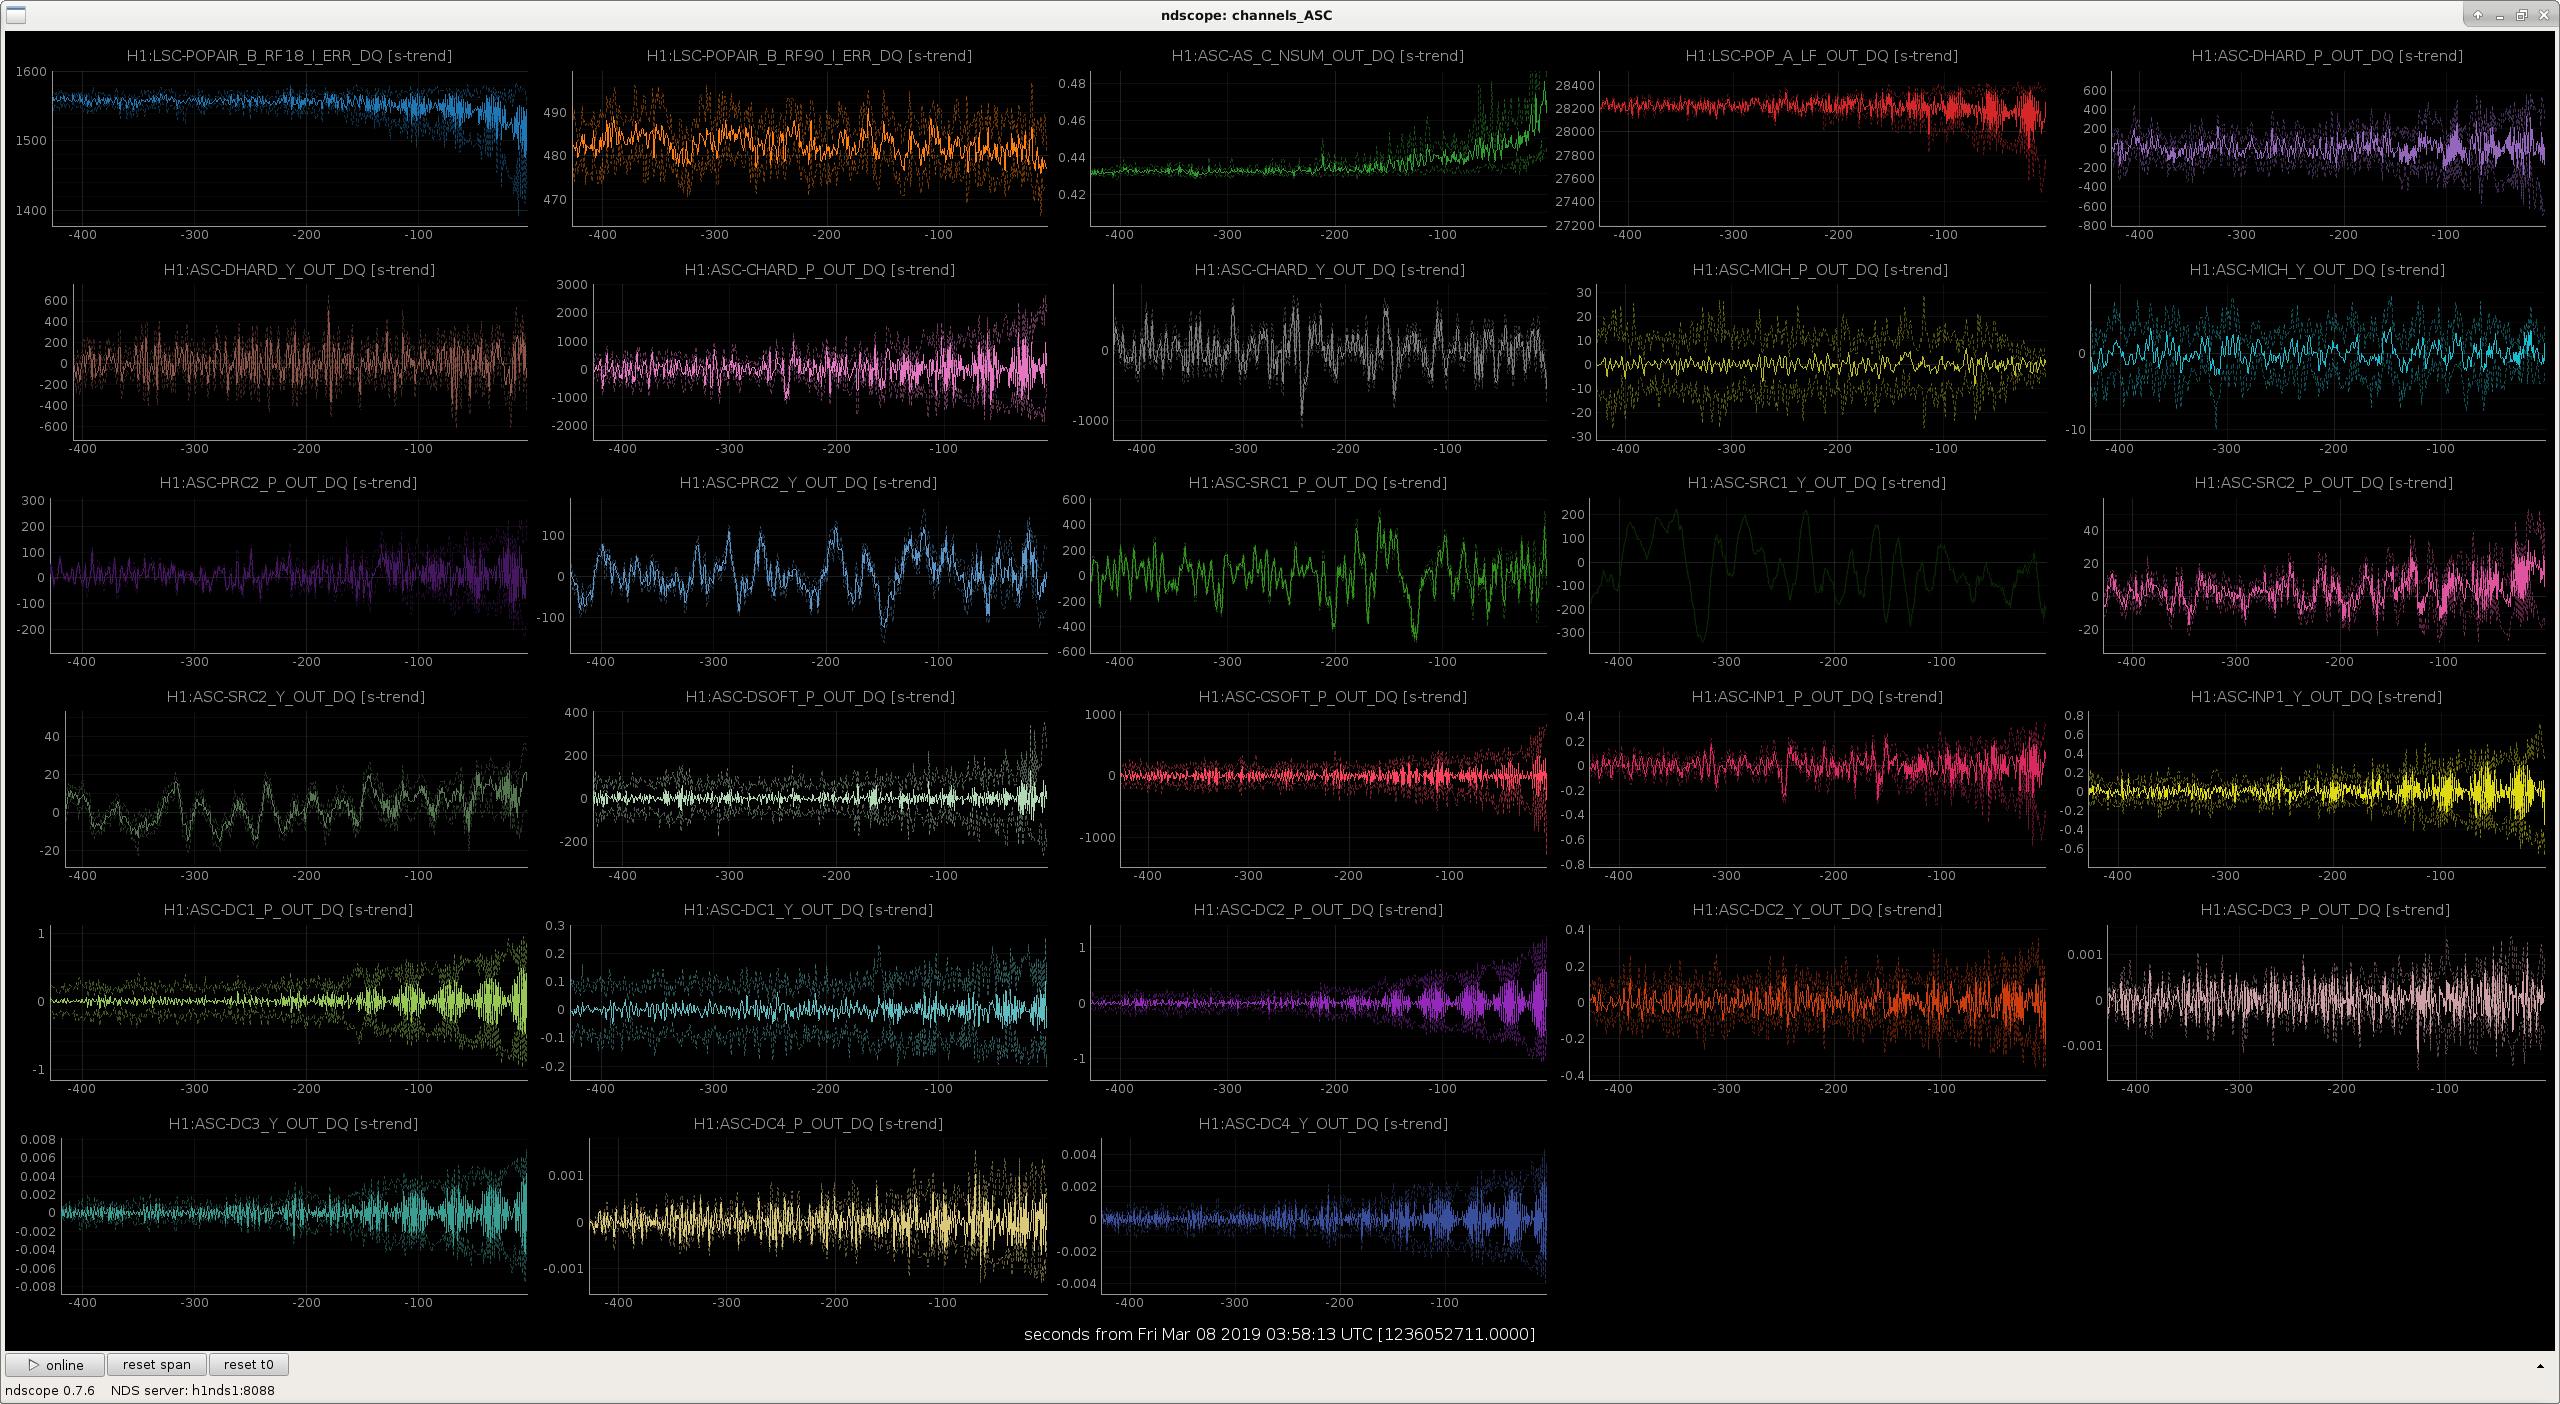
In the attached plot, it seems like INP1, SOFT and the DC centering loops all saw this ring up at roughly the same time, starting a little more than 200 seconds before the lockloss. It's hard to say if it's a pitch or a yaw problem. INP1, DC3 and DC4 see the instability most stronly in yaw, while DC1 and DC2 see it more in pitch. Other loops such as SRC2, DHARD, and CHARD all see the ring-up, but they mostly start later, after it's pretty clear in other degrees of freedom.
(Squeezing was on during this lock)
I've put these changes into the guardian, and they've worked for at least 2 locks so far. So far, the 0.5 Hz instability hasn't come back, although that is mostly luck and low ground motion, more than anything deliberate.
I took a spectrum with no lines (no Cal, no ADS), and we got up to 117 Mpc!
BruCo report available here:
https://ldas-jobs.ligo.caltech.edu/~gabriele.vajente/bruco_lho_1236049000/
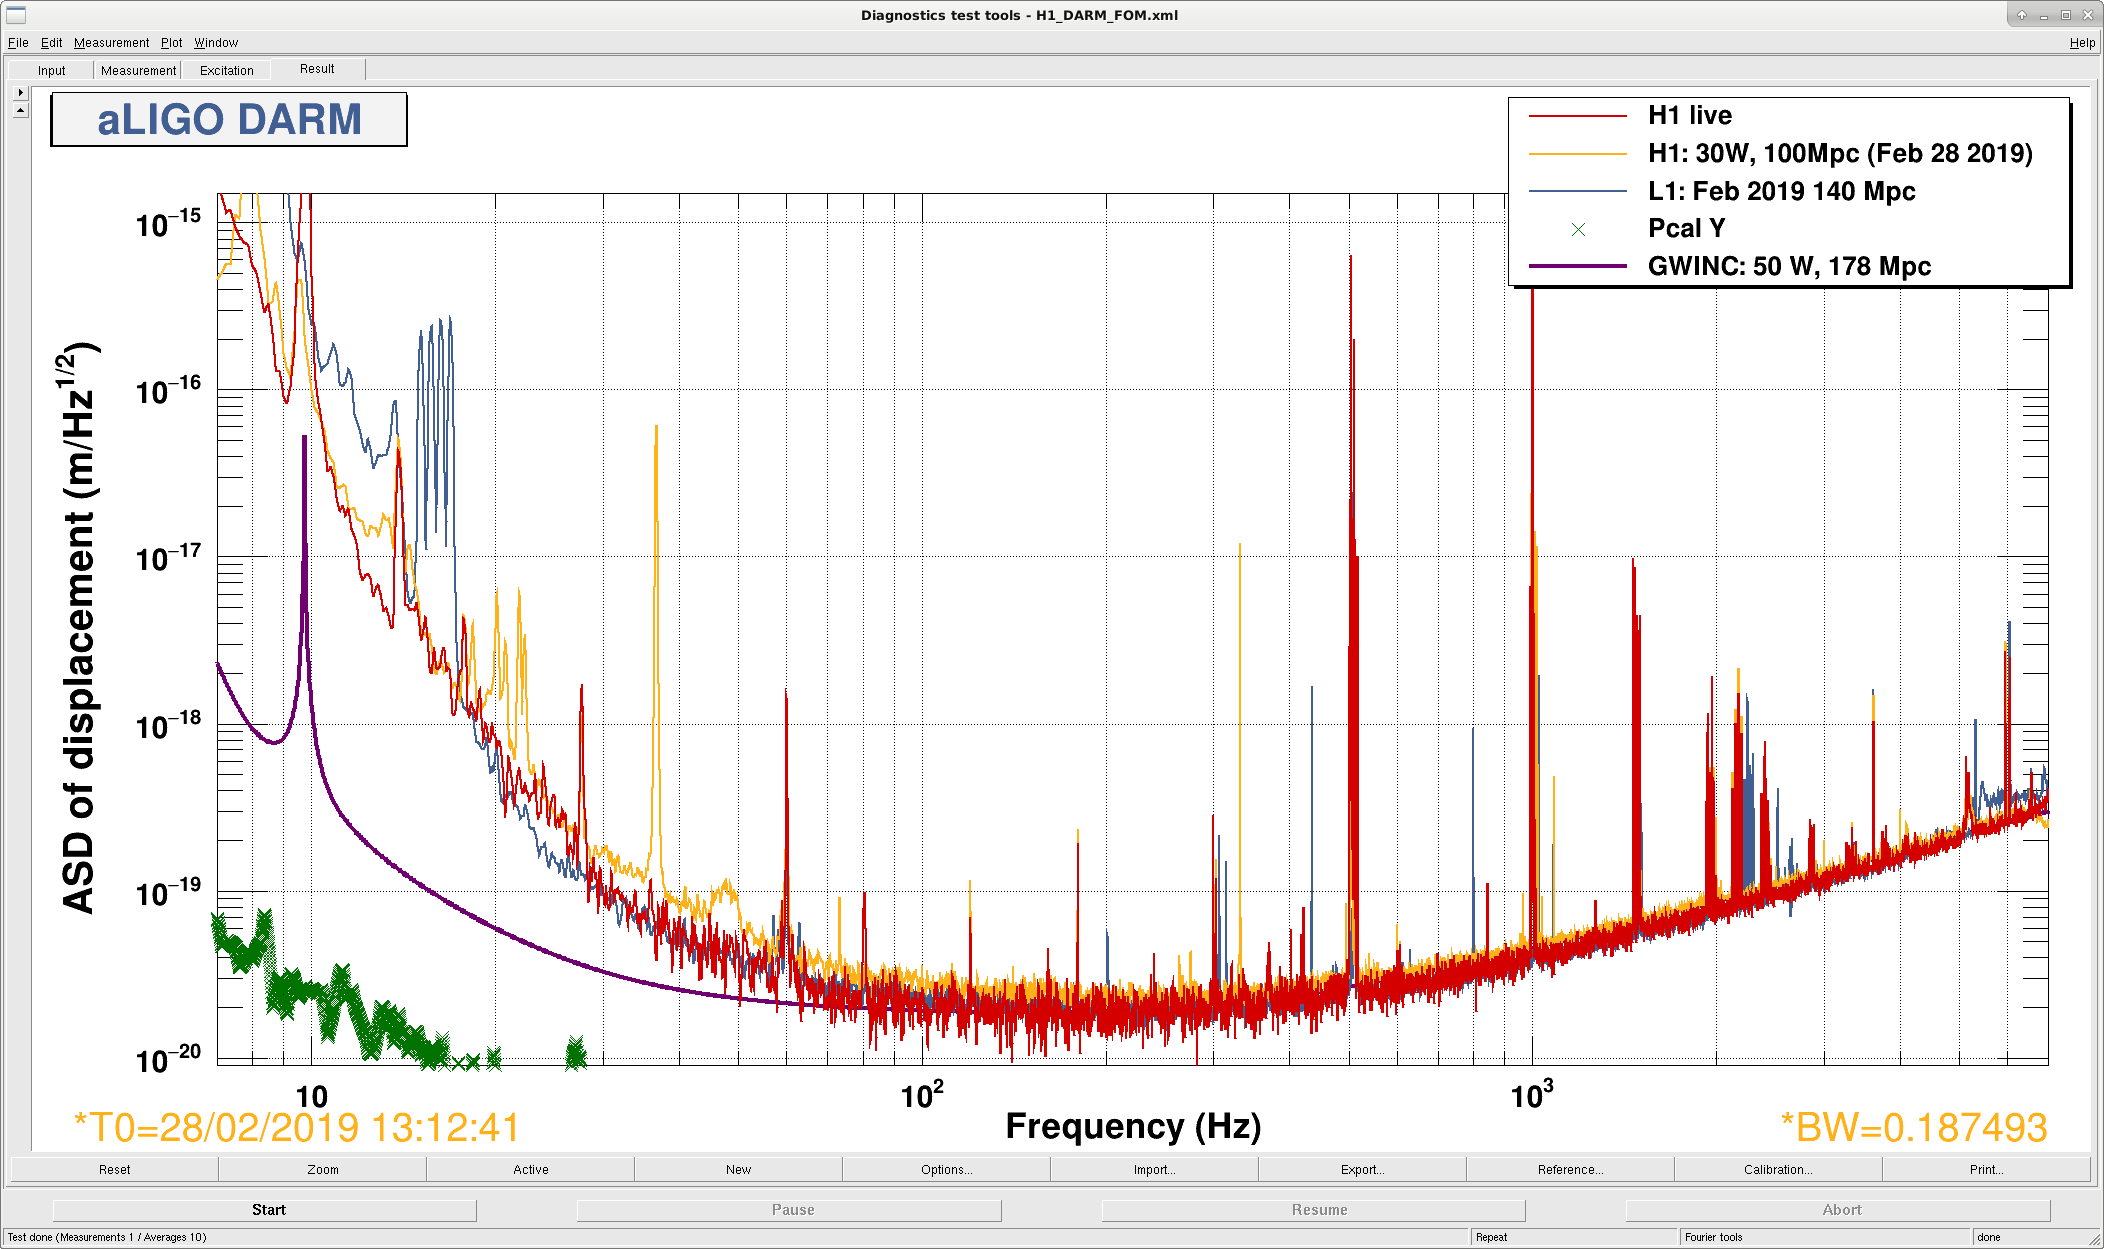
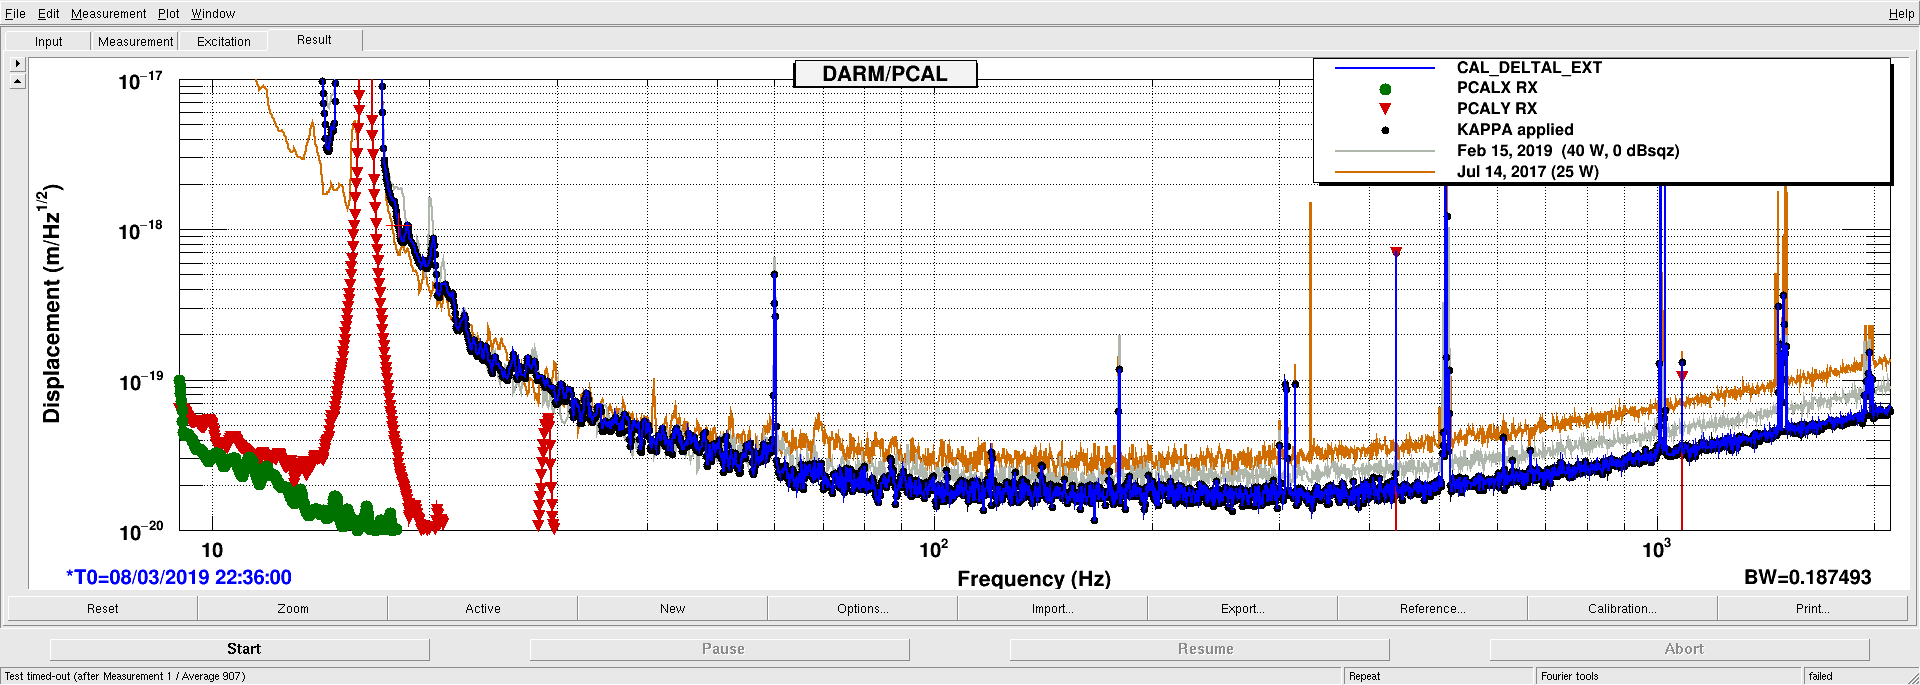
During the Friday commissioning meeting several of us were wondering how H1 with 30 W and 2 dB sqz have the same shot noise as L1 with 40 W and 3 dB sqz. I believe that the L1 curve shown in H1_DARM_FOM has low squeezing. The shot noise at 1 kHz is shown to be ~4e-20 m/rtHz. The attached plot shows a typical L1 noise curve with 40 W and ~3 dB sqz. The shot noise at 1 kHz is closer to ~3e-20 m/rtHz as one would expect from the factor ~sqrt(30/40)*10^-0.05=0.77. The L1 40 W 0dB sqz spectrum is also shown.
After Peter and I powered off the DBB, I ran PeterF's script to see whistles.
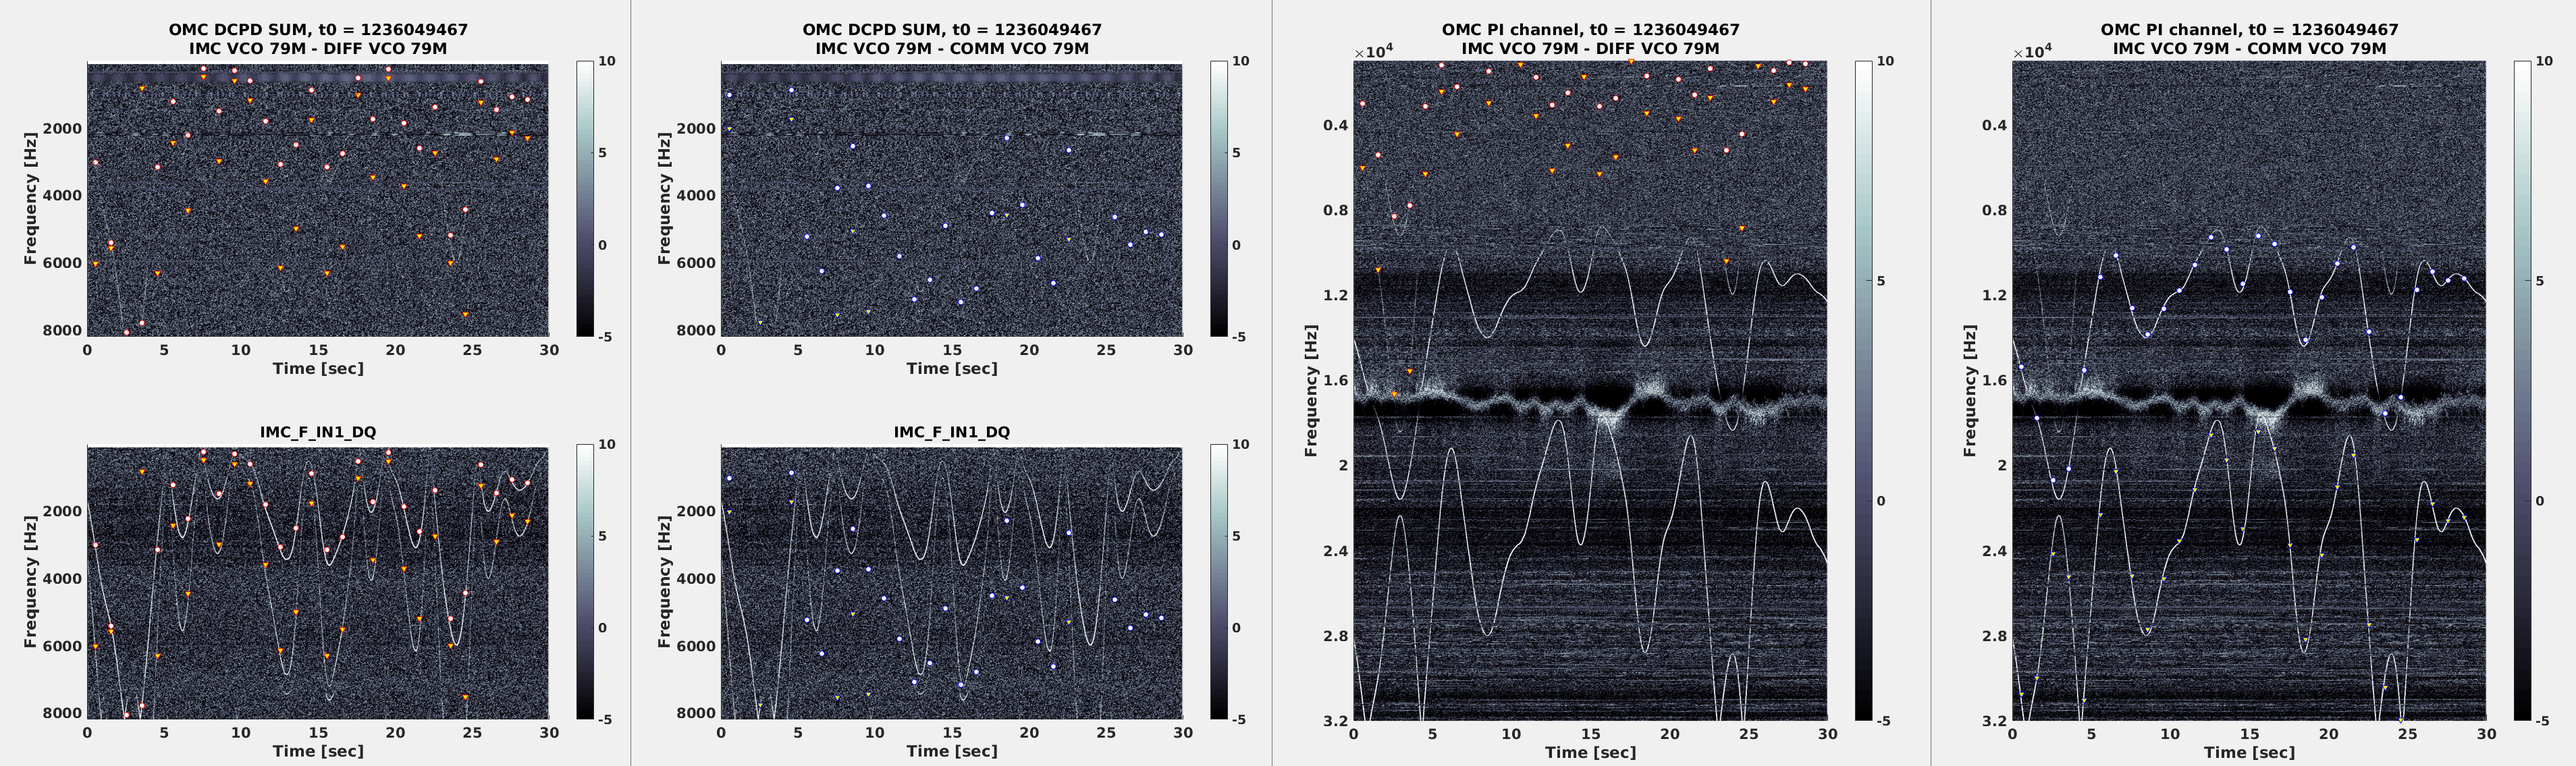
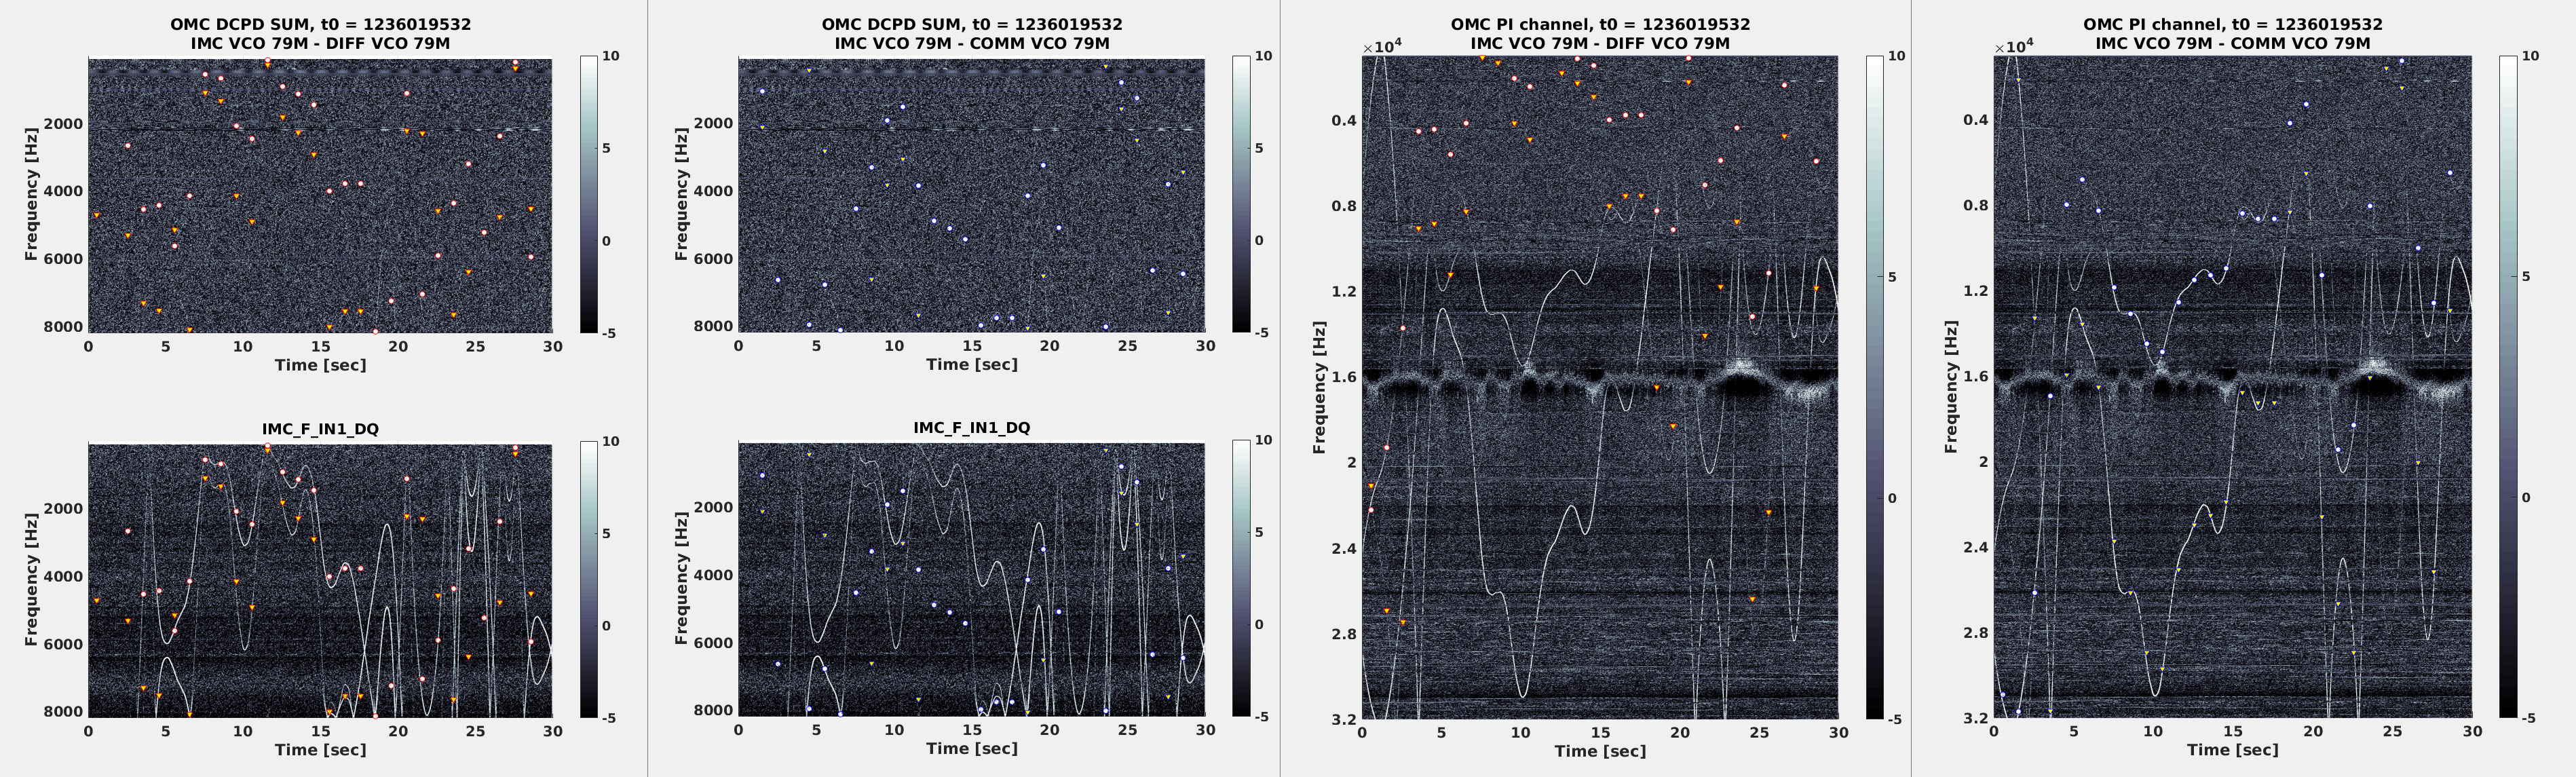
Probably because IFO noise was good, I was able to clearly see whistles in DCPD that correspond to the difference betwee IMC VCO and DIFF.
In the plots attached, white circles are the difference of the fundamental frequency of IMC VCO and diff VCO, yellow triangles are second harmonics.
There are visually apparent whistles in DCPD (leftmost top, 0-4 sec, 23-24 sec between 4000 and 6000Hz) and they agree pretty well with the fundamental of IMC-DIFF. There are less apparent whistles (12-13 sec between 2000 and 4000Hz, 15-16 sec between 2000 and 4000Hz) and they also agree with the fundamental of IMC-DIFF.
All visually apparent whistles in OMC PI channel (there are four such whistle traces) seem to agree well with fundamental and second harmonics of IMC-DIFF and IMC-COMM.
I went to the floor and started powering off the DIFF VCO, it was a paint to disconnect power connector from the back, and IFO lost lock (ASC instability?) about 80 second before I successfully removed both 17V and 24V connector.
It's not clear if turning DBB off did anything as far as whistles go. At first I thought whistle traces got simpler, but if you look at the plot before DBB was turned off, the number of apparent whistles in OMC PI channel was four, so no change there.
And attached is when it was really ugly.
https://alog.ligo-wa.caltech.edu/aLOG/index.php?callRep=47188
At that time IMC VCO was at a different frequency and I couldn't find anything that comes close to this. That one is still a mystery. (That's why I initially got suspicious about DBB locking oscillator.)
Why? There are 2 switches on the front panel to power off the RF sections...
Oops, will use that feature next time!
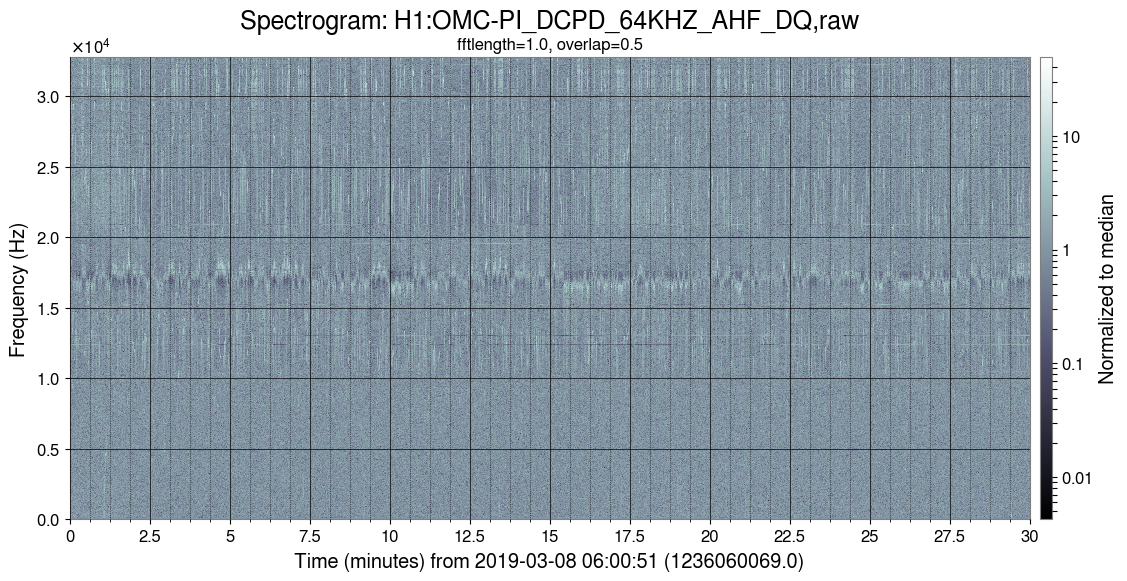
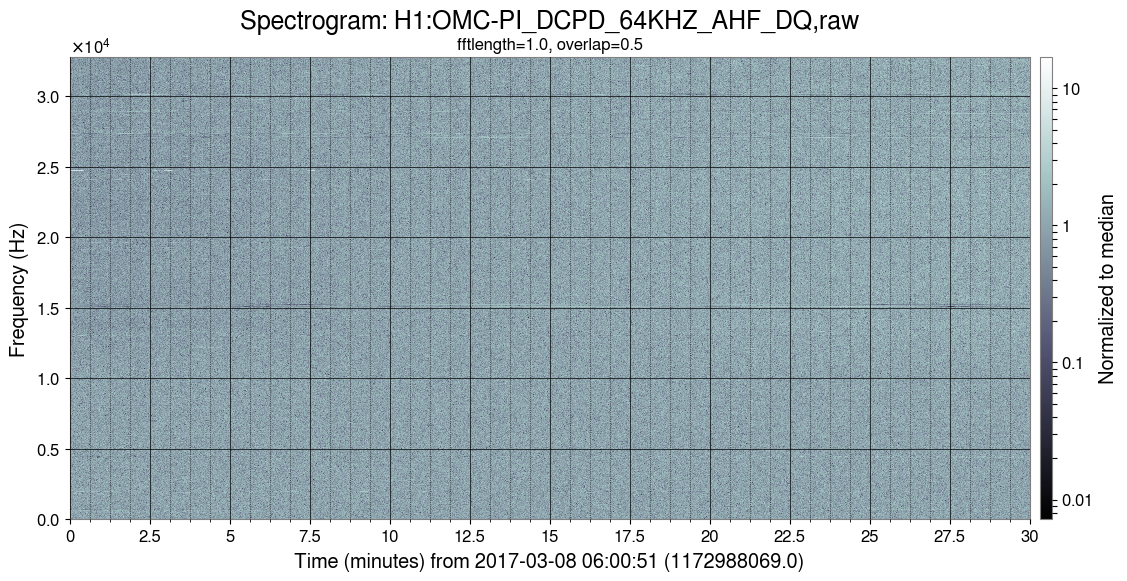
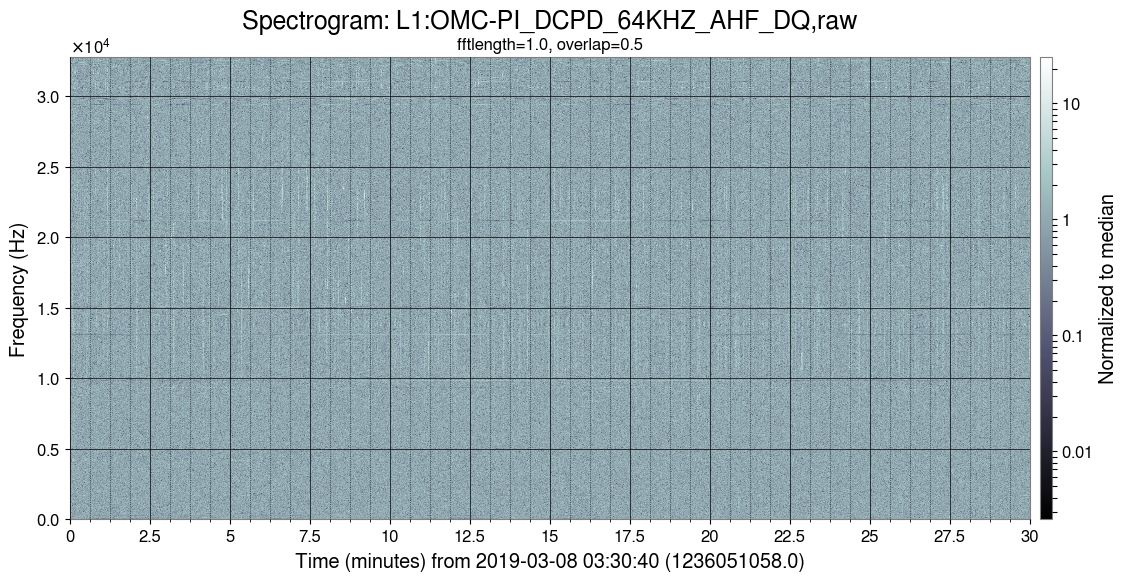
A note on the 15-20kHz feature (first figure) in OMCPI channel. This was not there in the past ( 2017 March second figure), and is not present at Livingston (third figure).
I noticed that DBB interface was on, PeterK and I went to the floor to turn it off.
For locking DBB PMC, it uses a 1MHz oscillator of some sort (probably just a canned crystal). The oscillator is ON all the time even when modulation is disabled as far as it is powered but its frequency is not monitored.
I think the oscillator is from auris, part number O-1.000000M-AQO 14-50-5.0-A. It's a little difficult to tell from the schematics.
J. Kissel I've process Craig's sensing function from last night (LHO aLOG 47354), in which he states, the data lives here: 2019-03-07_H1DARM_OLGTF_5to1100Hz_20min.xml 2019-03-07_H1_PCAL2DARM_TF_5t1100Hz_8min.xml I had to finagle the exported data a bit -- the PCAL to DARM TF result appears to have 1 less frequency point (at ~5 Hz) than the DARM OLG TF result, so I just stripped the DARM OLG TF data of that frequency point. Also, there seems to have been a data point with coherence of identically zero which confused the data processing software, so I modified it to be some small non zero value. The comparison of model to measurement is attached. The numerical answers are Optical gain, H_c (ct/m) | 3.426e+06 (+1799,-2153) or (+0.0525%,-0.06285%) Optical gain, H_c (mA/pm) | 4.236 (+0.002224,-0.002662) or (+0.0525%,-0.06285%) Cavity pole, f_cc (Hz) | 394.6 (+1.418,-1.17) or (+0.3594%,-0.2965%) Detuned SRC spring frequency, f_s (Hz) | 2.353 (+0.06679,-0.08249) or (+2.839%,-3.506%) Detuned SRC spring quality factor, Q_s | 0.01186 (+0.003069,-0.001373) or (+25.87%,-11.58%) Residual time delay, tau_c (usec) | -0.4223 (+0.9933,-0.8277) or (+-235.2%,--196%) The systematic error above ~100 Hz is great -- likely attributed to Stefan's good work compensating the DCPDs (LHO aLOG 47257) and some further good results from fitting the high frequency poles of the OMC DCPD whitening chassis by Lilli (see LHO aLOG 47377). Impressively, the residual time delay (which can be either real unknown delay, or uncompensated high frequency poles) is consistent with zero, within 1 [us]. Low frequency is still a problem -- at the 5% level below 20 Hz, with a 1% wiggle around 80-100 Hz. The good news is -- due to my template tuning (mentioned at the tail end of LHO aLOG 47206), we're now able to resolve some of our detuning again -- and the message is, we definitely have it. given the wiggle at ~90 Hz, I'm wondering if we're on the opposite side of the SRC detuning such that we're seeing pro-spring -- so much so that the ~90Hz wiggle may be the right-half plane poles not perfectly canceling the left real zero, that normal reduce to a single pole frequency when the RSE detuning phase is very close to 90 deg (see discussion of this effect in P1600295, Section 5.2). I'd like more data with more dense frequency points around 90 Hz and between 20 and 8 Hz to really make conclusive statements about all this, but the message is that the "simple" O2 model of the detuning is failing to replicate the features seen in this plant below 100 Hz -- at the 5% level below 20 Hz. Most of you will argue this level of systematic error is "good enough" for the sensing function. If you insist, then populate the CAL-CS_DARM_ERR filter (preferably in new pair of filter banks, please) with the following two filter modules. SRCD2N: zpk([394.6064;2.3389;-2.3668],[0.1;0.1;7000],1,"n")gain(553.54) Gain: gain(2.919e-07) and set the CAL-CS_DARM_ERR gain to 1.0. Since Craig updated the CAL-CS gains on the actuator paths (LHO aLOG 47354) with the numbers from LHO aLOG 47331 (which I argued were good on TST, but still bad on PUM), then we can also run and process the DARM Open Loop gain measurement against the model, and predict the level of systematic error that would remain if we updated the sensing function as above. See that result attached second. Unsurprisingy, the residual systematic error looks exactly the residual systematic error in the PUM stage reported in LHO aLOG 47331. However, the flaws are are all below 30 Hz. So theoretically, this he above sensing function is pushed, we should have little-to-no remaining systematic error above that frequency region. And one more thing -- you'll have to update the delay between the sensing and actuation paths to 7.0 clock cycles. See that result attached 3rd. This is consistent with what we've used for O1 (LHO aLOG 22117) and O2 (LHO aLOG 33924). The real delay is 6.89 [16kHz clock cycles], and the difference shouldn't result in that much systematic error. I haven't yet had the time to figure out the Joe Betz / Shivaraj generation of a thiran filter (see hints at LLO aLOG 28268) that allows for non-integer delays.
Processing script / function debrief:
The model parameters associated with this data set is
^/trunk/Runs/O3/H1/params/modelparams_H1_20190301.py
The script to process the sensing function measurement is
^/trunk/Runs/O3/H1/Scripts/FullIFOSensingTFs/process_sensingmeas_20190307.py
The script to compare the DARM OLG TF against the model is
^/trunk/Runs/O3/H1/Scripts/DARMOLGTFs/process_darmolg_20190307.py
The script to report the delay between A and C is
^/trunk/Runs/O3/H1/Scripts/CALCS_FE/compute_relativedelay_AvsC_20190307.py
I'm using the latest version of the pyDARM code, which (now committed) is
^/trunk/Common/pyDARM/src/sensing.py Last Changed Rev: 6824
^/trunk/Common/pyDARM/src/actuation.py Last Changed Rev: 6796
^/trunk/Common/pyDARM/src/computeDARM.py Last Changed Rev: 6788
Current repo version -- Revision: 6813
(If you're on the LHO workstations, the home check out the repo is in "^" = /ligo/svncommon/CalSVN/aligocalibration/)
Calibration good to 8% with changes above and tuning using the PCAL BB injection. We are probably slightly overestimating range, which is now reported as 102 Mpc without squeezing. Phasing between PUM and TST acutation stages is wrong, probably causing the humps in the calibration. PUM and TST crossover is 30 Hz, according to this.
Georgia, Craig, Danny, Sheila
Here are some updated noise budget plots, made for 9:30 UTC March 5th, when there was no squeezing injected.
Some notes:
Dan, Craig, Georgia
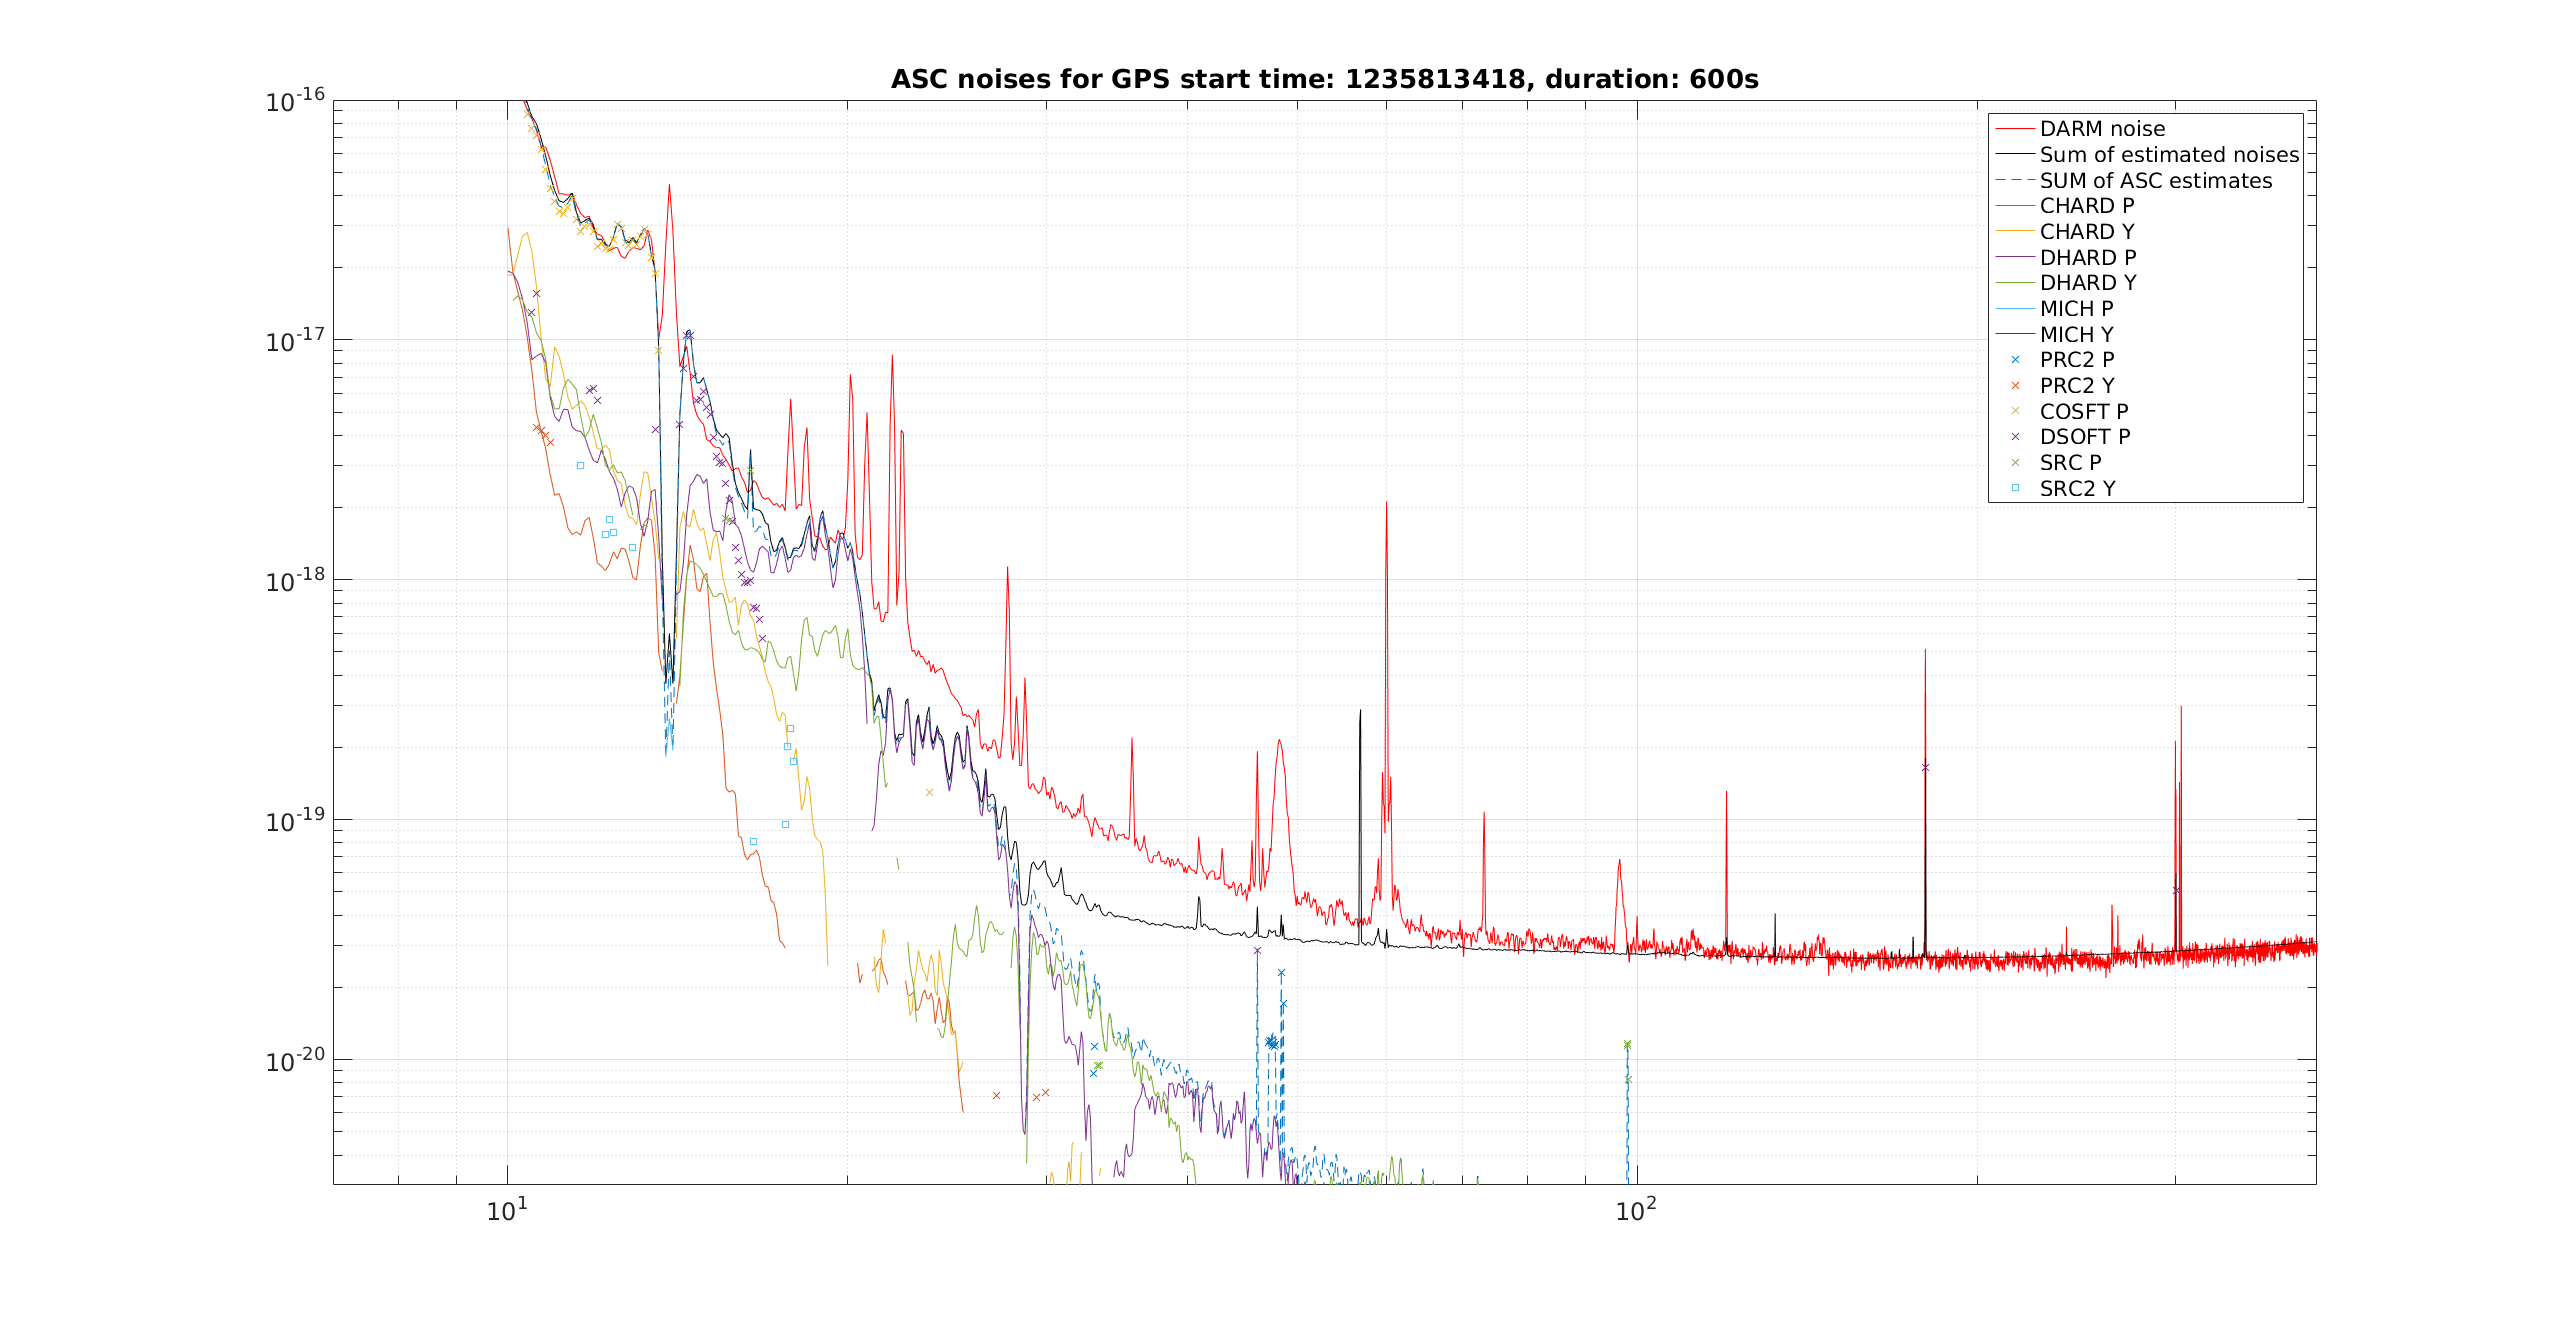
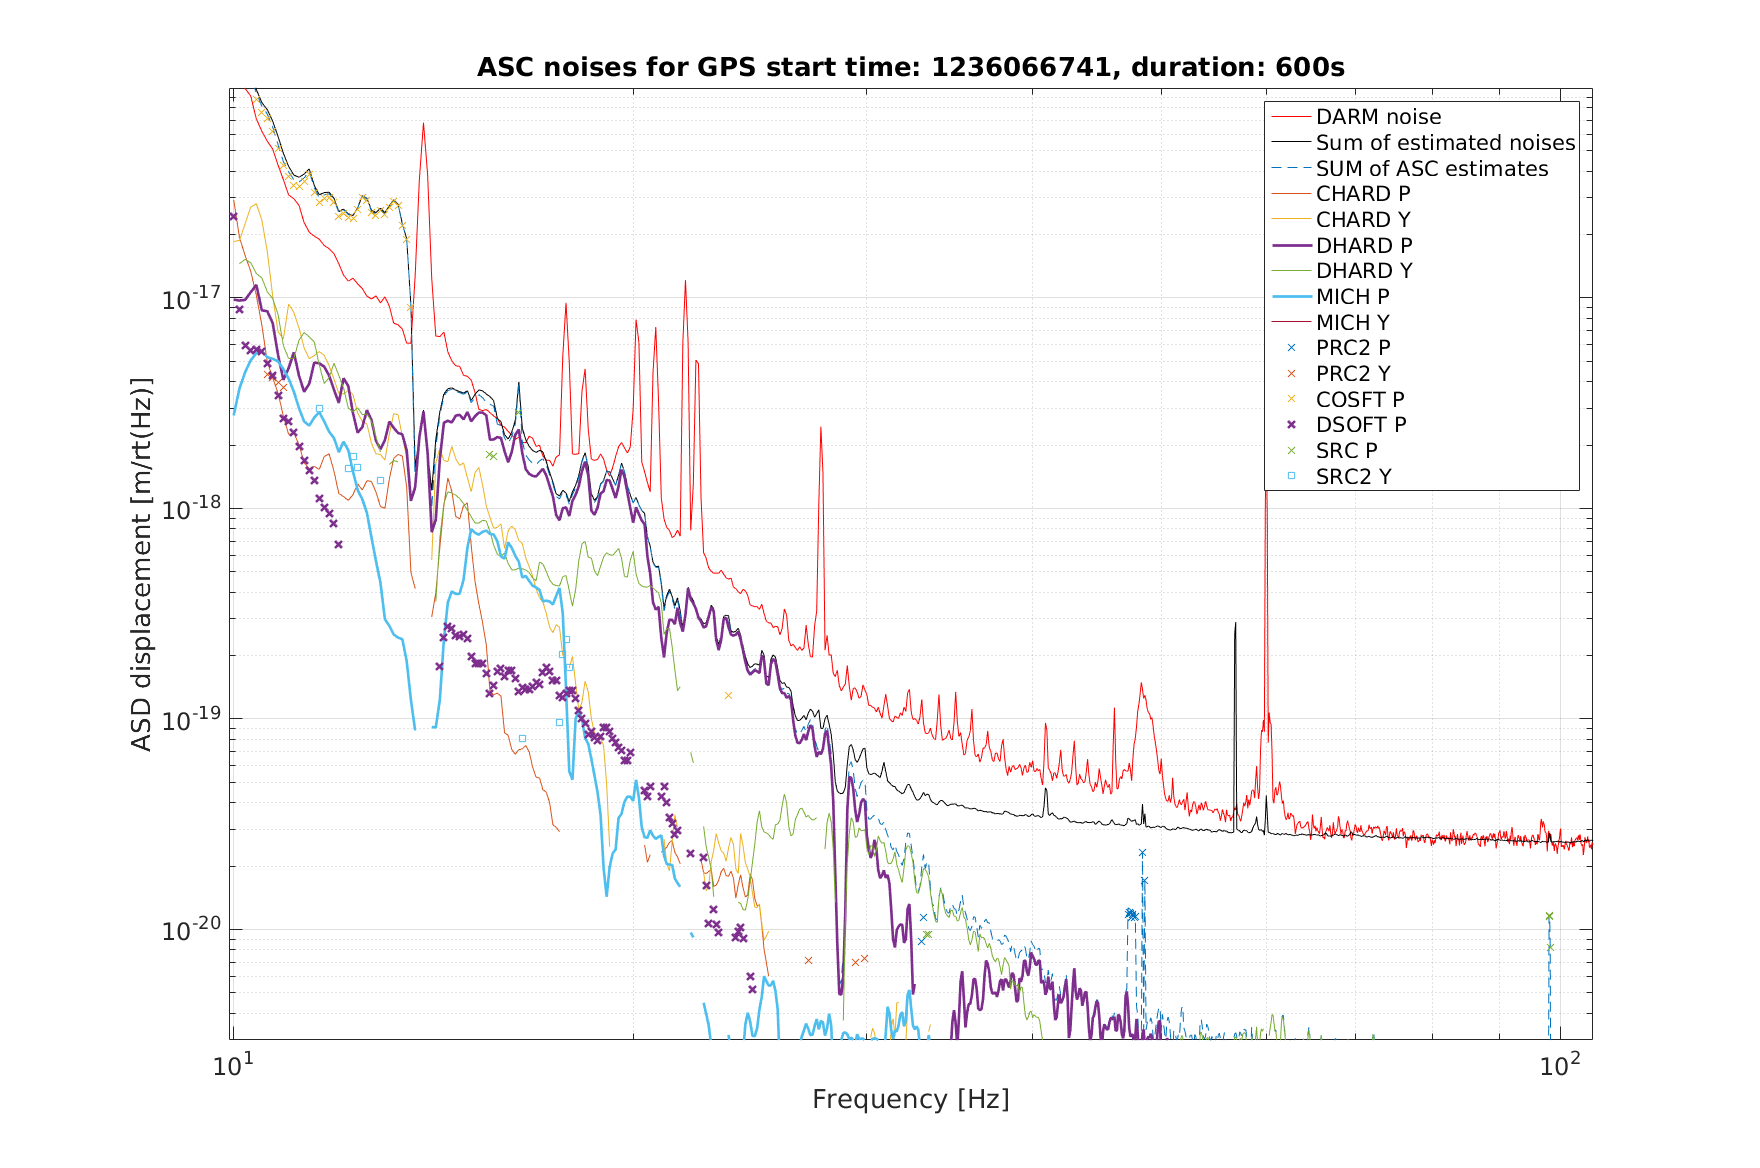
We git-committed the noise budget templates used here, and have rerun the noise budget templates for MICH_P, DHARD_P, DSOFT_P (increased the excitation by a factor of 30 to make it visible in DARM). We still need to re-run the CSOFT_P template to make the ASC contribution to the noise budget up-to-date. We have added DC centering loop templates to the folder however the excitation level needs to be tuned.
A preliminary look at the ASC budget, with the old CSOFT_P measurement, (attached figure) shows we've won a in the <15 Hz region, and we still have some sensitivity to gain by improving DHARD.
Dan, Danny, Alexi
To include the DC centering in the noise budget we excited the DC1 and DC2 pitch and yaw centering loops and DC3 yaw. It took large amplitudes for us to see coherence in DARM that was mainly below 10 Hz.
We also injected into the SRC1 yaw excitation point and didn't seem to see anything in DARM even with large amplitudes.
Not sure if we are doing this right. Might be worth revisiting. We have templates made up for these. They live in /ligo/gitcommon/NoiseBudget/simple-noise-budget
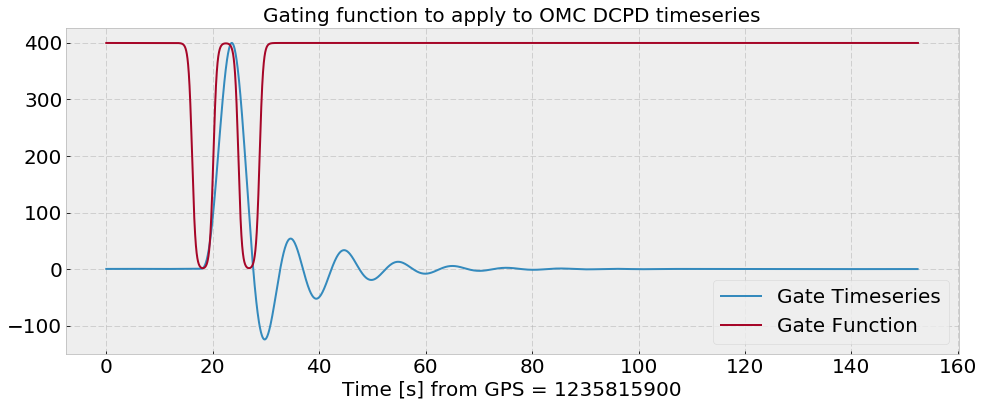
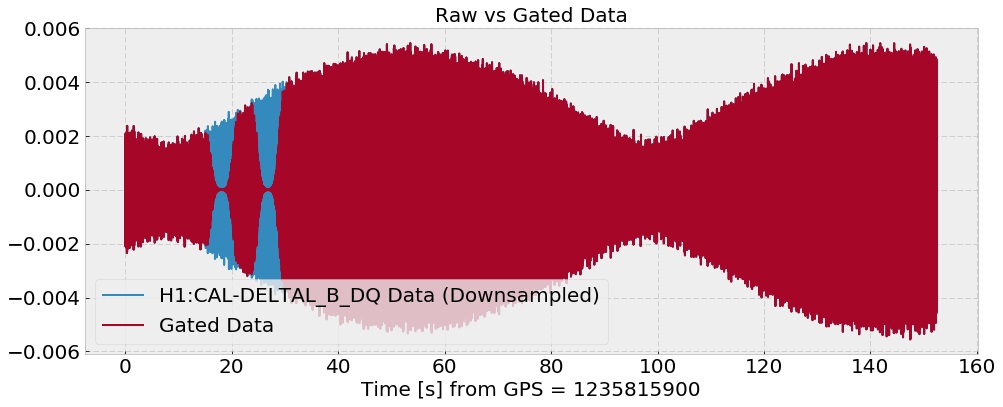
I wrote some python code to create cross-correlated DARM spectra over long, glitchy locks. Stefan balanced the PDs recently, and we saw our correlated DARM noise was fairly high at high frequency. Stefan supposed this was from glitches, but from this alog, this seems to not be the case. The info we want from the cross-correlated DCPD spectrum is the correlated noise from the IFO. We can average away the shot noise like 1/sqrt(N) where N = number of ASD averages. The problem is we need many averages to integrate away the shot noise. However, during these locks, we have frequent, strong ESD saturation glitches which spoil the spectrum. DTT is not able to "gate" the glitches, i.e. remove them from the timeseries. This code solves this problem. Attachment one shows a DARM ASD and DARM CSD between the OMC DCPDs during the lock last night. I have 2000 averages with a binwidth of 0.2 Hz and 50% overlap, or 1.4 hours of data. During this time there were 4 glitches which spoiled the spectra (the blue, purple, and green traces). With gating we have the red and orange traces. Attachment two shows a zoomed in gate function of one of these glitches. The gate I apply is just a logistic function with the mean of the data added in. The glitches are witnessed via the DARM BLRMS increasing to huge values, specifically H1:OAF-RANGE_RLP_3_OUT16 going above 100 counts. Attachment three shows the DARM OMC DCPD data with and without the gate applied. Code lives in/ligo/home/craig.cahillane/Git/IFO/Crosscorrelations/scripts/gated_DCPD_CSDs.ipynb. To run you'll have to run:$ setupanaconda (or $ source /opt/rtcds/userapps/release/cds/h1/scripts/setup_anaconda if your .bashrc alias isn't set up) $ source activate cragenv $ jupyter notebook /ligo/home/craig.cahillane/Git/IFO/Crosscorrelations/scripts/gated_DCPD_CSDs.ipynbShoutouts to TJ Massinger for help with understanding gating.
Please can you say exactly what is saturating in the ESD chain and, if you know it, what causes the saturation?
Rich:
The large glitches that show up in the BLRMS and as range drops used to always saturate the ESD, but they no longer do saturated the ESD every time (See 46642). The ESD saturation seems to be a symptom of the glitches which happen because the ESD sees DARM, not a cause. Our normal drive to the ESD is not close to saturating, and the glitches don't seem to be happening at times when we have large excursions in the drive to the ESD.
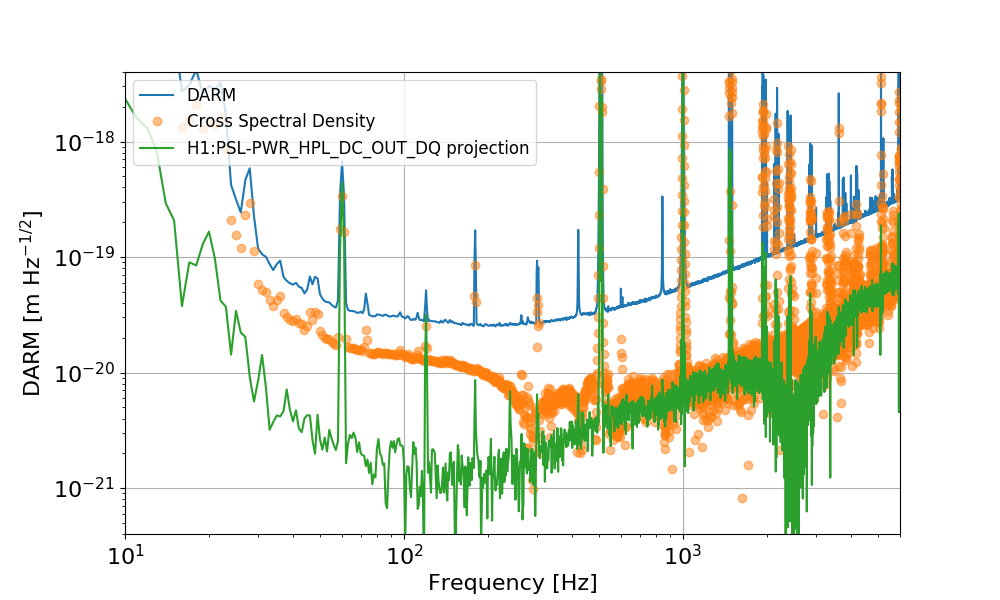
Looking at Craig's cross-correlated noise at high frequency, I remembered that we often see ~low coherence with PSL signals at a few hundreds Hz and above. In particular, looking at a BruCo scan for one of the last locks (bruco_lho_1236004218) I found that above a few hundreds Hz there is significant coherence with H1:PSL-PWR_HPL_DC_OUT_DQ (I'm not sure what that channel is...)
So I used a subset of the time Craig's listed in the plot (between 1235816126 and 1235816900) and computed
I used 1-second-long FFTs, to increase the number of averages. Maybe this is why my CSD is a bit lower than Craig's. In any case, it looks like the correlated noise lines up nicely with the projection from that PSL channel (I don't know what the "notch" at 2.5kHz is in the PSL channel projection, but it looks to be at about the right place where the intensity and frequency noises cross over in the noise budget 47351).
For future reference, the channel H1:PSL-PWR_HPL_DC_OUT_DQ is a power monitor PD on the PSL table. This PD sits before the ISS AOM (it is PD01 on the PSL table drawing, D1300348 (drawing update for 70W amp in progress update complete)), so any intensity noise it sees is free-running and therefore not suppressed by the ISS.
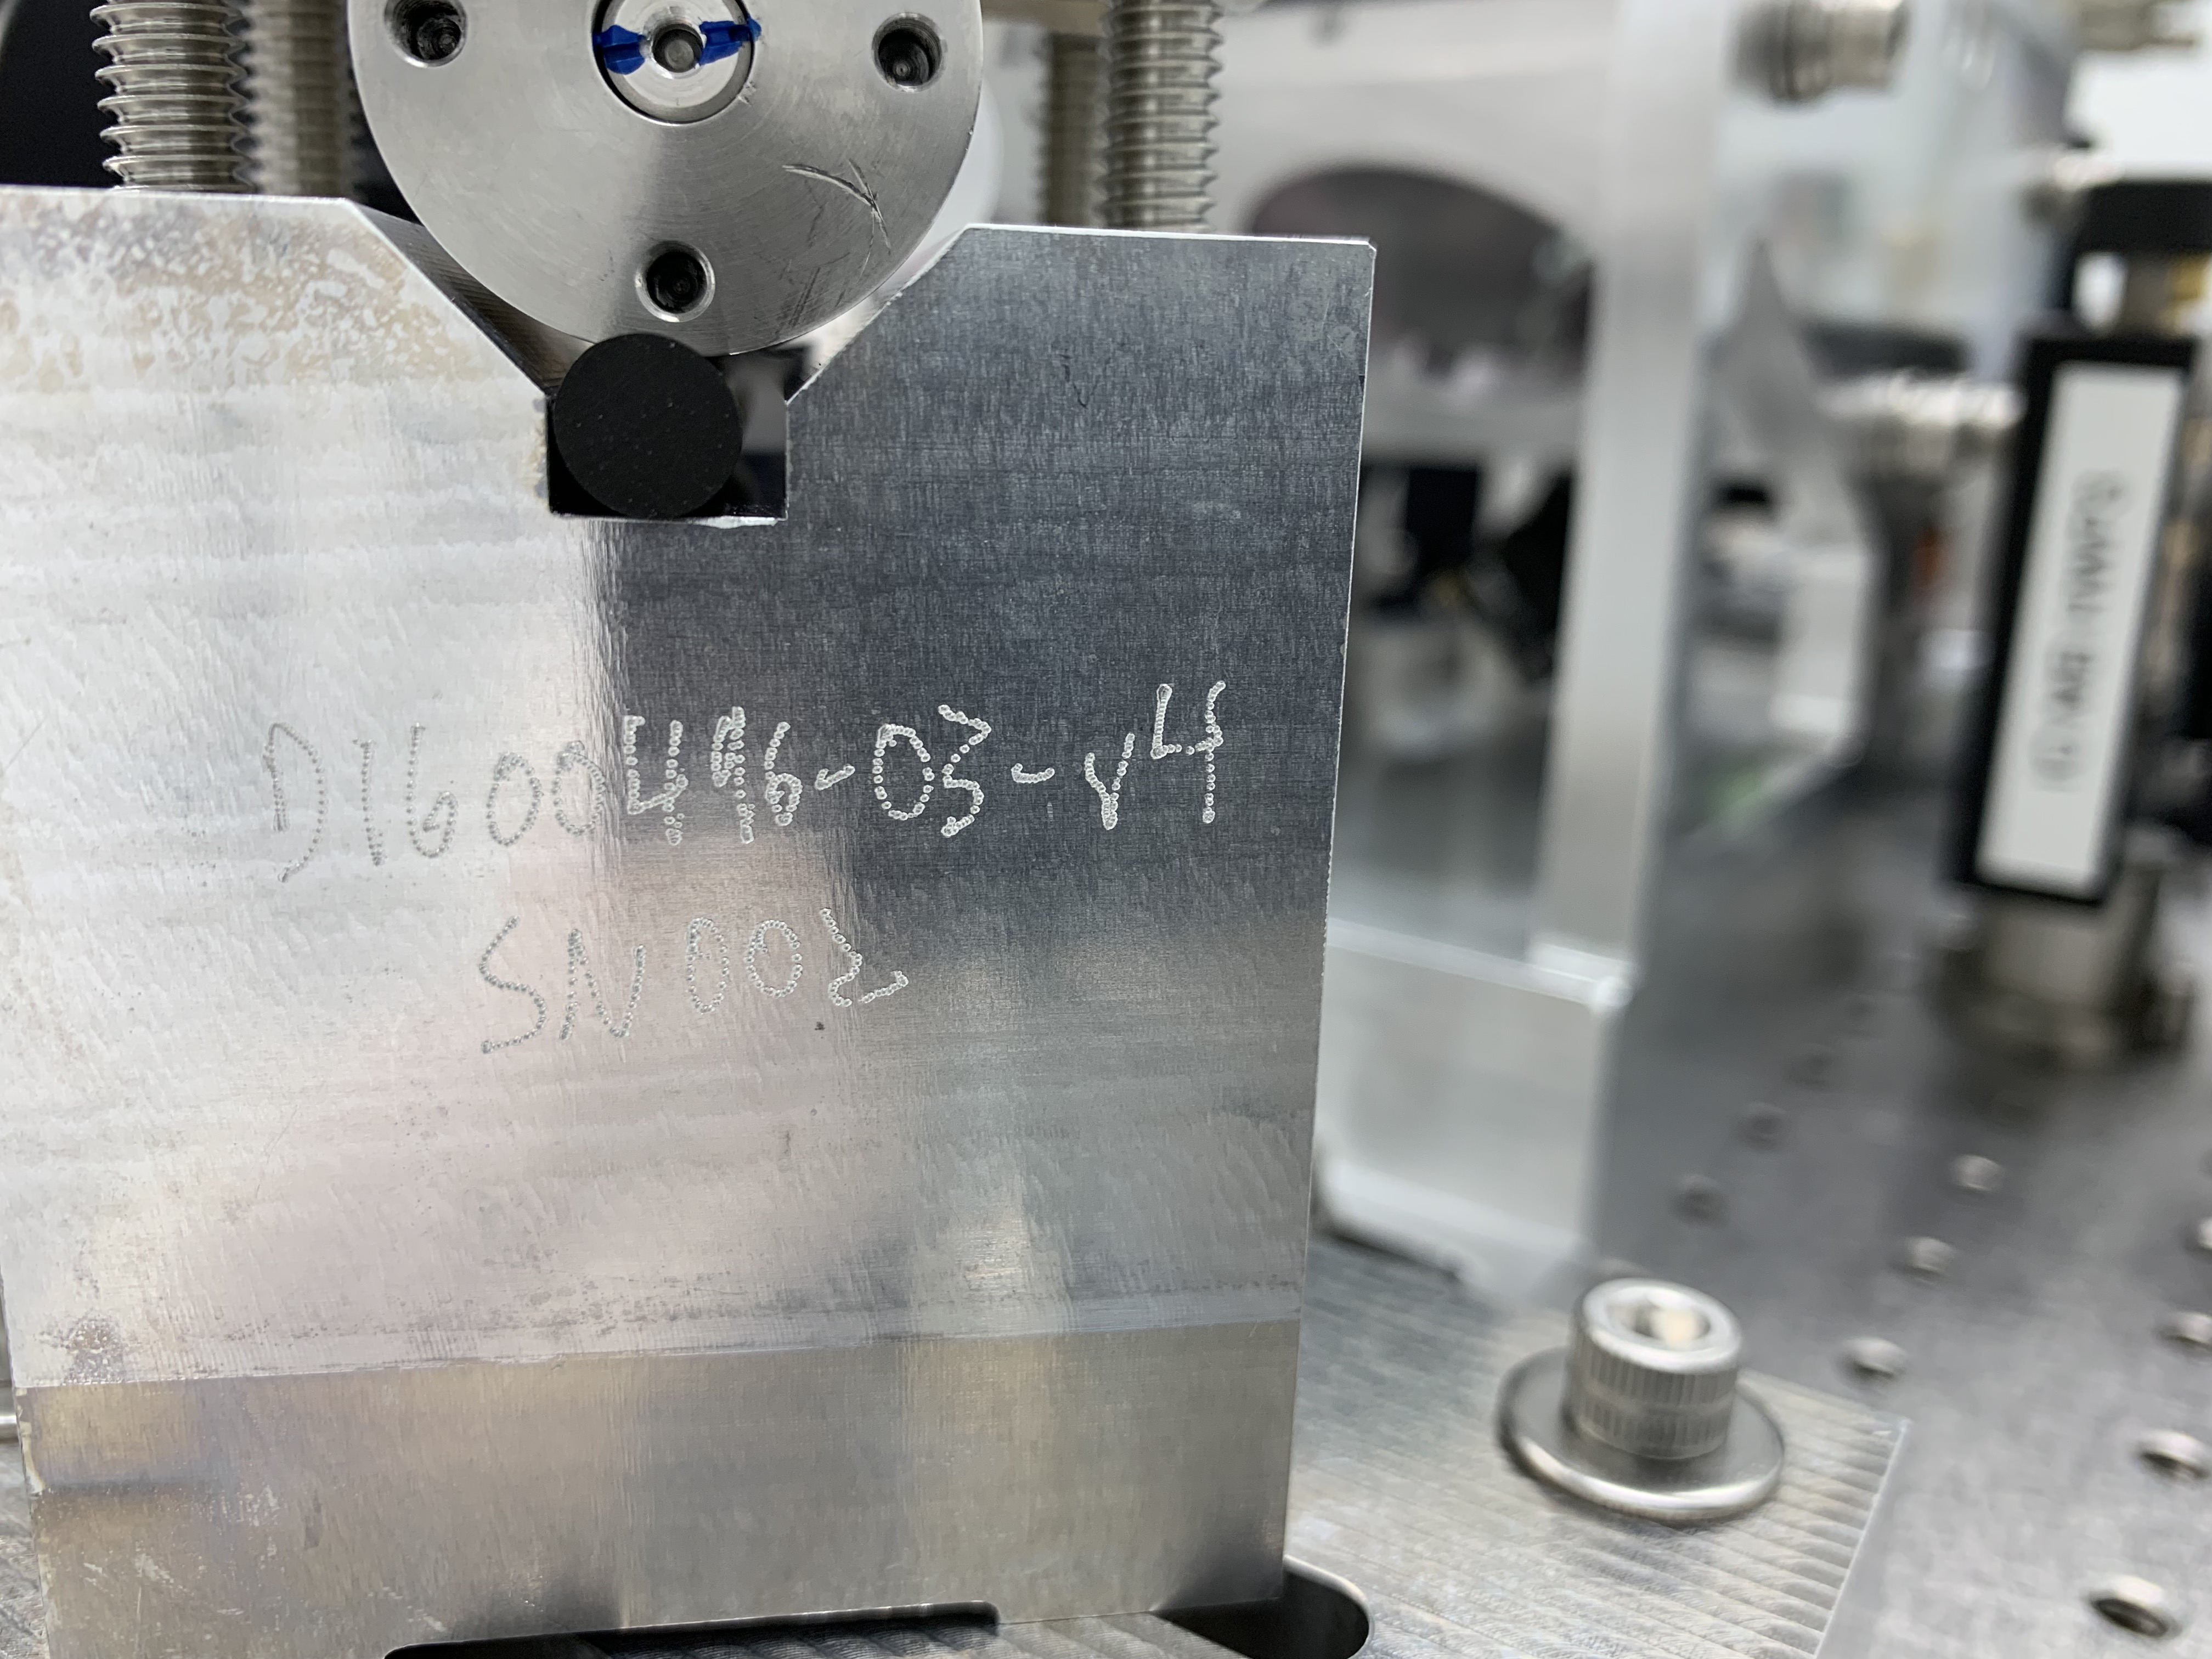
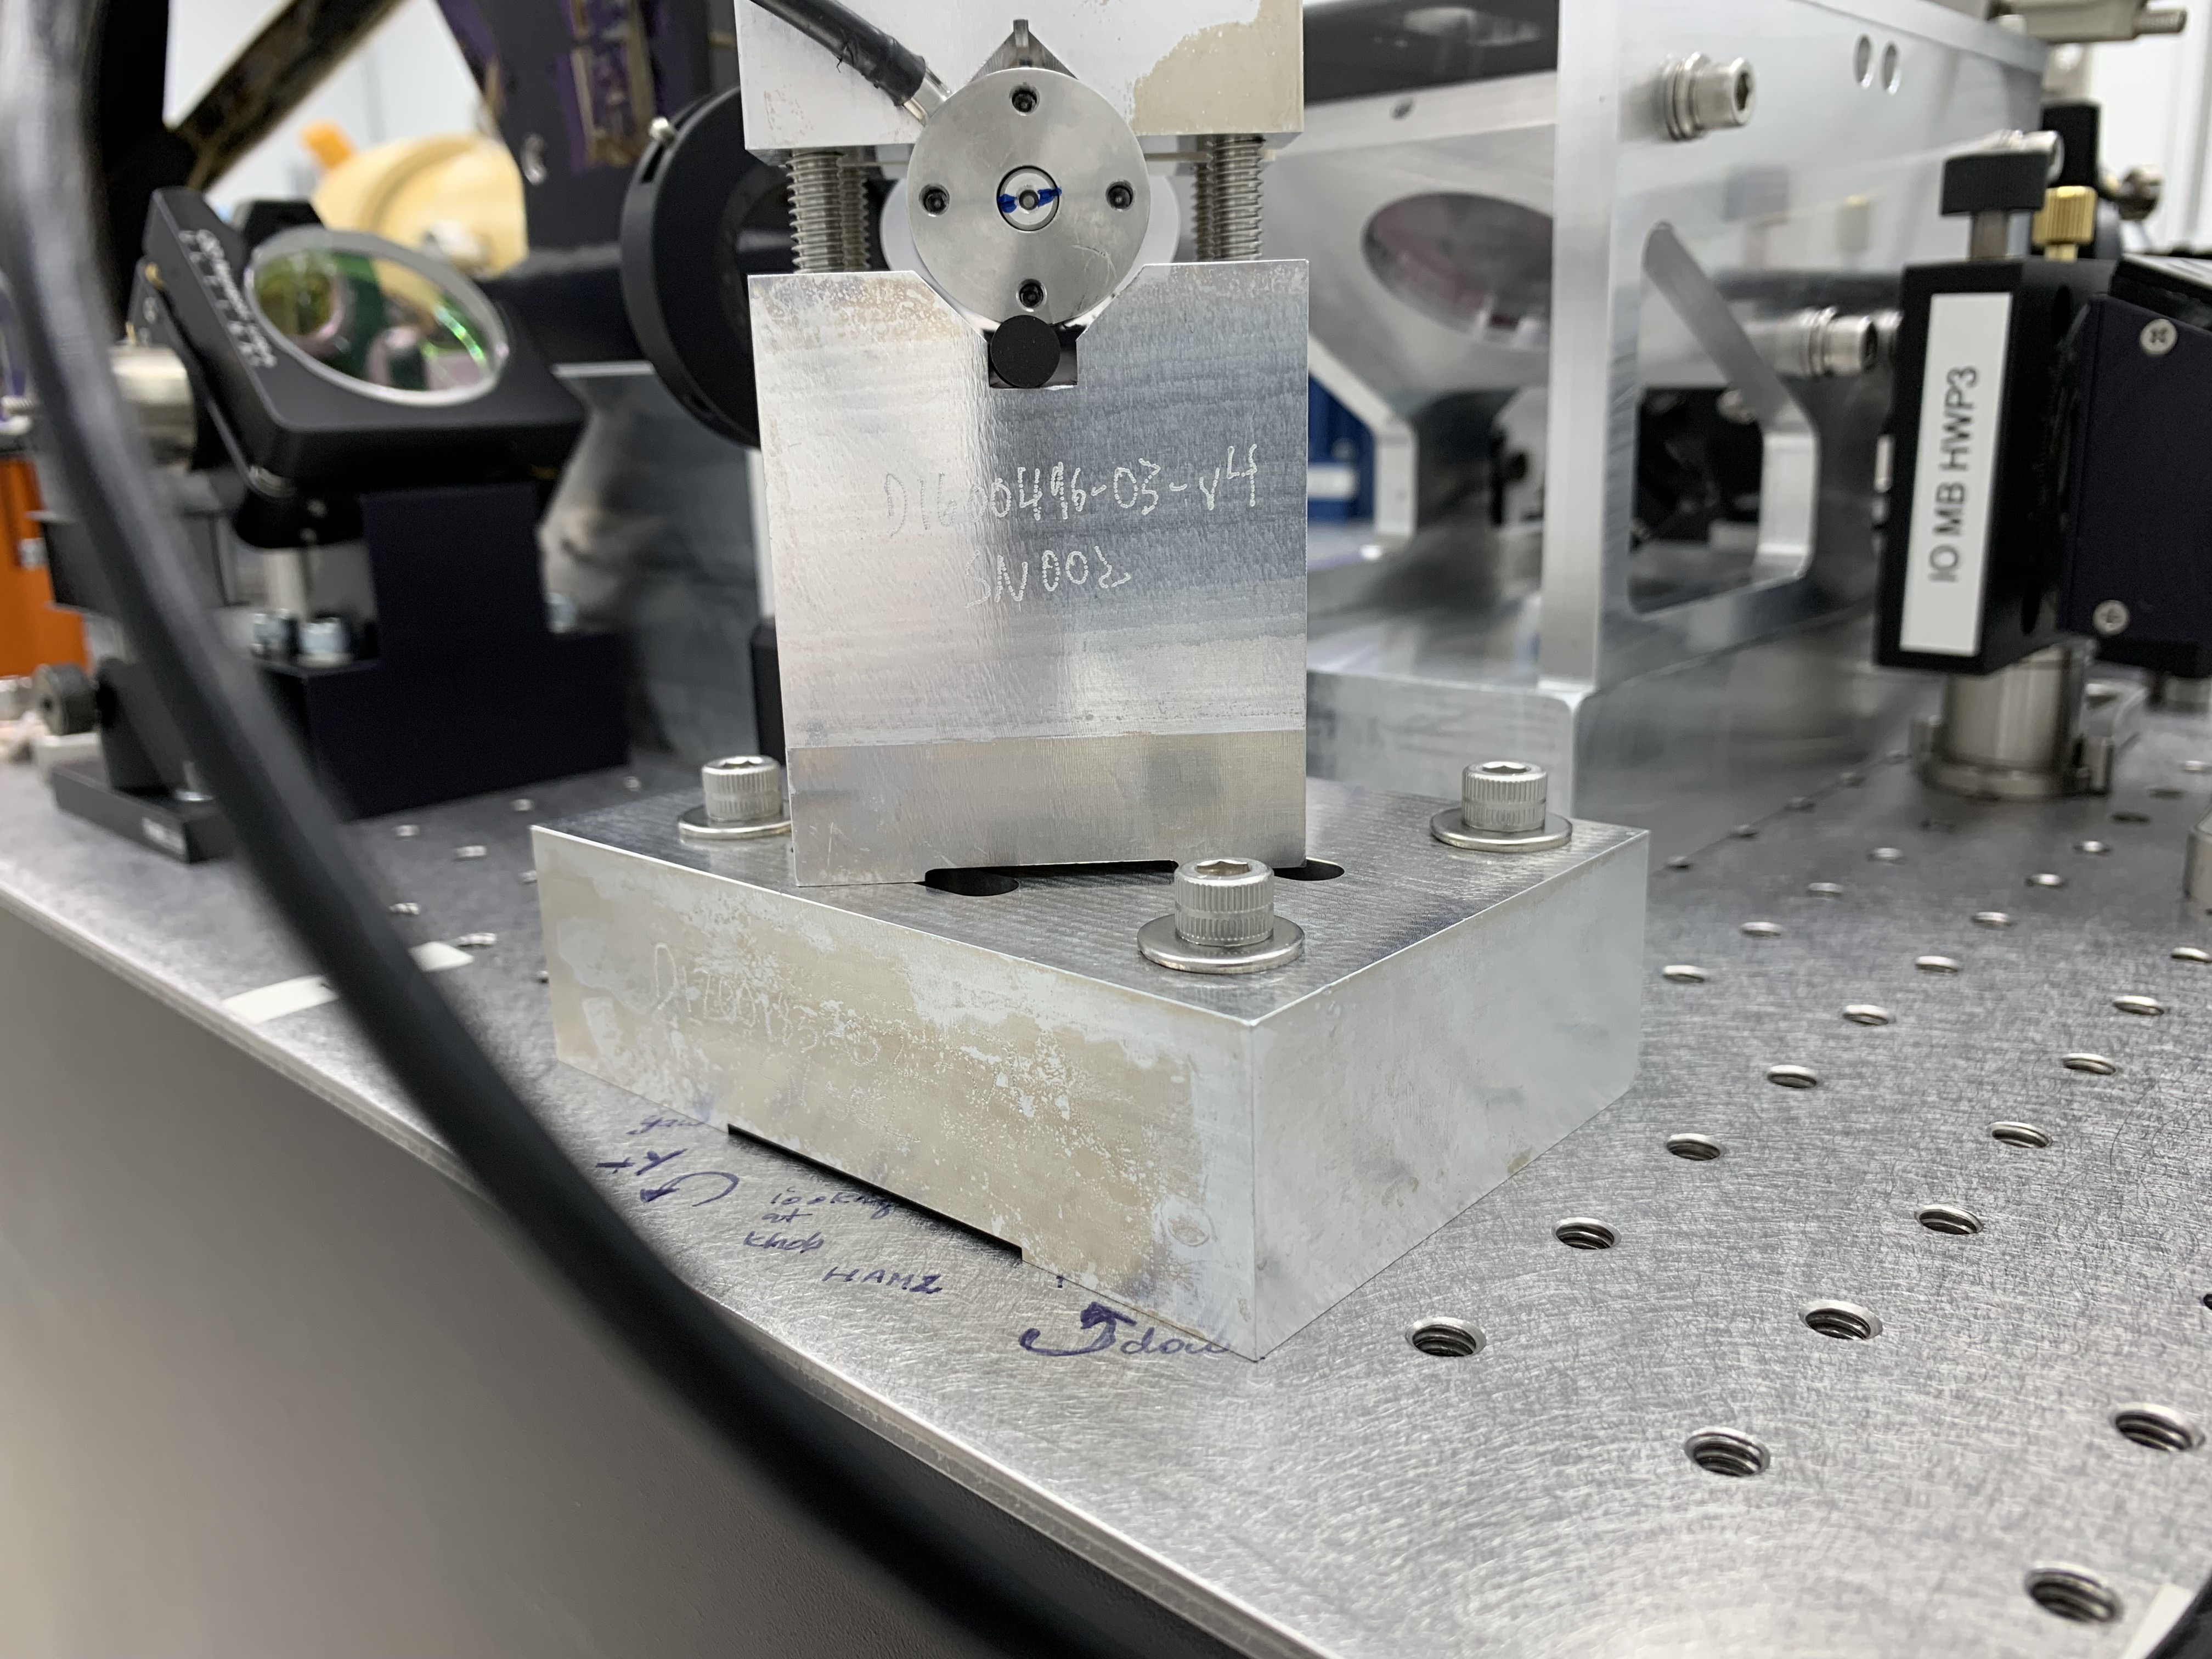
Today, while doing some cabling for PSL Picomotors, I noticed that the clamping of hte PZT actuator doesn't look right (see attached photos).
It seems that the screws that apply the clamping force, thus constraining the PZT body between the upper vee and the lower vee (and compressing the viton damping cylinder in the process) were not sufficiently tightened.
The PZT actuator cylinder appears to be floating on top of the viton cylinder, lightly constrained by the upper vee, but not the lower one - there is an obvious 1-2 mm gap between the PZT cylinder and the lower vee, on both sides.
Thanks for sharing, Rick. The cylinder of the PZT definitely should not be floating atop the viton cord, and the PZT cylinder definitely should be registered onto the V contact planes of the Base and the two Clamps.
SYS (EddieS) is working on updating the drawing D1700002 for clarity, but these are the steps that should have been implemented during assembly:
Some comments closing the loop on documentation:
Discussed at IIET call 3/8: See notes / actions at https://services.ligo-la.caltech.edu/FRS/show_bug.cgi?id=12077.
Stefan, Peter, Rich It was found that the overall DC gain, and the pole-zero location associated with the second filter module of the OMC DCPD Whitening chain, was somehow dependent on input signal level. A parametric study was done on the OMC DCPD whitening chain for different whitening filter combinations with and without DC offset. Notes detailing the parametric study are attached to this entry. There were two causes of these phenomena: 1. Gain Change - As the DC input to the OMC DCPD Whitening amplifier (D1002559 Chassis S1101627) is varied, the DC level causes saturation in some of the DC coupled gain stages. This saturation causes the normally high-impedance amplifier input to be fairly low due current flowing into the input protection diodes internal to each opamp stage. This lower input resistance in conjunction with the series resistance of the FET switches produces a voltage divider with a division ratio dependent on signal level. 2. Pole-Zero Change - The second filter module had an ECR (E1500252) performed that required a 1uF capacitor to be used. This type of filter function is supposed to be implemented with a plastic film dielectric capacitor, but a ceramic capacitor was used instead. The piezoelectric nature of ceramic capacitors can result in a capacitance that will change with applied voltage. This caused the pole-zero location to vary as a function of DC level. This capacitor was changed to the proper type and the problem went away. Data (attached) was taken for both OMC DCPD chains by injecting signals into the input of the OMC whitening chassis (DCPD Preamps disconnected), and taking the output differentially from the analog output of the whitening chassis with the ADC cable still attached (to account for any loading effects). This data was taken with and without a 5V DC offset to verify that there is no longer any effect on the signal path gain. We note that the above were all small effects, but significant in the world of 1% calibratin uncertainty. The DC gain reduction with a 5 V offset (similar to the offset in NLN operation) was 0.2 dB. The errors in the filter stage with offset were -- phase: 0.6-1 degree at 50 Hz; magnitude: 0.15 dB gain difference between 50 Hz and 200 Hz.
Rich verbally confirms that he and Peter used the measurement setup as described in LHO aLOG 47225 and D1900027, using the coil driver test box as a differential driver. They *did not* gather the test setup's transfer function, however, so this will need to be done in order to analyze the data (attached above, DCPD_Whitening_v2.zip) to the desired precision. Also note that details of the measurement files can be found on the last page of the DCPDWhiteningChanges.pdf attachment. Also -- I opened (and subsequently closed) FRS Ticket 12453 covering the problem of "changes in frequency response as a result of input signal level" that the solution in this aLOG fixes. Since this issue will likely impact LLO as well, I've opened up an integration issue, IIET Ticket 12454, such that the above mentioned change becomes an ECR to be implemented at LLO as well (assuming they have the same problem).
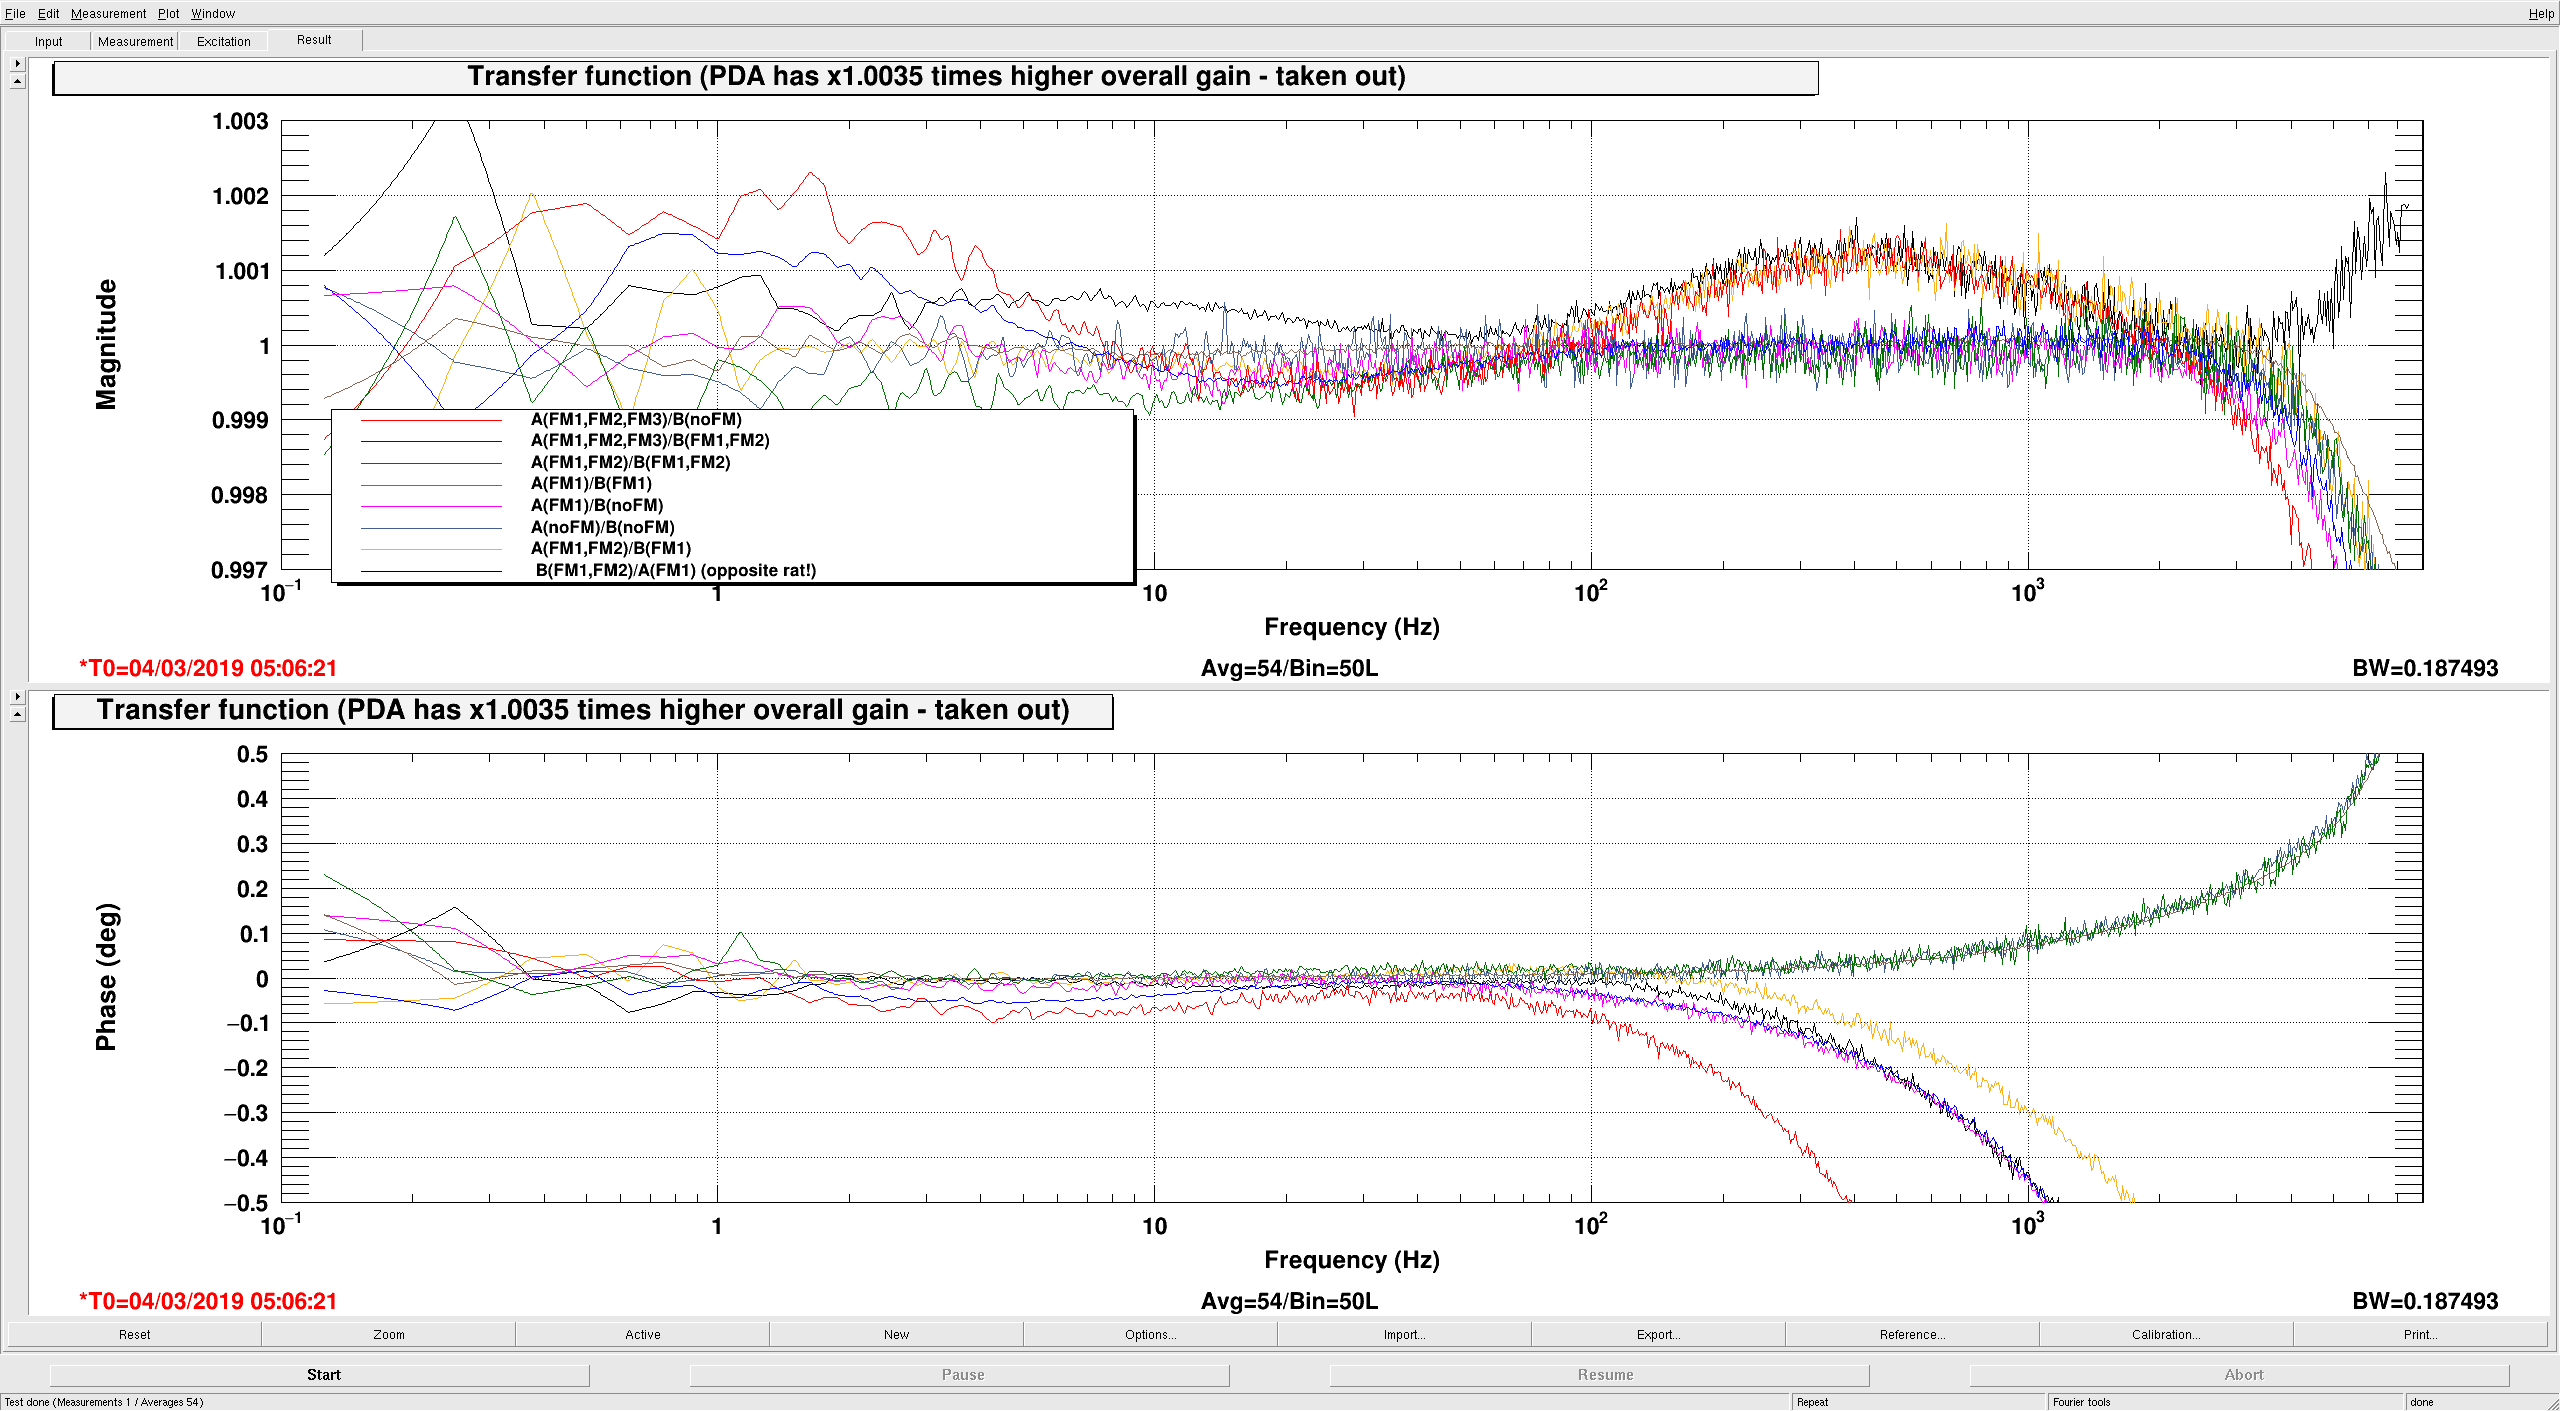
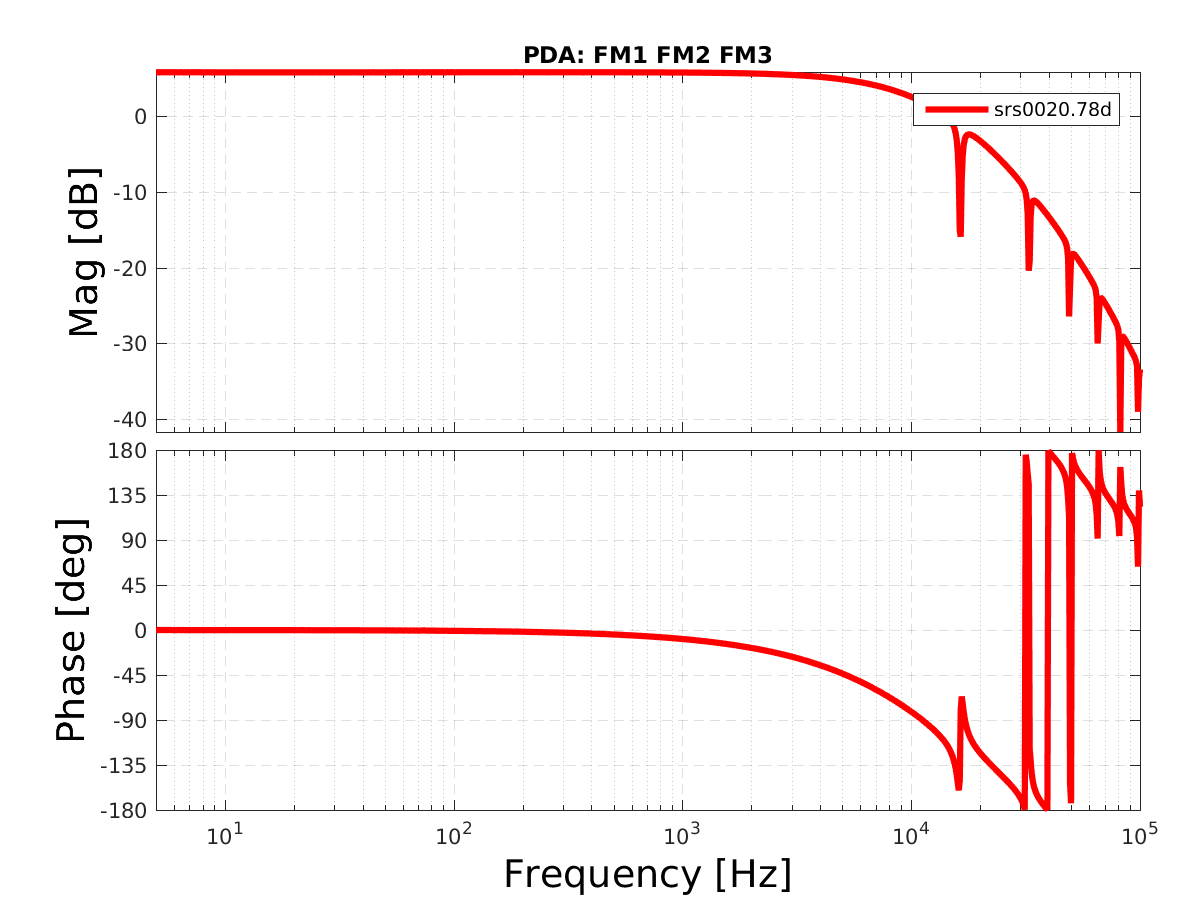
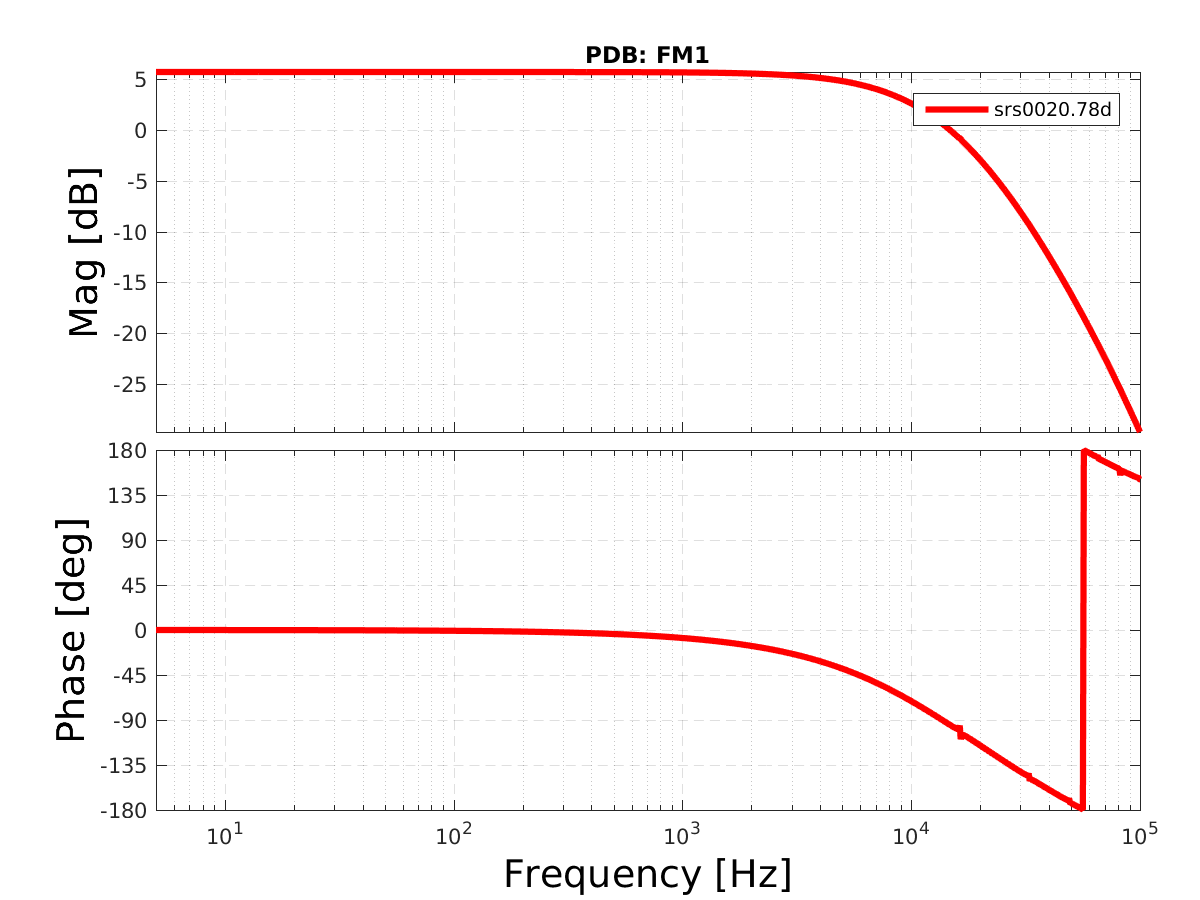
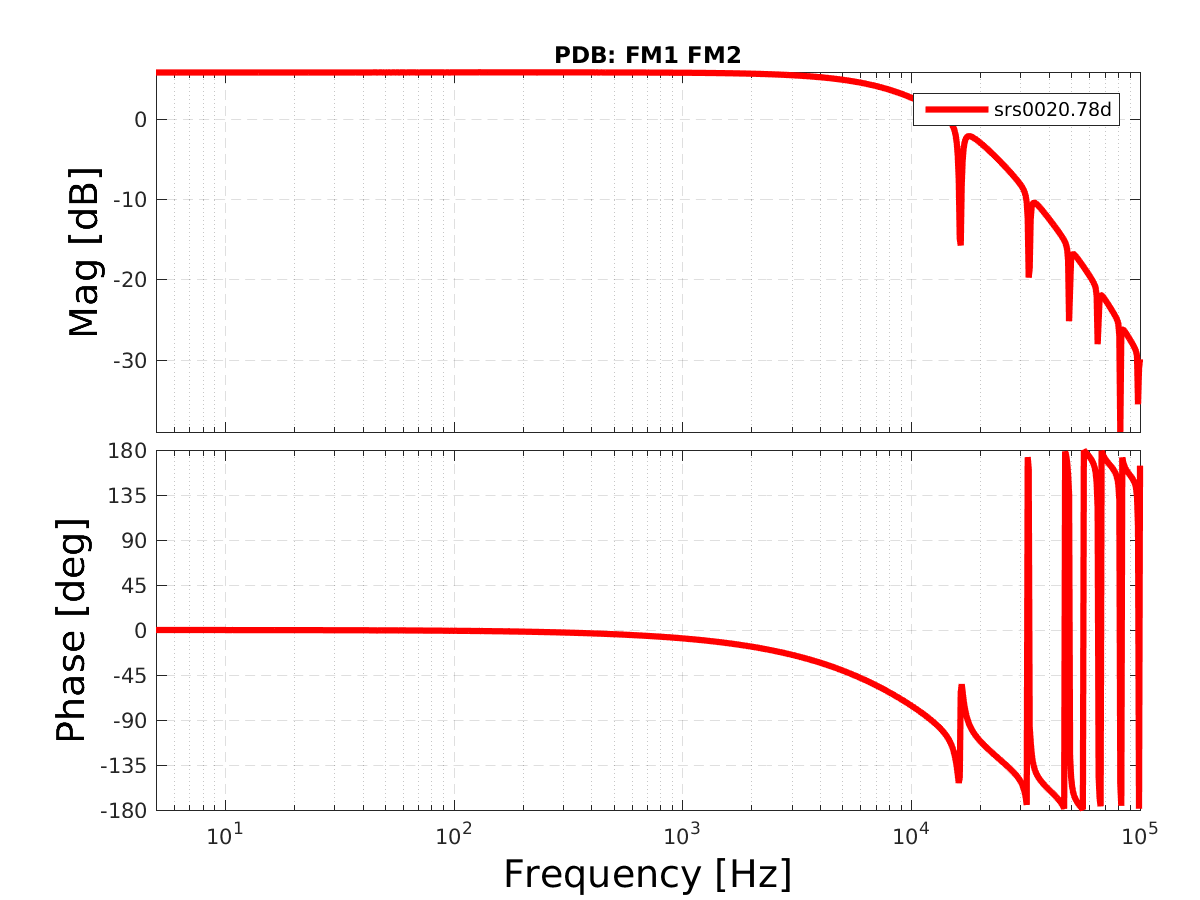
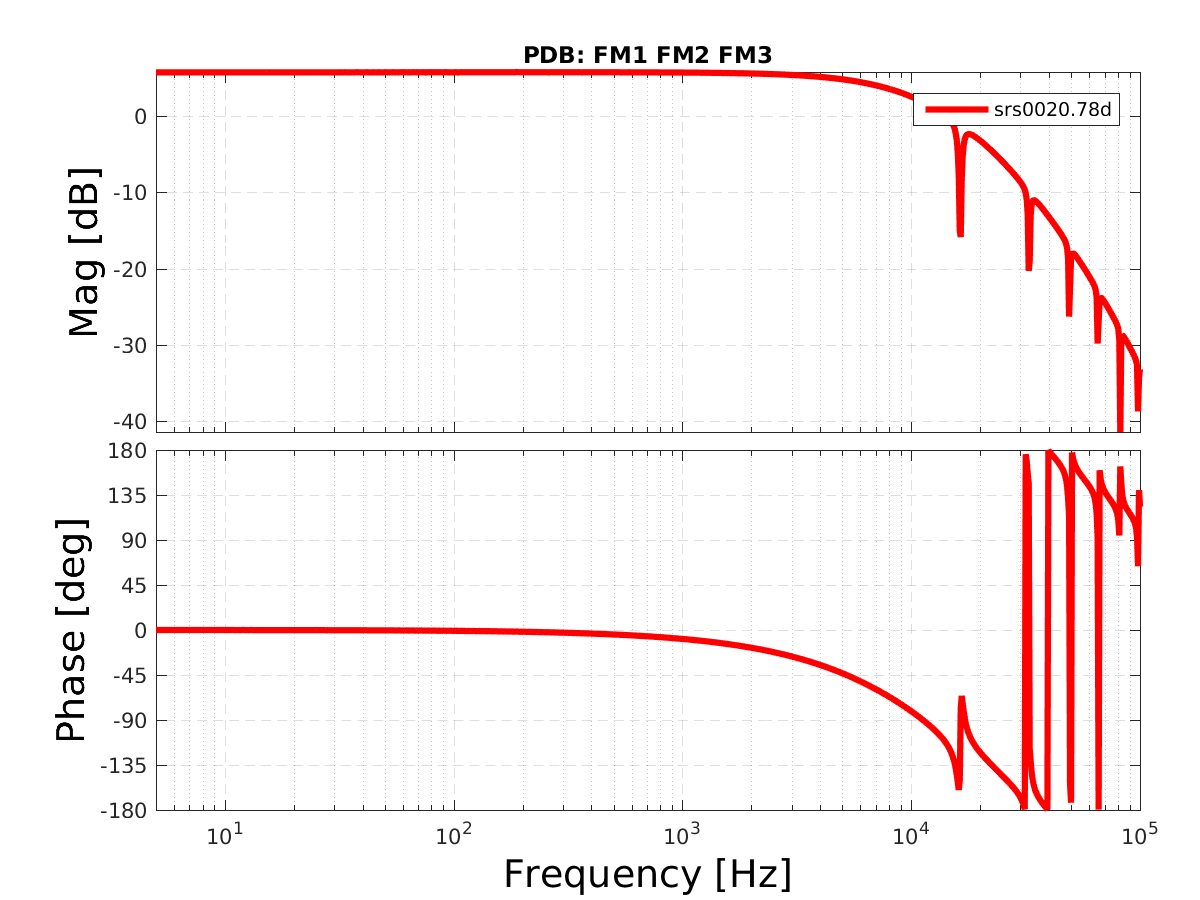
Updated the FM1,FM2,FM3 whitening compensation filters for PDA and PDB.
They are now matched at the +-0.15% level (see plot).
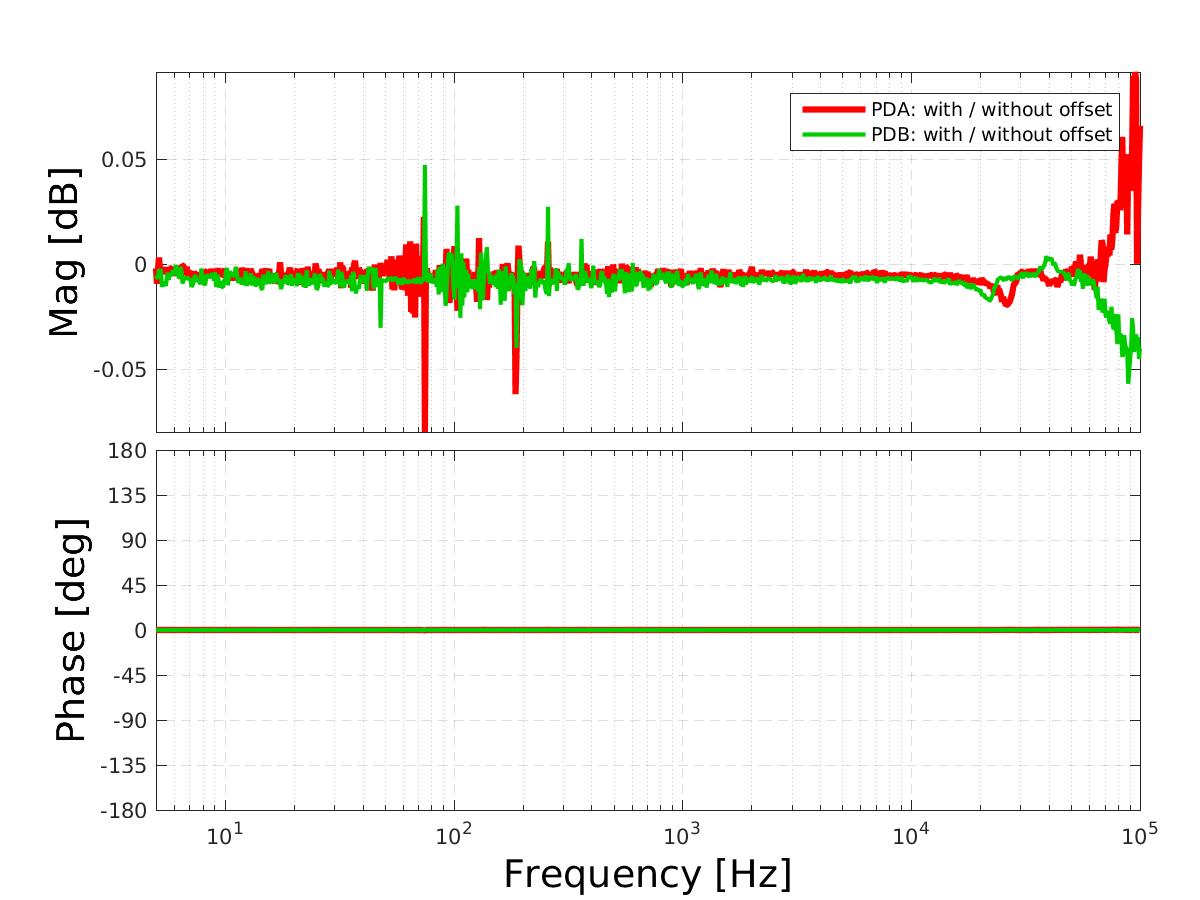
And we verified that they are no loner offset dependent.
Also, to be explicit: We disabled the 12dB, 6dB and 3dB whitening gain steps in both PDA and PDB. The 24dB step is still operational.
The new foton filters are:
PDA:
FM1: zpk([10.44],[0.996],0.9734,"n")
FM2: zpk([49.63],[497.5],-0.9995,"n")
FM3: zpk([10.372],[0.9865],1.002,"n")
PDB:
FM1: zpk([10.160],[0.969],0.975458,"n")
FM2: zpk([49.72],[497.7],-1.0004,"n")
FM3: zpk([10.467],[1.000],.9973,"n")
Using this filter, we injected pink noise into both DCPDs, and plotted the PD ratio in various configurations to verify the filter compensation. Specifically, plotted are:
A(FM1,FM2,FM3)/B(noFM)
A(FM1,FM2,FM3)/B(FM1,FM2)
A(FM1,FM2)/B(FM1,FM2)
A(FM1)/B(FM1)
A(FM1)/B(noFM)
A(noFM)/B(noFM)
A(FM1,FM2)/B(FM1)
B(FM1,FM2)/A(FM1) (opposite rat!)
The xml file with the data in the plot is in /ligo/home/controls/sballmer/20190303/DCPDfinal.xml
Finally, we still will have to re-match the photo diode light levels in lock (alog 47217).
All this was done to fix the problem identified in alog 47247.
Attached are plots of
- Transfer function wit- over-without offset. The insanity is indeed gone.
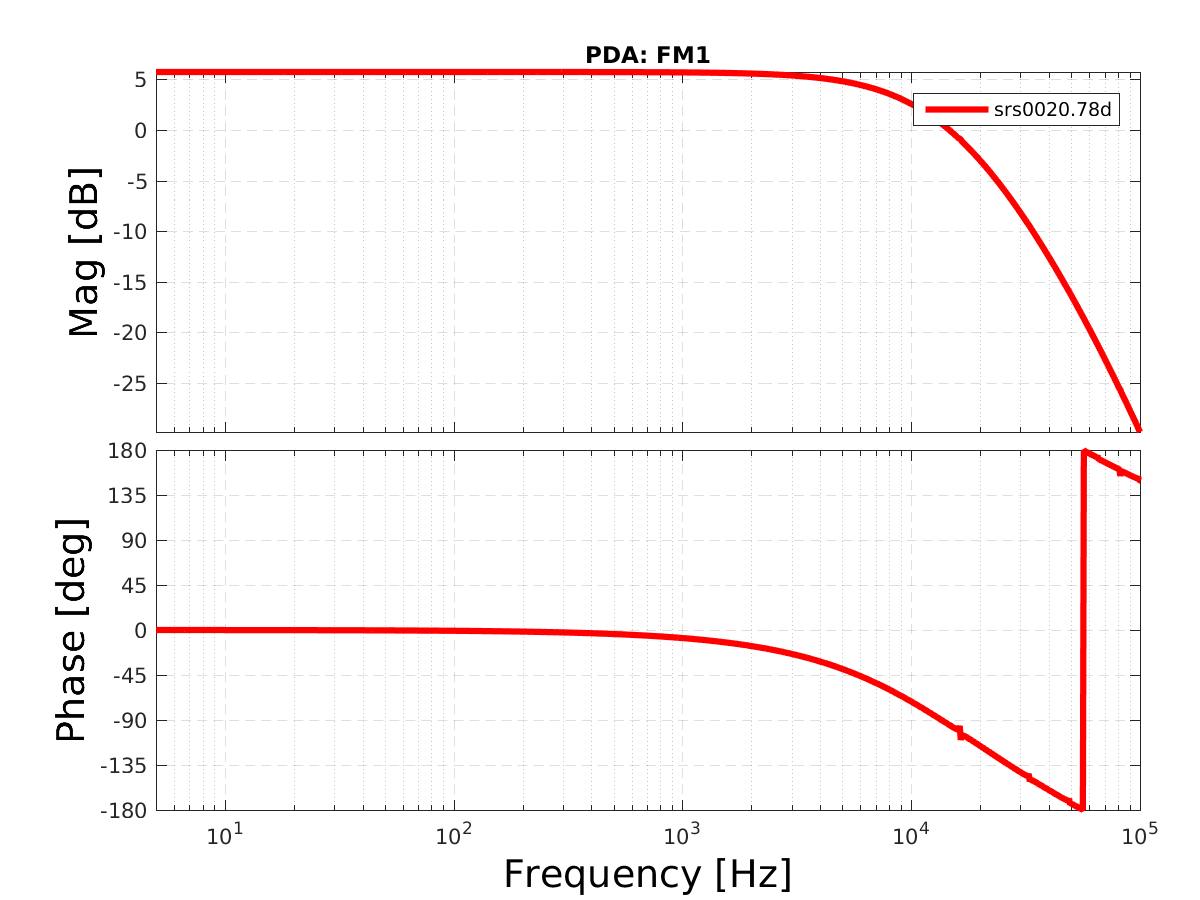
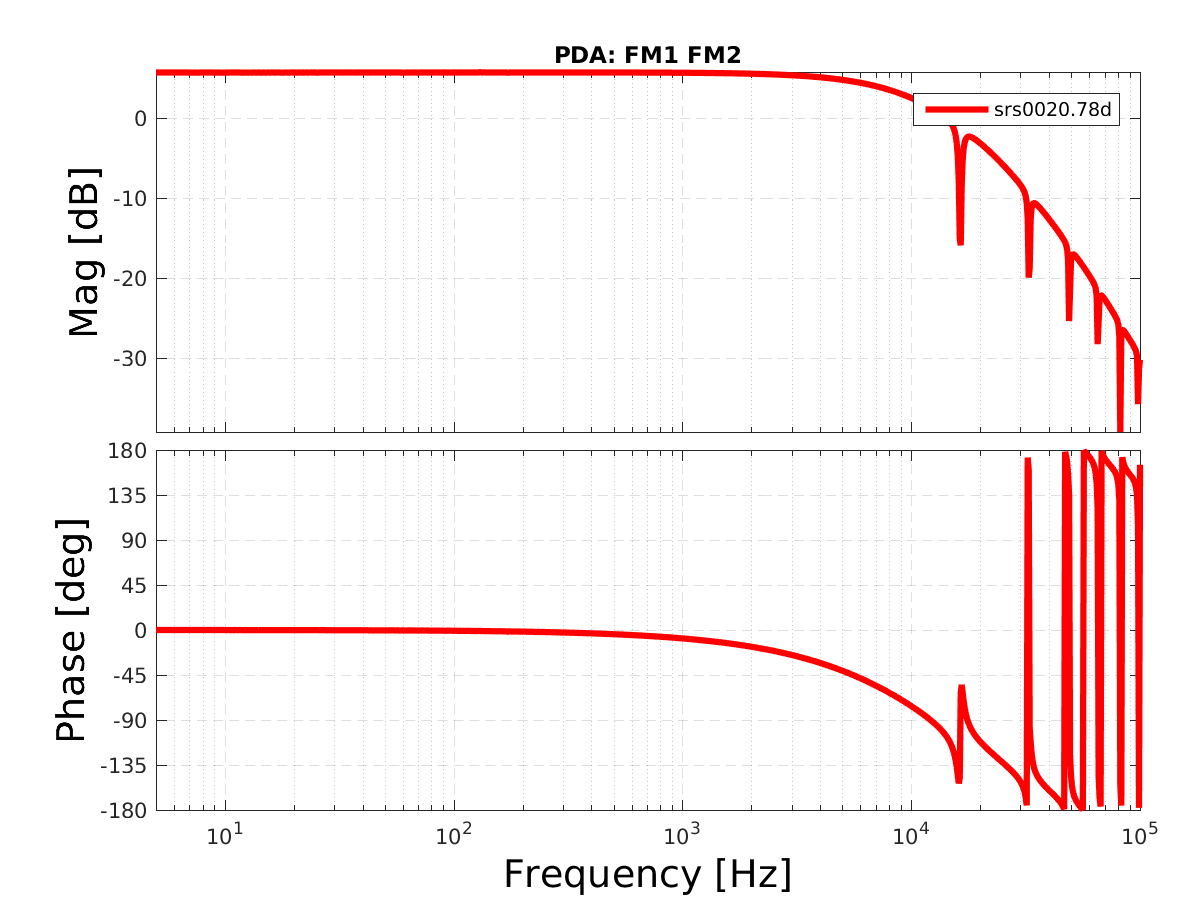
- PDA: FM1, FM1FM2, FM1FM2FM3 - all normalized with their compensation filter.
- PDB: FM1, FM1FM2, FM1FM2FM3 - all normalized with their compensation filter.
In short: the current compensation is good at the 0.02dB level. One could still improve it...
The plotting MATLAB code is here: /ligo/home/controls/sballmer/20190304/DCPD
I've moved the contents of Stefan's results from his home directory on the local file system into the calibration SVN (though I've not yet modified his plotting script for the new directories and/or to spit out the right file names).
I used the follow commands to do so:
Data:
cd /ligo/svncommon/CalSVN/aligocalibration/trunk/Common/Electronics/H1/Data/OMCWhiteningChassis/2019-03-04/
cp /ligo/home/controls/sballmer/20190304/DCPD/SRS00* ./
cp /ligo/home/controls/sballmer/20190304/DCPD/srs00* ./
cp /ligo/home/controls/sballmer/20190304/DCPD/47254_20190303213* ./
Script:
cd /ligo/svncommon/CalSVN/aligocalibration/trunk/Common/Electronics/H1/Scripts/
cp /ligo/home/controls/sballmer/20190304/DCPD/plotData.m plot_omcdcpdwhiteningmods_20190304.m
Results:
cd /ligo/svncommon/CalSVN/aligocalibration/trunk/Common/Electronics/H1/Results/OMCWhiteningChassis/
cp /ligo/home/controls/sballmer/20190304/DCPD/PD*.png ./
rename 's/PD/2019-03-04\_H1OMC\_WhiteningChassisTFs\_PD/' PD*.png
Thus the new script name to plot the data is:
/ligo/svncommon/CalSVN/aligocalibration/trunk/Common/Electronics/H1/Scripts/plot_omcdcpdwhiteningmods_20190304.m
which should be modified to analyze the following data:
/ligo/svncommon/CalSVN/aligocalibration/trunk/Common/Electronics/H1/Data/OMCWhiteningChassis/2019-03-04/
SRS00*.78D
srs00*.asc
using the notes in the file
/ligo/svncommon/CalSVN/aligocalibration/trunk/Common/Electronics/H1/Data/OMCWhiteningChassis/2019-03-04/
47254_20190303213544_DCPDWhiteningChanges.pdf
and to produce plots and results with similar file tags as
/ligo/svncommon/CalSVN/aligocalibration/trunk/Common/Electronics/H1/Results/OMCWhiteningChassis/
2019-03-04_H1OMC_WhiteningChassisTFs_PD*.png
(or the code should be re-written to use your favorite fitting code [maybe in python using IIRrational] and produce plots and results with similarly explicit file names with indications of the date, the interferometer, and WhiteningChassisTFs in the file name.)
Lilli S.,
First, I have renamed the data files in dir /ligo/svncommon/CalSVN/aligocalibration/trunk/Common/Electronics/H1/Data/OMCWhiteningChassis/2019-03-04/, so that they match what is described in note /ligo/svncommon/CalSVN/aligocalibration/trunk/Common/Electronics/H1/Data/OMCWhiteningChassis/2019-03-04/47254_20190303213544_DCPDWhiteningChanges.pdf
The test box has been factored out. (Test box data: /ligo/svncommon/CalSVN/aligocalibration/trunk/Common/Electronics/H1/Data/CoilDriverTestBox/S1900070/)
The fitting script is /ligo/svncommon/CalSVN/aligocalibration/trunk/Common/Electronics/H1/Scripts/fit_OMCDCPDWhiteningChassis_20190304.py
The results are in the table below. The fitting plots are in the attachments.
The low-freq poles/zeros roughly match Stefan's results. In O1 and O2 we used 1 stage of whitening (FM1), and the high freq poles were at [(14.34e3 + 14.60e3)/2, (18.68e3 + 18.57e3)/2, (98.94e3 + 100.45e3)/2] Hz. The new fitting for FM1 is consistent with O1 and O2.
Take PDA FM1FM2FM3 noDC as an example, manually build TF by removing the high-freq zeros, and plot the residual -> see diff.pdf
By ignoring the high-freq zeros, there's little impact on magnitude, but there's phase difference at higher freq (~<1 deg below 5k Hz).
| PDA | PDB | Comments | |
| FM1FM2FM3 (no DC) | PDA, Filters: FM1FM2FM3noDC Results: z:p:k [ 3.90426349e+06 3.90426349e+06 4.99892253e+02 1.08290122e+00 1.08040698e+00] [ 1.04233314e+01 3.26866242e+04 3.26866242e+04 1.13980014e+04 4.97078295e+01 1.04233314e+01] -8.68011786846 |
PDB, Filters: FM1FM2FM3noDC Results: z:p:k [ 4.64029327e+06 4.64029327e+06 5.00447159e+02 1.07523773e+00 1.07282309e+00] [ 1.03389750e+01 3.28642175e+04 3.28642175e+04 1.15193027e+04 1.03389750e+01 4.97939024e+01] -6.26981682358 |
Low-freq zeros near 1Hz, 1Hz, 500Hz, and poles near 10Hz, 10Hz, 50Hz (as expected) High-freq poles near 12K, 33K, 33K Hz. |
| FM1FM2FM3 (4.99V DC) | PDA, Filters: FM1FM2FM3DC Results: z:p:k [ 4.83659991e+06 4.83659991e+06 4.99682906e+02 1.08106936e+00 1.08299624e+00] [ 1.04231076e+01 3.28748478e+04 3.28748478e+04 1.13460627e+04 1.04231076e+01 4.96890494e+01] -5.6929144981 |
PDB, Filters: FM1FM2FM3DC Results: z:p:k [ 3.93271594e+06 3.93271594e+06 5.00449636e+02 1.07585358e+00 1.07328174e+00] [ 4.98000266e+01 3.28631506e+04 3.28631506e+04 1.15205406e+04 1.03375026e+01 1.03375026e+01] -8.72188264417 |
Low-freq zeros near 1Hz, 1Hz, 500Hz, and poles near 10Hz, 10Hz, 50Hz (as expected) High-freq poles near 12K, 33K, 33K Hz. |
| FM1FM2 (no DC) |
PDA, Filters: FM1FM2 Results: z:p:k |
PDB, Filters: FM1FM2 Results: z:p:k [ 2.11805525e+06 8.72055868e+05 5.00733633e+02 1.14755102e+00] [ 2.04506589e+04 1.24360067e+04 8.94998324e+04 4.97729997e+01 1.02056871e+01] -12.7328787001 |
Low-freq zeros near 1Hz, 500Hz, and poles near 10Hz, 50Hz (as expected) High-freq poles near 12K, 20K, 89K Hz. |
| FM1 (no DC) | PDA, Filters: FM1 Results: z:p:k [ 4.22938089e+06 4.22938089e+06 1.17507390e+00] [ 1.27384958e+04 1.93716076e+04 9.29113659e+04 1.04895576e+01] 13.3497796427 |
PDB, Filters: FM1 Results: z:p:k [ 4.84207436e+06 4.84207436e+06 1.14699930e+00] [ 1.29122349e+04 1.93696499e+04 9.46279852e+04 1.02067553e+01] 10.4974545401 |
Low-freq zeros near 1Hz and poles near 10Hz (as expected) High-freq poles near 13K, 19K, 93K Hz. |
| noFM (no DC) | PDA, Filters: noFM Results: z:p:k [ 1.26091781e+07 3.57048935e+07 2.05610666e-01] [ 1.28075383e+04 1.92624890e+04 1.84656469e+06 4.98134421e-02] 0.980629117874 |
PDB, Filters: noFM Results: z:p:k [ 2.82948542e+07 2.84161583e+07 2.05615042e-01] [ 1.29617754e+04 1.93273505e+04 2.08761329e+06 4.98133861e-02] 0.629314166113 |
High-freq poles near 13K, 19K Hz. Unphysical low-freq zero near 0.2Hz and pole near 0.05Hz. |
Concluding from the results of the fit above, I'll be updating the calibration model parameters to change from the previous measurement of the DCPD whitening chassis (before O2, when the nominal configuration was to only have the first stage of whitening -- "F1" or "FM1" -- on; see LHO aLOG 28087) from PDA PDB PDA PDB PDA PDB uncompOMCpoles_whitening = [(14.34e3 + 14.60e3)/2, (18.68e3 + 18.57e3)/2, (98.94e3 + 100.45e3)/2]; to the new fitted measurement results, and choosing the new nominal configuration, with all three filters on (the 1st and 3rd stages, which are whitening and the 2nd stage which is a low pass, i.e. "FM1FM2FM3" or "3 filt"), and using the 5 V_DC offset fit results because it's more representative of the nominal running conditions of the chassis (with the poles rounded to the nearest Hz) PDA PDB PDA PDB PDA PDB uncompOMCpoles_whitening = [(11.346e3 + 11.521e3)/2, (32.875e3 + 32.863e3)/2, (32.875e3 + 32.863e3)/2];
Lilli S.,
The residual contribution plot is attached. This was generated using /ligo/svncommon/CalSVN/aligocalibration/trunk/Common/Electronics/H1/Scripts/fit_OMCDCPDWhiteningChassis_20190304-vsOriginal.py
(based on reference model modelparams_H1_20190118)
The results is averaged after using different poles/zeros in PDA and PDB, instead of using the same set of averaged poles/zeros in PDA and PDB.
Per Jeff's request that the original DCPD files be included, I am attaching the data extending down to 0.5Hz for the OMC DCPD Whitening chain as taken on the floor by signal injection into the front panel of the Split Whitening Chain via an SR785
Attached are two plots:
A) The comparison of TFs:
1. All low-freq z:p + high-freq p + out-of-band z from IIRrational fitting
2. Dead reckoned z:p = [500, 1, 1]:[50, 10, 10]
3. Low-freq z:p from Stefan's fitting in 47257
4. Low-freq z:p from Stefan's fitting in 47257 + high-freq p from IIRational
B) The comparison of contribution residuals, by using the latest H1 model 20190301
The scripts live in
/ligo/svncommon/CalSVN/aligocalibration/trunk/Common/Electronics/H1/Scripts/fit_OMCDCPDWhiteningChassis_20190304-compareTF.py
/ligo/svncommon/CalSVN/aligocalibration/trunk/Common/Electronics/H1/Scripts/fit_OMCDCPDWhiteningChassis_20190304-compareRes.py
Today I found the pressure relief line of the EndY HEPI full of fluid (a couple feet of 1/2" or something hose.) This is usually an indication to me that the pump station experienced a high pressure event on the output. Attached is a snap of the output pressure and the control signal around 8 March--if this is the time this over pressure occurred it is a pretty good indication of how observant I really am given that I've been there 6 or 8 times since then!
Anyway, the plot shows that several attempts were made at restarting/repowering things after the fuse blow in the above entry. The data shows the output of the controller at max, 2048 while things were reengaged and spiking the pressure and opening the pressure valve letting fluid escape. The last one, I'm not sure why it was different but was at max reading, ~104 psi for 10 to 20 seconds. This is likely the event that filled the relief line with fluid. Looks like time for training!