Displaying reports 42701-42720 of 88665.Go to page Start 2132 2133 2134 2135 2136 2137 2138 2139 2140 End
Reports until 20:31, Thursday 07 March 2019
H1 PSL (PSL)
keita.kawabe@LIGO.ORG - posted 20:31, Thursday 07 March 2019 - last comment - 05:22, Friday 08 March 2019(47379)
DBB powered off (Peter, Keita)

I noticed that DBB interface was on,  PeterK and I went to the floor to turn it off.

For locking DBB PMC, it uses a 1MHz oscillator of some sort (probably just a canned crystal). The oscillator is ON all the time even when modulation is disabled as far as it is powered but its frequency is not monitored.

Non-image files attached to this report
Comments related to this report
peter.king@LIGO.ORG - 05:22, Friday 08 March 2019 (47388)
I think the oscillator is from auris, part number O-1.000000M-AQO 14-50-5.0-A.  It's a little difficult to tell from the schematics.
H1 CAL
jeffrey.kissel@LIGO.ORG - posted 20:23, Thursday 07 March 2019 - last comment - 00:09, Friday 08 March 2019(47378)
Processed 2019-03-07 Sensing Function and OLG TF Measurements -- Closer to resolving Detuning, Maybe Pro-Spring (instead of Anti-Spring); PUM Flaws Contributing to Systematic Error as Expected
J. Kissel

I've process Craig's sensing function from last night (LHO aLOG 47354), in which he states, the data lives here:
     2019-03-07_H1DARM_OLGTF_5to1100Hz_20min.xml
     2019-03-07_H1_PCAL2DARM_TF_5t1100Hz_8min.xml
I had to finagle the exported data a bit -- the PCAL to DARM TF result appears to have 1 less frequency point (at ~5 Hz) than the DARM OLG TF result, so I just stripped the DARM OLG TF data of that frequency point. Also, there seems to have been a data point with coherence of identically zero which confused the data processing software, so I modified it to be some small non zero value.

The comparison of model to measurement is attached. The numerical answers are
   Optical gain, H_c (ct/m)                 | 3.426e+06 (+1799,-2153) or (+0.0525%,-0.06285%)
   Optical gain, H_c (mA/pm)                | 4.236     (+0.002224,-0.002662) or (+0.0525%,-0.06285%)
   Cavity pole, f_cc (Hz)                   | 394.6     (+1.418,-1.17) or (+0.3594%,-0.2965%)
   Detuned SRC spring frequency, f_s (Hz)   | 2.353     (+0.06679,-0.08249) or (+2.839%,-3.506%)
   Detuned SRC spring quality factor, Q_s   | 0.01186   (+0.003069,-0.001373) or (+25.87%,-11.58%)
   Residual time delay, tau_c (usec)        | -0.4223   (+0.9933,-0.8277) or (+-235.2%,--196%)

The systematic error above ~100 Hz is great -- likely attributed to Stefan's good work compensating the DCPDs (LHO aLOG 47257) and some further good results from fitting the high frequency poles of the OMC DCPD whitening chassis by Lilli (see LHO aLOG 47377). Impressively, the residual time delay (which can be either real unknown delay, or uncompensated high frequency poles) is consistent with zero, within 1 [us].

Low frequency is still a problem -- at the 5% level below 20 Hz, with a 1% wiggle around 80-100 Hz. The good news is -- due to my template tuning (mentioned at the tail end of LHO aLOG 47206), we're now able to resolve some of our detuning again -- and the message is, we definitely have it. given the wiggle at ~90 Hz, I'm wondering if we're on the opposite side of the SRC detuning such that we're seeing pro-spring -- so much so that the ~90Hz wiggle may be the right-half plane poles not perfectly canceling the left real zero, that normal reduce to a single pole frequency when the RSE detuning phase is very close to 90 deg (see discussion of this effect in P1600295, Section 5.2).

I'd like more data with more dense frequency points around 90 Hz and between 20 and 8 Hz to really make conclusive statements about all this, but the message is that the "simple" O2 model of the detuning is failing to replicate the features seen in this plant below 100 Hz -- at the 5% level below 20 Hz.

Most of you will argue this level of systematic error is "good enough" for the sensing function.

If you insist, then populate the CAL-CS_DARM_ERR filter (preferably in new pair of filter banks, please) with the following two filter modules.
    SRCD2N: zpk([394.6064;2.3389;-2.3668],[0.1;0.1;7000],1,"n")gain(553.54)
    Gain: gain(2.919e-07)
and set the CAL-CS_DARM_ERR gain to 1.0.

Since Craig updated the CAL-CS gains on the actuator paths (LHO aLOG 47354) with the numbers from LHO aLOG 47331 (which I argued were good on TST, but still bad on PUM), then we can also run and process the DARM Open Loop gain measurement against the model, and predict the level of systematic error that would remain if we updated the sensing function as above.

See that result attached second.
Unsurprisingy, the residual systematic error looks exactly the residual systematic error in the PUM stage reported in LHO aLOG 47331.

However, the flaws are are all below 30 Hz. So theoretically, this he above sensing function is pushed, we should have little-to-no remaining systematic error above that frequency region.

And one more thing -- you'll have to update the delay between the sensing and actuation paths to 7.0 clock cycles.
See that result attached 3rd. This is consistent with what we've used for O1 (LHO aLOG 22117) and O2 (LHO aLOG 33924). The real delay is 6.89 [16kHz clock cycles], and the difference shouldn't result in that much systematic error. I haven't yet had the time to figure out the Joe Betz / Shivaraj generation of a thiran filter (see hints at LLO aLOG 28268) that allows for non-integer delays.
Non-image files attached to this report
Comments related to this report
jeffrey.kissel@LIGO.ORG - 20:38, Thursday 07 March 2019 (47380)
Processing script / function debrief:

The model parameters associated with this data set is
    ^/trunk/Runs/O3/H1/params/modelparams_H1_20190301.py

The script to process the sensing function measurement is
    ^/trunk/Runs/O3/H1/Scripts/FullIFOSensingTFs/process_sensingmeas_20190307.py

The script to compare the DARM OLG TF against the model is 
     ^/trunk/Runs/O3/H1/Scripts/DARMOLGTFs/process_darmolg_20190307.py

The script to report the delay between A and C is
    ^/trunk/Runs/O3/H1/Scripts/CALCS_FE/compute_relativedelay_AvsC_20190307.py

I'm using the latest version of the pyDARM code, which (now committed) is 
    ^/trunk/Common/pyDARM/src/sensing.py        Last Changed Rev: 6824
    ^/trunk/Common/pyDARM/src/actuation.py      Last Changed Rev: 6796
    ^/trunk/Common/pyDARM/src/computeDARM.py    Last Changed Rev: 6788
Current repo version -- Revision: 6813

(If you're on the LHO workstations, the home check out the repo is in "^" = /ligo/svncommon/CalSVN/aligocalibration/)
craig.cahillane@LIGO.ORG - 00:09, Friday 08 March 2019 (47386)
Calibration good to 8% with changes above and tuning using the PCAL BB injection.  We are probably slightly overestimating range, which is now reported as 102 Mpc without squeezing.  
Phasing between PUM and TST acutation stages is wrong, probably causing the humps in the calibration.  PUM and TST crossover is 30 Hz, according to this.
Images attached to this comment
H1 AOS
sheila.dwyer@LIGO.ORG - posted 17:46, Thursday 07 March 2019 (47376)
cross correlation error and apparent discrepancy between CAL_DELTAL and GDS calib strain

There is some kind of a problem with our front end estimation of the cross power spectrum, we are still investigating. 

We found that there was a discrepancy in the inverse sensing gain applied to the sum and null channels for several days, including the time Craig is using above.  We also today found that the calibration of CAL_DELTAL external into meters saved in the dtt template we were using was out of date.  I've updated the calibration using the one that is in the DARM FOM, and saved the new cross corelation template in userapps/isc/h1/templates/ as well as updated the one in the noise budget directory. 

The attached plot shows the problem, the cross corelation seems to be below thermal noise at 200Hz, this was taken at a time when the settings in the front end were correct for the inverse sensing and there was no squeezing.  The blue trace is the DARM noise according to GDS calib strain, while the purple trace is based on CAL DELTAL with the transfer function in the DARM FOM template applied, there is a discrepancy around 200 Hz between the two traces.  We will try to investigate further by running the LLO cross corelation script.

H1 ISC
jenne.driggers@LIGO.ORG - posted 16:25, Thursday 07 March 2019 (47374)
Another reason to move ADS to lower freq - avoid glitches

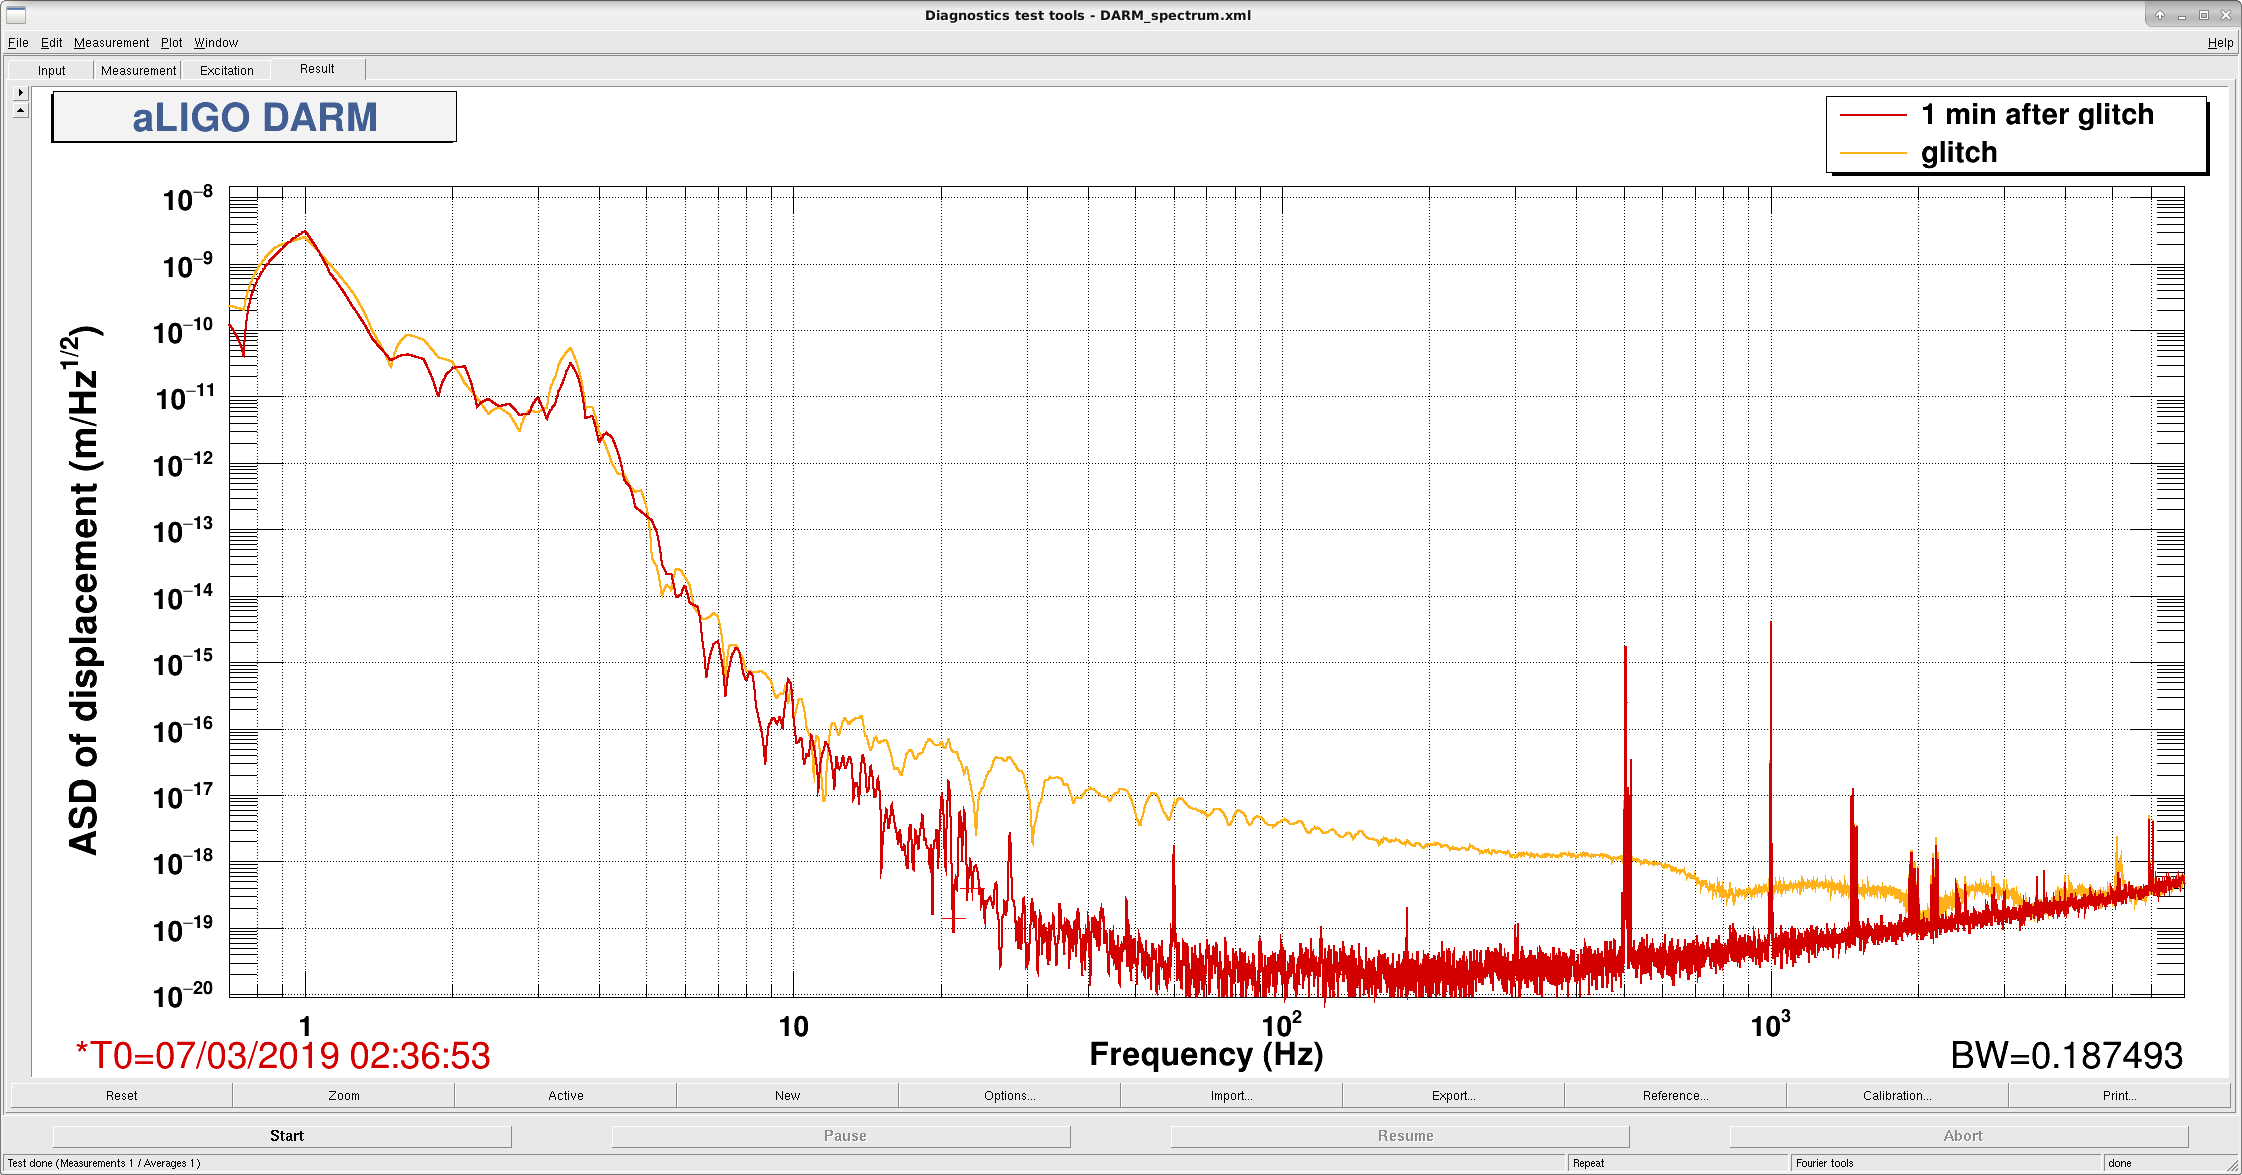
Any time that there is either a big measurement, or any kind of glitch (including when the squeezer beam diverter is opened / closed, or our regular mysterious glitches), the ADS dither lines around 20 Hz get drowned out, and the ADS starts to pull the PRM and the arm SOFT degrees of freedom to weird places. 

We've put turning off the ADS loops into the NLN_CAL_MEAS state, which we (should be) going to for any measurements, but if there's a glitch or other unexpected noise that lasts for more than a few seconds it's possible that we won't notice (to turn the ADS off) and we'll lose lock.  In the attached screenshot of a glitch time versus a quiet minute later, we see that the lower frequencies that we'd been trying to go to aren't as effected by the glitch, so we could perhaps survive some fraction more locklosses. 

Having said this, let me emphasize that most glitches are brief enough that the arms will get a bit of a wobble, but then we'll have good ADS error signals again, and be back in business without any trouble or lockloss.  Moving the dither lines should't become our new #1 priority, since lockloss  from them happens fairly rarely.  However, it should remain on our to-do list for during the run.

Images attached to this report
LHO General
corey.gray@LIGO.ORG - posted 15:59, Thursday 07 March 2019 (47360)
DAY Operator Summary

TITLE: 03/07 Day Shift: 16:00-00:00 UTC (08:00-16:00 PST), all times posted in UTC
STATE of H1: Commissioning
INCOMING OPERATOR: None
SHIFT SUMMARY:

Rode through a few earthquakes at beginning of the shift and went through the EARTH_QUAKE STATE state in SEI_CONFIG (see Jim's alog).  It was cool to toggle between this state and be able to lock AND also stay locked at POWER_30W.

ISC Locking Note:  Violin modes have been noisy lately so have been skipping the OMC_WHITENING state: 

While in NLN later, Sheila mentioned SRC1 P&Y signals are biggest out of the ASC Control signals; Sheila mentioned a boost filter might do the trick for optimizing these signals.
LOG:

H1 CAL (DetChar, FRS, ISC)
jeffrey.kissel@LIGO.ORG - posted 14:48, Thursday 07 March 2019 - last comment - 17:06, Friday 08 March 2019(47372)
H1 PCAL EY CAL Line Amplitudes Set too High -- Looked Broken, Now Fixed
J. Kissel, (R. Savage, S. Karki,  Y. Lecoeuche #PCALTeam), (J. Driggers, S. Dwyer #CommissioningTeam)

This afternoon, after the commissioning team hard-coded the information about the calibration lines into the Guardian such that they stick (47369), they found that the PCAL had gathered all sorts of nasty combs and harmonics, and was actually causing physical displacement in DELTAL_EXTERNAL.

Upon review by myself and the PCAL team (suspecting come terrible amount of clipping because the transmitted beam mount had become misaligned again; see LHO aLOG 47336), we tried
- turning OFF all PCALY calibration lines (all features disappeared, but returned when re-engaged)
- turning OFF all PCAL calibration lines, and turned off the Optical Follower Servo (this turns OFF the entire PCAL demodulation system so all light disappeared, but features returned after re-engaging the OFS and calibration lines)
- turned OFF 9.73 Hz line, leaving others on -- some harmonics of the nastiness disappeared.
This clued in Rick / Sudarshan to suspect that the optical follower servo's OFFSET that keeps the modulated output in the middle of the range of the AOM driver, had been set too high, or potentially, equivalently, the PCAL Y laser was dying (such that the existing offset was too high for the now lower power laser).
However, similarly, it could be that we simply were requesting too much drive level, equally saturating the linear region of the OFS / AOM.

So, I compared the current requested amplitudes, against what I want them to be (changed Sep 2018, but since then there has been no reason for them to change) -- see LHO aLOG 43964. This was the problem:
PCAL Line (Hz)       Should be (ct)     What it was (ct)      Channel that controls it
    7.93                 5000               5000                  H1:CAL-PCALY_PCALOSC4_OSC_SINGAIN
    36.7                 1000               1000                  H1:CAL-PCALY_PCALOSC1_OSC_SINGAIN
    331.9                20000              20000                 H1:CAL-PCALY_PCALOSC2_OSC_SINGAIN
    1083.7               5000               20000                 H1:CAL-PCALY_PCALOSC3_OSC_SINGAIN

I attach ASD of the RXPD in several configurations. 
Gray -- what we were seeing that caused everyone to launch this investigation. Lots of non-linear harmonics.
Green -- "what it should be" from above, but with the amplitude of 7.93 Hz line reduced by 5. No non-linear harmonics.
Red -- "what it should be" from above. Some non-linear harmonics, but none peaking above the noise floor.

We're now running in the Red configuration.

We all checked the SDF system which should have caught this mistake but it did not reveal that the amplitudes were in error, which means, somehow, the higher amplitude settings were accepted into the SDF system. Who knows. I've now accepted the "should be" amplitudes into both the safe.snap and OBSERVE.snaps.

Since there are some non-linear harmonics in this configuration (in which the 7.93 Hz line is at the higher, 5000 ct amplitude, which we need at this SNR of ~10 in order to resolve the SRC detuned spring frequency), we should probably see if the OFS OFFSET can be tuned a bit, so we're not skating along the non-linear rails.
Images attached to this report
Comments related to this report
jeffrey.kissel@LIGO.ORG - 17:06, Friday 08 March 2019 (47408)
Associated with open-and-closed ticket LHO aLOG 12491, but may need a LONGTERMFIX to the OFS offset to fit the requested drive within the linear range.
H1 SEI (OpsInfo)
jim.warner@LIGO.ORG - posted 13:49, Thursday 07 March 2019 - last comment - 15:10, Thursday 07 March 2019(47366)
Good tests of SEICONF EARTH_QUAKE state this morning, seems to work

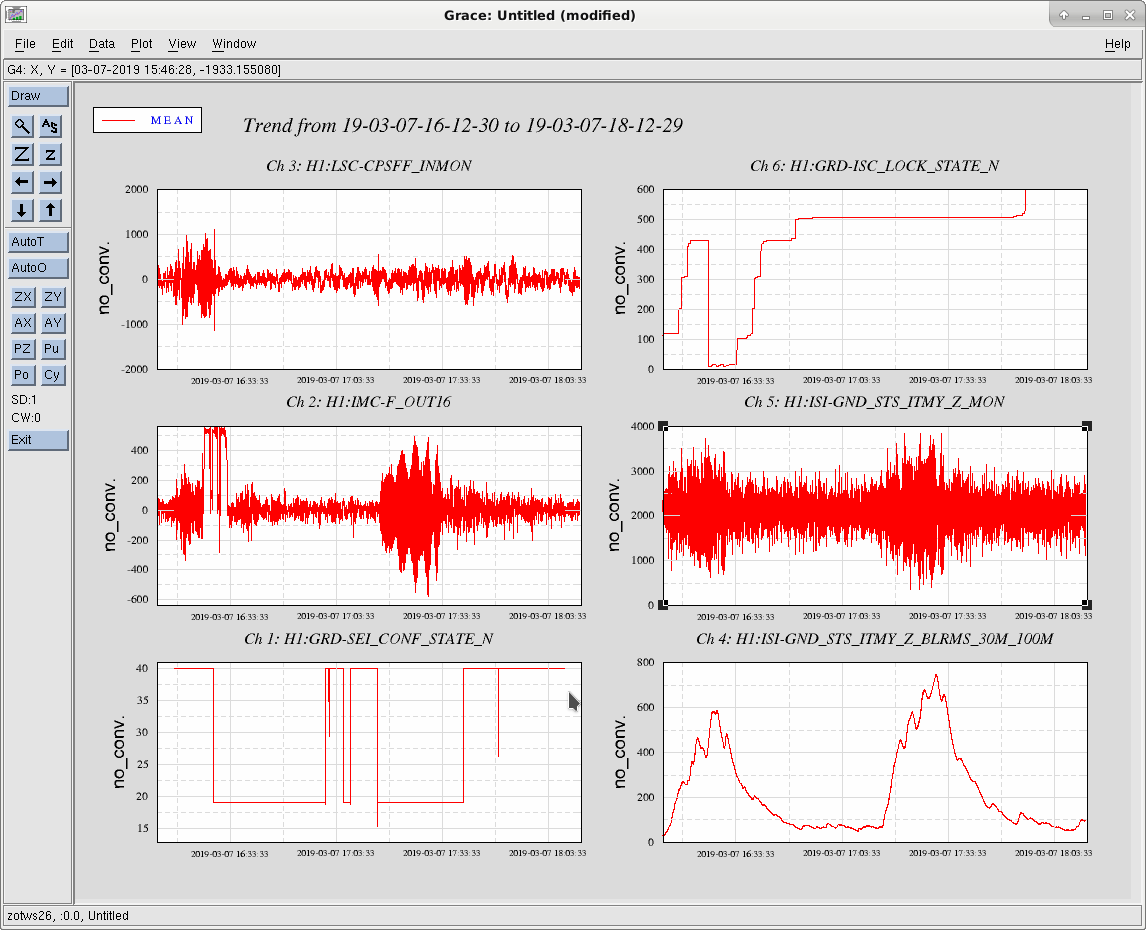
When I arrived on site this morning, Corey had just lost lock due to a couple earthquakes, one 5.5 from New Zealand and a 5.7 in Chile, which arrived on site at about the same time. The ground was still settling down, he was not really trying to lock, but ALS was having difficulty. I asked him to switch SEI_CONF to the EARTH_QUAKE state (this is NOT the big red button, this is a state in the SEI_CONF guardian) , which changes the sensor correction path to a sensor correction path that uses a local differential ground for isolation. The differential signal is calculated by subtracting a common ground, which is the average of all 3 VEA (ends and corner) ground seismometers, from the local ground sensor. Because of the way this subtraction is done, this reduces the isolation at the microseism, so this state will probably only help when the microseism is low. After making the switch, Corey was able to start locking again, even though the ground motion was still well over 100 nm/s rms in .03-.1hz band. We usually wait for the ground to get below 100 nm/s. After he got to somewhere around DC Readout, we switched back and forth from WINDY to EARTHQUAKE and were able to stay locked through both transitions. Around this time we got another earthquake notification from New Zealand. When this earthquake started affecting the the interferometer, we switched back to the EARTH_QUAKE state, and were able to ride this second, somewhat larger quake out with the interferometer in a robust state.

Here is a timeline:

March 7 2019, times are UTC

16:12 First set of earthquakes arrive

16:25 Lockloss

16:29 Switch SEICONF to EARTHQUAKE

16:33 ALS locks, RMS ground motion is around 300nm/s

17:00 Transition back to WINDY

17:05-17:07 Transition to EARTH_QUAKE and  back to WINDY. EARTHQUAKE is noisier, but in POWER_30W this doesn't break the lock. Around this time we get another earthquake notification from New Zealand, a 5.7 this time, we got something like 15 minutes early warning for the R waves.

17:15 We start seeing more low frequency noise in the IFO (I think I was watching the LSC CPS FF channel) as the second earthquake arrives, so we transition to EARTH_QUAKE again. IFO sees more microseism in ASC, IMCF, ETMX SUS length drive, but I don't think we see as much low frequency as we would see in the nominal configuration. This earthquake is a little bigger than the first earthquake, but we ride it out. ISC_LOCK stays in POWER_30W for the duration.

17:39 Ground RMS is back down to about 200nm/s rms, we transition SEICONF back to WINDY.

All of these steps are shown in the attached trend. 40 is the WINDY state for SEICONF, 20 is the EARTH_QUAKE state number.

A few notes:

All earthquakes were in the 5.5-6.0 magnitude and roughly 10,000 km away. Peak eq band rms velocities were around 1 micron/s.

The only seismic configuration change was selecting the EARTH_QUAKE state in SEI_CONF, not the big red button or the LARGE_EQ state. This state also doesn't change the added gnd Z to HAM3 and HAM4 feedforward. I tried turning the HAM3 ff off and on during the second earthquake, but I didn't see any difference in IMC F.

The IFO stayed in POWER_30W for the second earthquake, which is before low noise coil drivers and low noise ASC, so the IFO controls were in a pretty robust state. Jenne suggests we can look at various drives to see if this we could stay locked during low noise.

This will probably only work with low microseism. Right now peak rms velocities are about .3 micron/s. I would guess that this might work up to around .5 micron/s rms, we more or less loose all of our microseismic isolation, and .5 micron/s was about the highest velocity we could handle during O1 with blends that similarly didn't suppress the microseism.

Both of these earthquakes were just under 1 micron rms in the .03-.1hz band. During the lock with the second earthquake we got a notification of some IMC SERVO voltage being high, which I think means that something in CARM may ultimately be the limit on our ability to ride out an earthquake.

The wind was also up around 20 mph during this time, I'm sure it didn't make this easier, but it didn't seem to be a problem for us.

The sensor correction ramp times are set at 15 seconds, this seems to work ok, might be ok to go shorter. Because the EARTH_QUAKE state changes the BSC ST1 Z blends to 250mhz blends form 45mhz blends, it takes around a minute for the total SEICONF transition to complete. Going the other way takes 2 minutes to turn the 45mhz blends back on. This didn't seem to cause any problems for the IFO. No other blends are changed going from WINDY to EARTH_QUAKE.

Images attached to this report
Comments related to this report
brian.lantz@LIGO.ORG - 14:17, Thursday 07 March 2019 (47370)

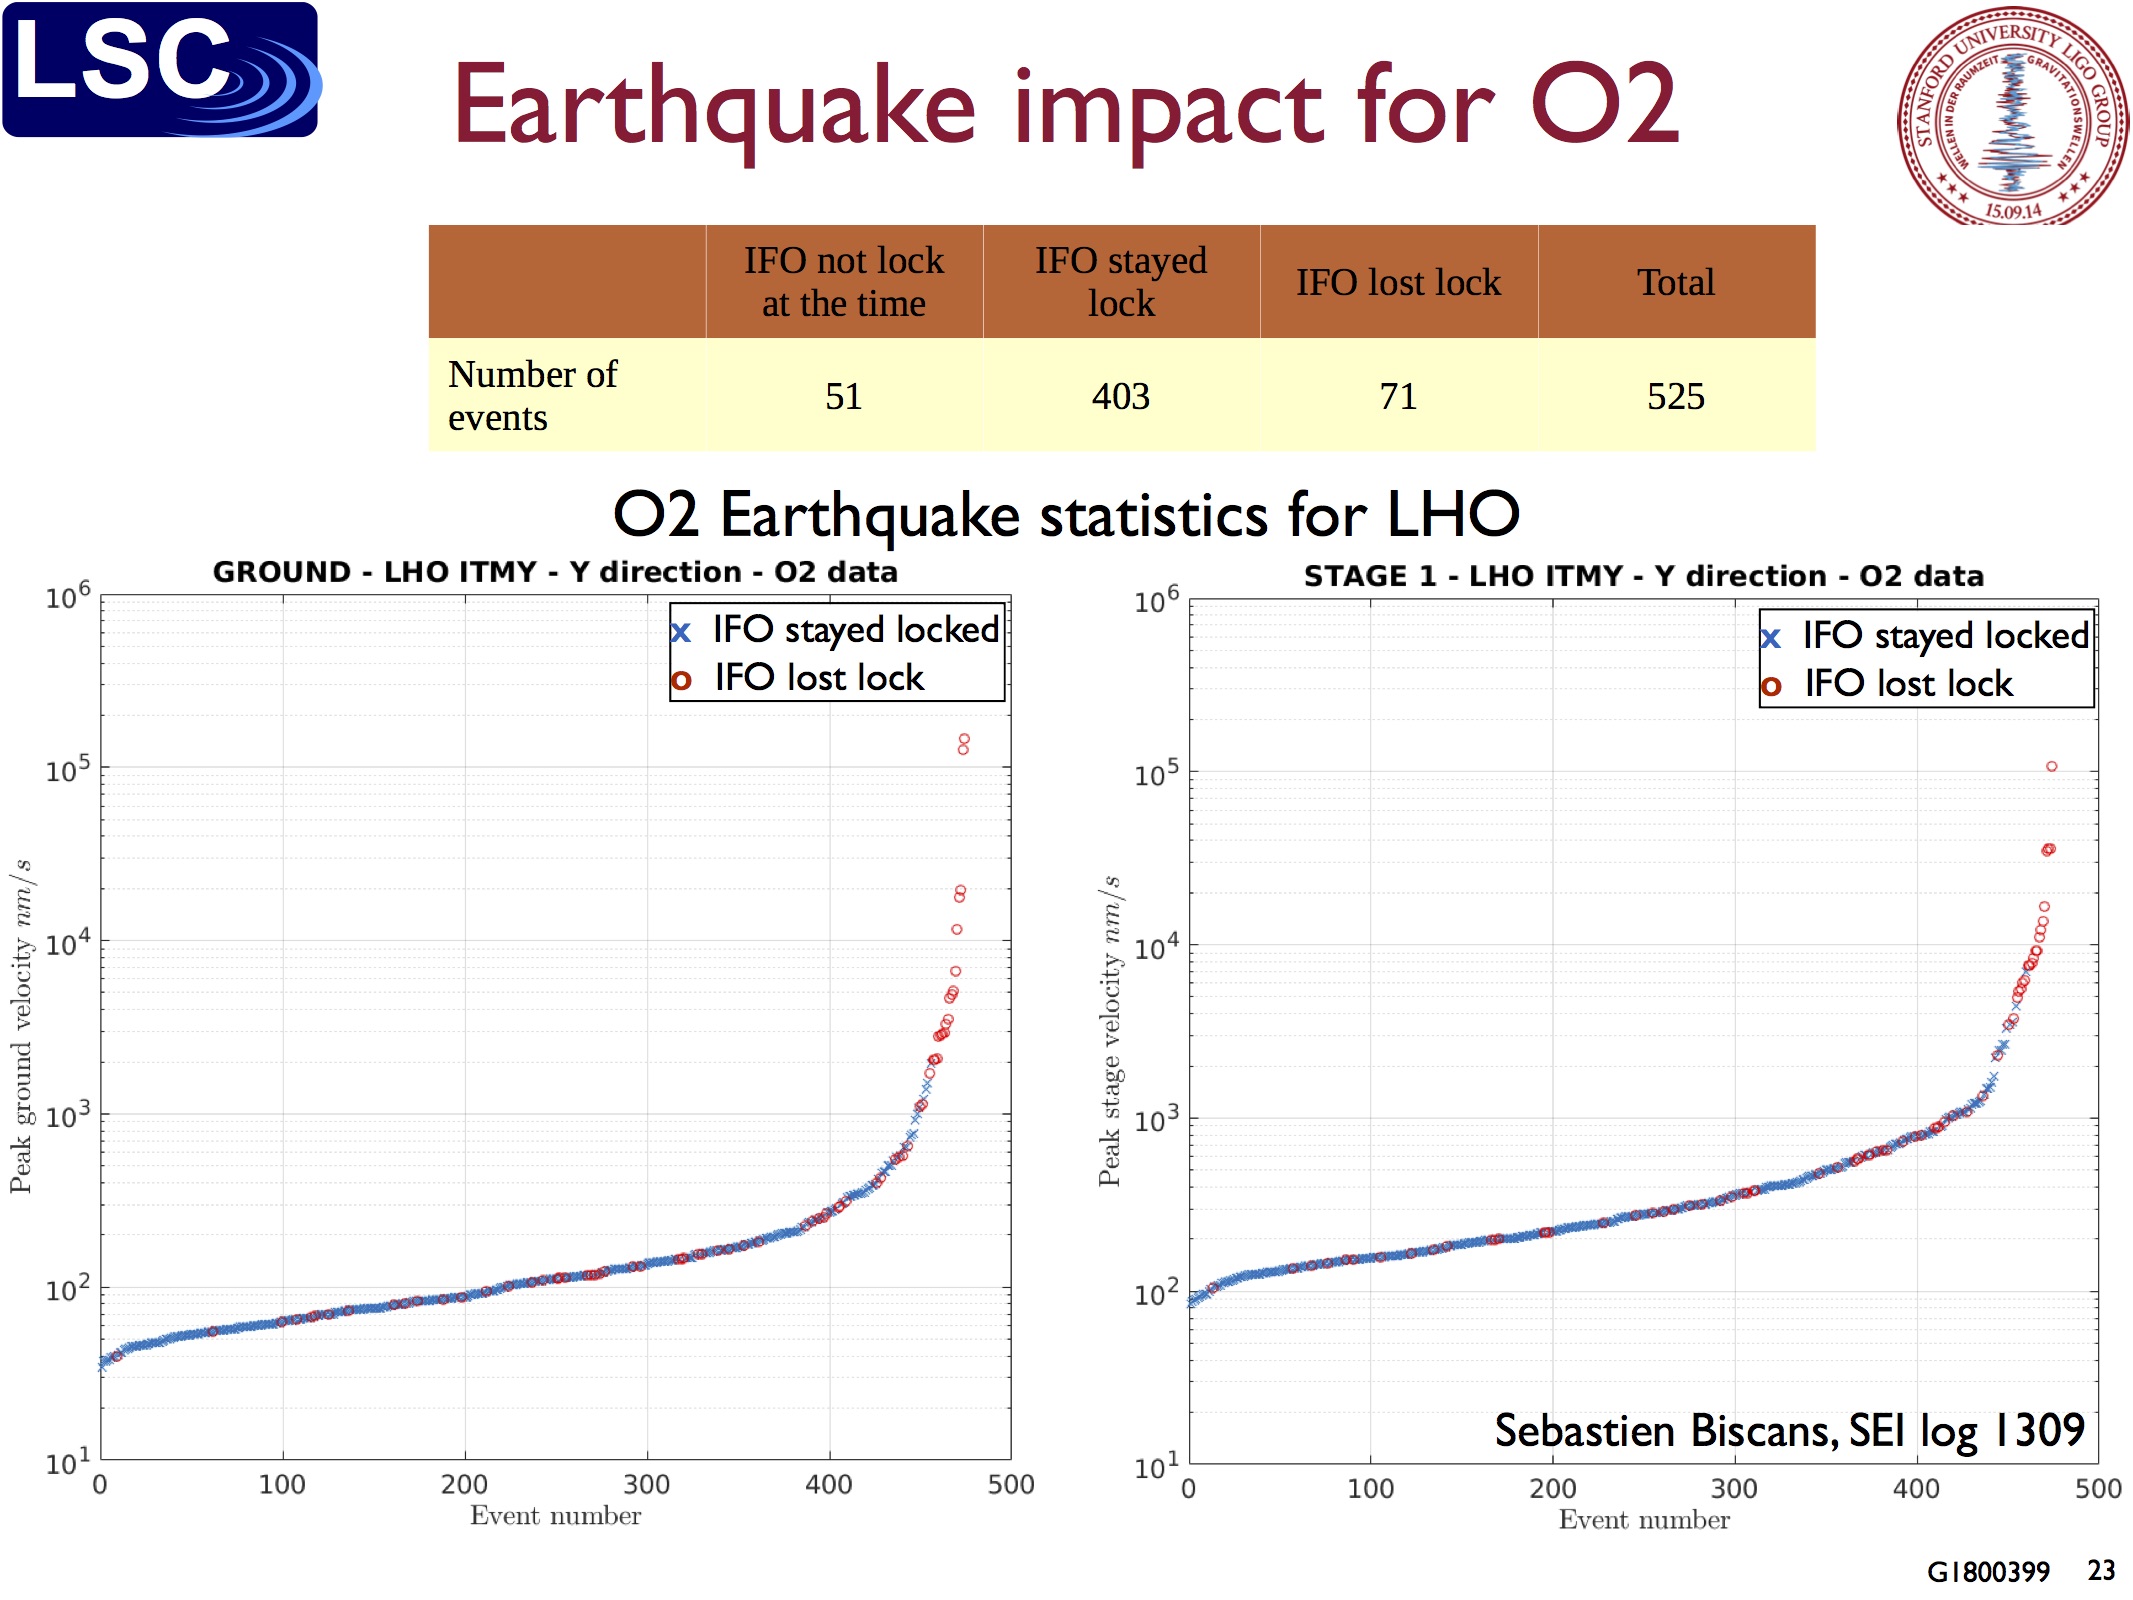
Nice work Jim, Corey, TJ, et. al. I've attached a plot from Sebastien's SEI log 1309, which shows that at a PEAK velocity in the Y direction of 2 microns/ sec the IFO can't stay locked, and that at a peak of 1 micron/ sec it stayed locked some of the time - so this is very encouraging news.
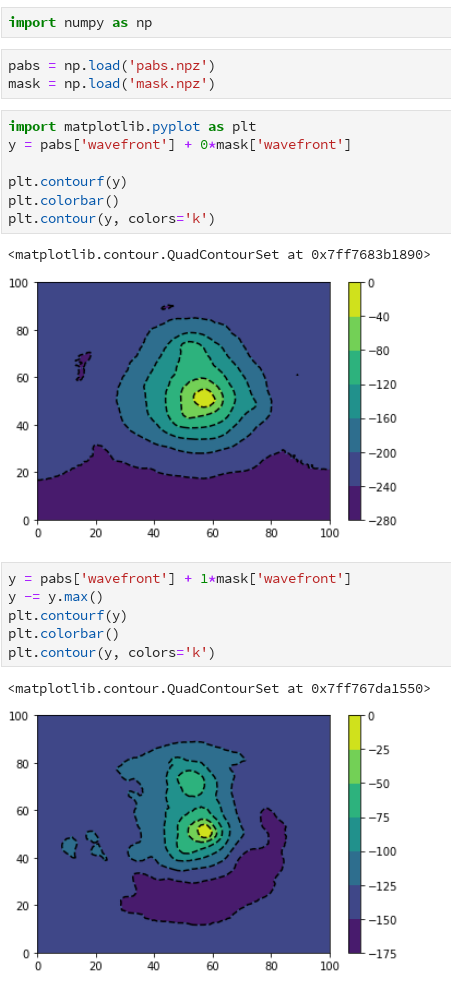
Interesting comments about the impact of the microseism and the wind. The differential isolation against the microseism should be a bit better, but you are seeing the real performance in the IFO as a bit worse - interesting. Also the injection of tilt at 10- 20 mHz should be much worse, so I'm pleased that it worked w/ 20 mph wind. Credit to the BRS and big loop gain of the IFO controls, I suppose.

Images attached to this comment
jim.warner@LIGO.ORG - 15:10, Thursday 07 March 2019 (47373)

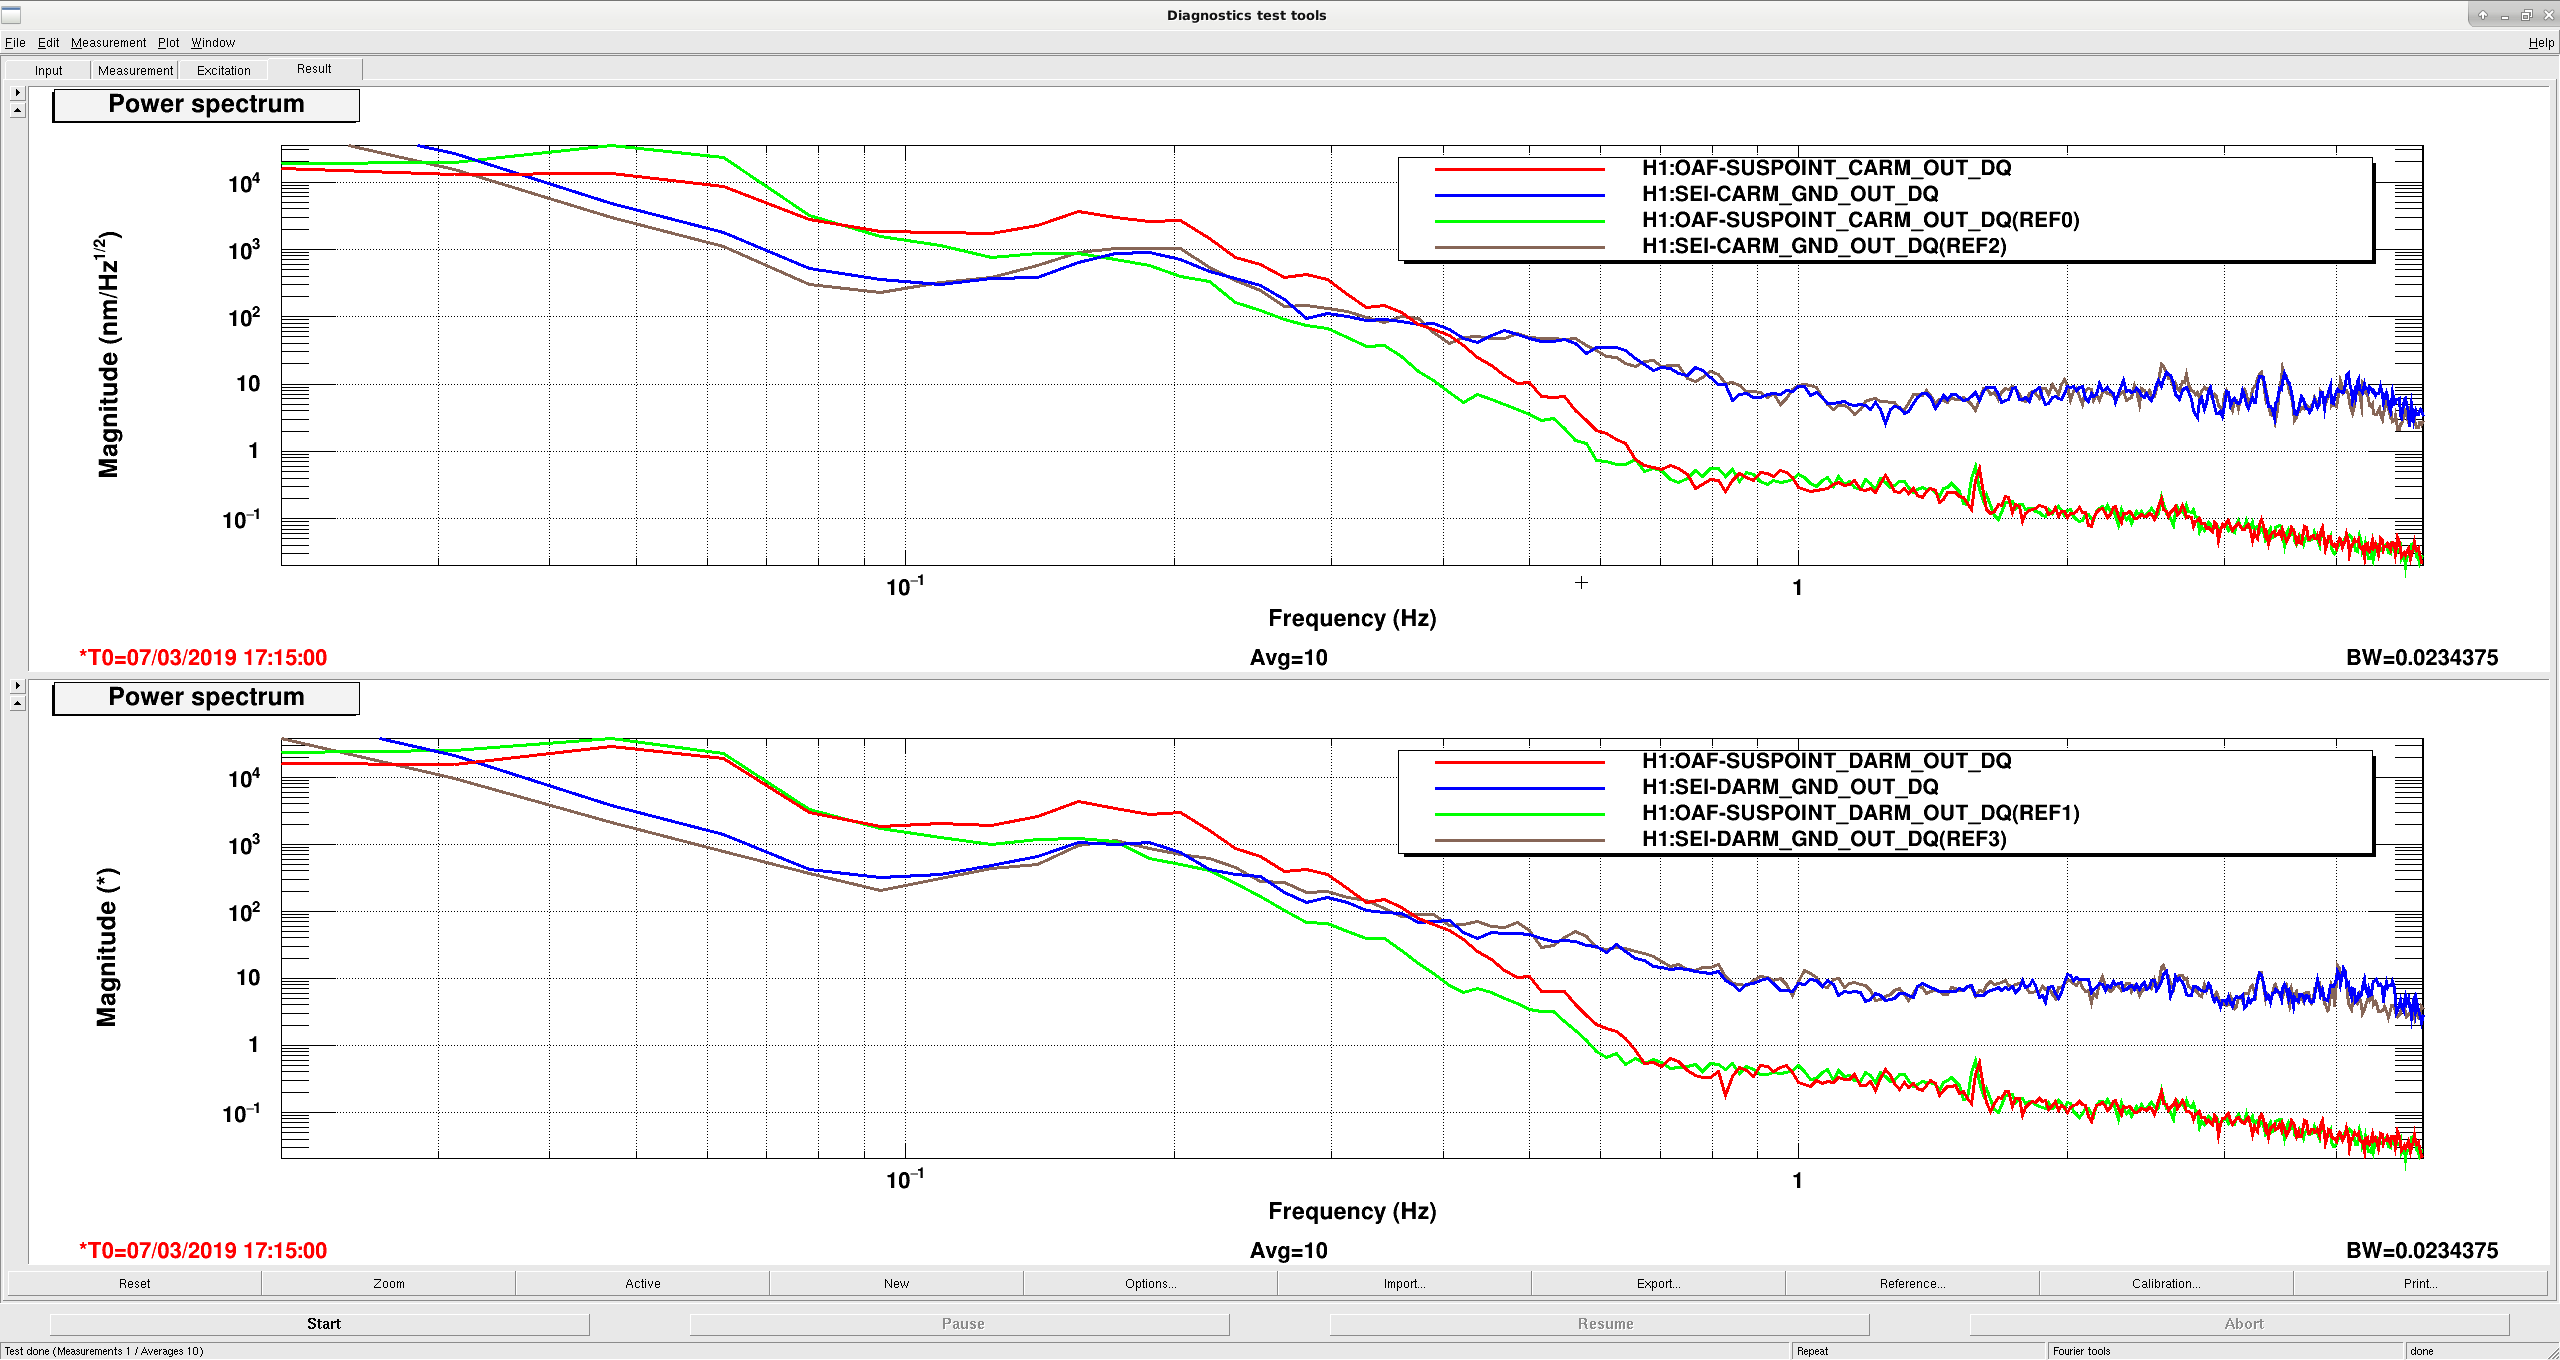
I'm adding spectra to try to capture the performance of the ISIs during these two earthquakes. The channels I looked at are the ground CARM and DARM reconstructions and the OAF SUSPOINT CARM and DARM reconstructions using the ISI gs13s. These spectra are taken during the first several minutes of each earthquake, the references are from the first earthquake, where we stayed in the nominal configuration, the live traces are during the second earthquake where we were running the EARTH_QUAKE configuration.

The top plot are the CARM channels, and you can see comparing the red and gold trace, that the earthquake mode reduces the very low frequency (around .05 hz) CARM motion by about a factor of two, but the above .1hz motion is increased a lot, almost an order of magnitude. 

The bottom plot shows that the very low frequency DARM table motion doesn't see very big difference, again comparing the red and gold traces, but the above .1 hz motion is made worse, to about .5 hz.

These results make me wonder if the low pass used to compute the common mode ground signal should be tweaked. Somewhere I've done some modeling of this, BrianL has also worked on this. I just wish that there was more frequency space between the earthquake band and the microseism.

Images attached to this comment
H1 SEI (SEI)
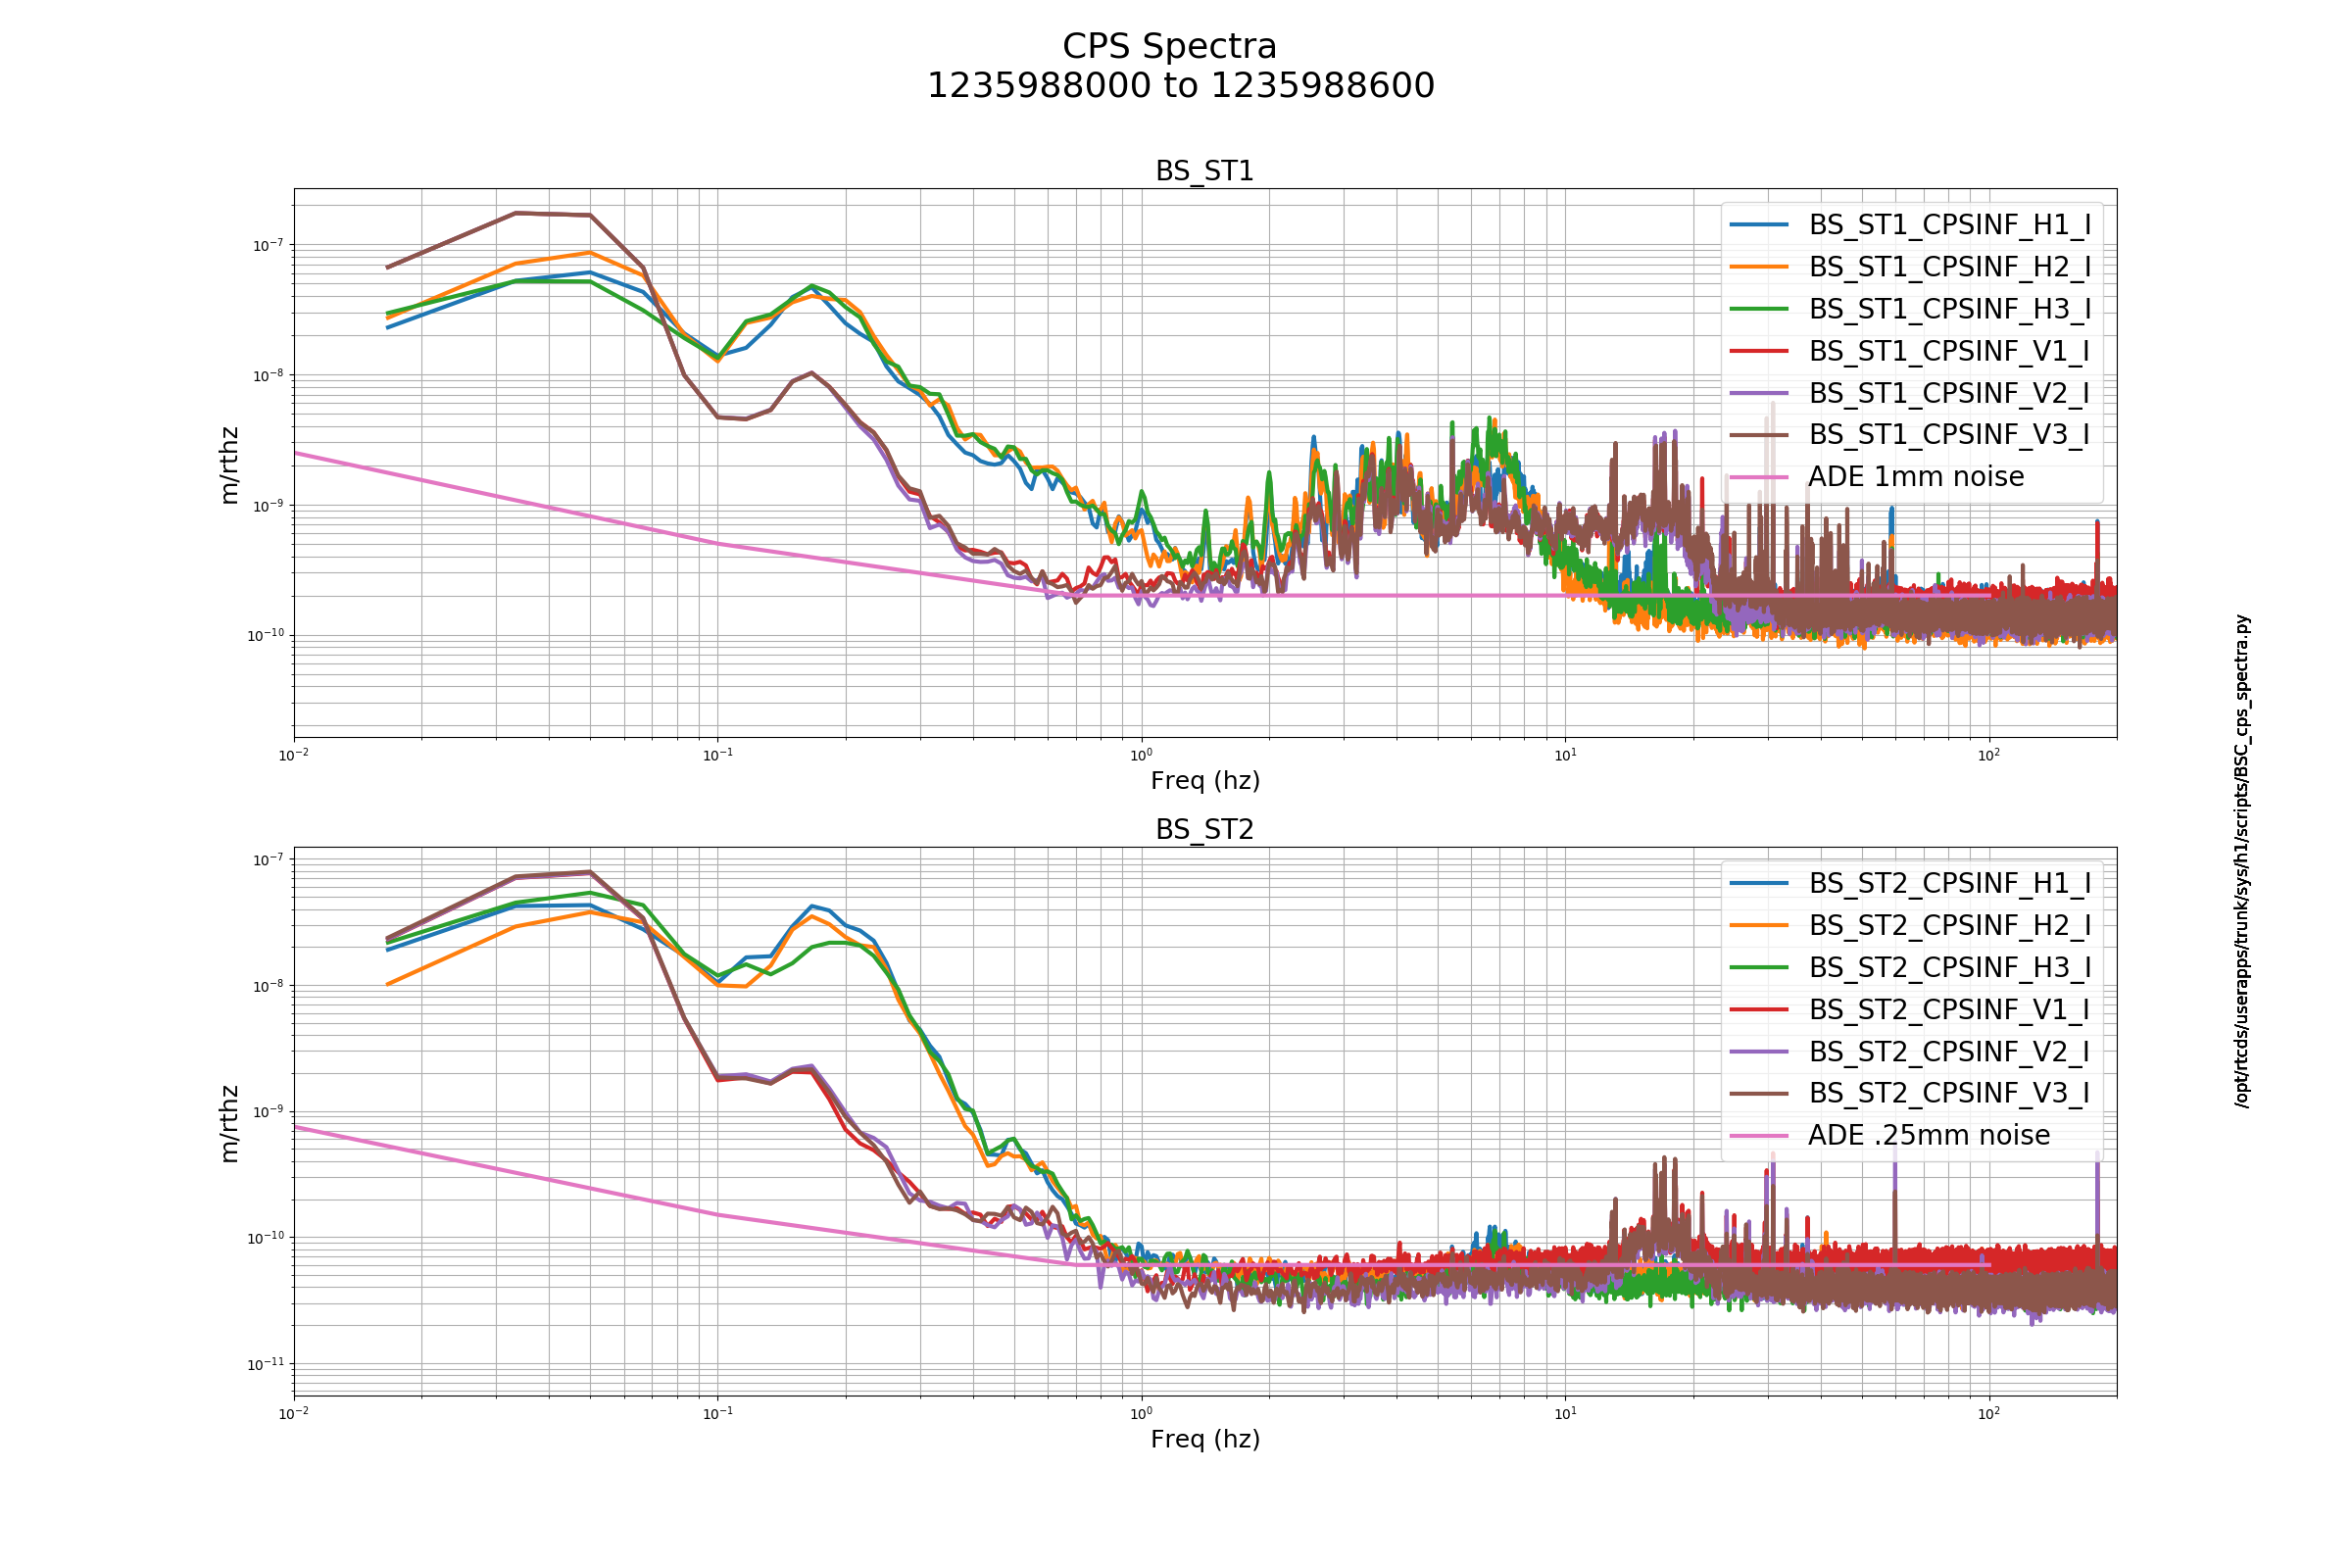
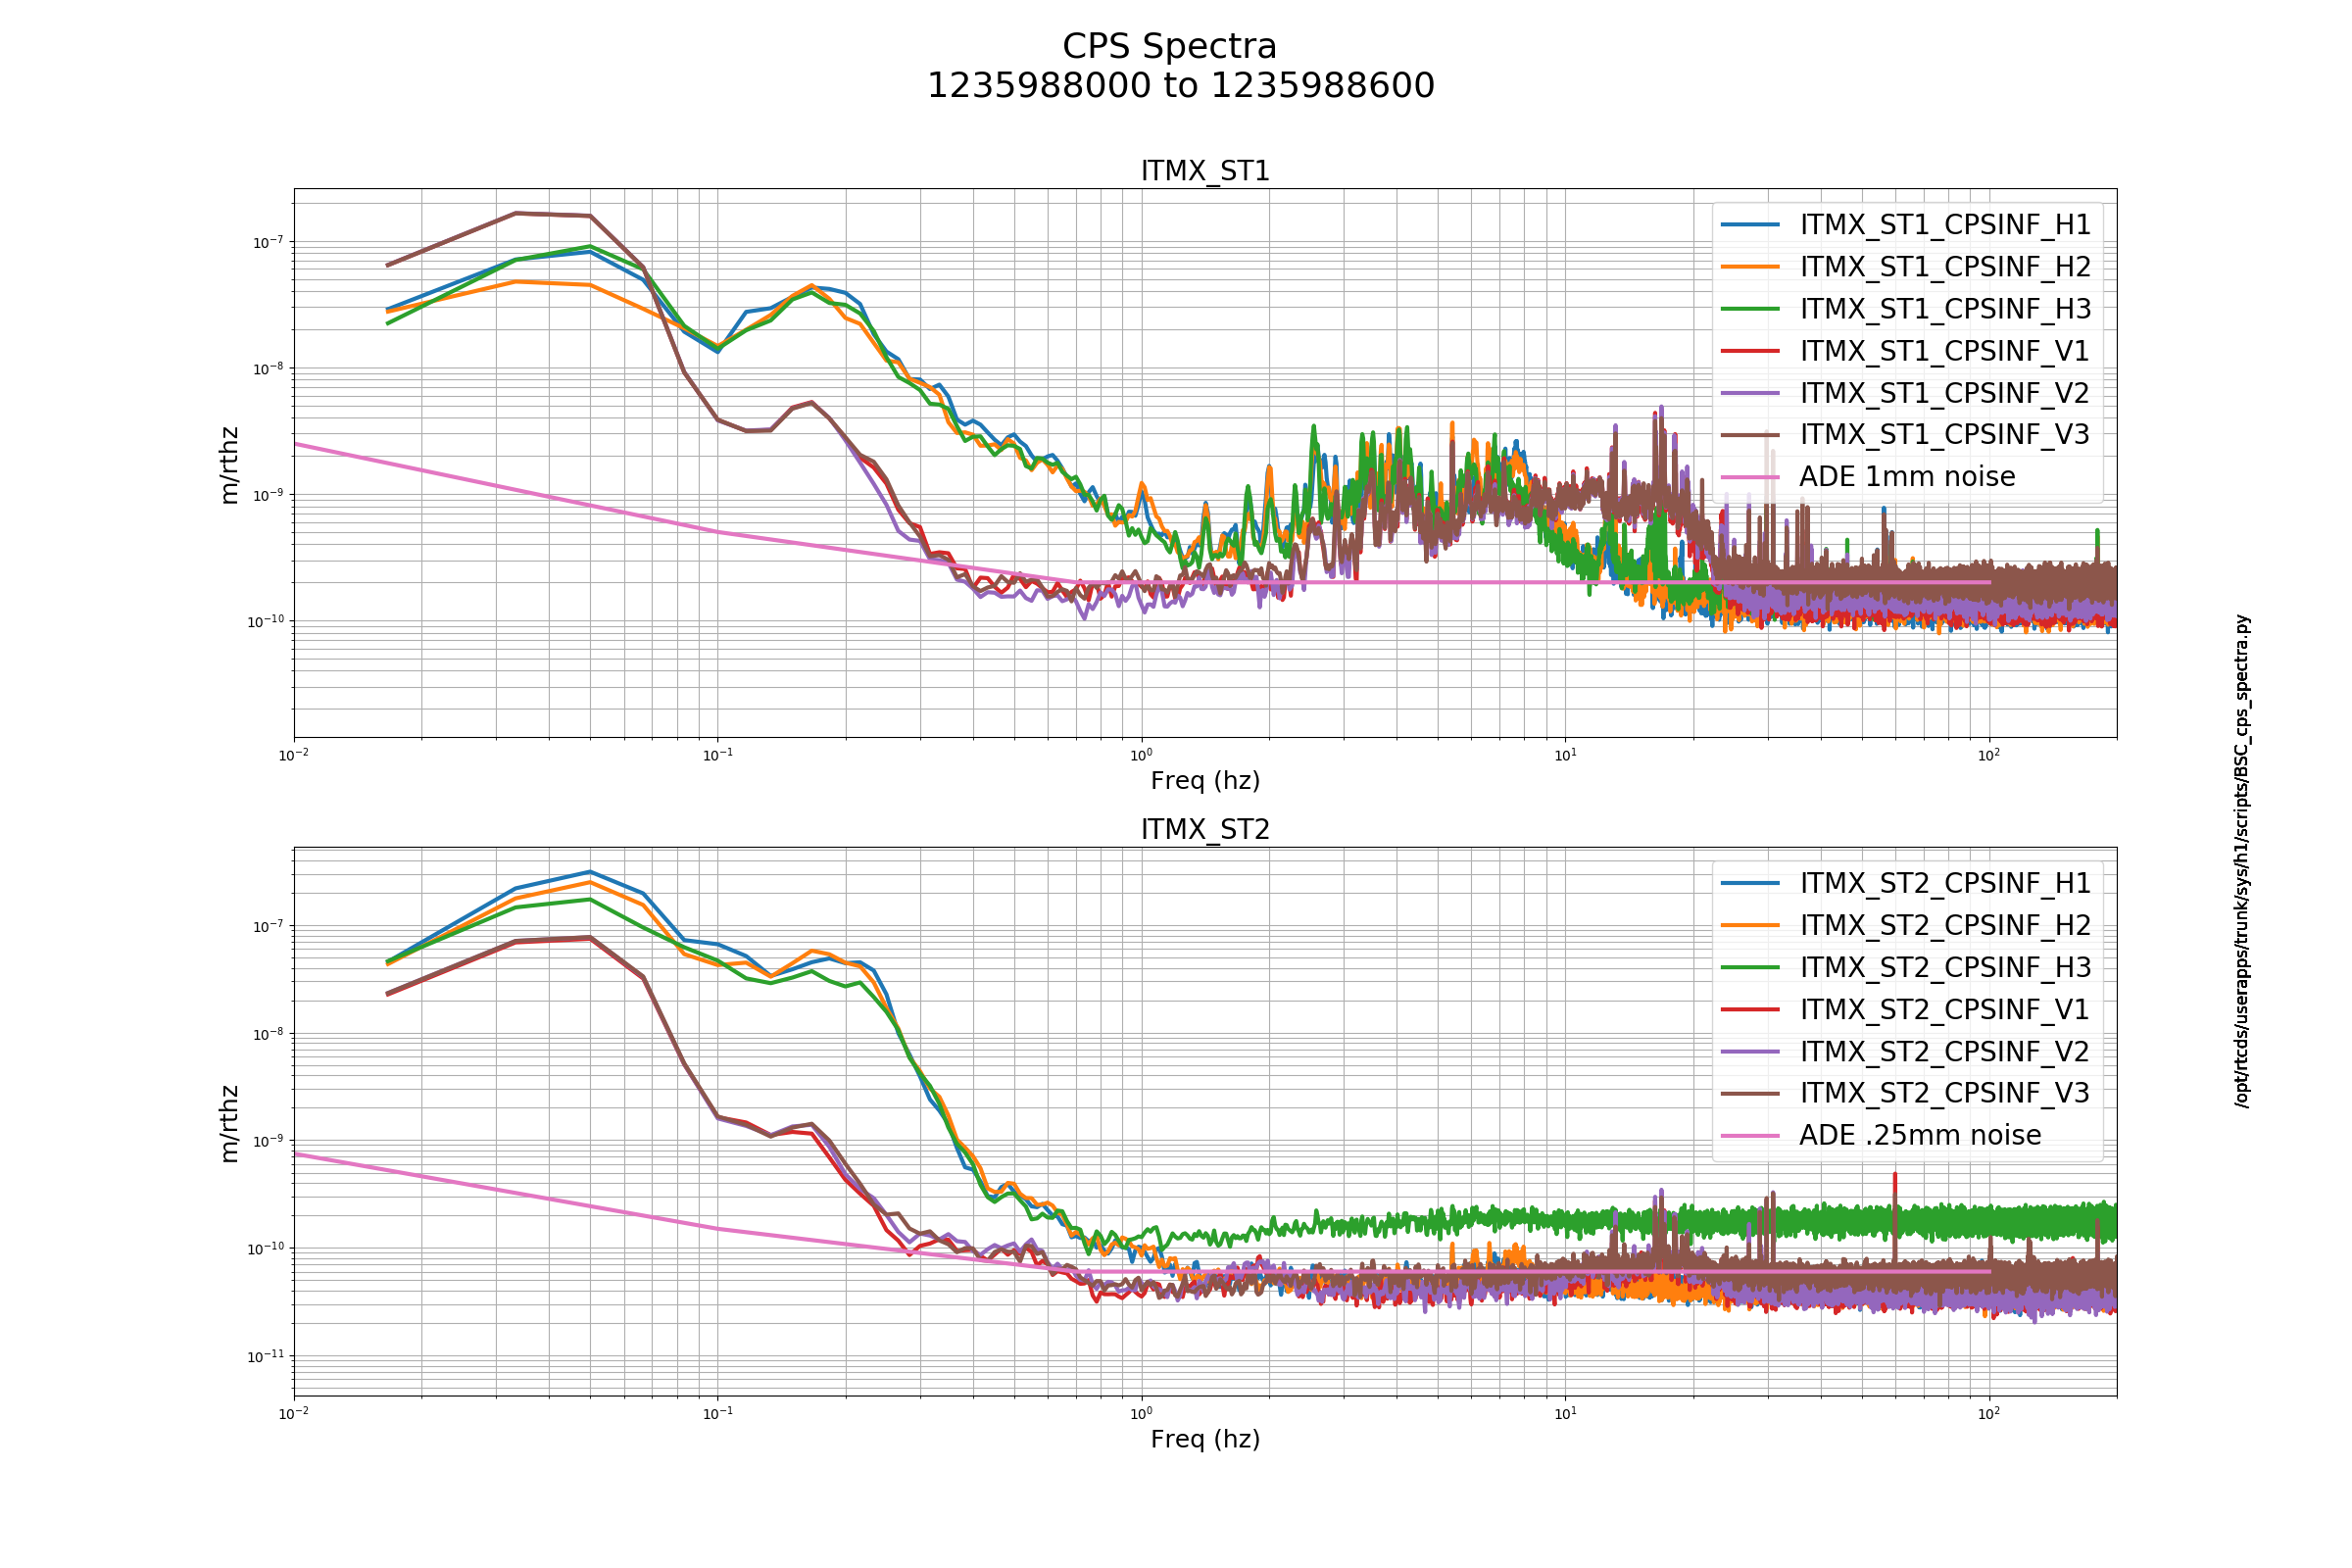
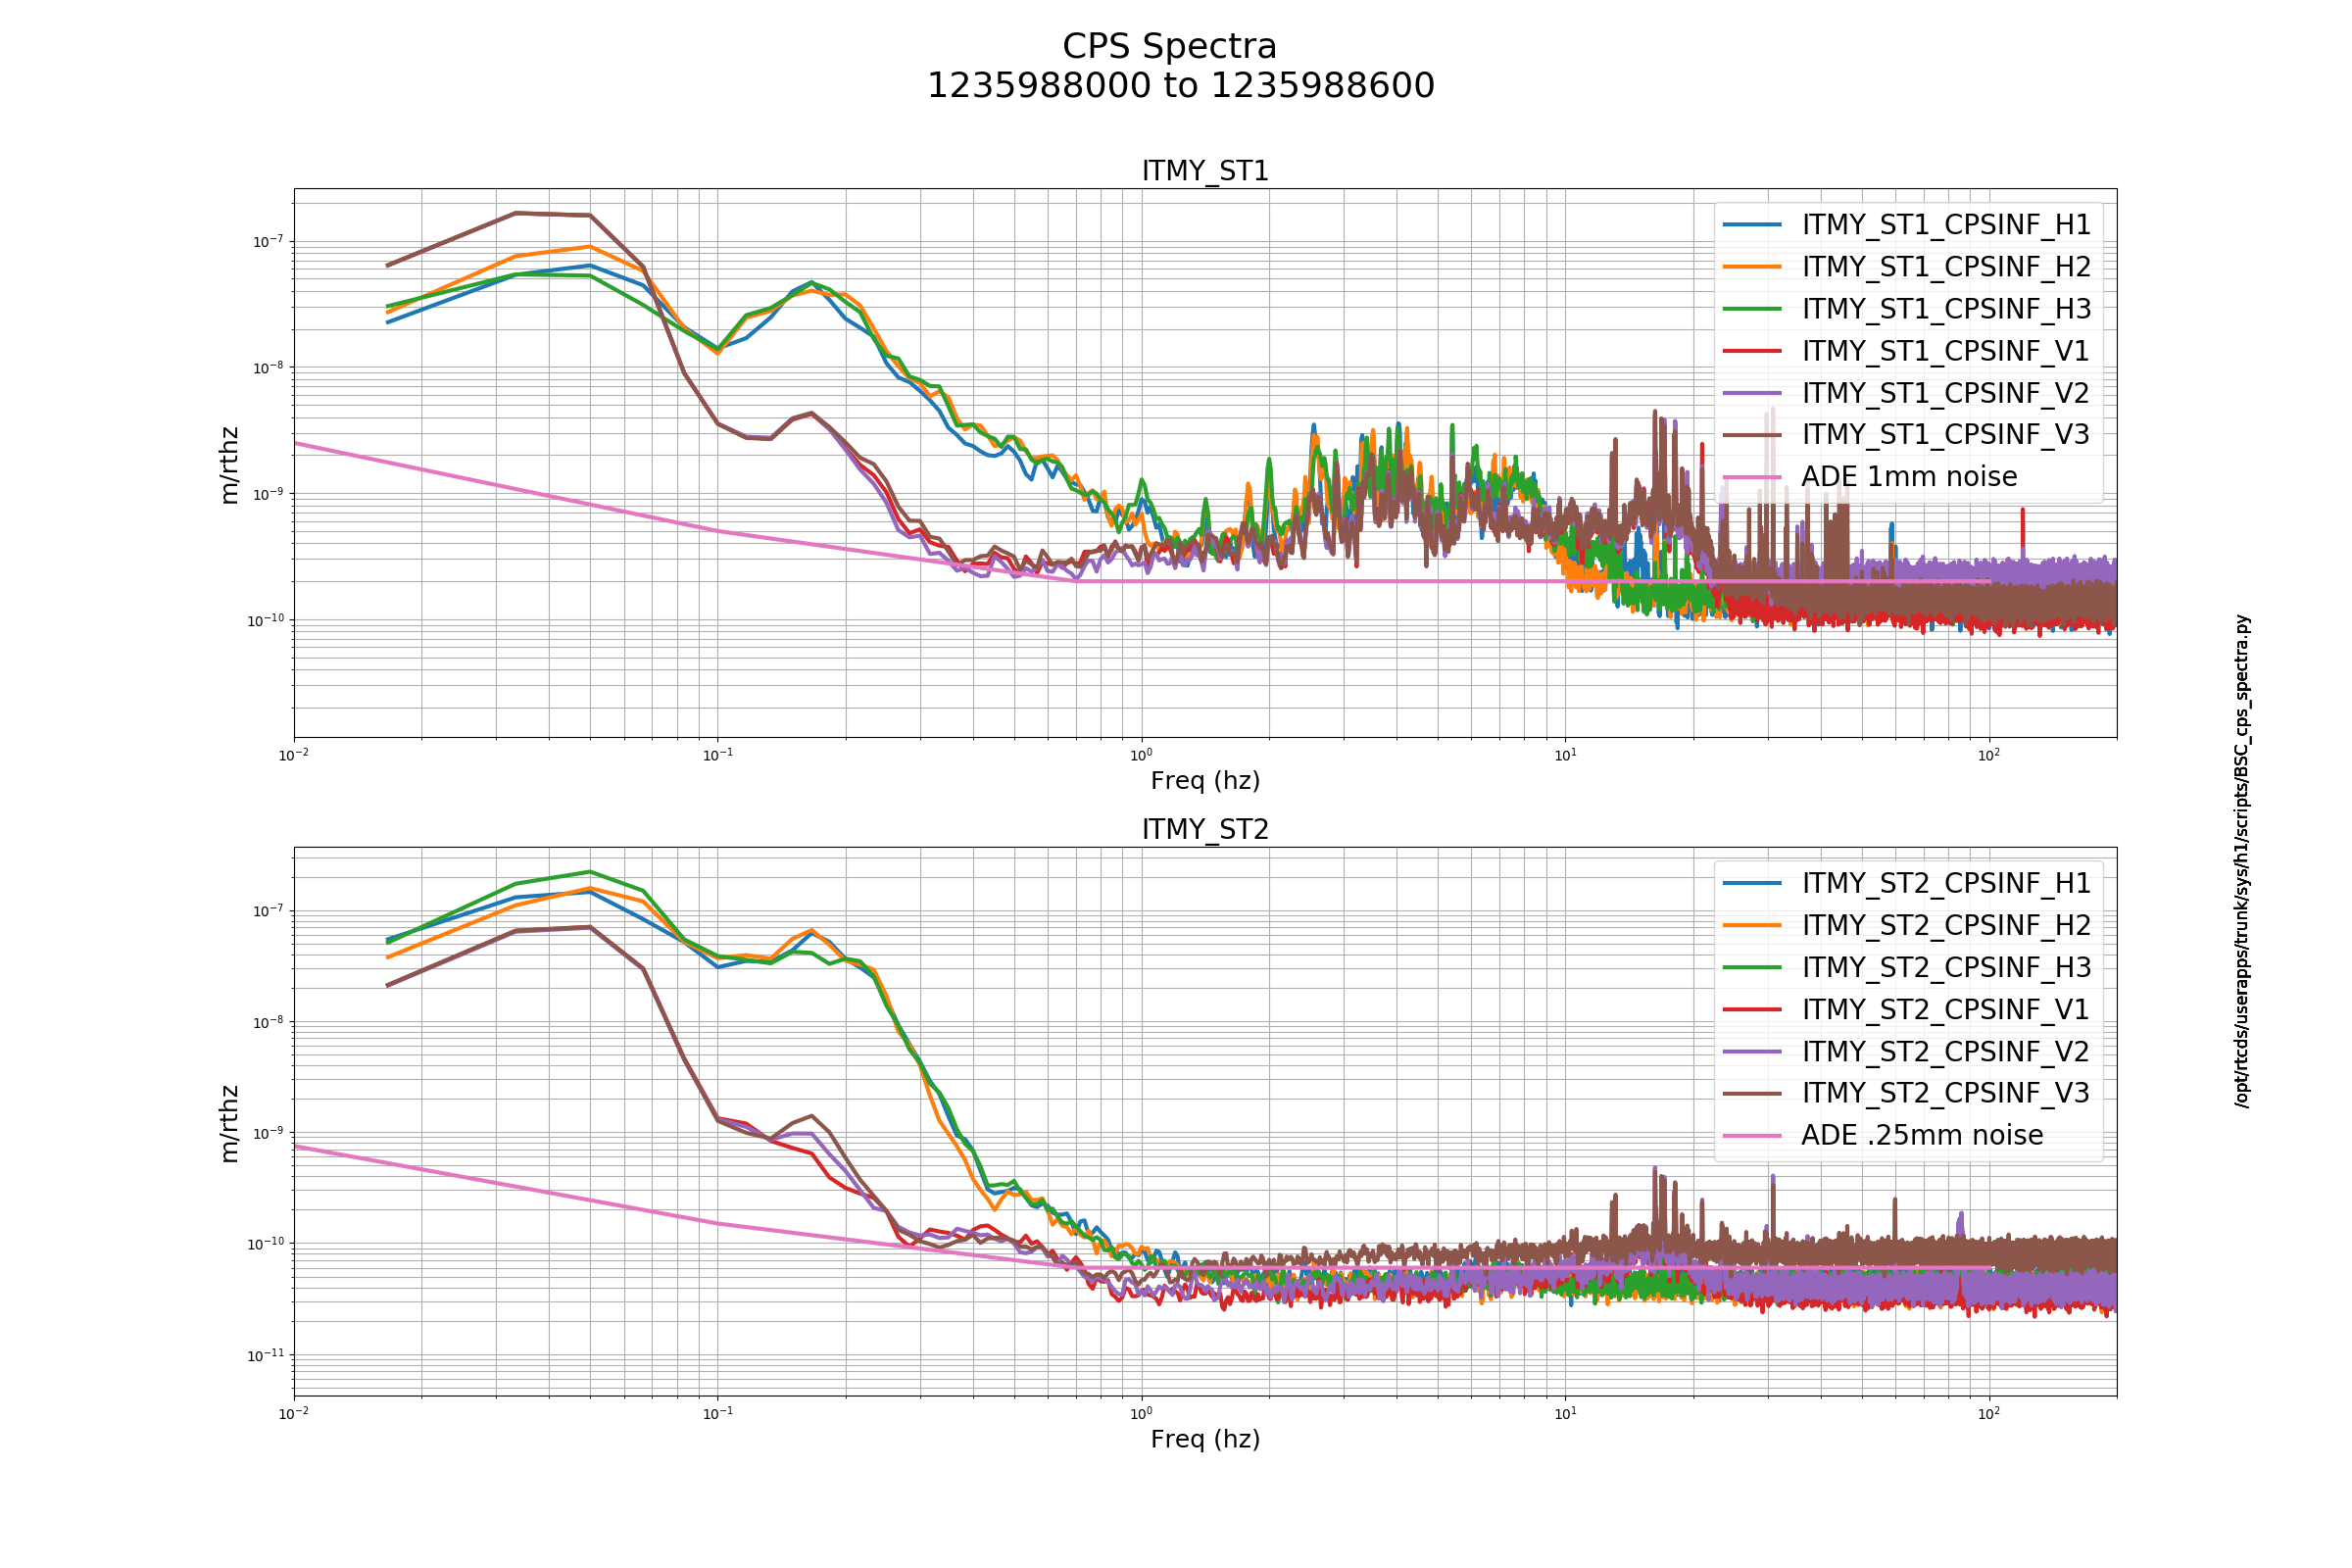
corey.gray@LIGO.ORG - posted 12:18, Thursday 07 March 2019 (47368)
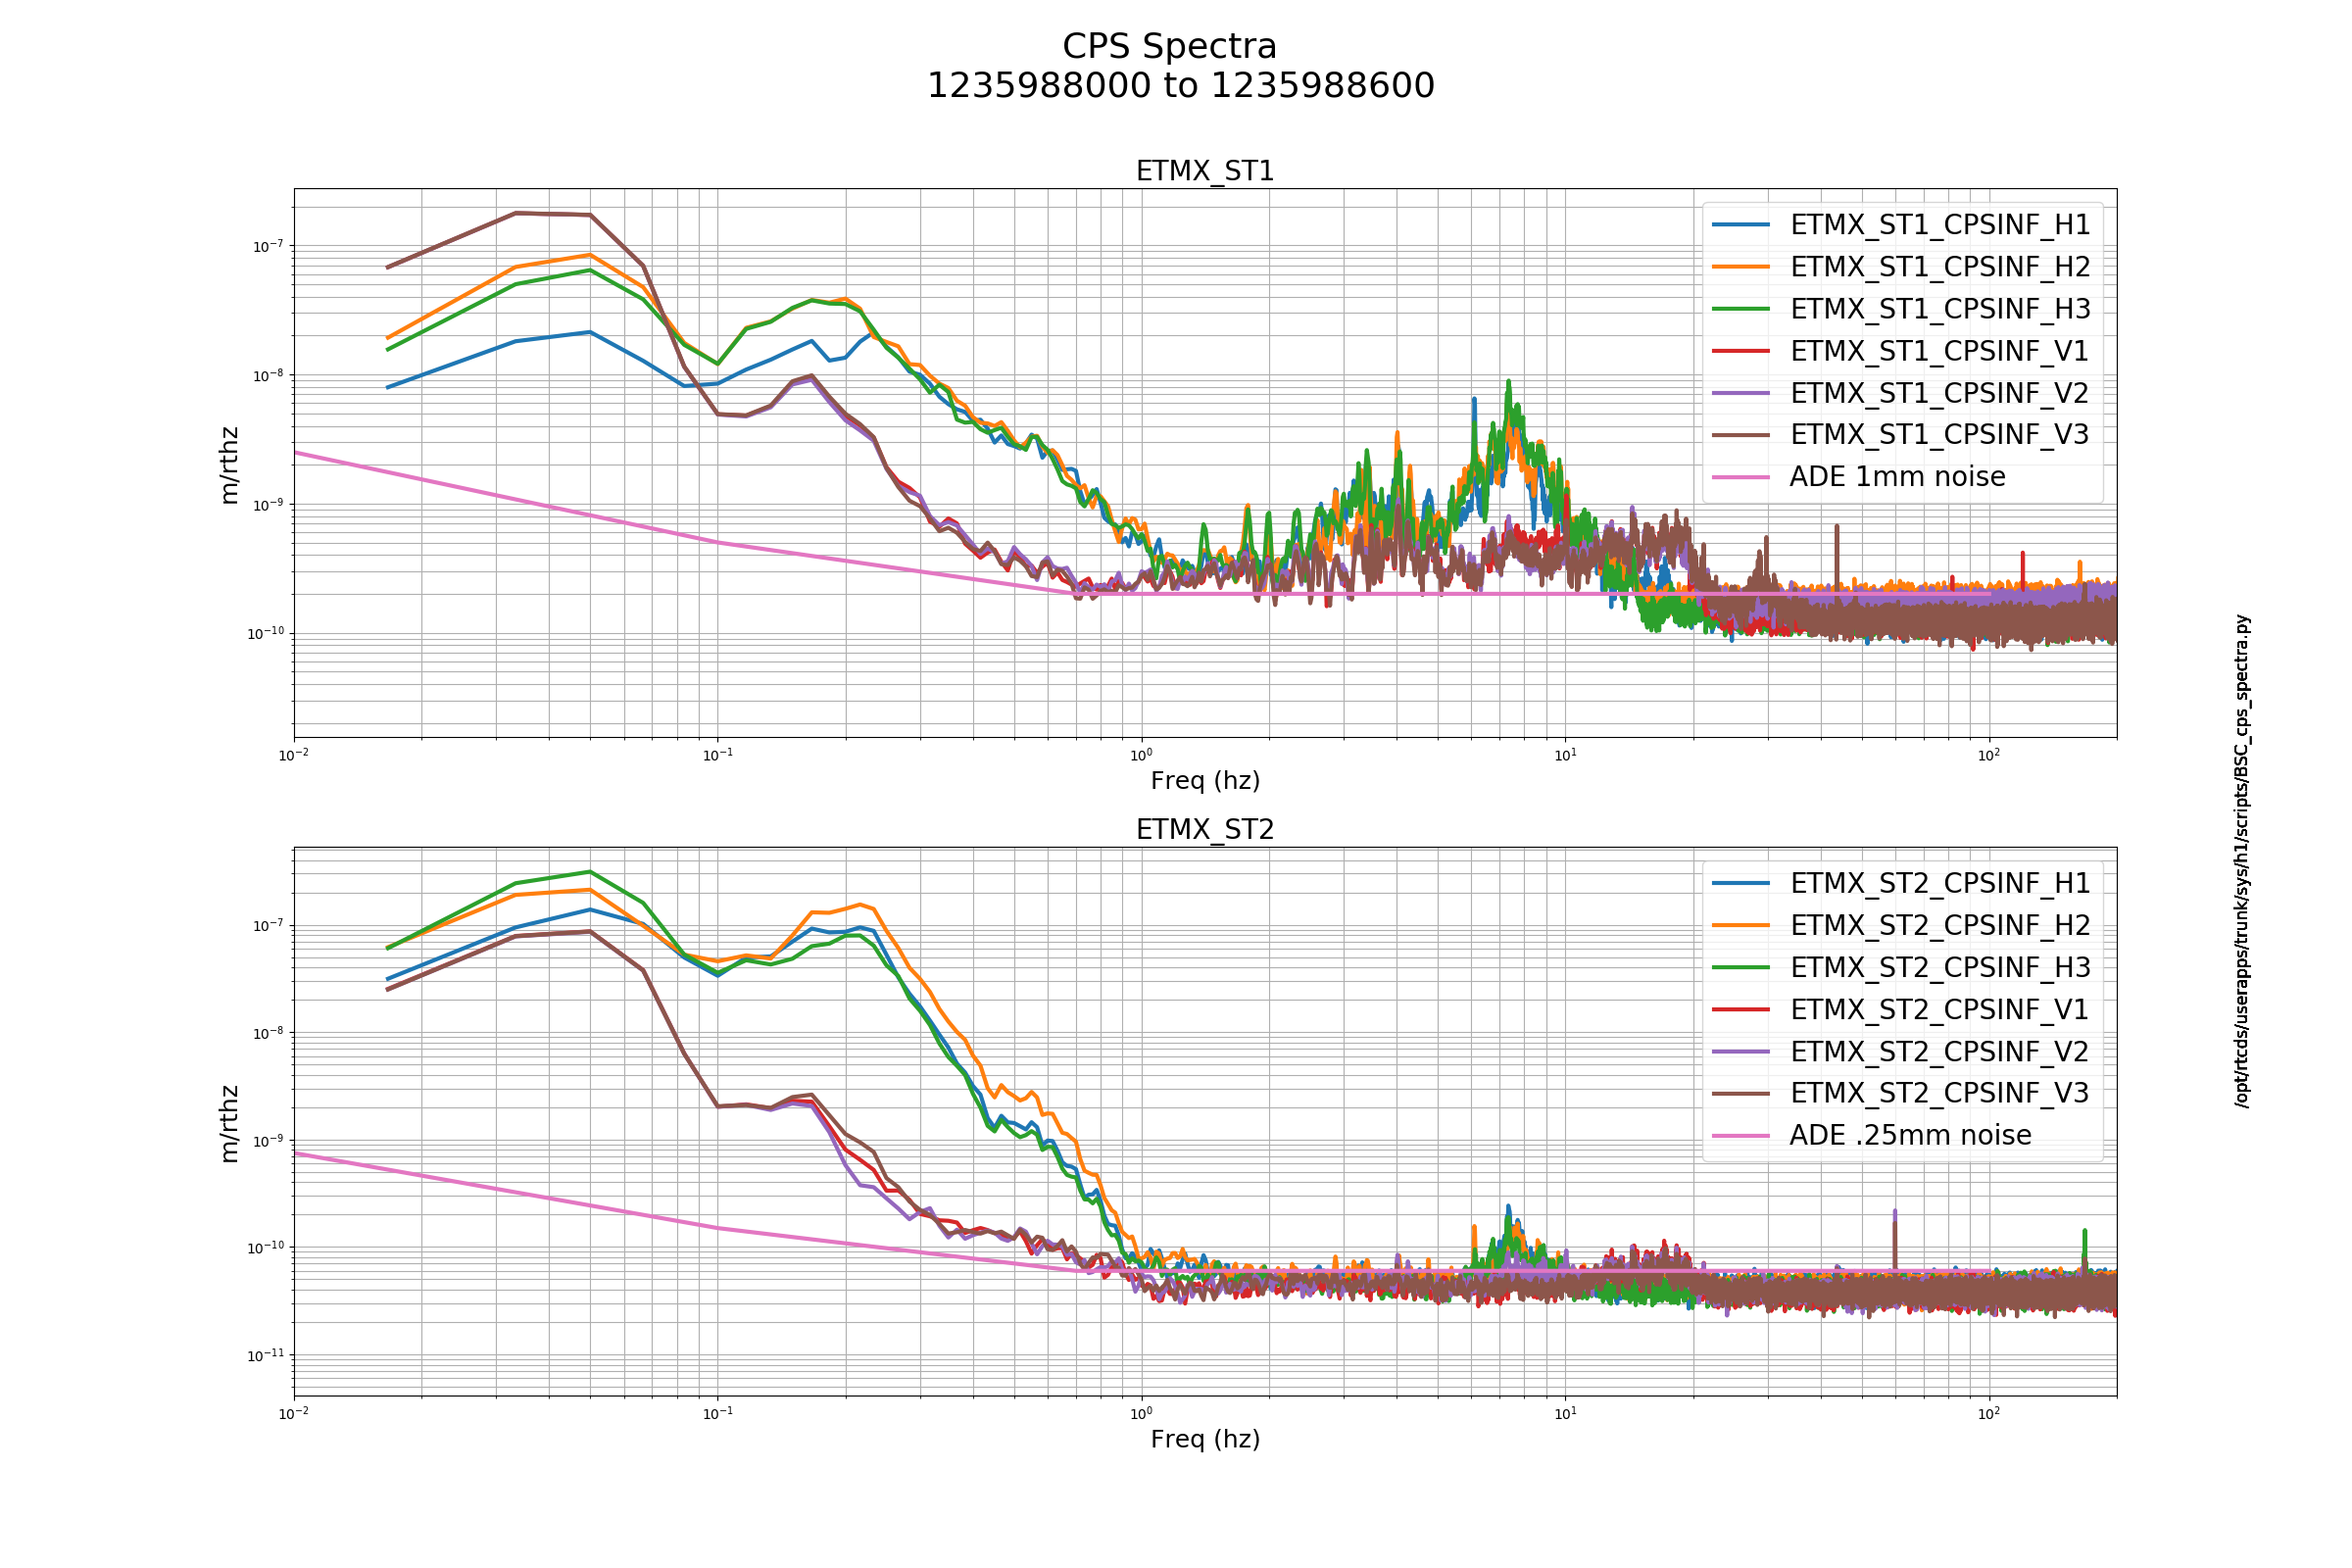
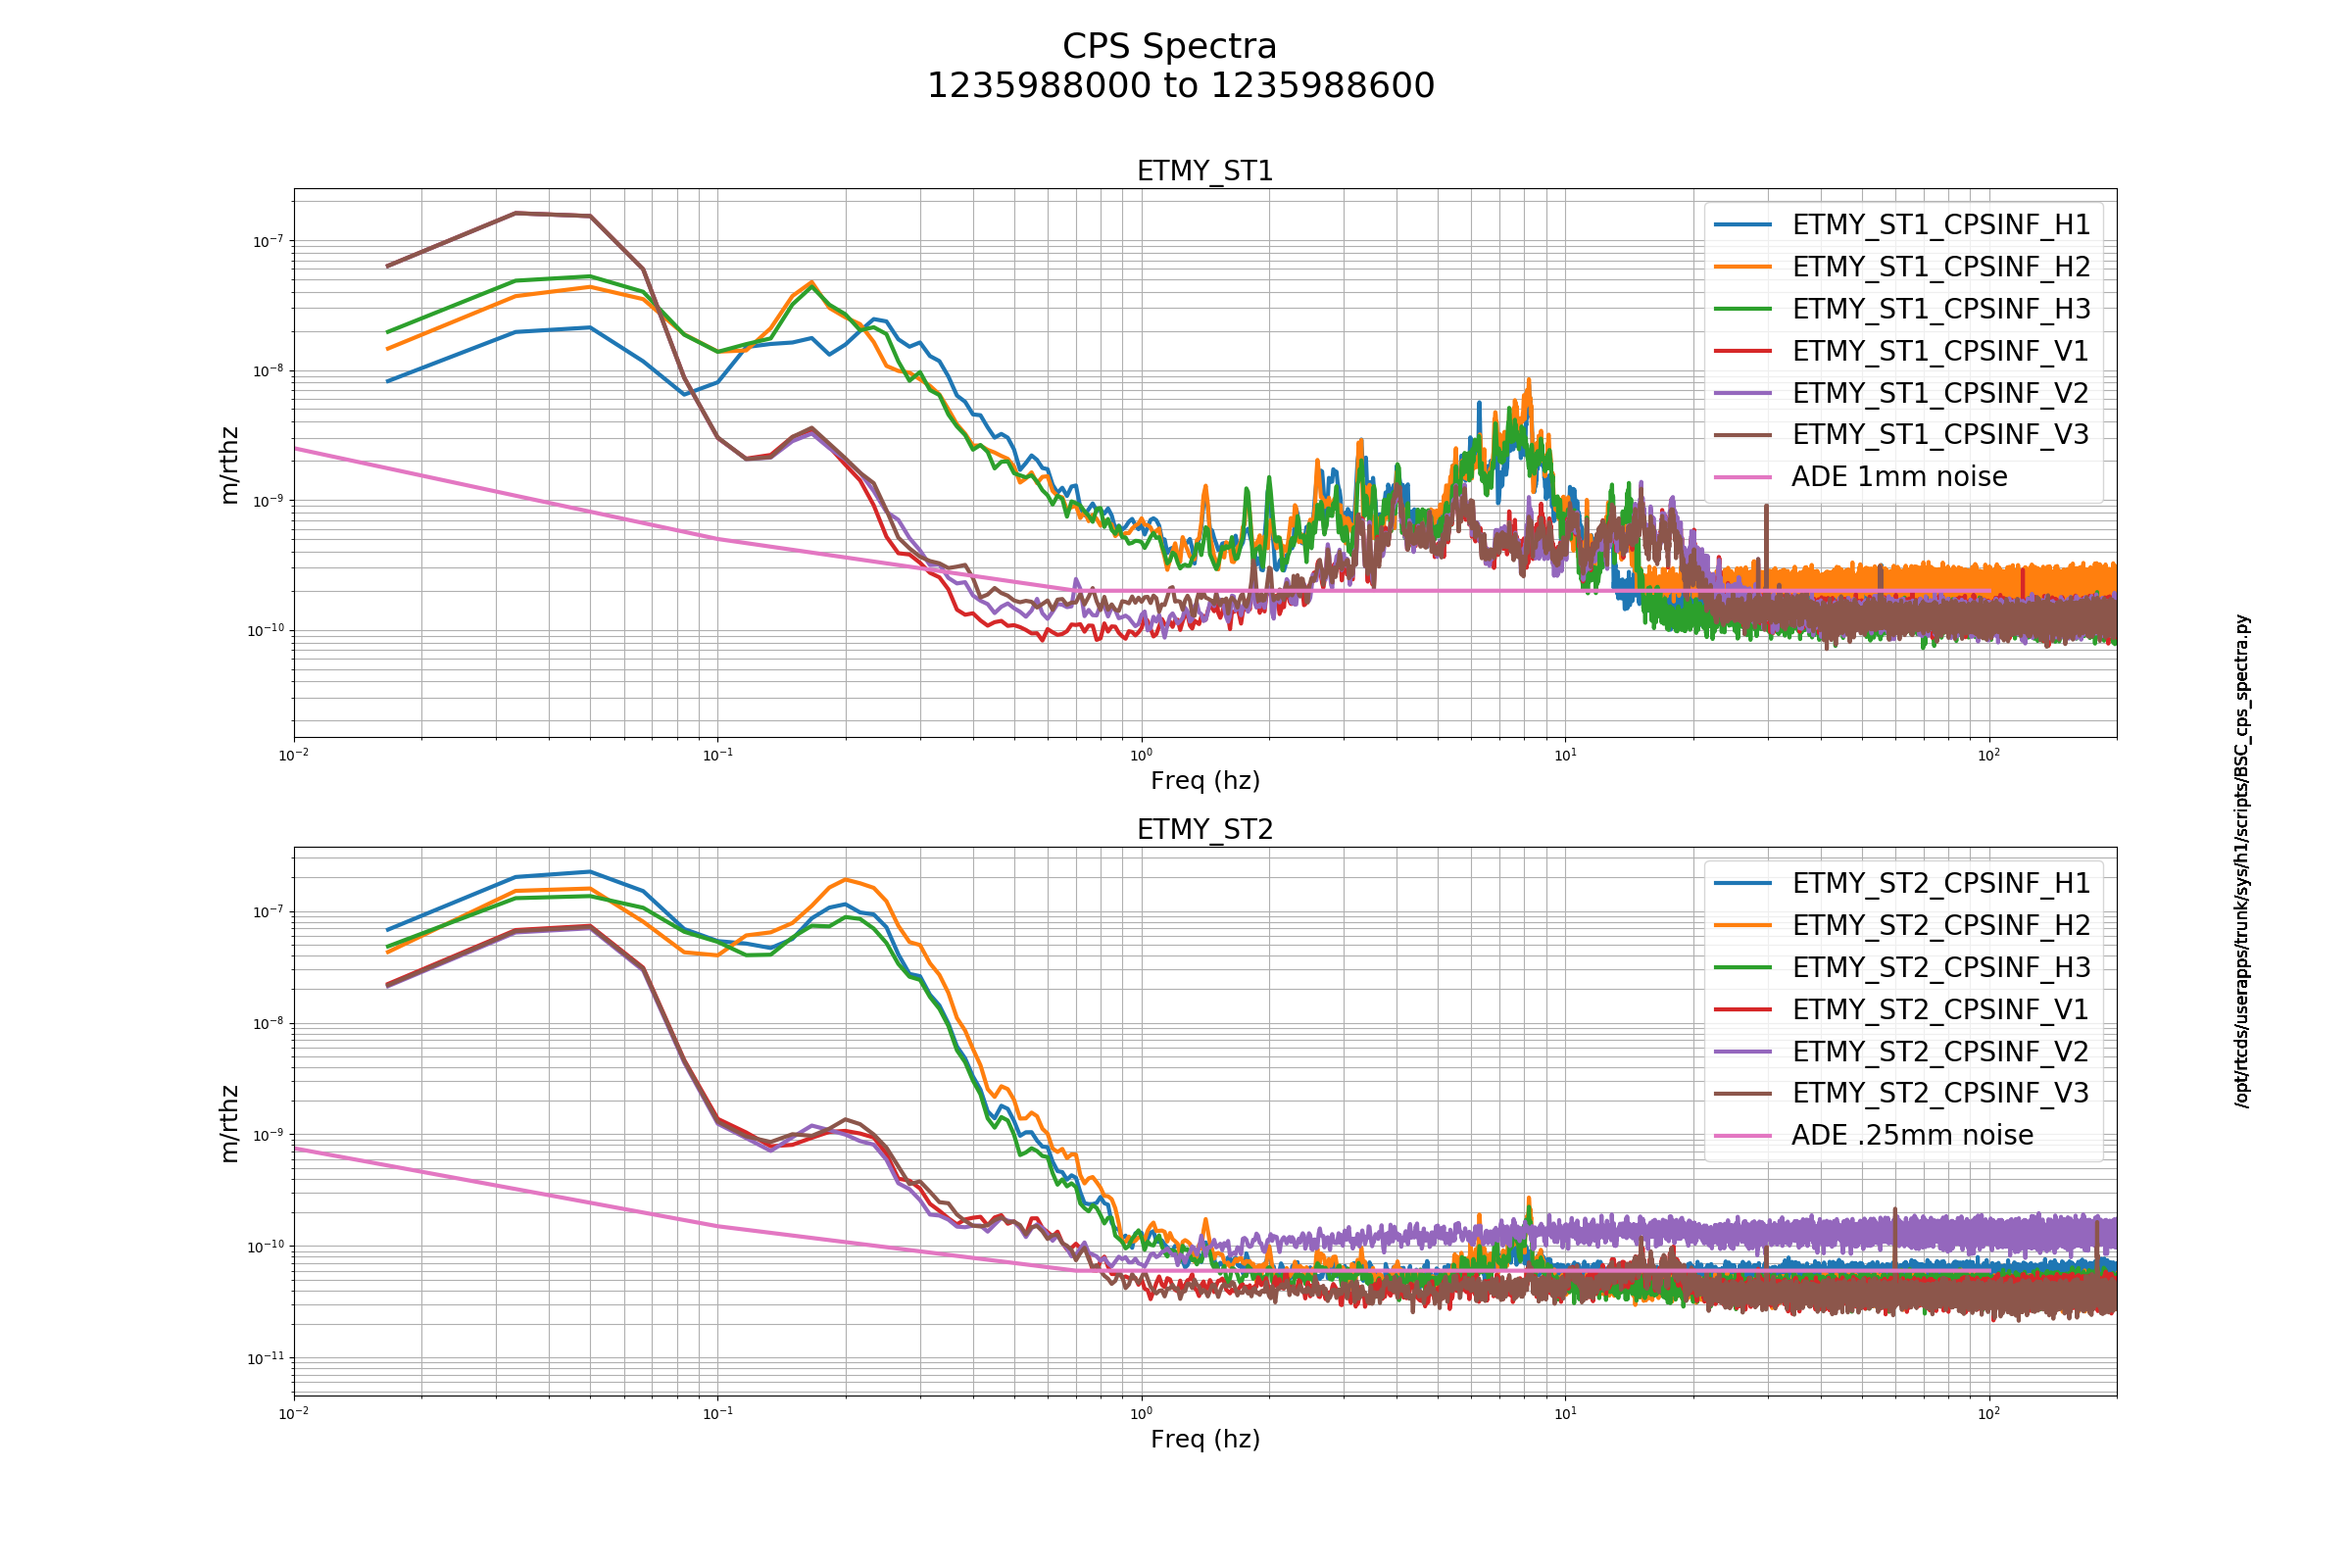
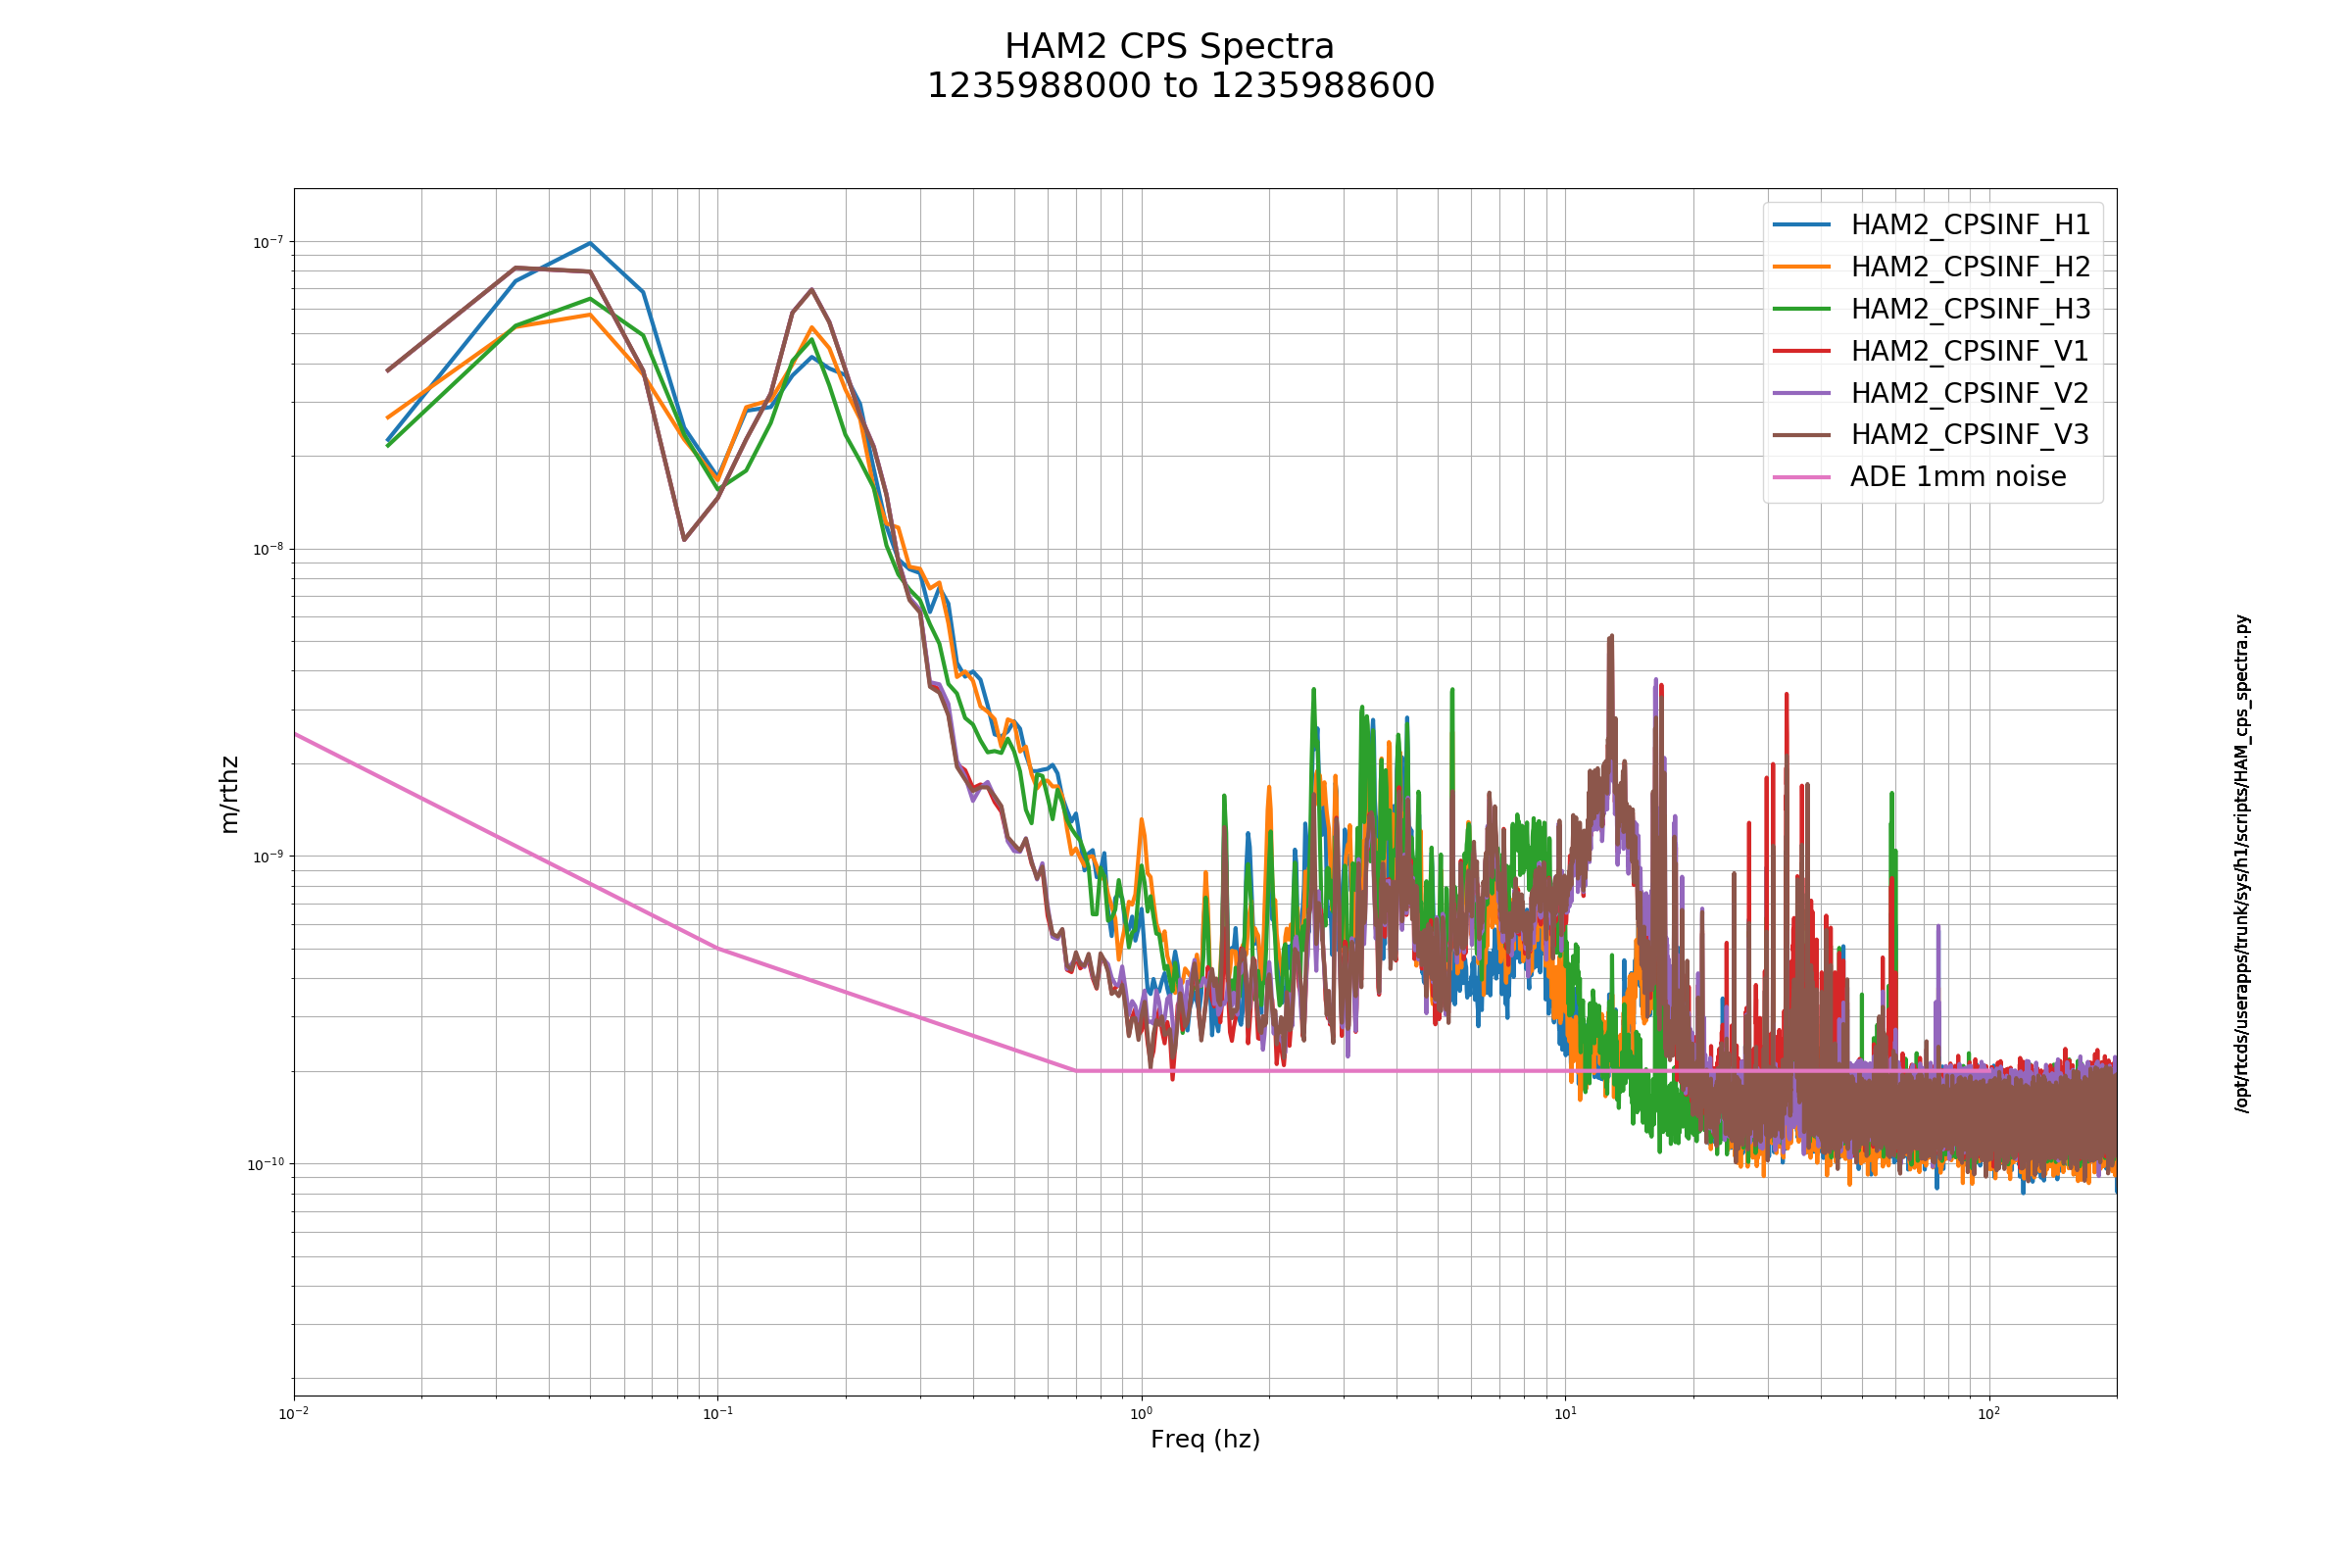
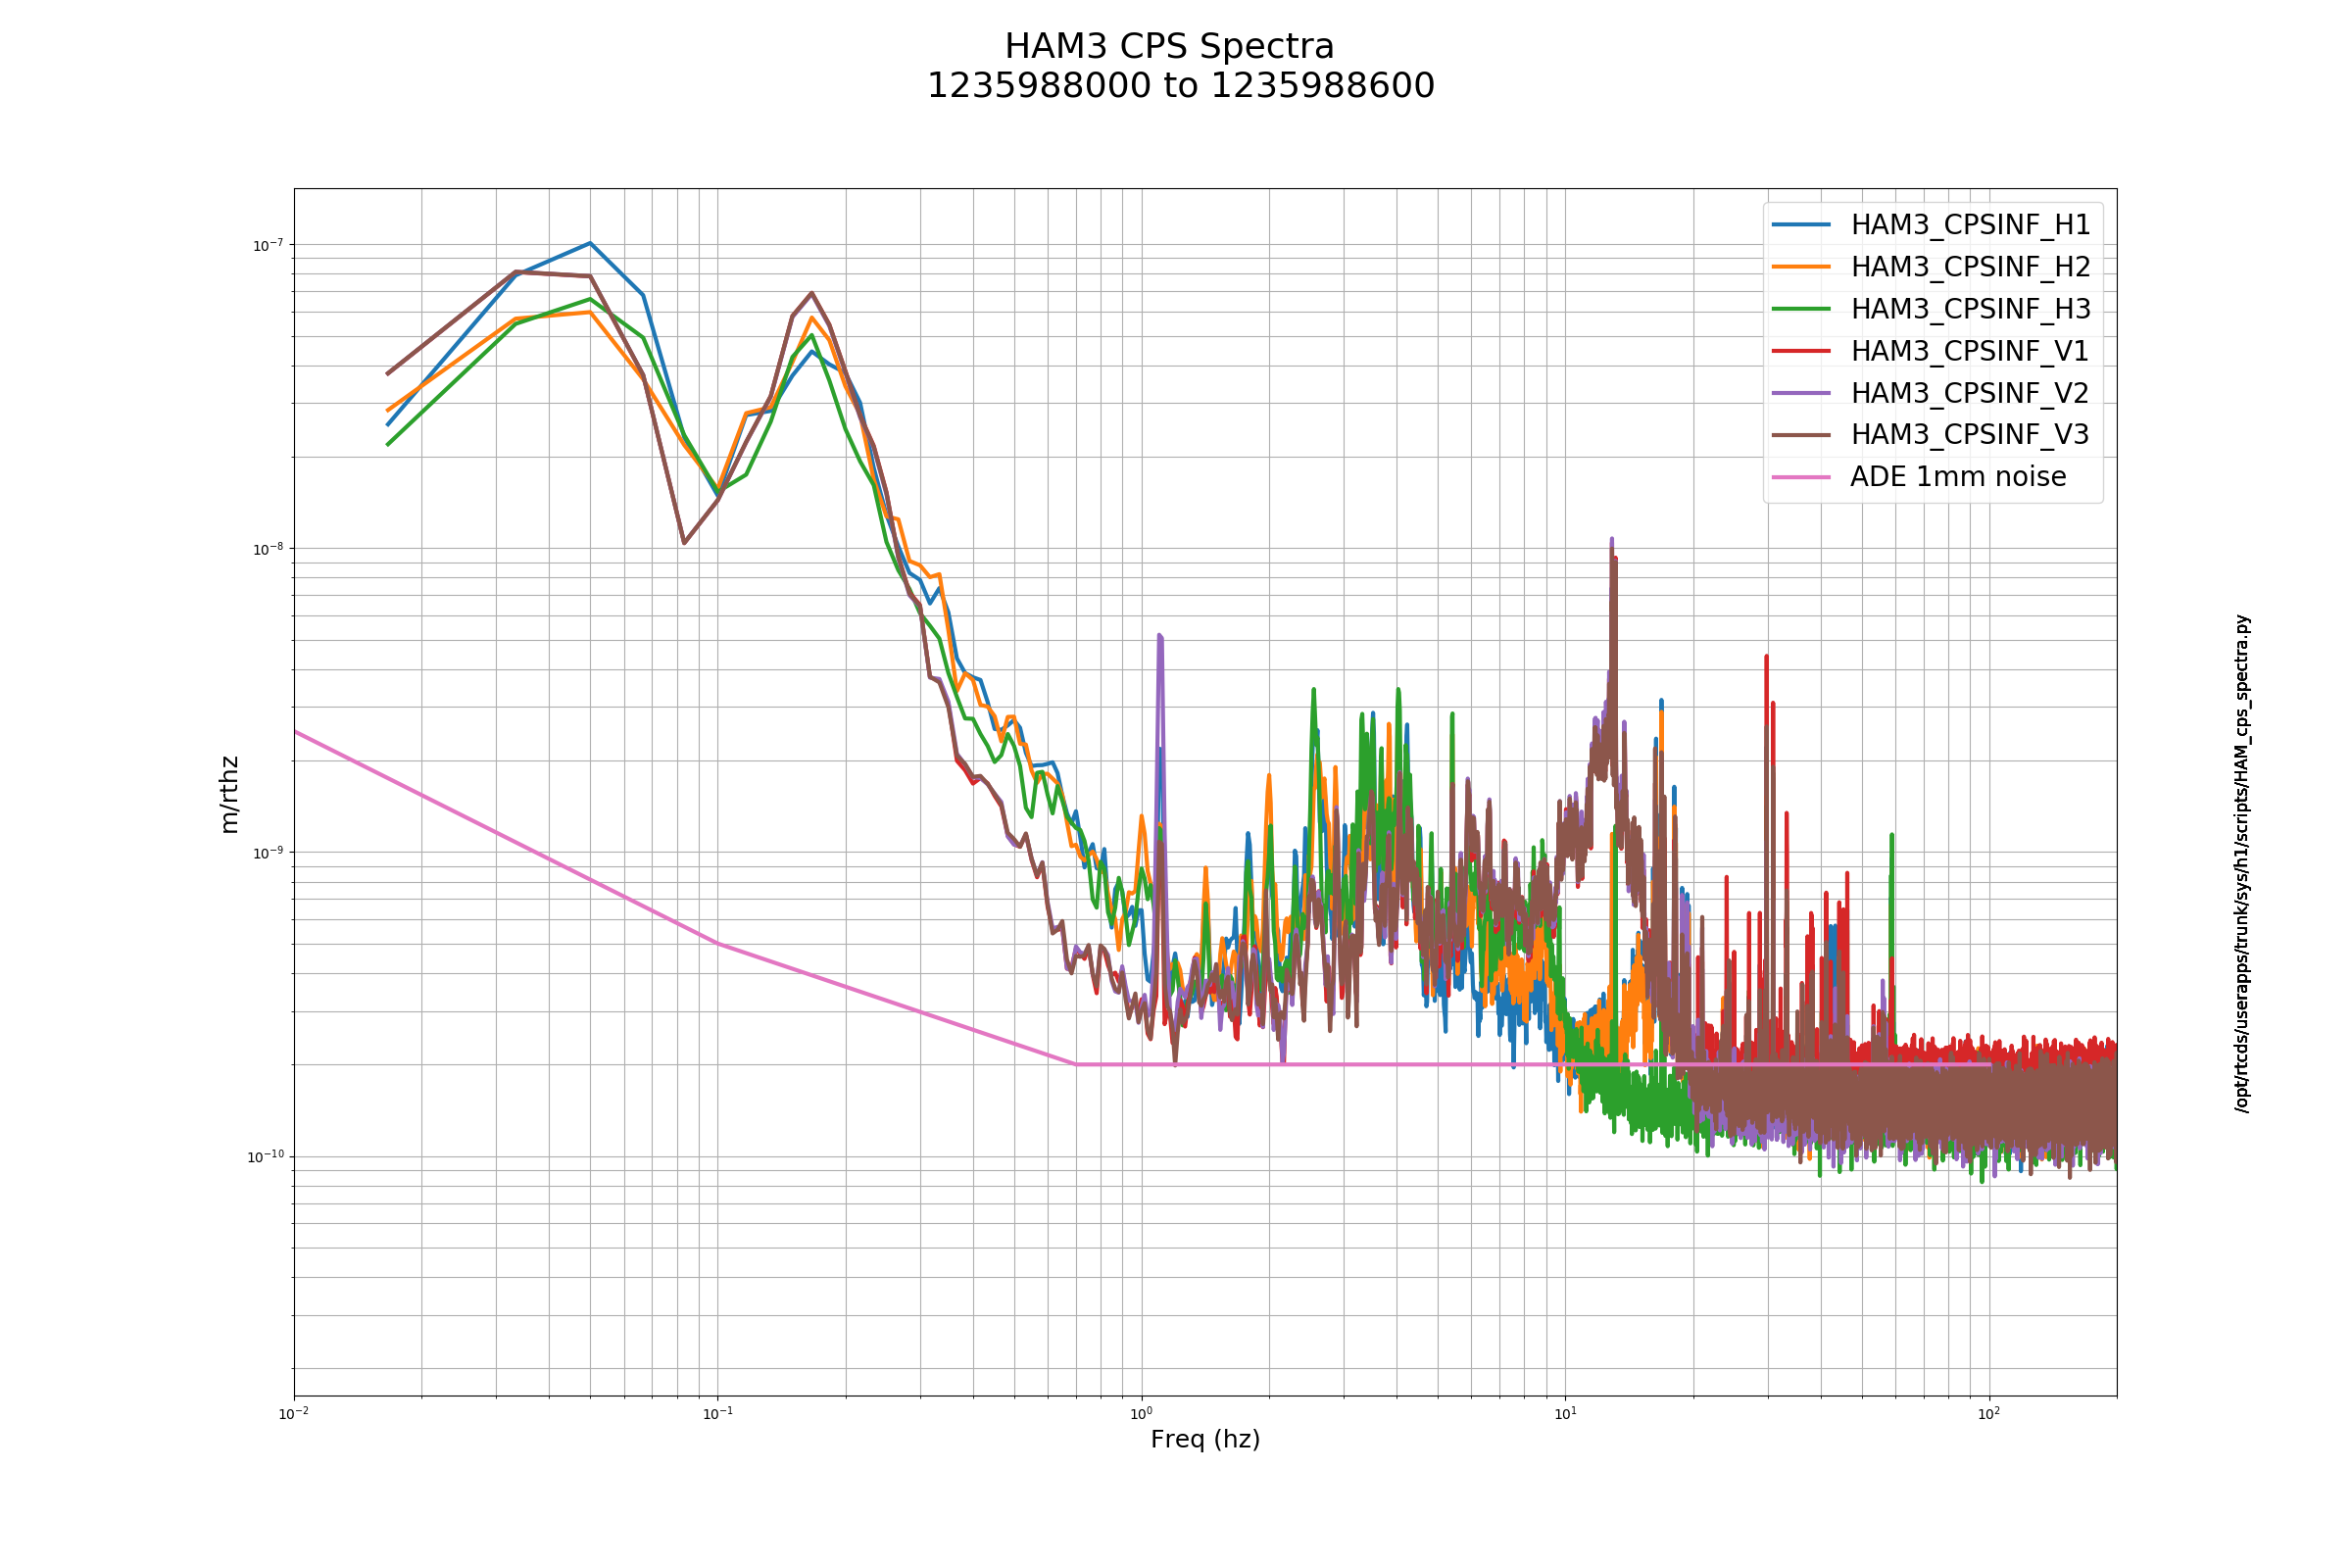
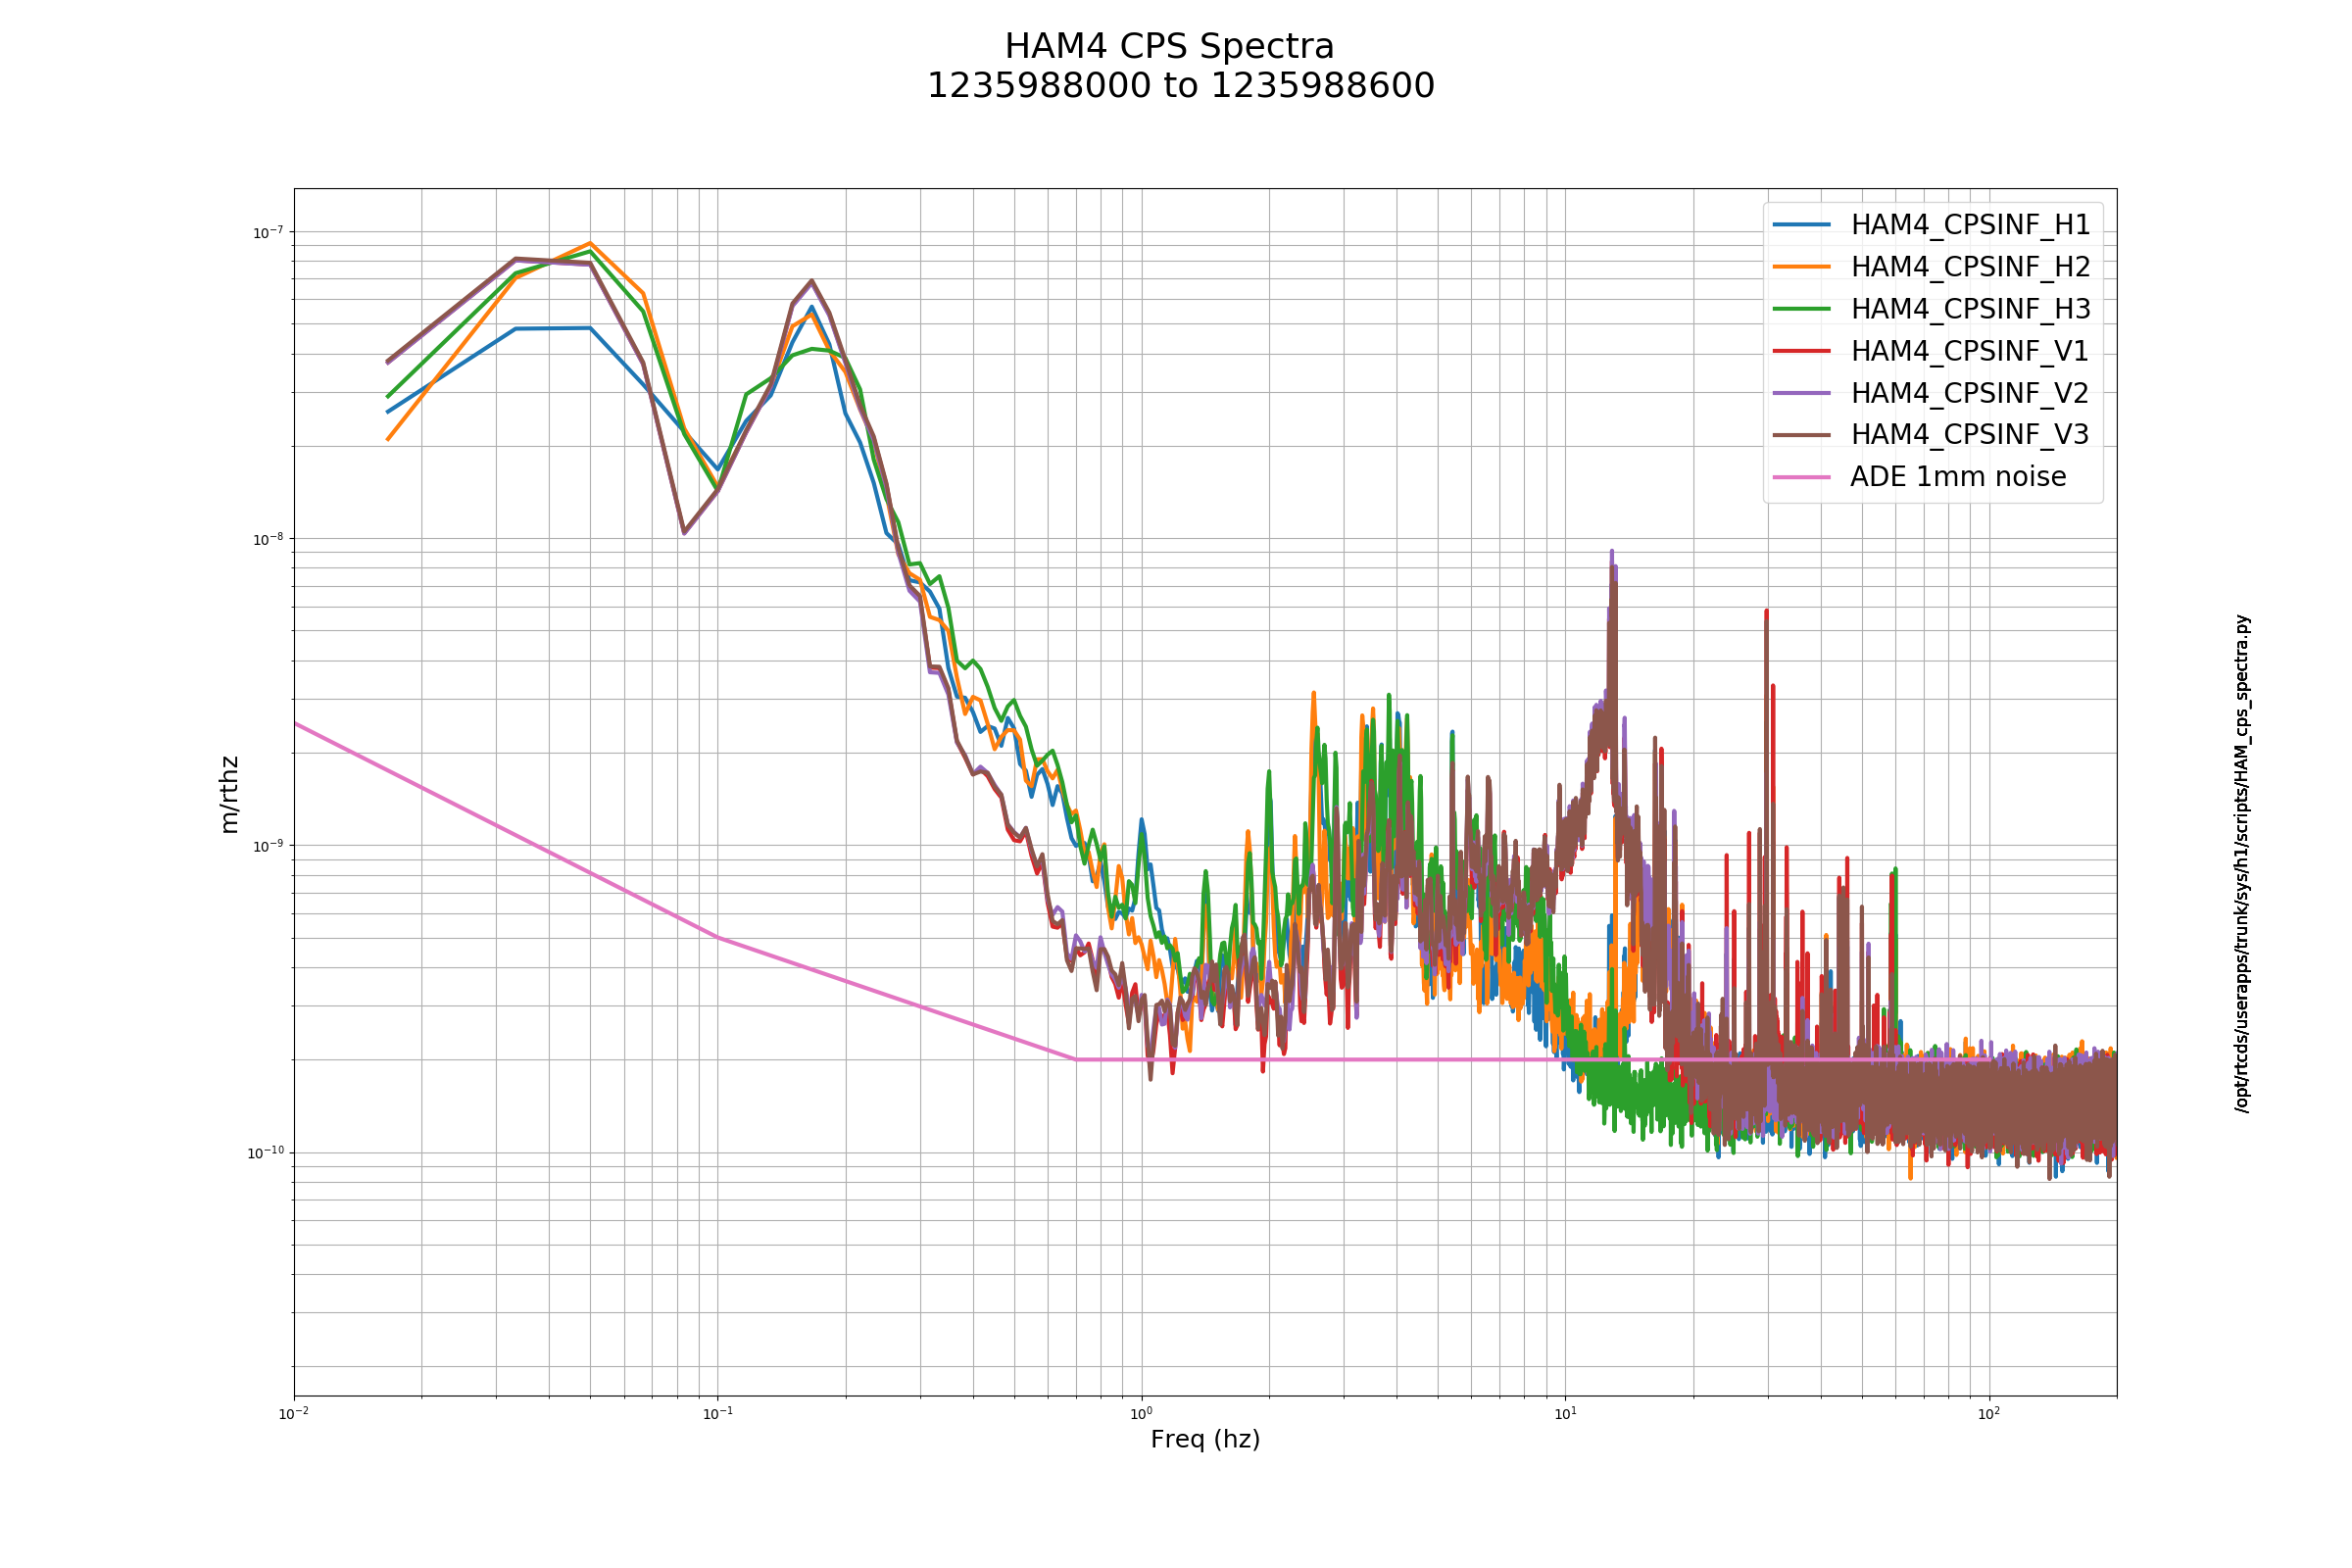
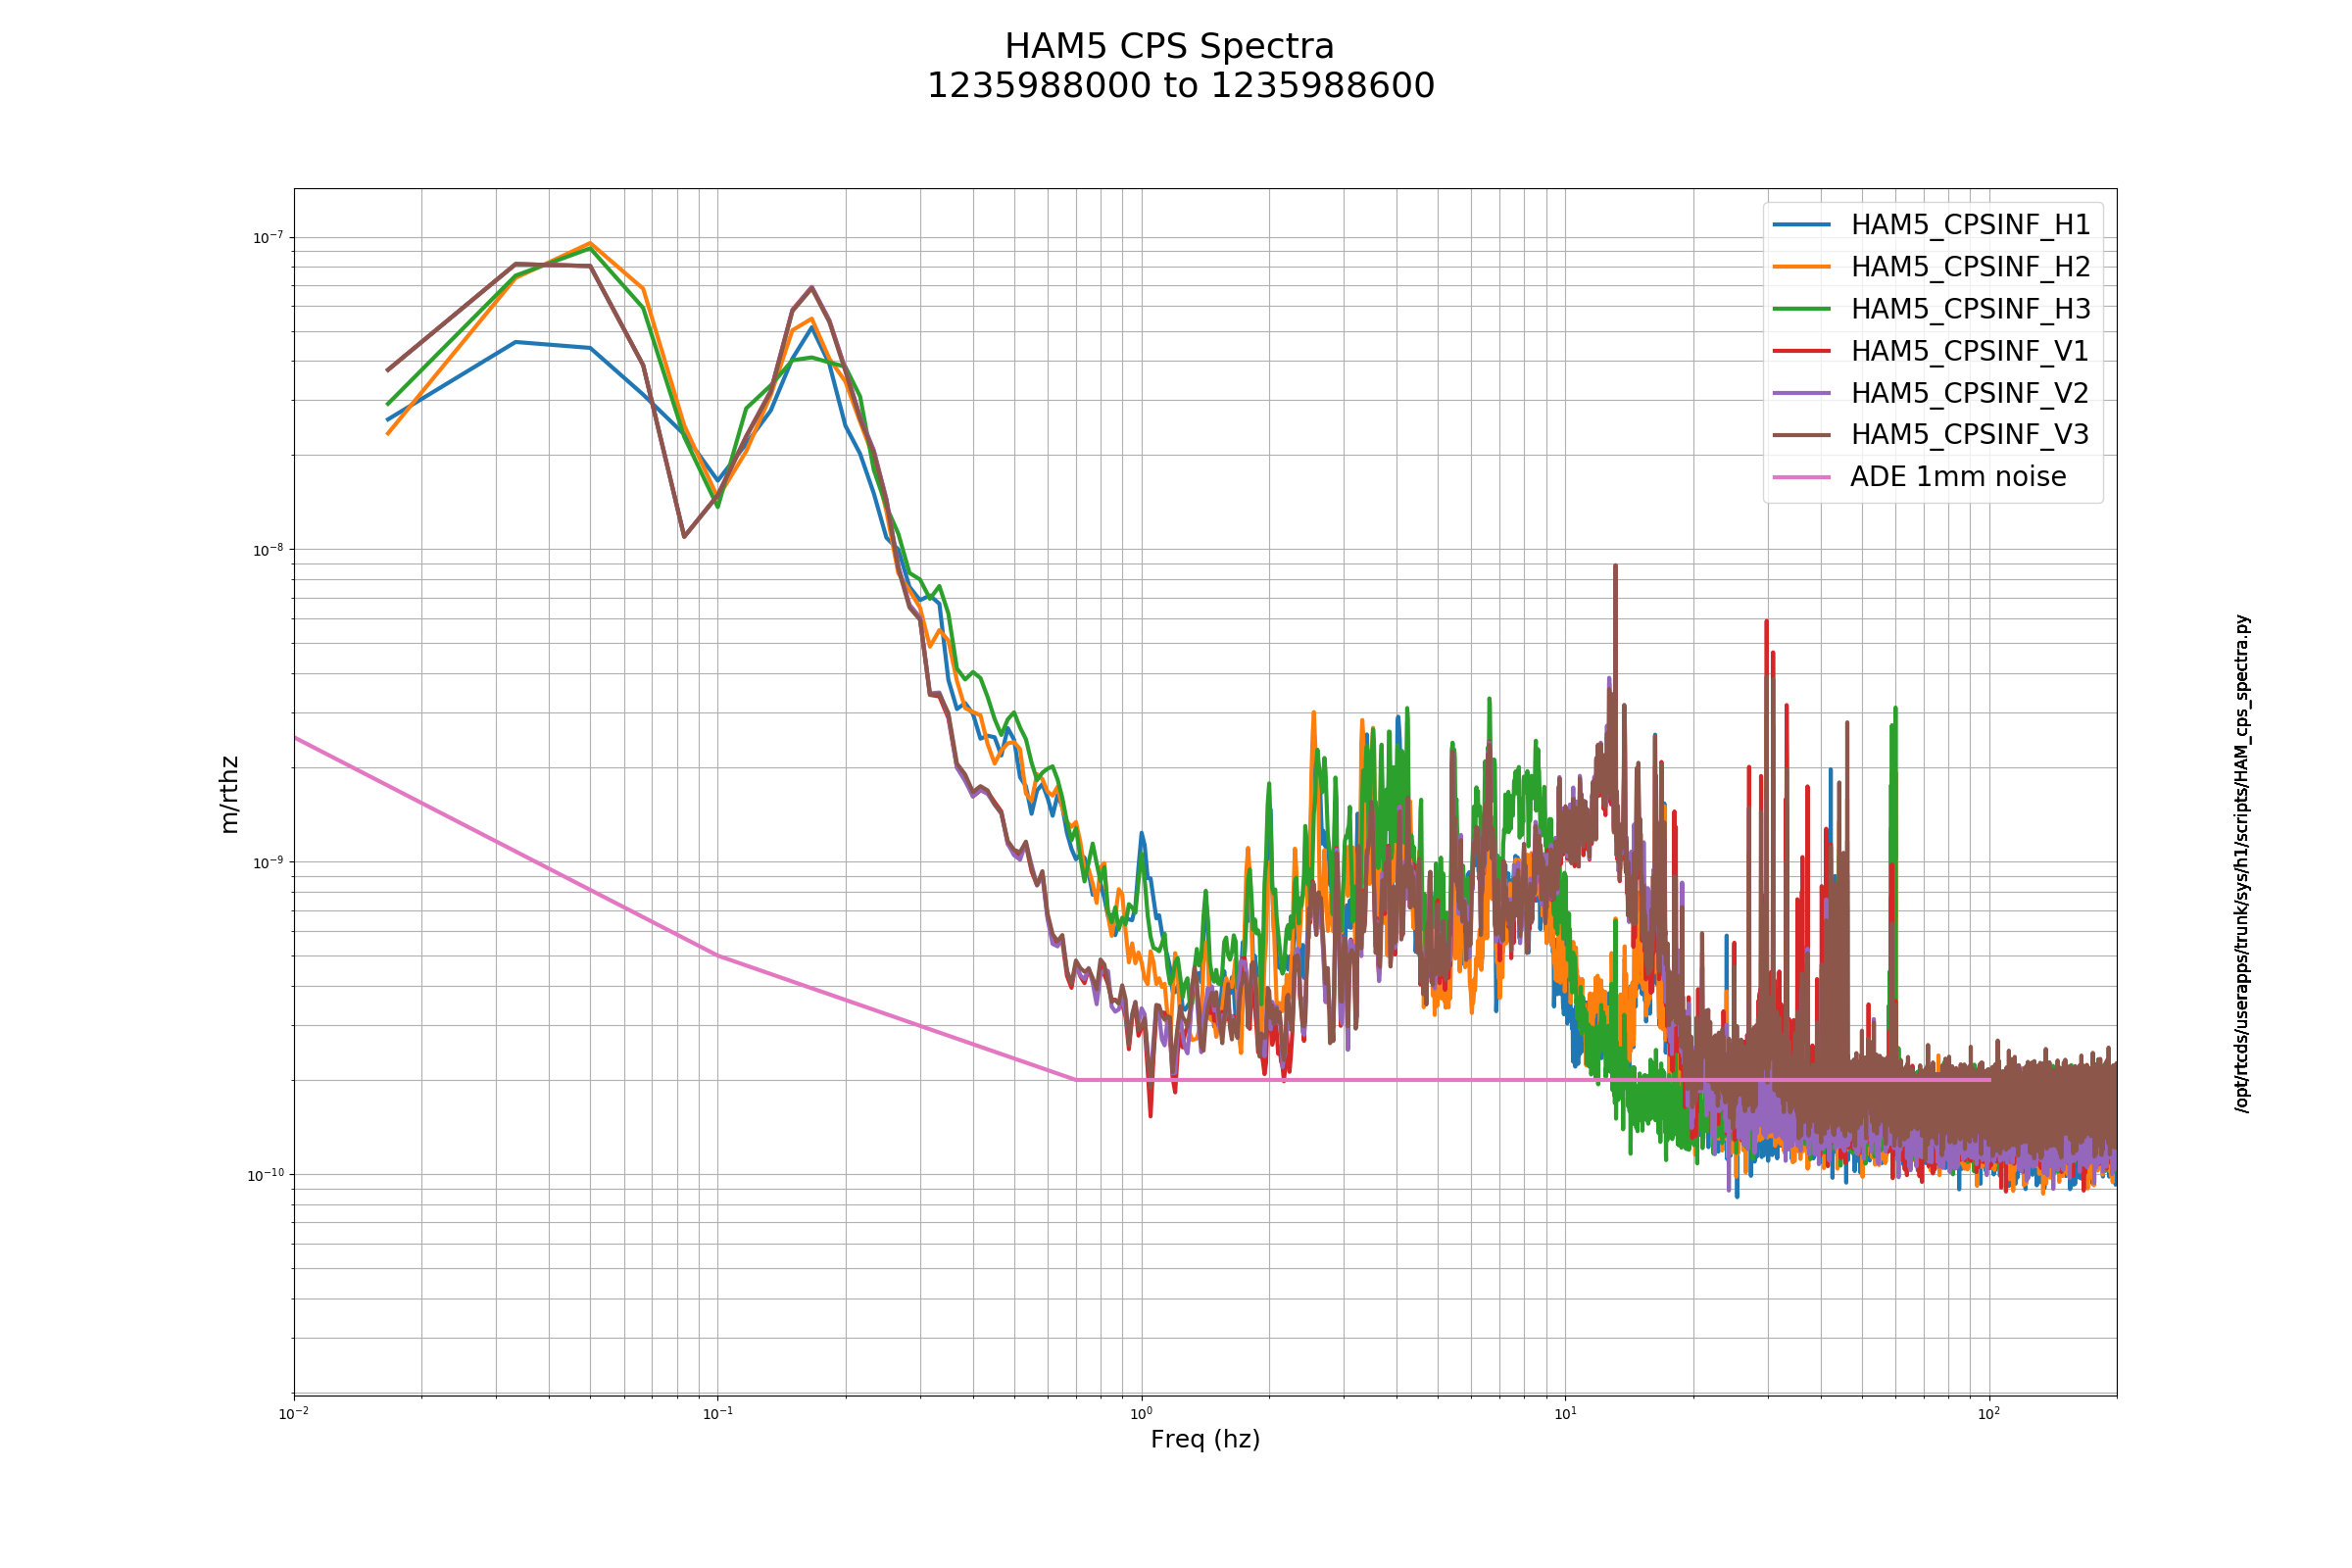
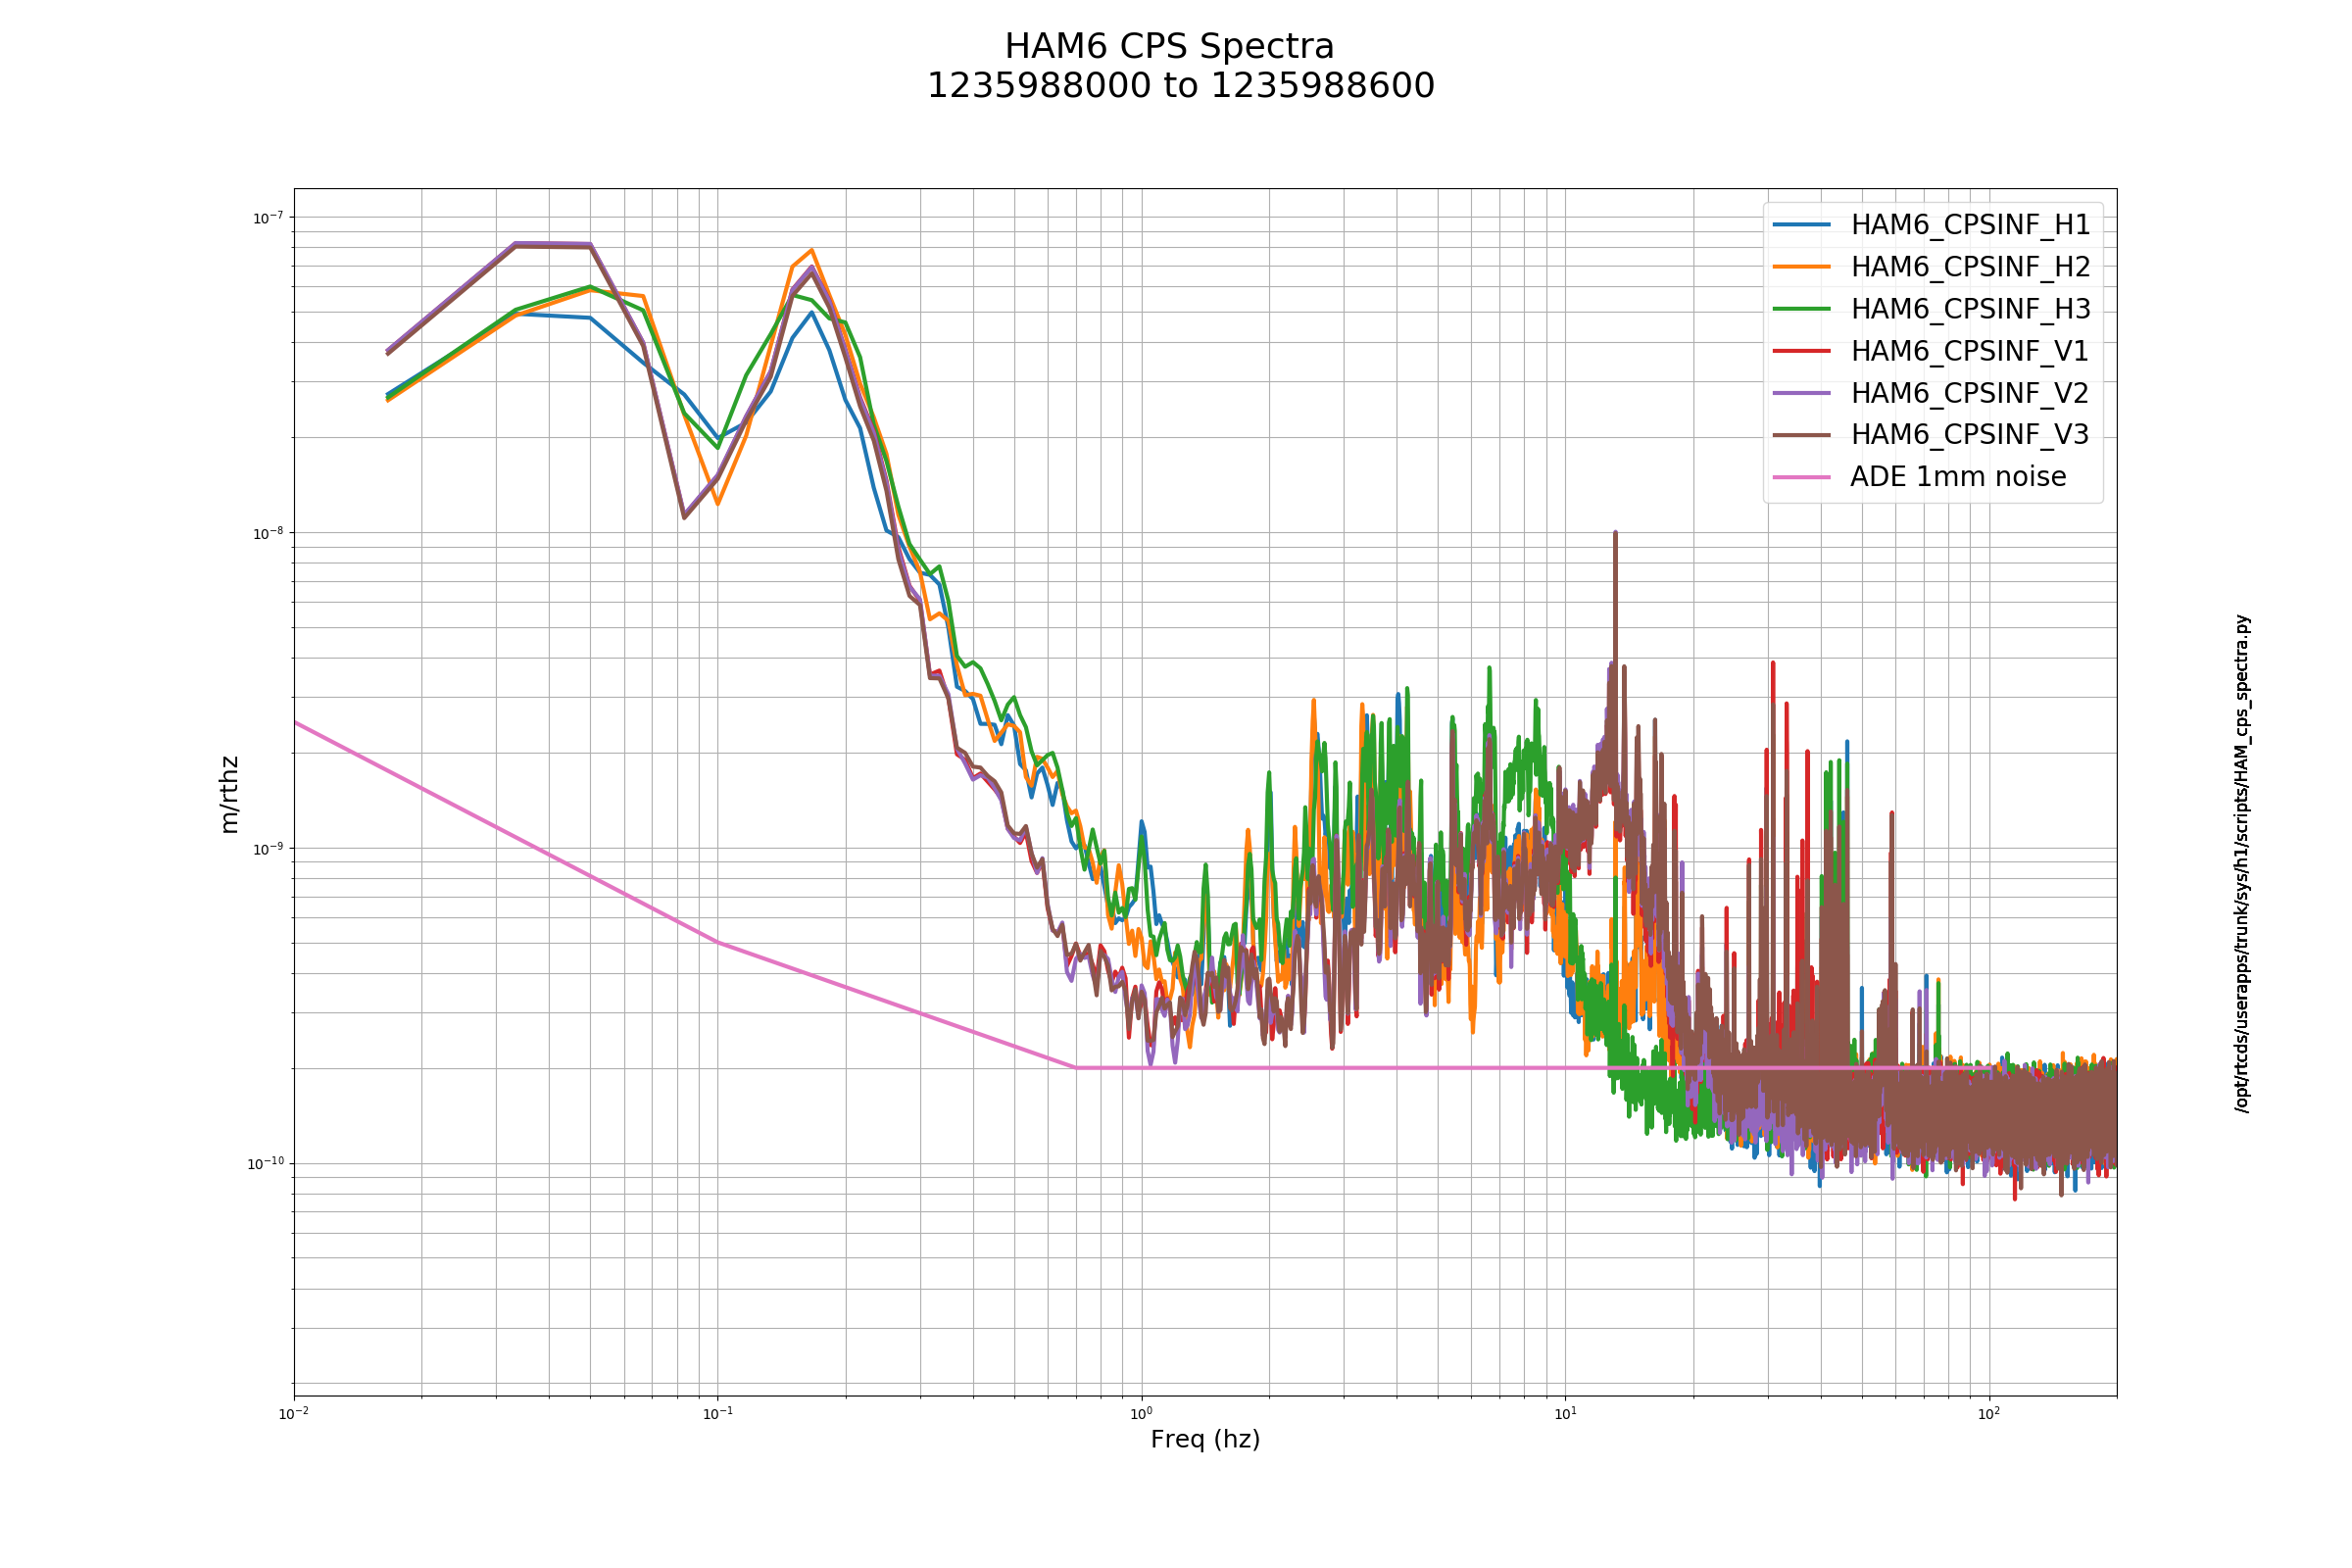
H1 BSC/HAM ISI CPS Sensor Noise Spectra Check (FAMIS task, #8350)
Images attached to this report
H1 CAL (CAL, GRD)
sheila.dwyer@LIGO.ORG - posted 11:59, Thursday 07 March 2019 (47369)
calibration lines hard coded in gaurdian

We have been trying to use SDF to manage the settings for the calibration lines, but they keep getting turned off which means that we are often missing our optical gain and cavity pole monitors.  I've hard coded the settings for ETMX cal lines in NOMINAL_LOW_NOISE, and it is enabling the excitations on PCAL X and PCAL Y.  

H1 ISC (CAL)
sheila.dwyer@LIGO.ORG - posted 11:24, Thursday 07 March 2019 - last comment - 03:04, Saturday 09 March 2019(47351)
noise budget plots without squeezing

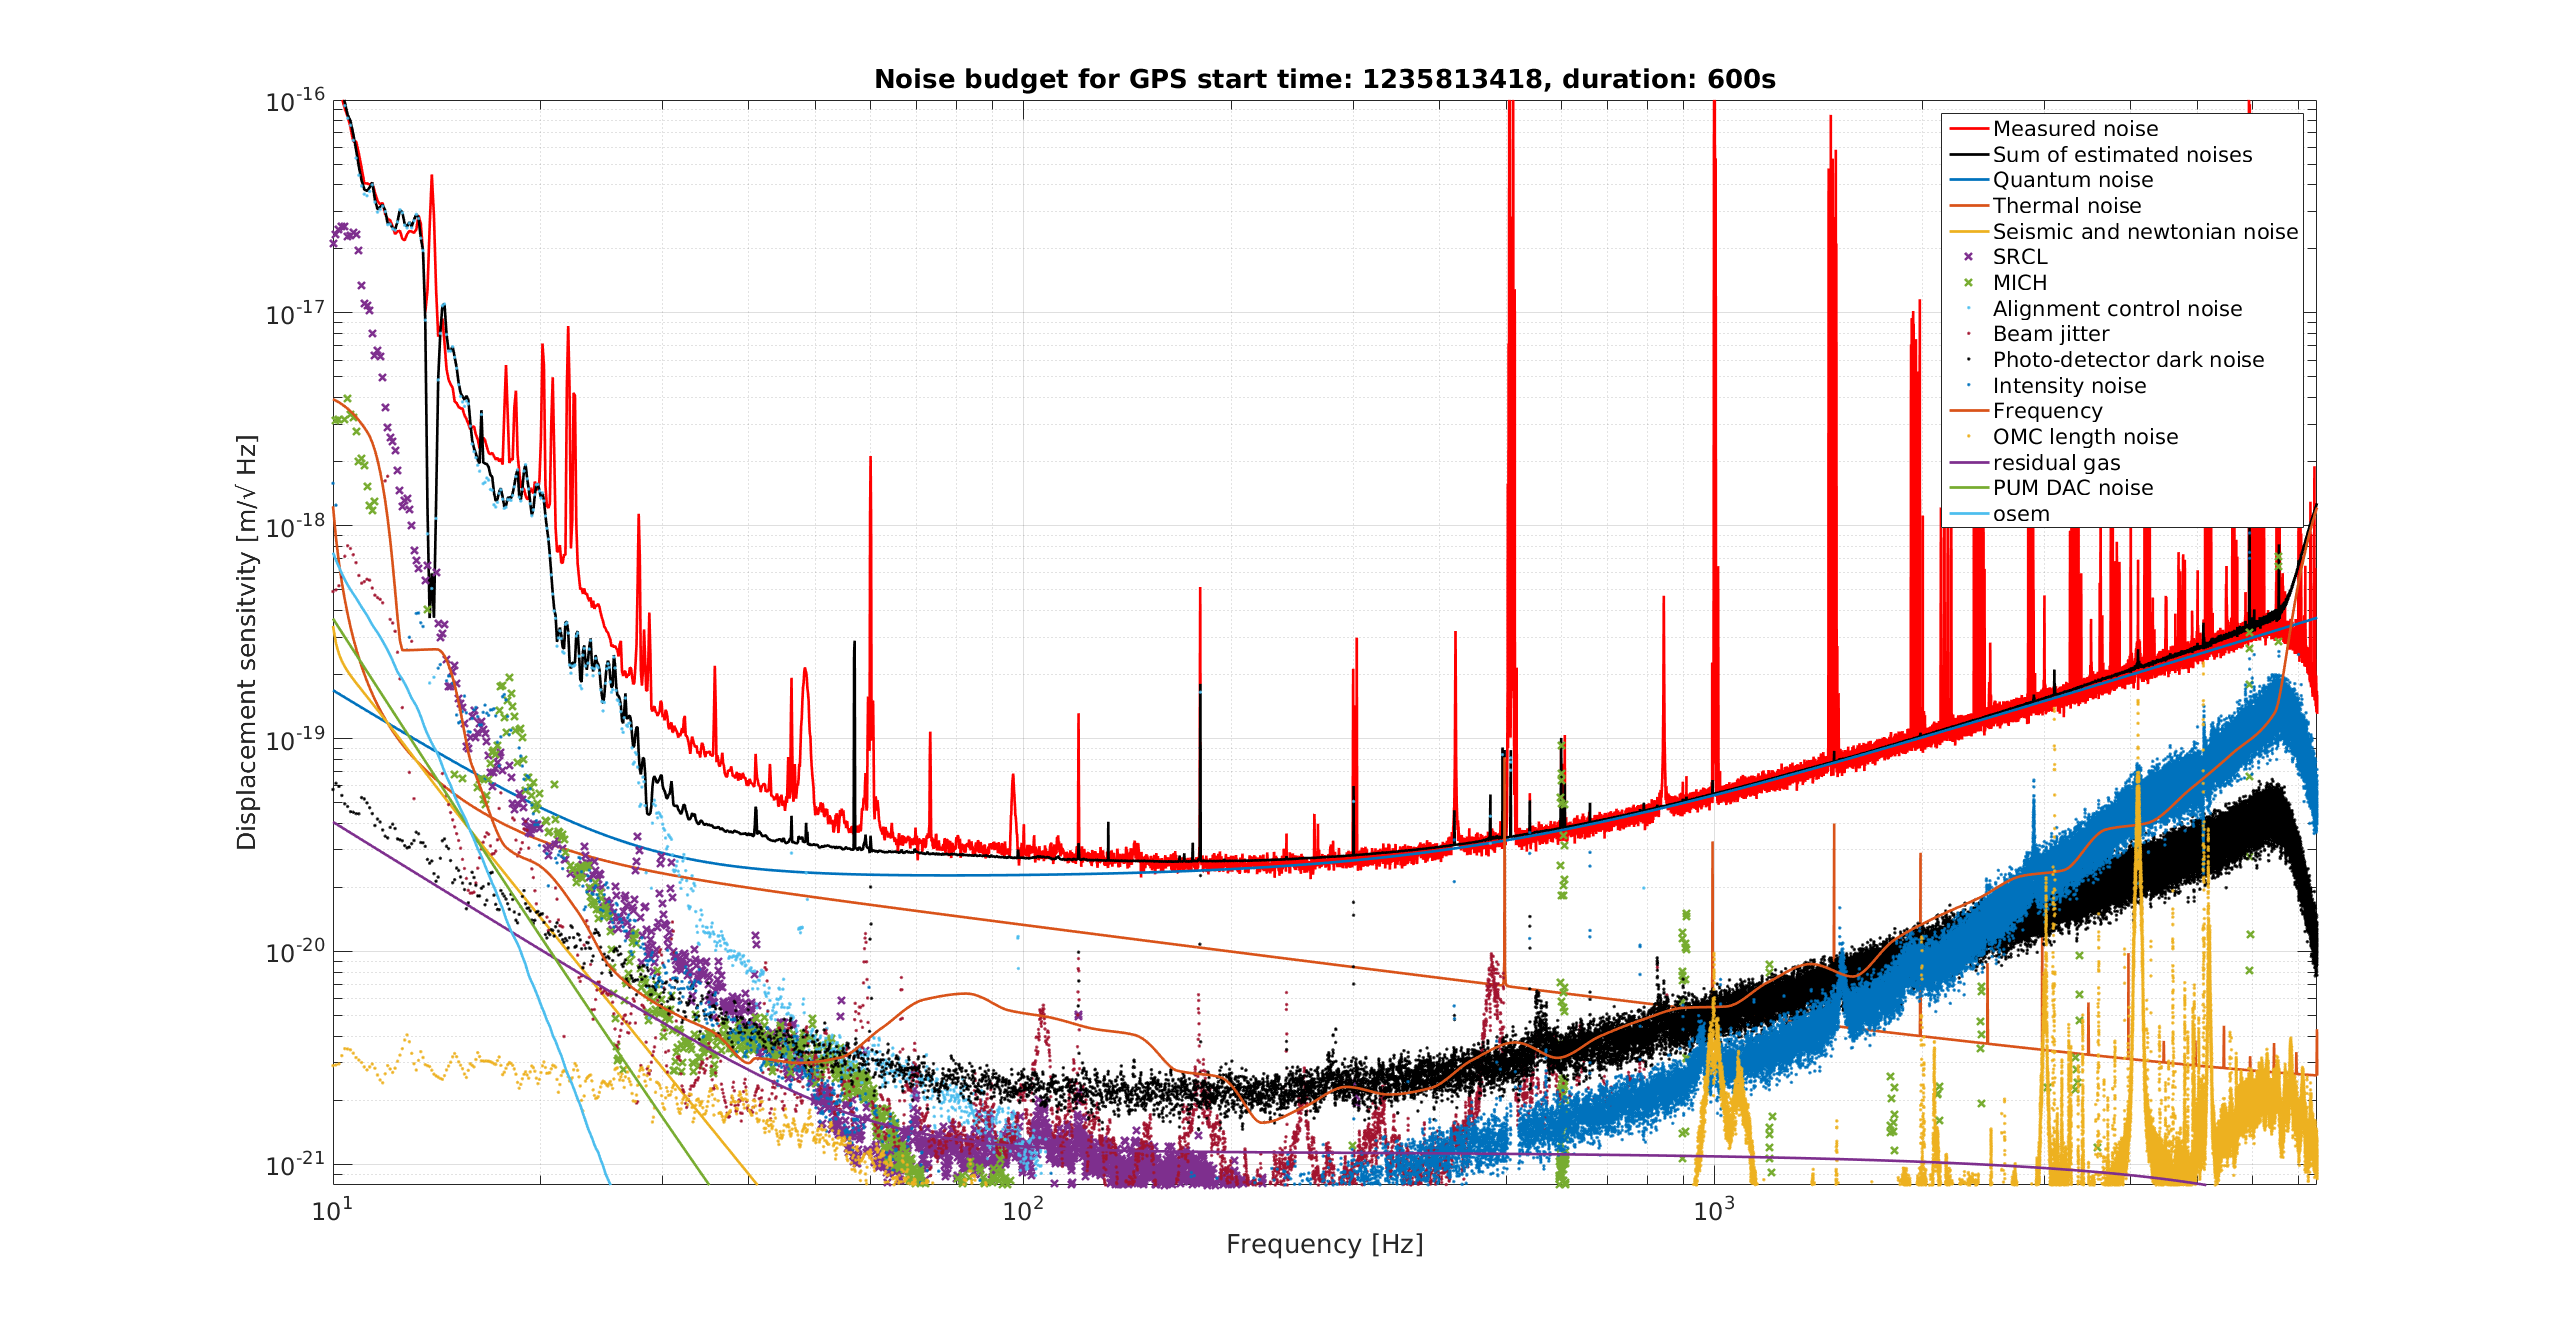
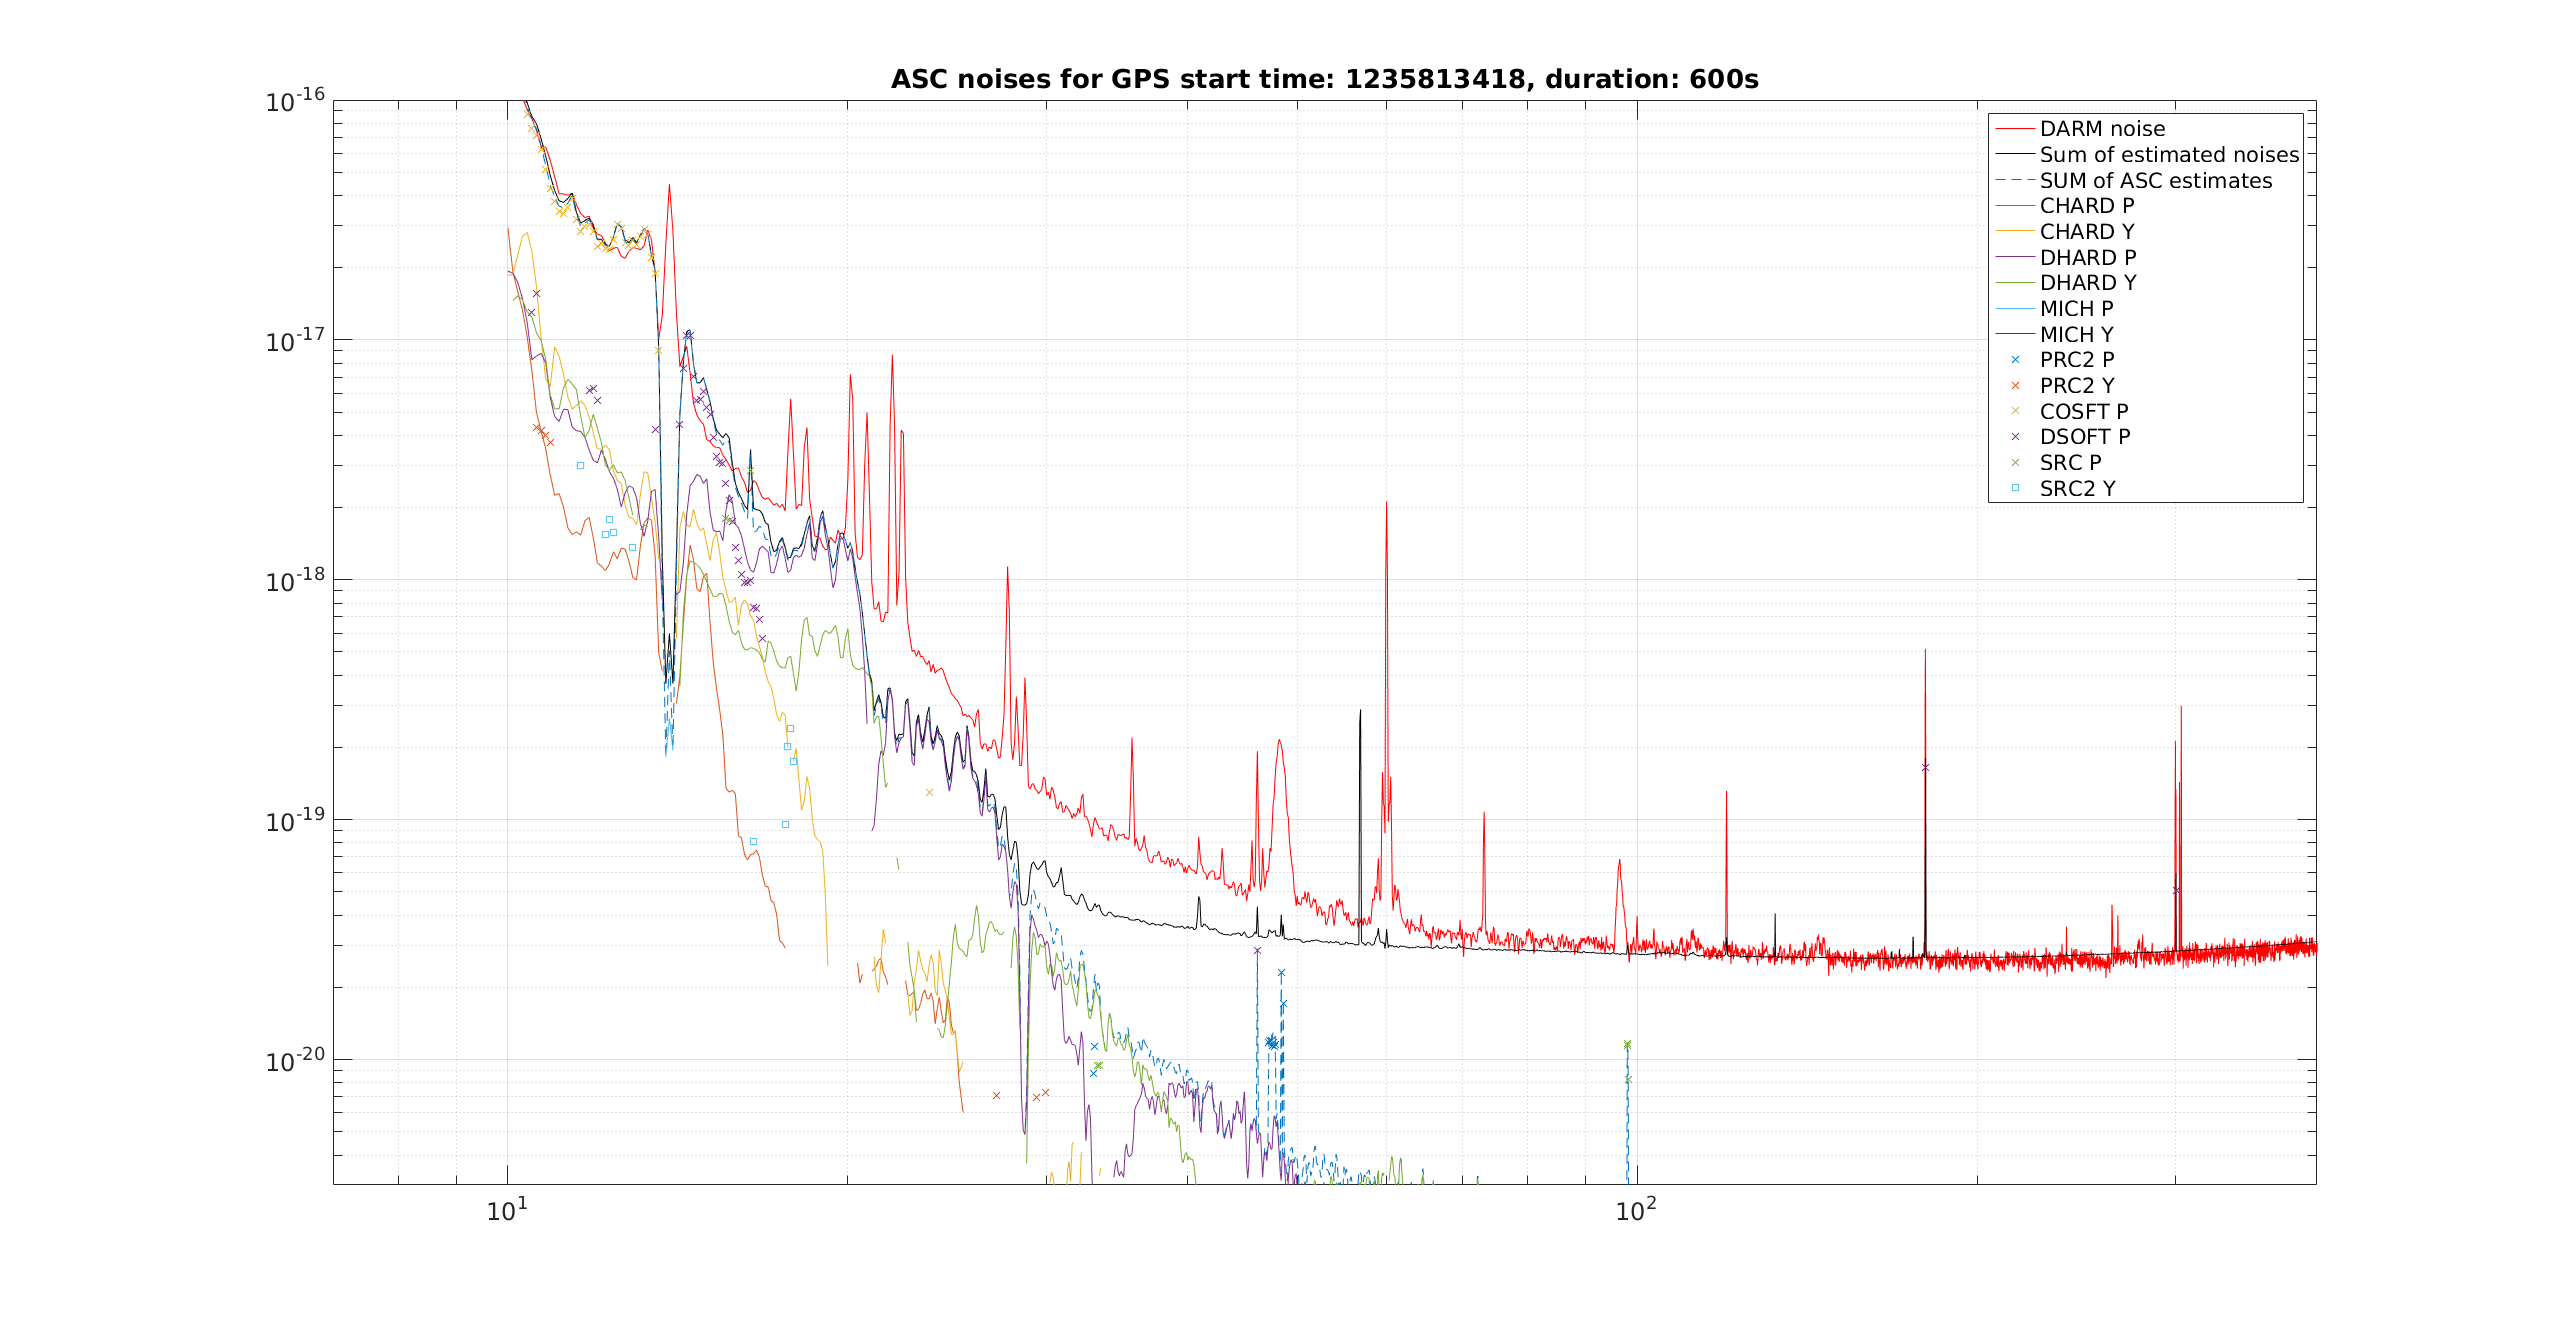
Georgia, Craig, Danny, Sheila

Here are some updated noise budget plots, made for 9:30 UTC March 5th, when there was no squeezing injected. 

Some notes:


Images attached to this report
Comments related to this report
georgia.mansell@LIGO.ORG - 00:33, Friday 08 March 2019 (47387)

Dan, Craig, Georgia

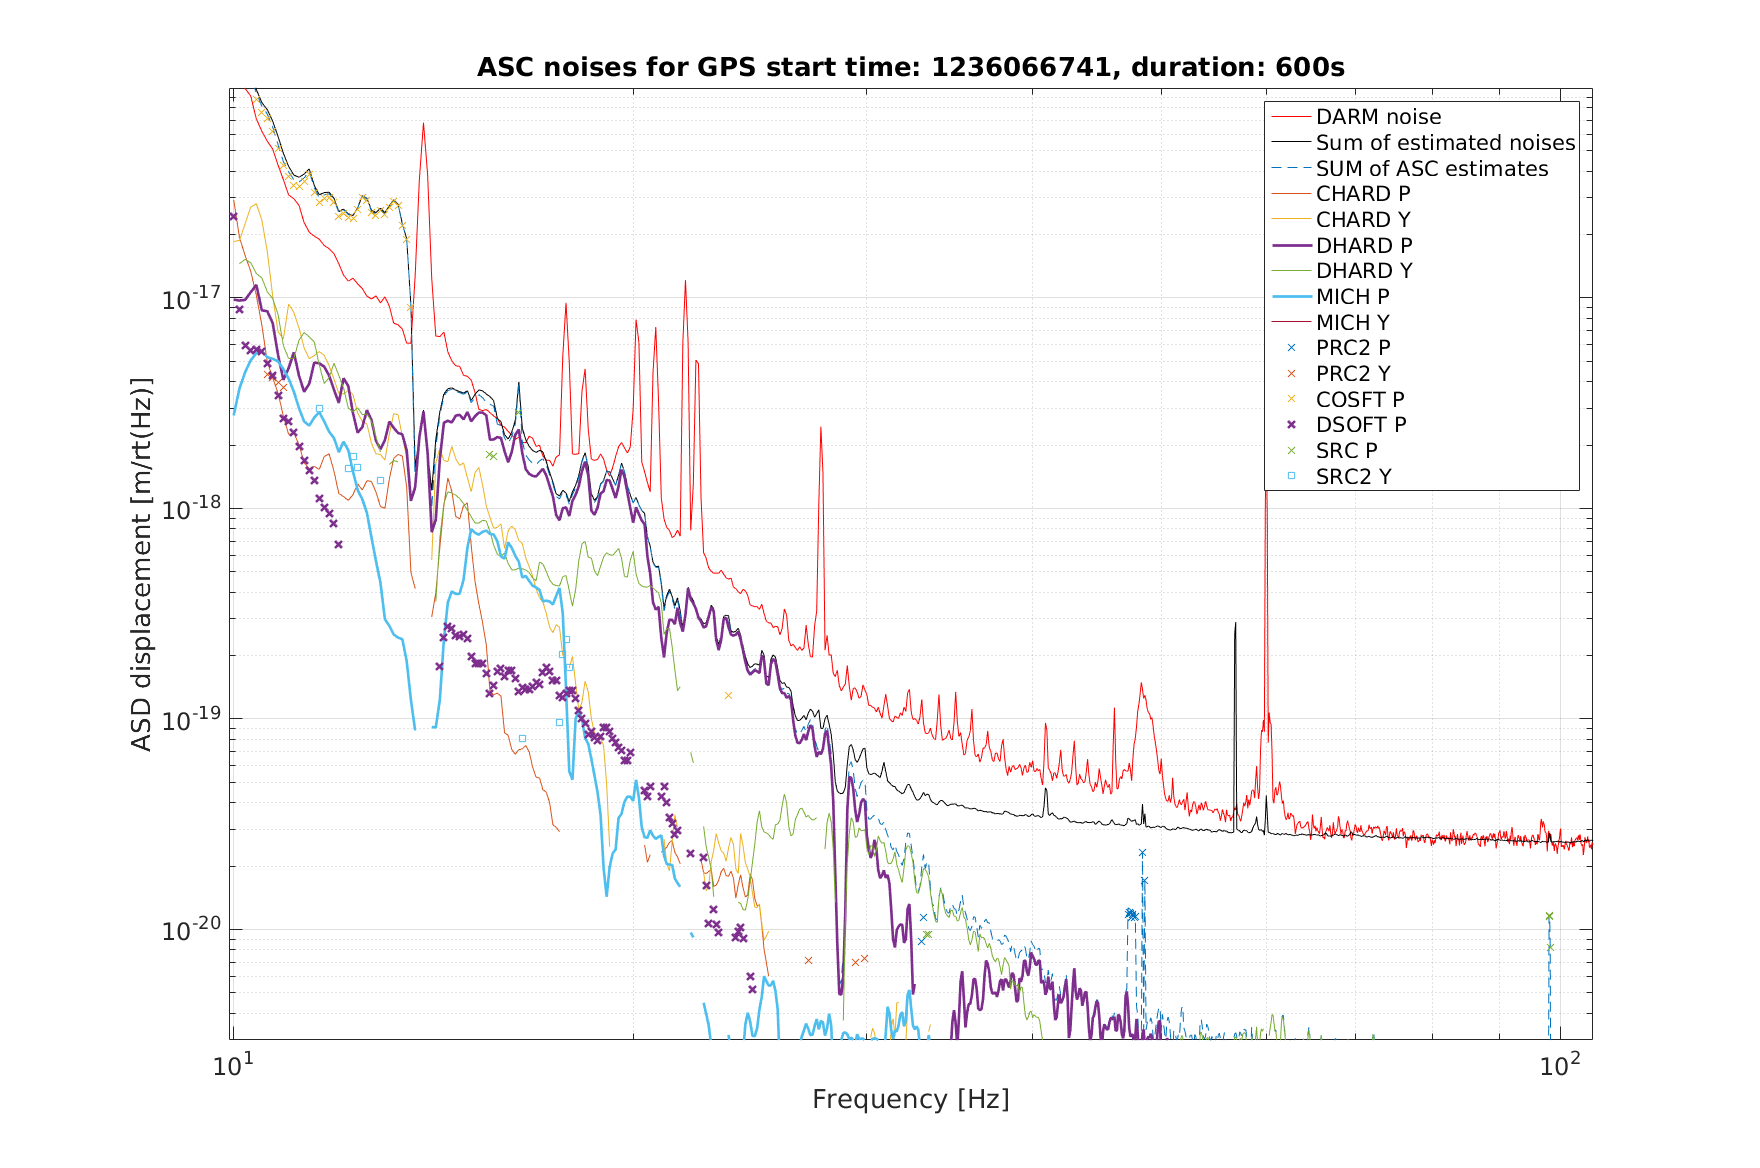
We git-committed the noise budget templates used here, and have rerun the noise budget templates for MICH_P, DHARD_P, DSOFT_P (increased the excitation by a factor of 30 to make it visible in DARM). We still need to re-run the CSOFT_P template to make the ASC contribution to the noise budget up-to-date. We have added DC centering loop templates to the folder however the excitation level needs to be tuned.

A preliminary look at the ASC budget, with the old CSOFT_P measurement, (attached figure) shows we've won a in the <15 Hz region, and we still have some sensitivity to gain by improving DHARD.


Images attached to this comment
daniel.vander-hyde@LIGO.ORG - 03:04, Saturday 09 March 2019 (47413)

Dan, Danny, Alexi

To include the DC centering in the noise budget we excited the DC1 and DC2 pitch and yaw centering loops and DC3 yaw.  It took large amplitudes for us to see coherence in DARM that was mainly below 10 Hz. 

We also injected into the SRC1 yaw excitation point and didn't seem to see anything in DARM even with large amplitudes. 

Not sure if we are doing this right. Might be worth revisiting. We have templates made up for these. They live in /ligo/gitcommon/NoiseBudget/simple-noise-budget

H1 PSL (PSL)
corey.gray@LIGO.ORG - posted 11:06, Thursday 07 March 2019 (47363)
Yesterday: PSL Chiller Water Level Top-Off (FAMIS #10499)

On March 6th:  Crystal Chiller:  150mL added.  Diode Chiller: OK. 

Both filters looked fairly clean (Crystal on left was slightly darker).

H1 CAL
madeline.wade@LIGO.ORG - posted 09:15, Thursday 07 March 2019 (47361)
GDS calibration pipeline configuration updated - fix to injection bits in GDS-CALIB_STATE_VECTOR

M. Wade

We found a problem with the configuration for setting the injection bits in the GDS-CALIB_STATE_VECTOR.  The configuration bug crept in on Feb. 26 and the configurations were correct before this time.  I fixed the configurations and restarted the pipeline around GPS time 1236011968.  The new configuration file is in the calibration SVN under

aligocalibration/trunk/Runs/ER14/GDSFilters/H1GDS_1236011968.ini

The difference in this configuration file and the last one is the CBC, Burst, DetChar, and Stochastic HW injection bitmasks are now configured to look for bits 9, 17, 33, and 65, respectively, to be OFF in CAL-INJ_STATUS_OUT_DQ instead of ON.

Since the restart, the GDS-CALIB_STATE_VECTOR is now correctly reporting that HW injections are OFF.

H1 ISC
daniel.sigg@LIGO.ORG - posted 15:48, Wednesday 06 March 2019 - last comment - 18:17, Tuesday 12 March 2019(47345)
Common mode board readbacks

After modifying the CM board, see alog 47294, the CTRL readout has become significantly better, whereas the ERR readback has gotten a lot worse. However, the CTRL still has extra noise below 100Hz. 

The slow readback was already good, but may have gotten a little better around 20-30Hz.

Compare against alog 47130.

Non-image files attached to this report
Comments related to this report
daniel.sigg@LIGO.ORG - 17:10, Wednesday 06 March 2019 (47349)

Here we look at the slew rate at the AA board input with full sampling rate. At the input of the AA board there are 2 AD8622 which have a slew rate limit of 0.48V/us. Integrating the slew rate we get 0.3V/us, but only half of this voltage goes to each OpAmp. So, we use up about a third of the slew rate limit with the signal below 30kHz. The RMS voltage is about 2V, or 1V per OpAmp, and not limiting by itself.

The full spectrum was measured by Craig in alog 46635.

Non-image files attached to this comment
jeffrey.kissel@LIGO.ORG - 11:13, Thursday 07 March 2019 (47365)
This work is associated with IIET ticket 12419
daniel.sigg@LIGO.ORG - 18:17, Tuesday 12 March 2019 (47483)

Full bandwidth spectrum.

Non-image files attached to this comment
H1 ISC (ISC)
craig.cahillane@LIGO.ORG - posted 01:55, Wednesday 06 March 2019 - last comment - 14:14, Friday 08 March 2019(47326)
Cross Correlated DARM spectrum with glitch gating
I wrote some python code to create cross-correlated DARM spectra over long, glitchy locks.
Stefan balanced the PDs recently, and we saw our correlated DARM noise was fairly high at high frequency.  Stefan supposed this was from glitches, but from this alog, this seems to not be the case.

The info we want from the cross-correlated DCPD spectrum is the correlated noise from the IFO.  We can average away the shot noise like 1/sqrt(N) where N = number of ASD averages.
The problem is we need many averages to integrate away the shot noise.  However, during these locks, we have frequent, strong ESD saturation glitches which spoil the spectrum.  
DTT is not able to "gate" the glitches, i.e. remove them from the timeseries.  This code solves this problem.

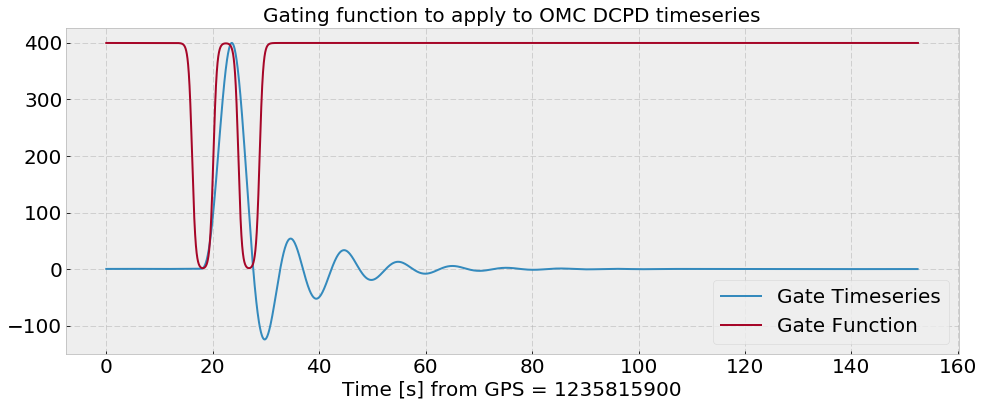
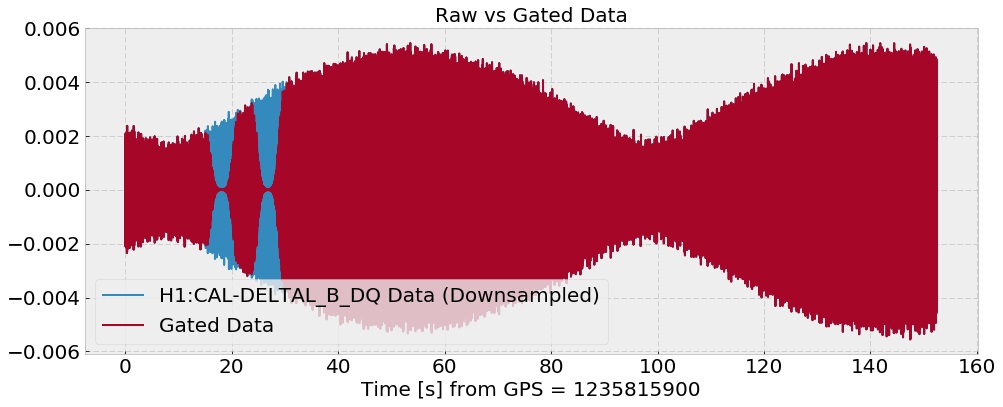
Attachment one shows a DARM ASD and DARM CSD between the OMC DCPDs during the lock last night.  I have 2000 averages with a binwidth of 0.2 Hz and 50% overlap, or 1.4 hours of data.  During this time there were 4 glitches which spoiled the spectra (the blue, purple, and green traces).  With gating we have the red and orange traces.
Attachment two shows a zoomed in gate function of one of these glitches.  The gate I apply is just a logistic function with the mean of the data added in.  The glitches are witnessed via the DARM BLRMS increasing to huge values, specifically H1:OAF-RANGE_RLP_3_OUT16 going above 100 counts.
Attachment three shows the DARM OMC DCPD data with and without the gate applied.  

Code lives in /ligo/home/craig.cahillane/Git/IFO/Crosscorrelations/scripts/gated_DCPD_CSDs.ipynb.  To run you'll have to run:
$ setupanaconda (or $ source /opt/rtcds/userapps/release/cds/h1/scripts/setup_anaconda if your .bashrc alias isn't set up)
$ source activate cragenv
$ jupyter notebook /ligo/home/craig.cahillane/Git/IFO/Crosscorrelations/scripts/gated_DCPD_CSDs.ipynb

Shoutouts to TJ Massinger for help with understanding gating.
Images attached to this report
Comments related to this report
rich.abbott@LIGO.ORG - 11:17, Wednesday 06 March 2019 (47335)ISC
Please can you say exactly what is saturating in the ESD chain and, if you know it, what causes the saturation?
sheila.dwyer@LIGO.ORG - 13:48, Wednesday 06 March 2019 (47341)

Rich:

The large glitches that show up in the BLRMS and as range drops used to always saturate the ESD, but they no longer do saturated the ESD every time  (See 46642).  The ESD saturation seems to be a symptom of the glitches which happen because the ESD sees DARM, not a cause.  Our normal drive to the ESD is not close to saturating, and the glitches don't seem to be happening at times when we have large excursions in the drive to the ESD. 

gabriele.vajente@LIGO.ORG - 11:25, Thursday 07 March 2019 (47367)

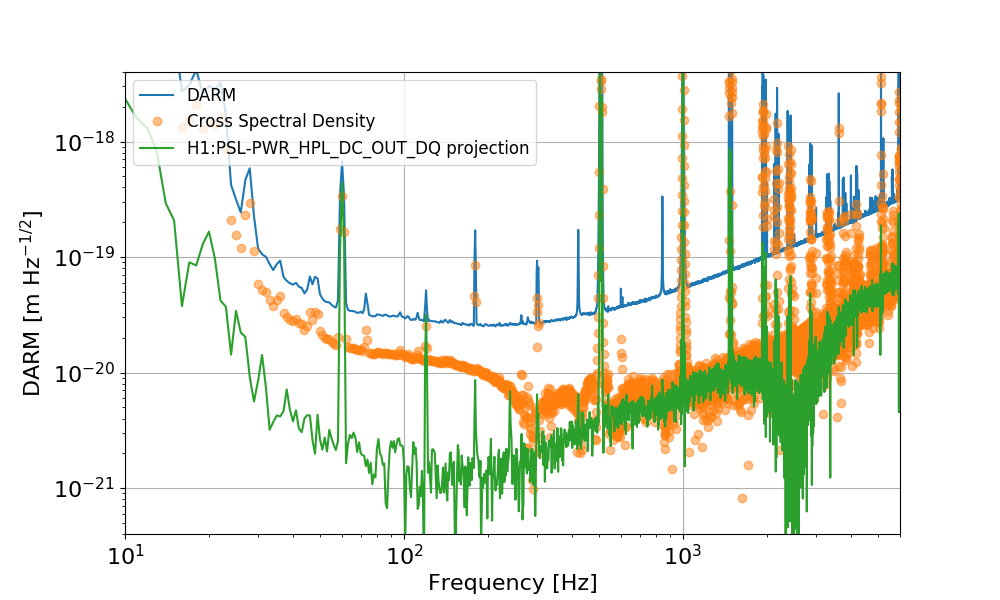
Looking at Craig's cross-correlated noise at high frequency, I remembered that we often see ~low coherence with PSL signals at a few hundreds Hz and above. In particular, looking at a BruCo scan for one of the last locks (bruco_lho_1236004218) I found that above a few hundreds Hz there is significant coherence with H1:PSL-PWR_HPL_DC_OUT_DQ (I'm not sure what that channel is...)

So I used a subset of the time Craig's listed in the plot (between 1235816126 and 1235816900) and computed

  1. PSD of DARM from GDS-CALIB_STRAIN
  2. Cross spectral density of OMC-DCPD_A and B (projected into DARM using the transfer function between OMC_DCPD_SUM and GDS-CALIB_STRAIN)
  3. Coherence-based projection of H1:PSL-PWR_HPL_DC_OUT_DQ into DARM

I used 1-second-long FFTs, to increase the number of averages. Maybe this is why my CSD is a bit lower than Craig's. In any case, it looks like the correlated noise lines up nicely with the projection from that PSL channel (I don't know what the "notch" at 2.5kHz is in the PSL channel projection, but it looks to be at about the right place where the intensity and frequency noises cross over in the noise budget 47351).


Images attached to this comment
jason.oberling@LIGO.ORG - 10:22, Friday 08 March 2019 (47396)

For future reference, the channel H1:PSL-PWR_HPL_DC_OUT_DQ is a power monitor PD on the PSL table.  This PD sits before the ISS AOM (it is PD01 on the PSL table drawing, D1300348 (drawing update for 70W amp in progress update complete)), so any intensity noise it sees is free-running and therefore not suppressed by the ISS.

H1 AOS
stefan.ballmer@LIGO.ORG - posted 22:59, Sunday 03 March 2019 - last comment - 11:11, Thursday 07 March 2019(47255)
CAM24 (ITMY green) restarted

see alog 43530 for howto

Comments related to this report
richard.mccarthy@LIGO.ORG - 07:38, Monday 04 March 2019 (47258)

Rebooted h1digivideo0,h1digivideo2.  As the cameras had died.   I did not check but would assume like h1digivideo1 that was rebooted Friday these have been running a long time and ran out of resources.


stefan.ballmer@LIGO.ORG - 23:25, Sunday 03 March 2019 (47256)

That worked for a couple of minutes - then the camera crashed again.

No a single camera working right now.


jeffrey.kissel@LIGO.ORG - 11:11, Thursday 07 March 2019 (47364)
H1 ISC (ISC)
rich.abbott@LIGO.ORG - posted 21:50, Sunday 03 March 2019 - last comment - 10:23, Tuesday 12 March 2019(47254)
OMC DCPD Whitening Chain Gain Dependent on Input Signal Level
Stefan, Peter, Rich

It was found that the overall DC gain, and the pole-zero location associated with the second filter module of the OMC DCPD Whitening chain, was somehow dependent on input signal level.  A parametric study was done on the OMC DCPD whitening chain for different whitening filter combinations with and without DC offset.  Notes detailing the parametric study are attached to this entry.  

There were two causes of these phenomena:  
1.  Gain Change - As the DC input to the OMC DCPD Whitening amplifier (D1002559 Chassis S1101627) is varied, the DC level causes saturation in some of the DC coupled gain stages.  This saturation causes the normally high-impedance amplifier input to be fairly low due current flowing into the input protection diodes internal to each opamp stage.  This lower input resistance in conjunction with the series resistance of the FET switches produces a voltage divider with a division ratio dependent on signal level.
2.  Pole-Zero Change - The second filter module had an ECR (E1500252) performed that required a 1uF capacitor to be used.  This type of filter function is supposed to be implemented with a plastic film dielectric capacitor, but a ceramic capacitor was used instead.  The piezoelectric nature of ceramic capacitors can result in a capacitance that will change with applied voltage.  This caused the pole-zero location to vary as a function of DC level.  This capacitor was changed to the proper type and the problem went away.

Data (attached) was taken for both OMC DCPD chains by injecting signals into the input of the OMC whitening chassis (DCPD Preamps disconnected), and taking the output differentially from the analog output of the whitening chassis with the ADC cable still attached (to account for any loading effects).  This data was taken with and without a 5V DC offset to verify that there is no longer any effect on the signal path gain.

We note that the above were all small effects, but significant in the world of 1% calibratin uncertainty. The DC gain reduction with a 5 V offset (similar to the offset in NLN operation) was 0.2 dB. The errors in the filter stage with offset were -- phase: 0.6-1 degree at 50 Hz; magnitude: 0.15 dB gain difference between 50 Hz and 200 Hz.
Non-image files attached to this report
Comments related to this report
jeffrey.kissel@LIGO.ORG - 12:55, Monday 04 March 2019 (47271)CAL, ISC
Rich verbally confirms that he and Peter used the measurement setup as described in LHO aLOG 47225 and D1900027, using the coil driver test box as a differential driver. They *did not* gather the test setup's transfer function, however, so this will need to be done in order to analyze the data (attached above, DCPD_Whitening_v2.zip) to the desired precision. Also note that details of the measurement files can be found on the last page of the DCPDWhiteningChanges.pdf attachment.

Also -- I opened (and subsequently closed) FRS Ticket 12453 covering the problem of "changes in frequency response as a result of input signal level" that the solution in this aLOG fixes.

Since this issue will likely impact LLO as well, I've opened up an integration issue,  IIET Ticket 12454, such that the above mentioned change becomes an ECR to be implemented at LLO as well (assuming they have the same problem).
stefan.ballmer@LIGO.ORG - 00:05, Monday 04 March 2019 (47257)

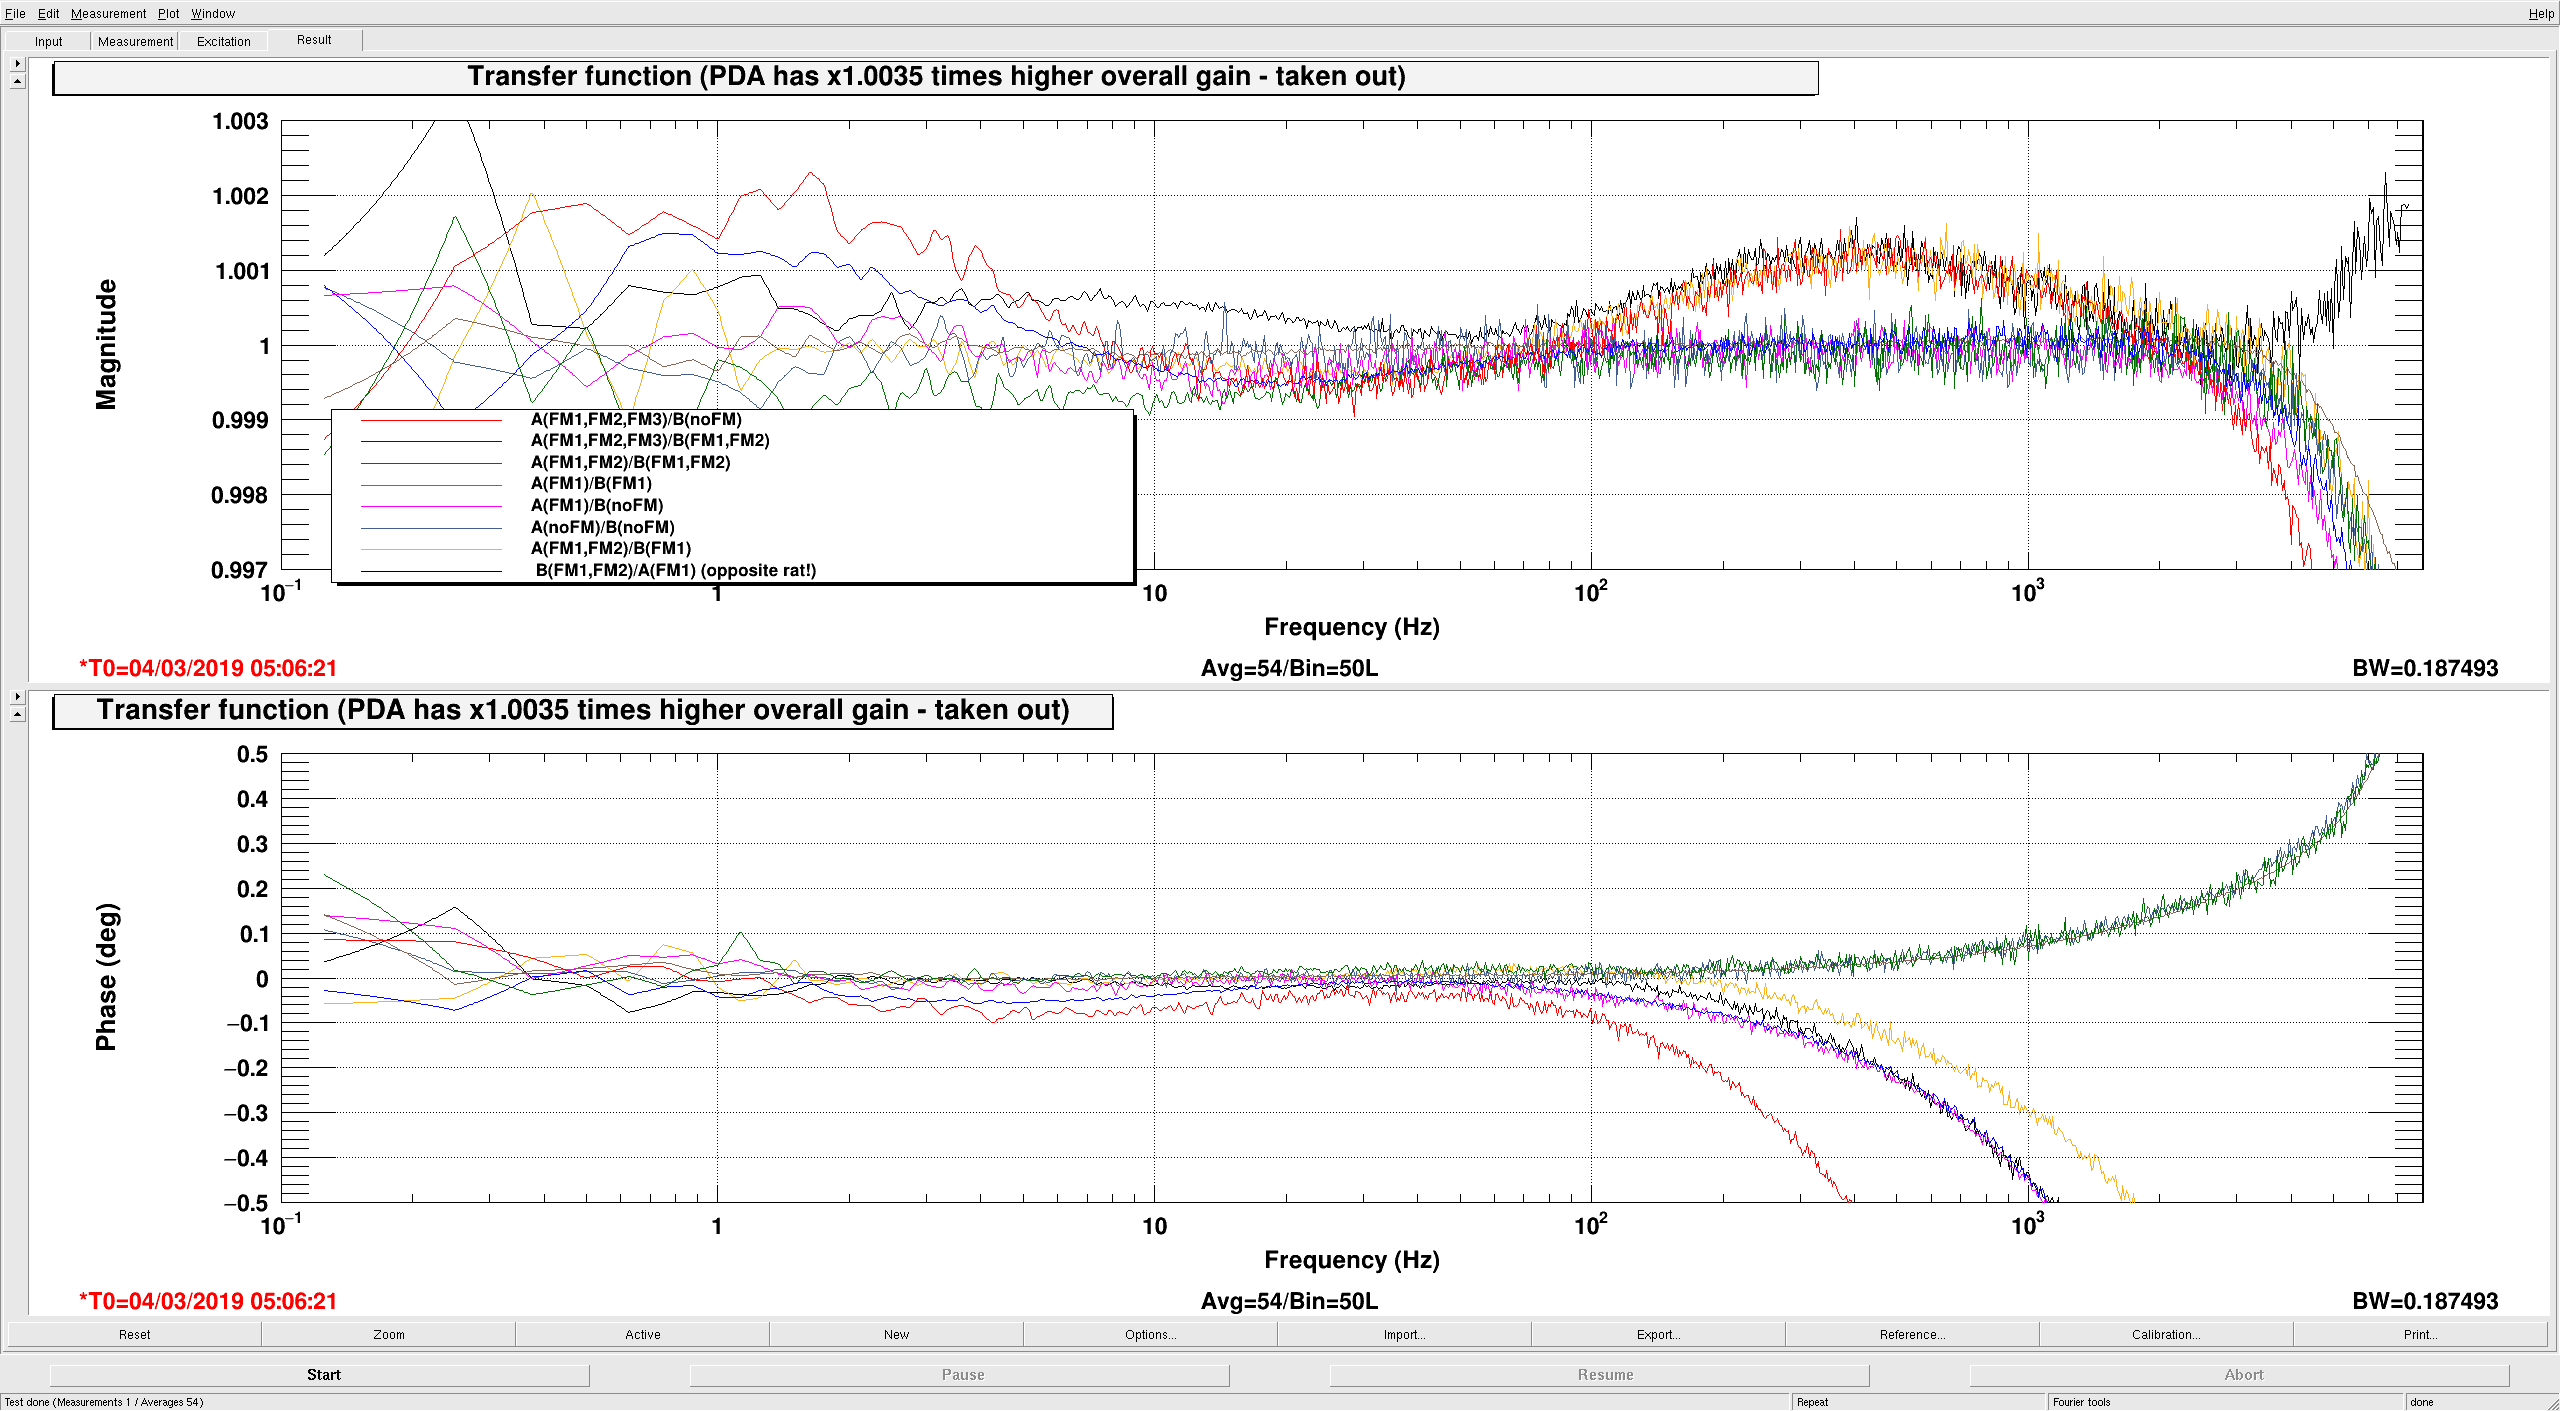
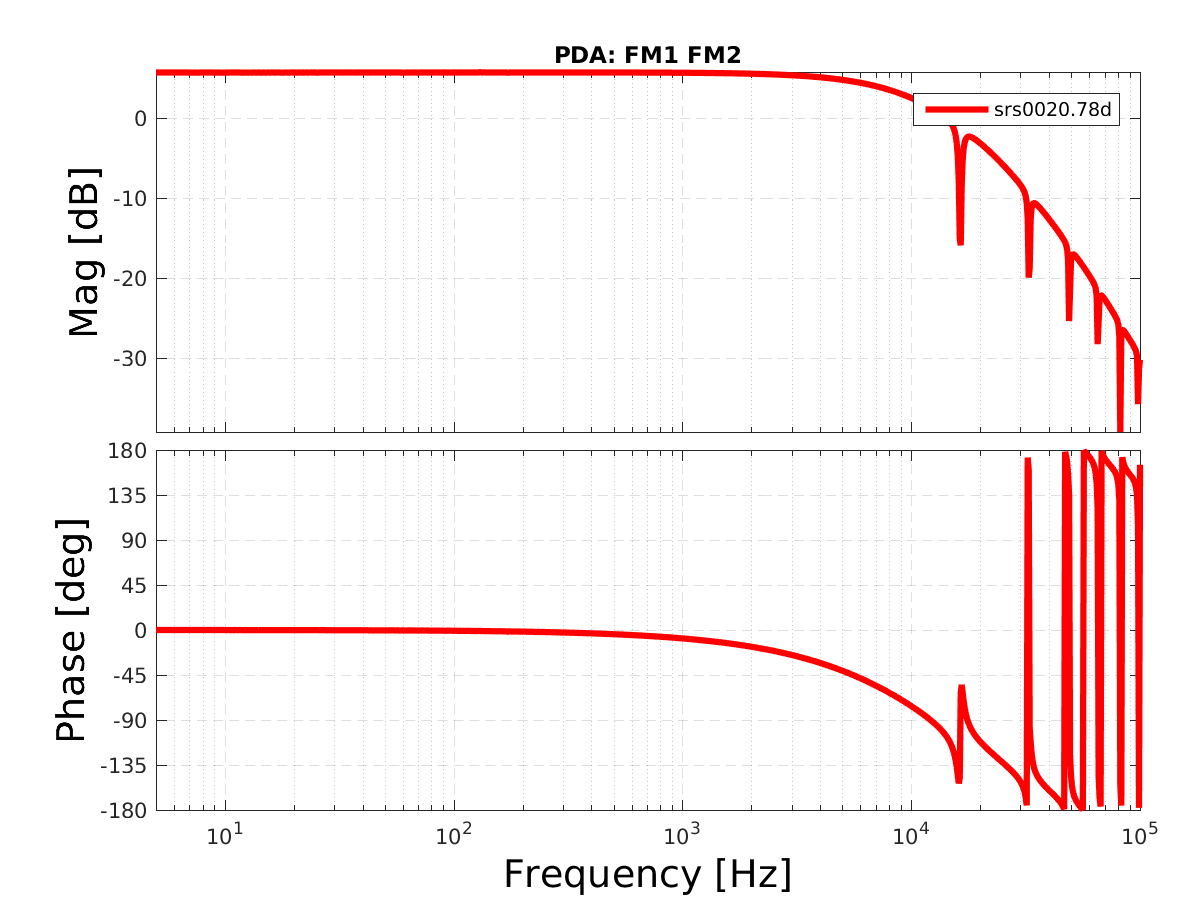
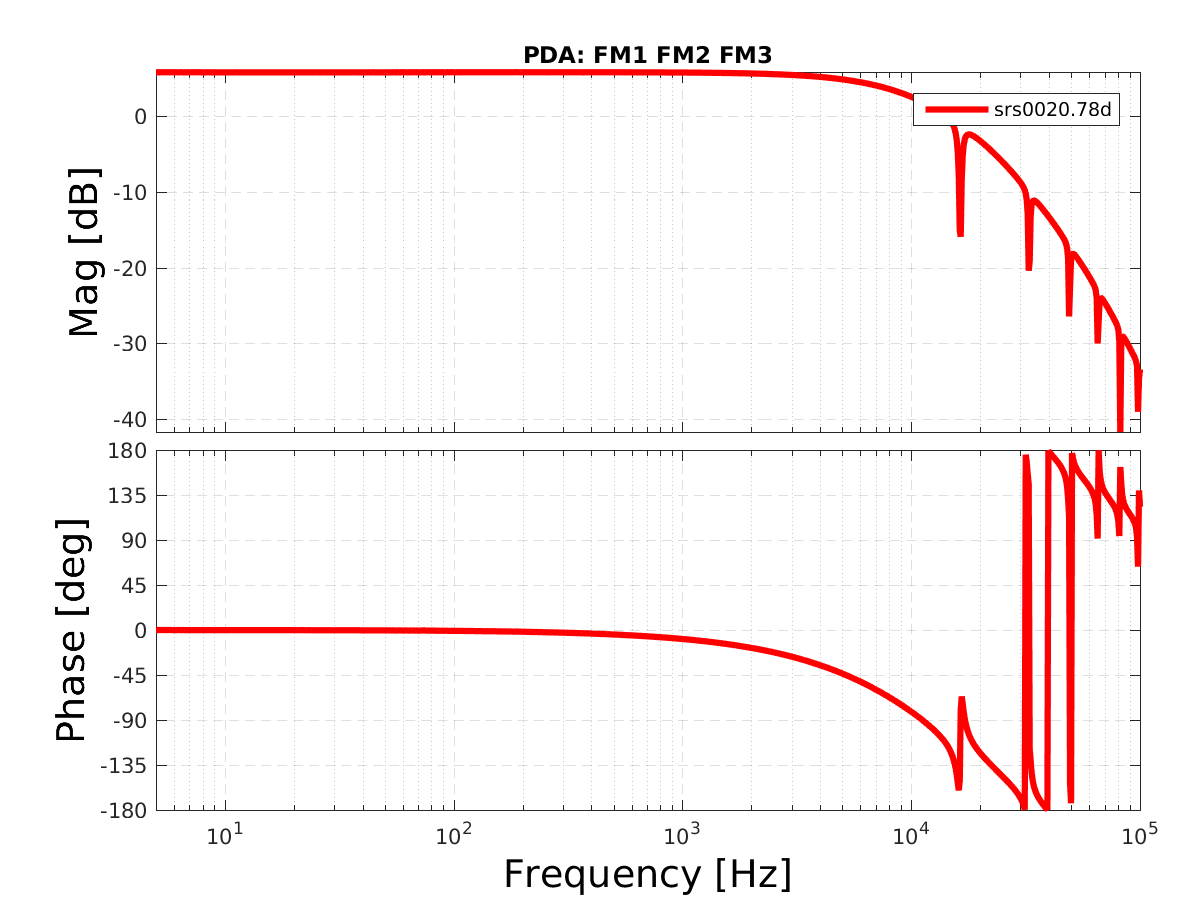
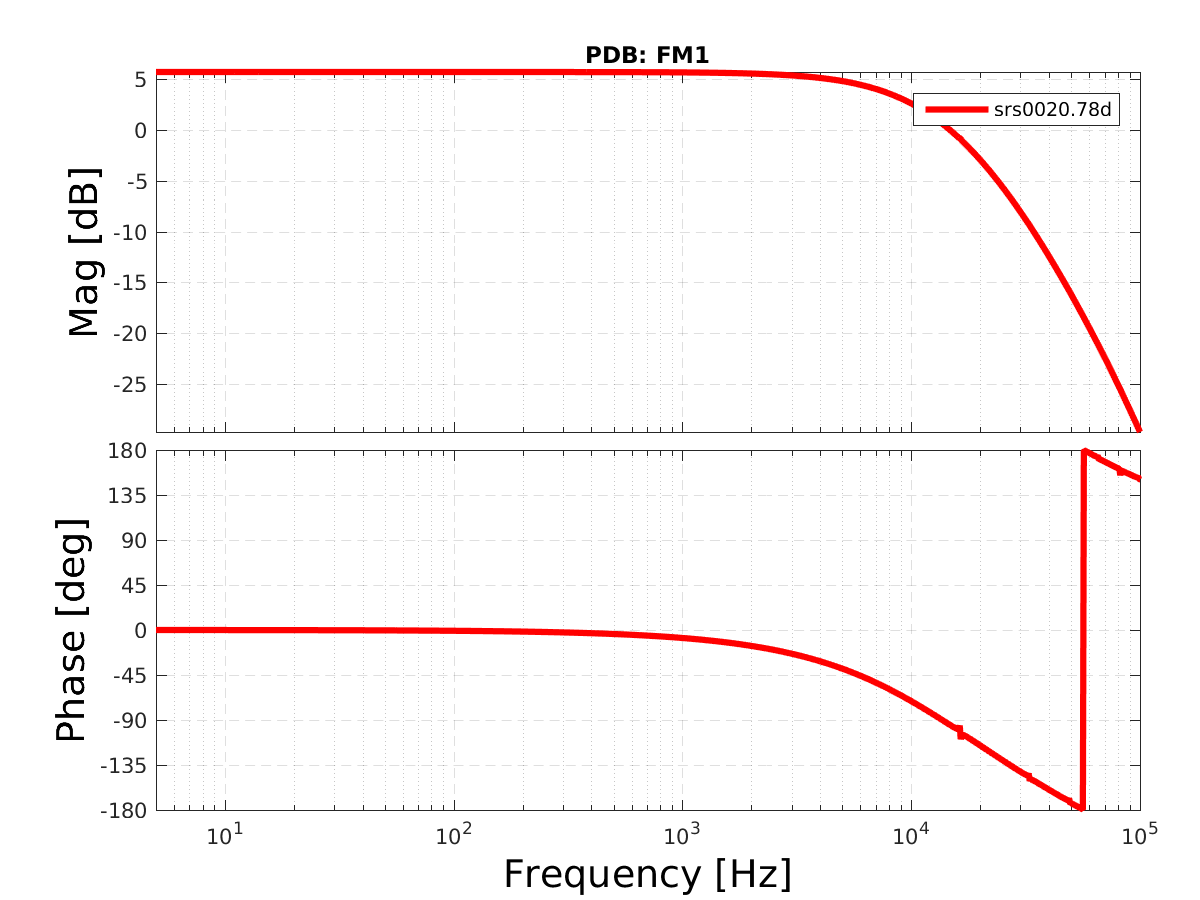
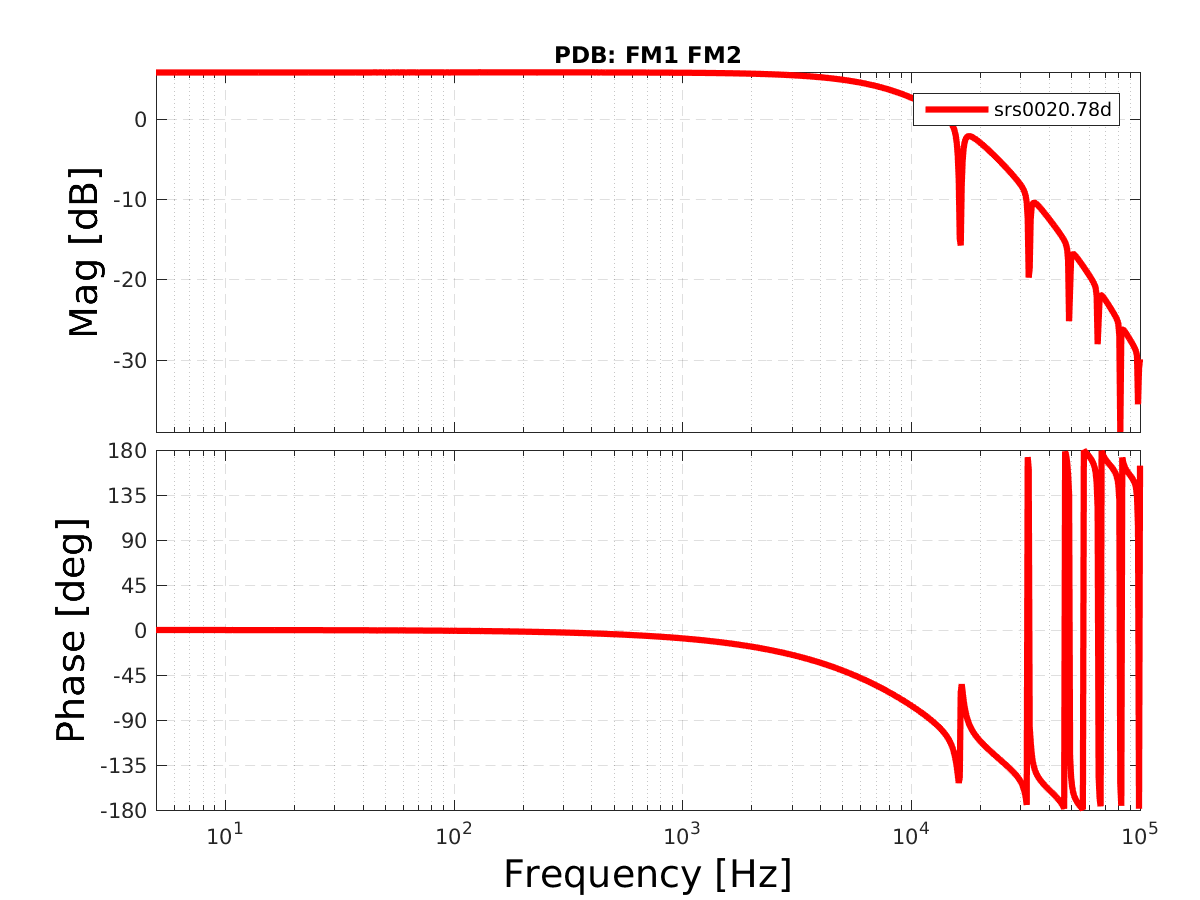
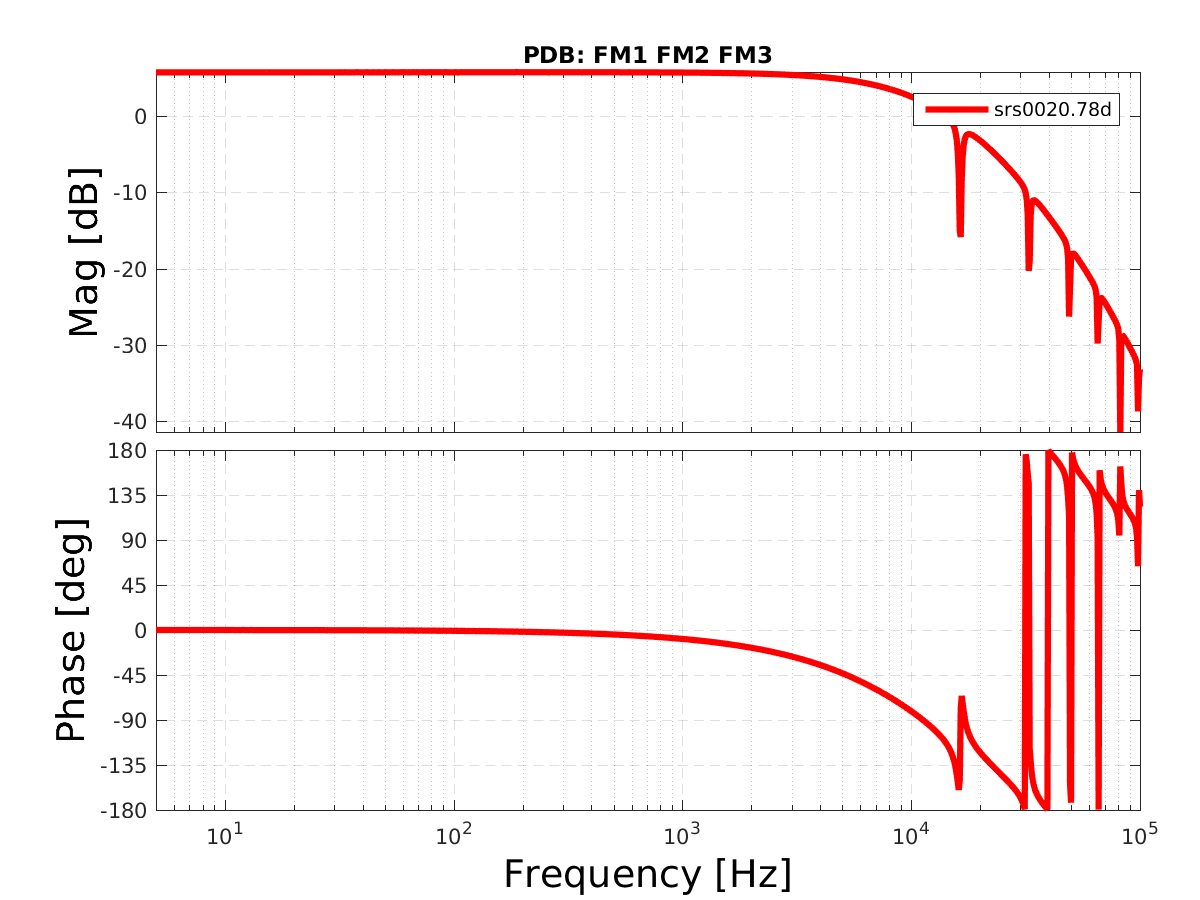
Updated the FM1,FM2,FM3 whitening compensation filters for PDA and PDB.
They are now matched at the +-0.15% level (see plot).
And we verified that they are no loner offset dependent.

Also, to be explicit: We disabled the 12dB, 6dB and 3dB whitening gain steps in both PDA and PDB. The 24dB step is still operational.


The new foton filters are:

PDA:
FM1: zpk([10.44],[0.996],0.9734,"n")
FM2: zpk([49.63],[497.5],-0.9995,"n")
FM3: zpk([10.372],[0.9865],1.002,"n")

PDB:
FM1: zpk([10.160],[0.969],0.975458,"n")
FM2: zpk([49.72],[497.7],-1.0004,"n")
FM3: zpk([10.467],[1.000],.9973,"n")

Using this filter, we injected pink noise into both DCPDs, and plotted the PD ratio in various configurations to verify the filter compensation. Specifically, plotted are:

A(FM1,FM2,FM3)/B(noFM)
A(FM1,FM2,FM3)/B(FM1,FM2)
A(FM1,FM2)/B(FM1,FM2)
A(FM1)/B(FM1)
A(FM1)/B(noFM)
A(noFM)/B(noFM)
A(FM1,FM2)/B(FM1)
B(FM1,FM2)/A(FM1) (opposite rat!)

The xml file with the data in the plot is in /ligo/home/controls/sballmer/20190303/DCPDfinal.xml

Finally, we still will have to re-match the photo diode light levels in lock (alog 47217).


Images attached to this comment
stefan.ballmer@LIGO.ORG - 10:24, Monday 04 March 2019 (47264)

All this was done to fix the problem identified in alog 47247.

stefan.ballmer@LIGO.ORG - 17:26, Monday 04 March 2019 (47280)

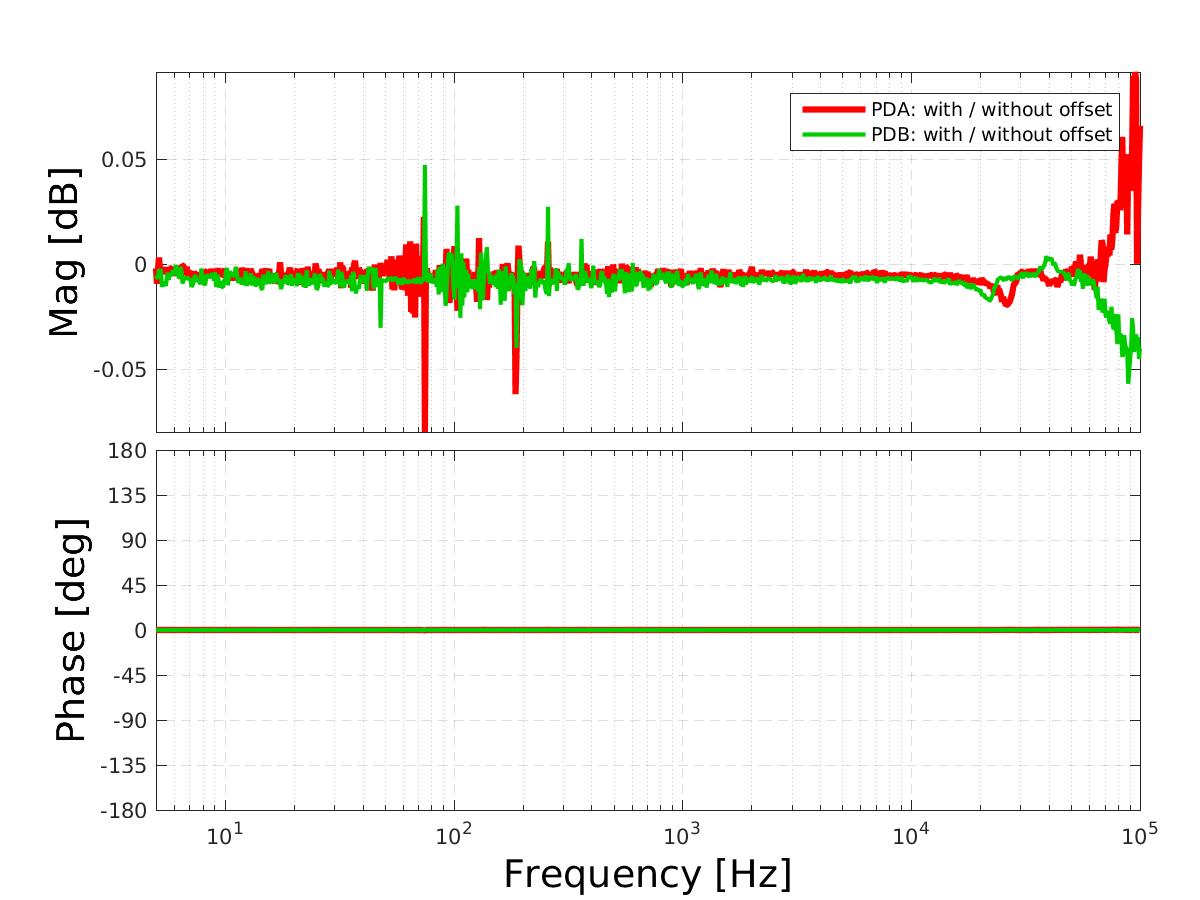
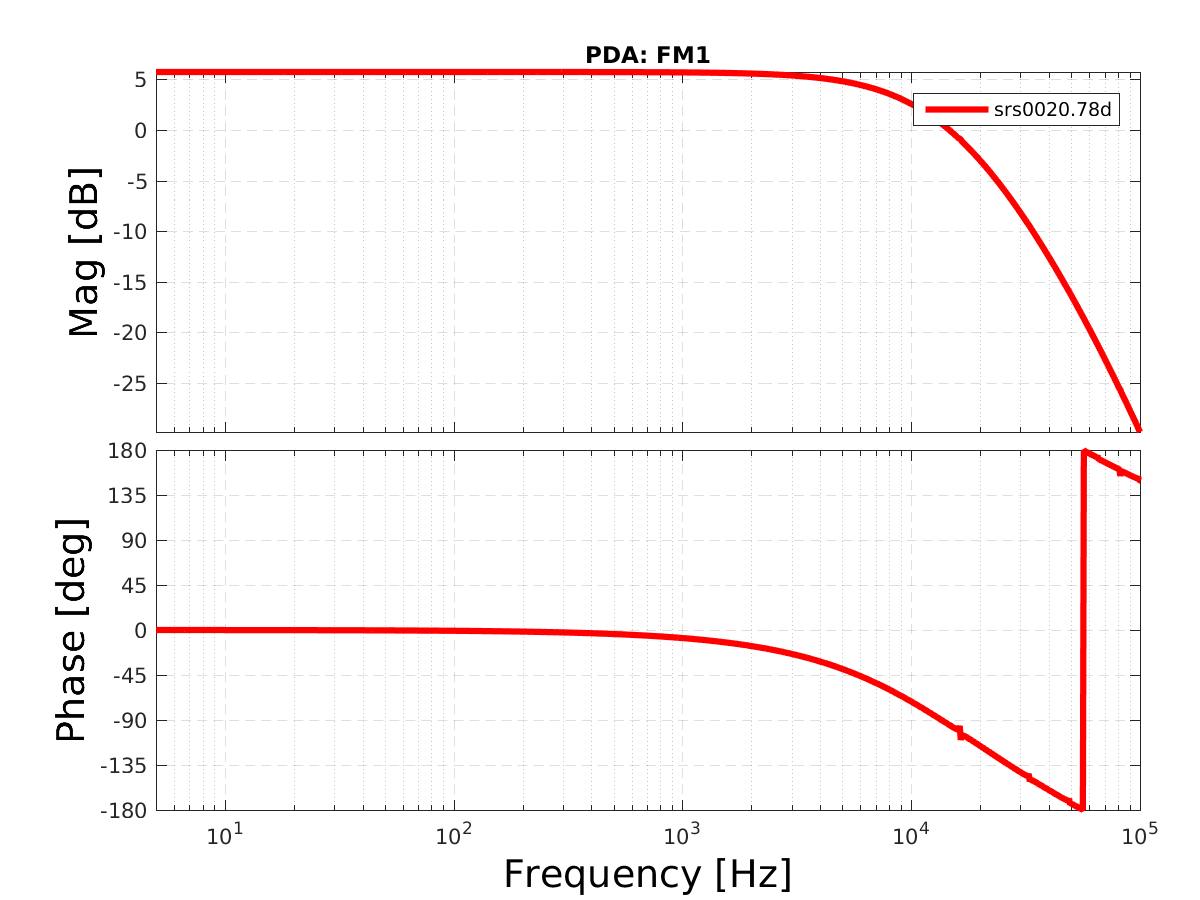
Attached are plots of

- Transfer function wit- over-without offset. The insanity is indeed gone.

- PDA: FM1, FM1FM2, FM1FM2FM3 - all normalized with their compensation filter.

- PDB: FM1, FM1FM2, FM1FM2FM3 - all normalized with their compensation filter.

In short: the current compensation is good at the 0.02dB level. One could still improve it...

The plotting MATLAB code is here: /ligo/home/controls/sballmer/20190304/DCPD

Images attached to this comment
jeffrey.kissel@LIGO.ORG - 10:43, Tuesday 05 March 2019 (47290)CAL, ISC
I've moved the contents of Stefan's results from his home directory on the local file system into the calibration SVN (though I've not yet modified his plotting script for the new directories and/or to spit out the right file names).

I used the follow commands to do so:
Data:
    cd /ligo/svncommon/CalSVN/aligocalibration/trunk/Common/Electronics/H1/Data/OMCWhiteningChassis/2019-03-04/
    cp /ligo/home/controls/sballmer/20190304/DCPD/SRS00* ./
    cp /ligo/home/controls/sballmer/20190304/DCPD/srs00* ./
    cp /ligo/home/controls/sballmer/20190304/DCPD/47254_20190303213* ./

Script:
    cd /ligo/svncommon/CalSVN/aligocalibration/trunk/Common/Electronics/H1/Scripts/
    cp /ligo/home/controls/sballmer/20190304/DCPD/plotData.m plot_omcdcpdwhiteningmods_20190304.m

Results:
    cd /ligo/svncommon/CalSVN/aligocalibration/trunk/Common/Electronics/H1/Results/OMCWhiteningChassis/
    cp /ligo/home/controls/sballmer/20190304/DCPD/PD*.png ./
    rename 's/PD/2019-03-04\_H1OMC\_WhiteningChassisTFs\_PD/' PD*.png

Thus the new script name to plot the data is:
    /ligo/svncommon/CalSVN/aligocalibration/trunk/Common/Electronics/H1/Scripts/plot_omcdcpdwhiteningmods_20190304.m

which should be modified to analyze the following data:
    /ligo/svncommon/CalSVN/aligocalibration/trunk/Common/Electronics/H1/Data/OMCWhiteningChassis/2019-03-04/
        SRS00*.78D
        srs00*.asc
using the notes in the file
    /ligo/svncommon/CalSVN/aligocalibration/trunk/Common/Electronics/H1/Data/OMCWhiteningChassis/2019-03-04/
        47254_20190303213544_DCPDWhiteningChanges.pdf

and to produce plots and results with similar file tags as
    /ligo/svncommon/CalSVN/aligocalibration/trunk/Common/Electronics/H1/Results/OMCWhiteningChassis/
        2019-03-04_H1OMC_WhiteningChassisTFs_PD*.png
(or the code should be re-written to use your favorite fitting code [maybe in python using IIRrational] and produce plots and results with similarly explicit file names with indications of the date, the interferometer, and WhiteningChassisTFs in the file name.)
ling.sun@LIGO.ORG - 14:16, Thursday 07 March 2019 (47358)

Lilli S.,

First, I have renamed the data files in dir /ligo/svncommon/CalSVN/aligocalibration/trunk/Common/Electronics/H1/Data/OMCWhiteningChassis/2019-03-04/, so that they match what is described in note /ligo/svncommon/CalSVN/aligocalibration/trunk/Common/Electronics/H1/Data/OMCWhiteningChassis/2019-03-04/47254_20190303213544_DCPDWhiteningChanges.pdf

The test box has been factored out. (Test box data: /ligo/svncommon/CalSVN/aligocalibration/trunk/Common/Electronics/H1/Data/CoilDriverTestBox/S1900070/)

The fitting script is /ligo/svncommon/CalSVN/aligocalibration/trunk/Common/Electronics/H1/Scripts/fit_OMCDCPDWhiteningChassis_20190304.py 

The results are in the table below. The fitting plots are in the attachments.

The low-freq poles/zeros roughly match Stefan's results. In O1 and O2 we used 1 stage of whitening (FM1), and the high freq poles were at [(14.34e3 + 14.60e3)/2, (18.68e3 + 18.57e3)/2, (98.94e3 + 100.45e3)/2] Hz. The new fitting for FM1 is consistent with O1 and O2.

Take PDA FM1FM2FM3 noDC as an example, manually build TF by removing the high-freq zeros, and plot the residual -> see diff.pdf 

By ignoring the high-freq zeros, there's little impact on magnitude, but there's phase difference at higher freq (~<1 deg below 5k Hz).

  PDA PDB Comments
FM1FM2FM3 (no DC) PDA, Filters: FM1FM2FM3noDC Results: z:p:k
[  3.90426349e+06   3.90426349e+06   4.99892253e+02   1.08290122e+00
   1.08040698e+00]
[  1.04233314e+01   3.26866242e+04   3.26866242e+04   1.13980014e+04
   4.97078295e+01   1.04233314e+01]
-8.68011786846
PDB, Filters: FM1FM2FM3noDC Results: z:p:k
[  4.64029327e+06   4.64029327e+06   5.00447159e+02   1.07523773e+00
   1.07282309e+00]
[  1.03389750e+01   3.28642175e+04   3.28642175e+04   1.15193027e+04
   1.03389750e+01   4.97939024e+01]
-6.26981682358

Low-freq zeros near 1Hz, 1Hz, 500Hz, and poles near 10Hz, 10Hz, 50Hz (as expected)

High-freq poles near 12K, 33K, 33K Hz.

FM1FM2FM3 (4.99V DC) PDA, Filters: FM1FM2FM3DC Results: z:p:k
[  4.83659991e+06   4.83659991e+06   4.99682906e+02   1.08106936e+00
   1.08299624e+00]
[  1.04231076e+01   3.28748478e+04   3.28748478e+04   1.13460627e+04
   1.04231076e+01   4.96890494e+01]
-5.6929144981
PDB, Filters: FM1FM2FM3DC Results: z:p:k
[  3.93271594e+06   3.93271594e+06   5.00449636e+02   1.07585358e+00
   1.07328174e+00]
[  4.98000266e+01   3.28631506e+04   3.28631506e+04   1.15205406e+04
   1.03375026e+01   1.03375026e+01]
-8.72188264417

Low-freq zeros near 1Hz, 1Hz, 500Hz, and poles near 10Hz, 10Hz, 50Hz (as expected)

High-freq poles near 12K, 33K, 33K Hz.

FM1FM2 (no DC)

PDA, Filters: FM1FM2 Results: z:p:k
[  3.88449944e+06   7.08310144e+05   4.99921161e+02   1.17529230e+00]
[  8.83316503e+04   2.04242818e+04   1.22505800e+04   4.96735061e+01
   1.04906496e+01]
-8.30876928807

PDB, Filters: FM1FM2 Results: z:p:k
[  2.11805525e+06   8.72055868e+05   5.00733633e+02   1.14755102e+00]
[  2.04506589e+04   1.24360067e+04   8.94998324e+04   4.97729997e+01
   1.02056871e+01]
-12.7328787001

Low-freq zeros near 1Hz, 500Hz, and poles near 10Hz, 50Hz (as expected)

High-freq poles near 12K, 20K, 89K Hz.

FM1 (no DC) PDA, Filters: FM1 Results: z:p:k
[  4.22938089e+06   4.22938089e+06   1.17507390e+00]
[  1.27384958e+04   1.93716076e+04   9.29113659e+04   1.04895576e+01]
13.3497796427
PDB, Filters: FM1 Results: z:p:k
[  4.84207436e+06   4.84207436e+06   1.14699930e+00]
[  1.29122349e+04   1.93696499e+04   9.46279852e+04   1.02067553e+01]
10.4974545401

Low-freq zeros near 1Hz and poles near 10Hz (as expected)

High-freq poles near 13K, 19K, 93K Hz.

noFM (no DC) PDA, Filters: noFM Results: z:p:k
[  1.26091781e+07   3.57048935e+07   2.05610666e-01]
[  1.28075383e+04   1.92624890e+04   1.84656469e+06   4.98134421e-02]
0.980629117874
PDB, Filters: noFM Results: z:p:k
[  2.82948542e+07   2.84161583e+07   2.05615042e-01]
[  1.29617754e+04   1.93273505e+04   2.08761329e+06   4.98133861e-02]
0.629314166113

High-freq poles near 13K, 19K Hz.

Unphysical low-freq zero near 0.2Hz and pole near 0.05Hz.


Non-image files attached to this comment
jeffrey.kissel@LIGO.ORG - 17:52, Thursday 07 March 2019 (47377)CAL
Concluding from the results of the fit above, I'll be updating the calibration model parameters to change from the previous measurement of the DCPD whitening chassis (before O2, when the nominal configuration was to only have the first stage of whitening -- "F1" or "FM1" -- on; see LHO aLOG 28087) from 
                          PDA            PDB              PDA          PDB             PDA            PDB
    uncompOMCpoles_whitening = [(14.34e3 + 14.60e3)/2, (18.68e3 + 18.57e3)/2, (98.94e3 + 100.45e3)/2];
to the new fitted measurement results, and choosing the new nominal configuration, with all three filters on (the 1st and 3rd stages, which are whitening and the 2nd stage which is a low pass, i.e. "FM1FM2FM3" or "3 filt"), and using the 5 V_DC offset fit results because it's more representative of the nominal running conditions of the chassis (with the poles rounded to the nearest Hz) 
                          PDA            PDB               PDA             PDB                 PDA             PDB
    uncompOMCpoles_whitening = [(11.346e3 + 11.521e3)/2, (32.875e3 + 32.863e3)/2, (32.875e3 + 32.863e3)/2];
ling.sun@LIGO.ORG - 14:26, Friday 08 March 2019 (47394)

Lilli S.,

The residual contribution plot is attached. This was generated using /ligo/svncommon/CalSVN/aligocalibration/trunk/Common/Electronics/H1/Scripts/fit_OMCDCPDWhiteningChassis_20190304-vsOriginal.py

(based on reference model modelparams_H1_20190118)

The results is averaged after using different poles/zeros in PDA and PDB, instead of using the same set of averaged poles/zeros in PDA and PDB.

Non-image files attached to this comment
rich.abbott@LIGO.ORG - 07:52, Monday 11 March 2019 (47418)ISC
Per Jeff's request that the original DCPD files be included, I am attaching the data extending down to 0.5Hz for the OMC DCPD Whitening chain as taken on the floor by signal injection into the front panel of the Split Whitening Chain via an SR785
Non-image files attached to this comment
ling.sun@LIGO.ORG - 10:23, Tuesday 12 March 2019 (47453)

Attached are two plots:

A) The comparison of TFs:

1. All low-freq z:p + high-freq p + out-of-band z from IIRrational fitting

2. Dead reckoned z:p = [500, 1, 1]:[50, 10, 10]

3. Low-freq z:p from Stefan's fitting in 47257

4. Low-freq z:p from Stefan's fitting in 47257 + high-freq p from IIRational

B) The comparison of contribution residuals, by using the latest H1 model 20190301

The scripts live in

/ligo/svncommon/CalSVN/aligocalibration/trunk/Common/Electronics/H1/Scripts/fit_OMCDCPDWhiteningChassis_20190304-compareTF.py

/ligo/svncommon/CalSVN/aligocalibration/trunk/Common/Electronics/H1/Scripts/fit_OMCDCPDWhiteningChassis_20190304-compareRes.py


Non-image files attached to this comment
H1 TCS
daniel.brown@LIGO.ORG - posted 14:02, Friday 22 February 2019 - last comment - 18:17, Friday 08 March 2019(47081)
Initial ITMY mask test and 9MHz RIN line

Danny, Dan

9MHz RIN line over locks

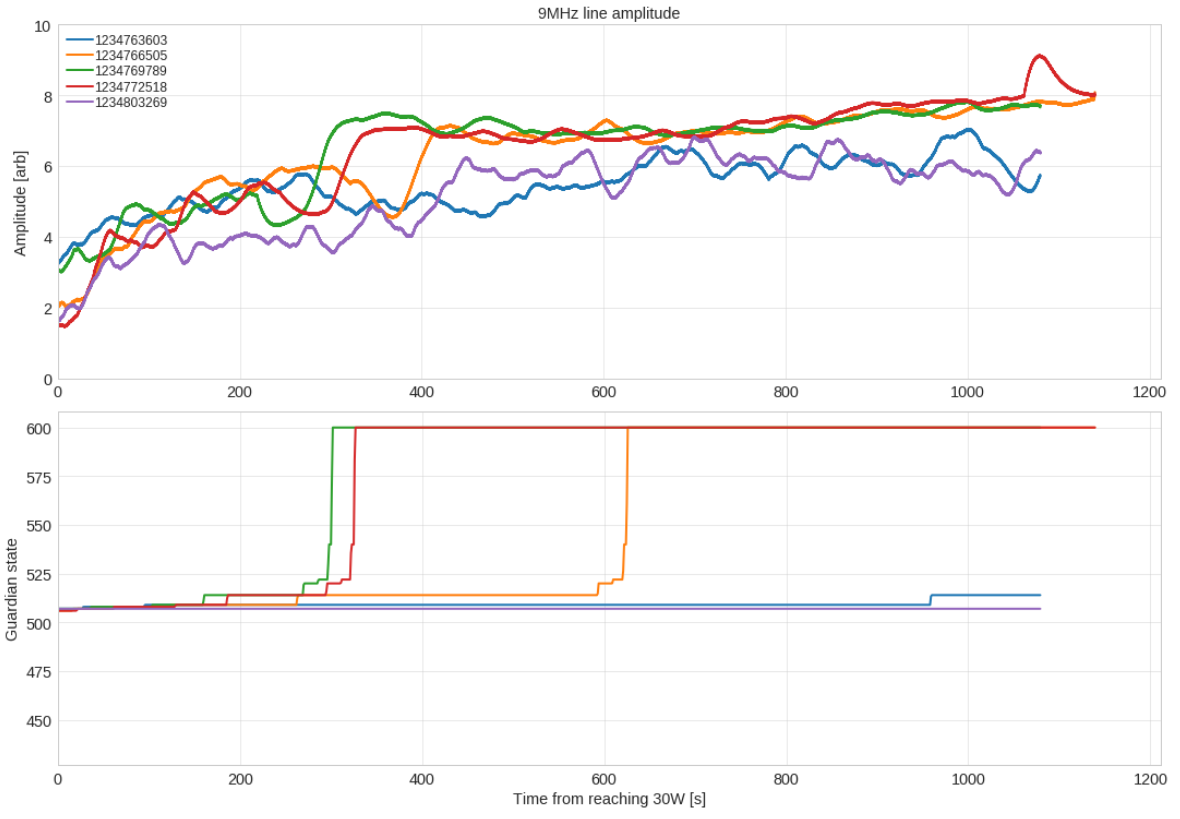
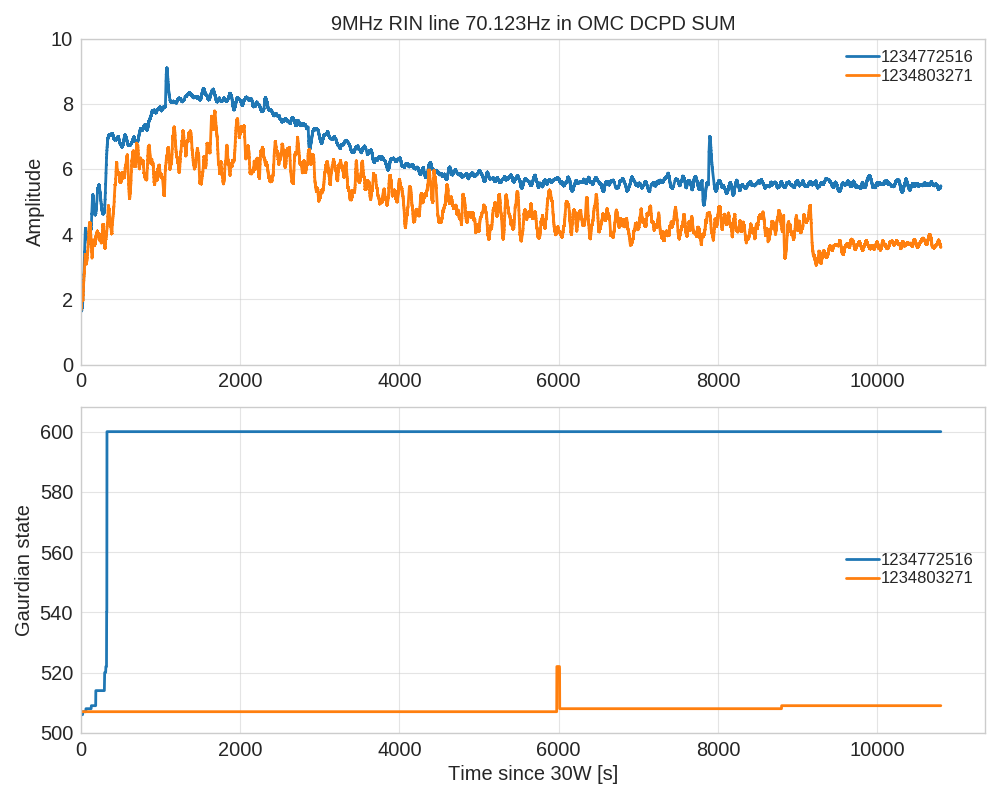
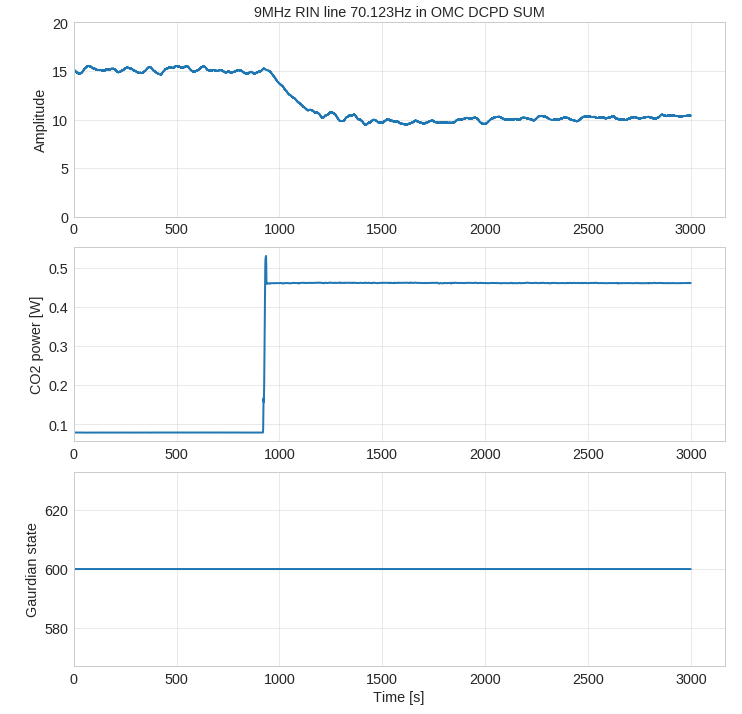
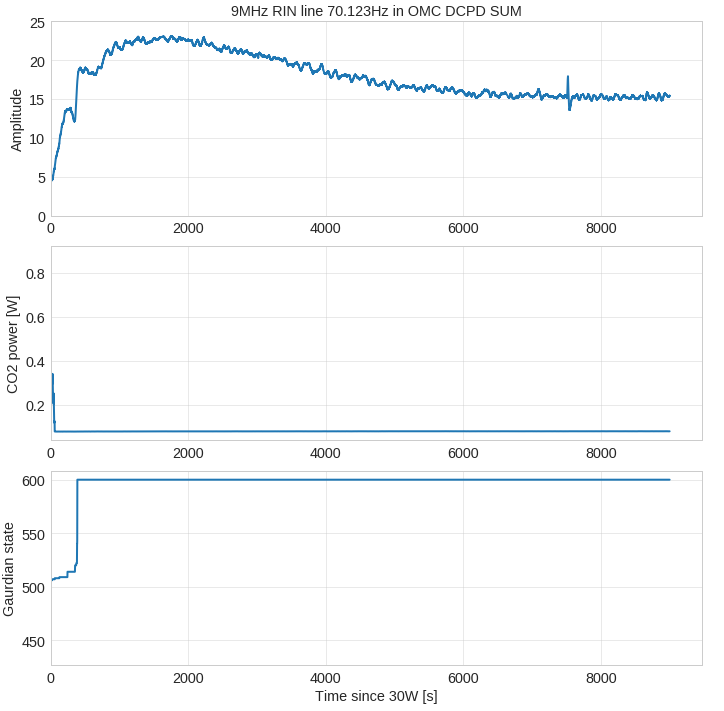
We put a line at 70.123Hz in the 9MHz for a few locks to see how it was behaving over time. When it was one we had a few short locks and two longer ones so far. It seems there are two states in which the coupling finds itself, one that peaks around "8" and another "6". This may coincide with going to LOWNOISE_ESD_ETMX (Guardian state 514) - the jump up in RIN coupling for red/green/orange seems to happen at roughly the same time after we go up to state 514. During the two long locks it's clear there's some long time constant to the RIN coupling, it takes around 4000s after going to 30W for this to settle. So depending on the thermal state we took the RIN measurements previously this might be a reason we got confused.

ITMY Mask

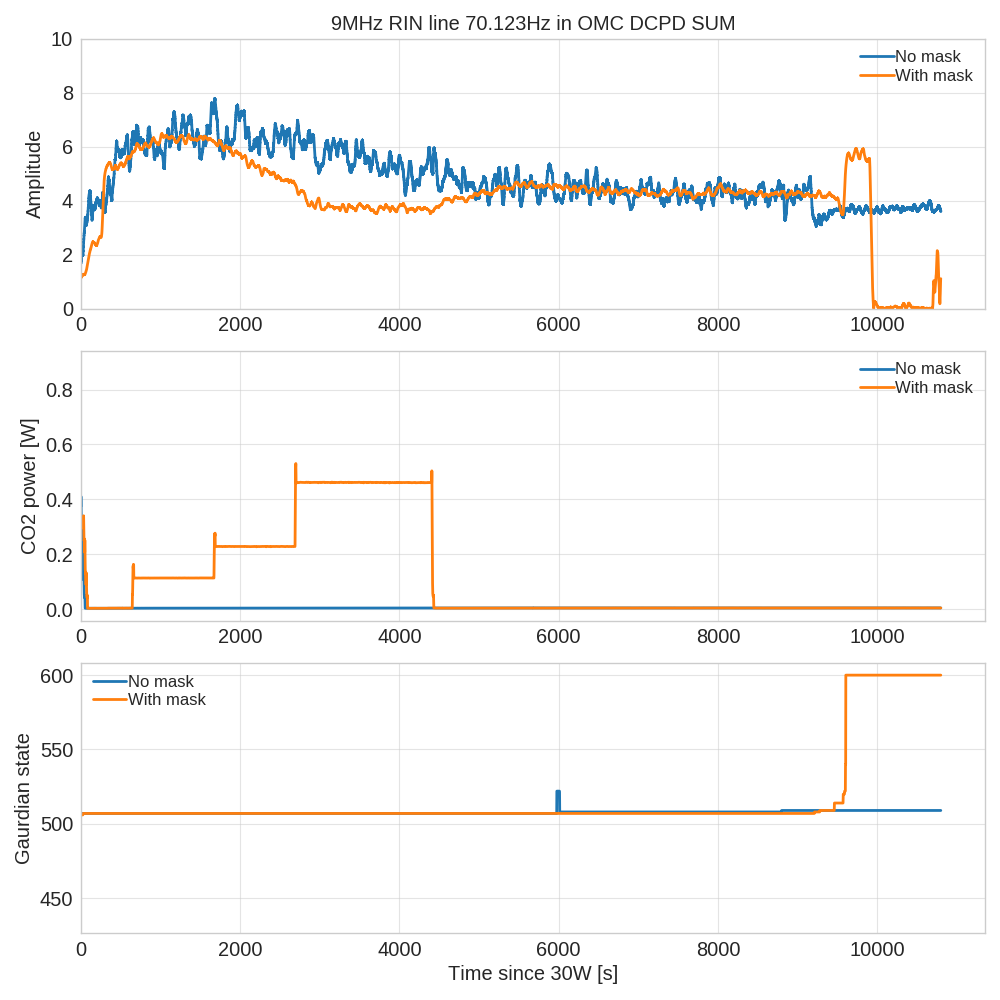
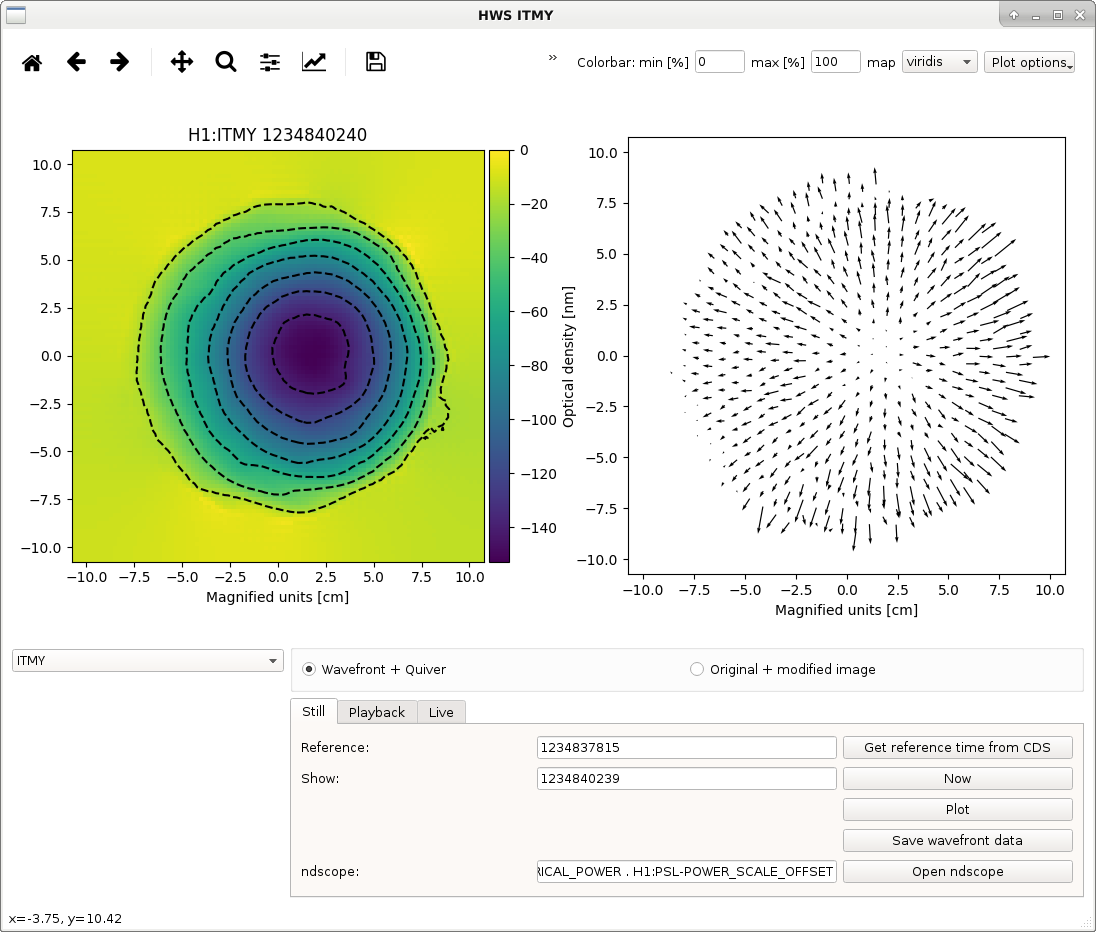
Last night we tried out the ITMY mask. The initial plan was to just apply the mask with the IFO unlocked to see how the induced OPD compared to what we expected. Then as we had the IFO to ourselves we decided to just go for it and try it out in a full lock to see what happened. Edit: this test was just to get the CO2 mask on at the expected power without causing a lockloss, the expected implementation requires changing ring heaters as well which is something to try another day.

Initially the OPD doesn't look quite like we expected. What isn't obvious is the crescent moon like shape seen in alog 46976 (Top right figure). This could be because the HWS probe beam isn't illuminating the full area so we just see a small section of it. I took the 30W point absorber OPD and added it to the offline mask OPD to get a rough idea of what might be the total effect, from this it reduces the overall optical depth and the larger spatial frequency heating from the absorbers.

From initial inspection the alignment of the minimum is not too far off from the point absorbers, we might want to try shifting the mask slightly in future. However it looked reasonably well aligned enough to try in a full lock.

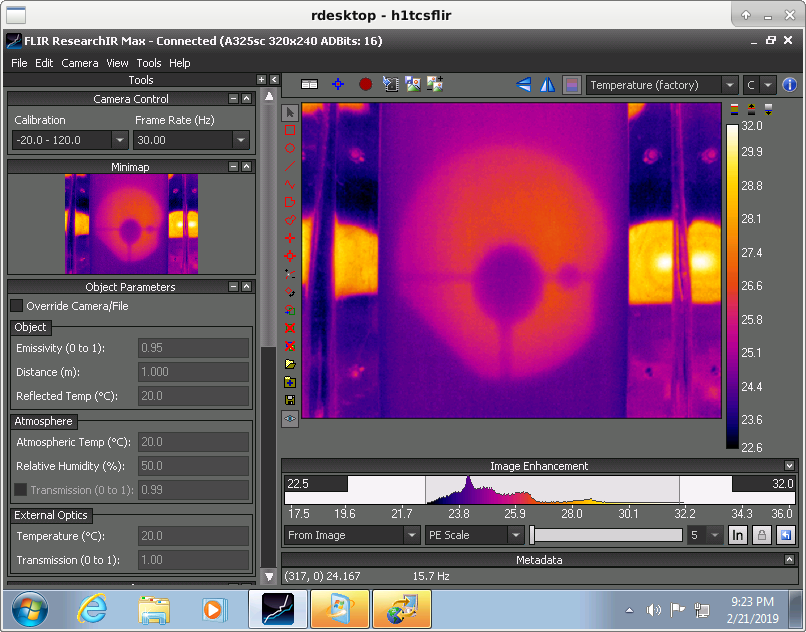
FLIR image of mask

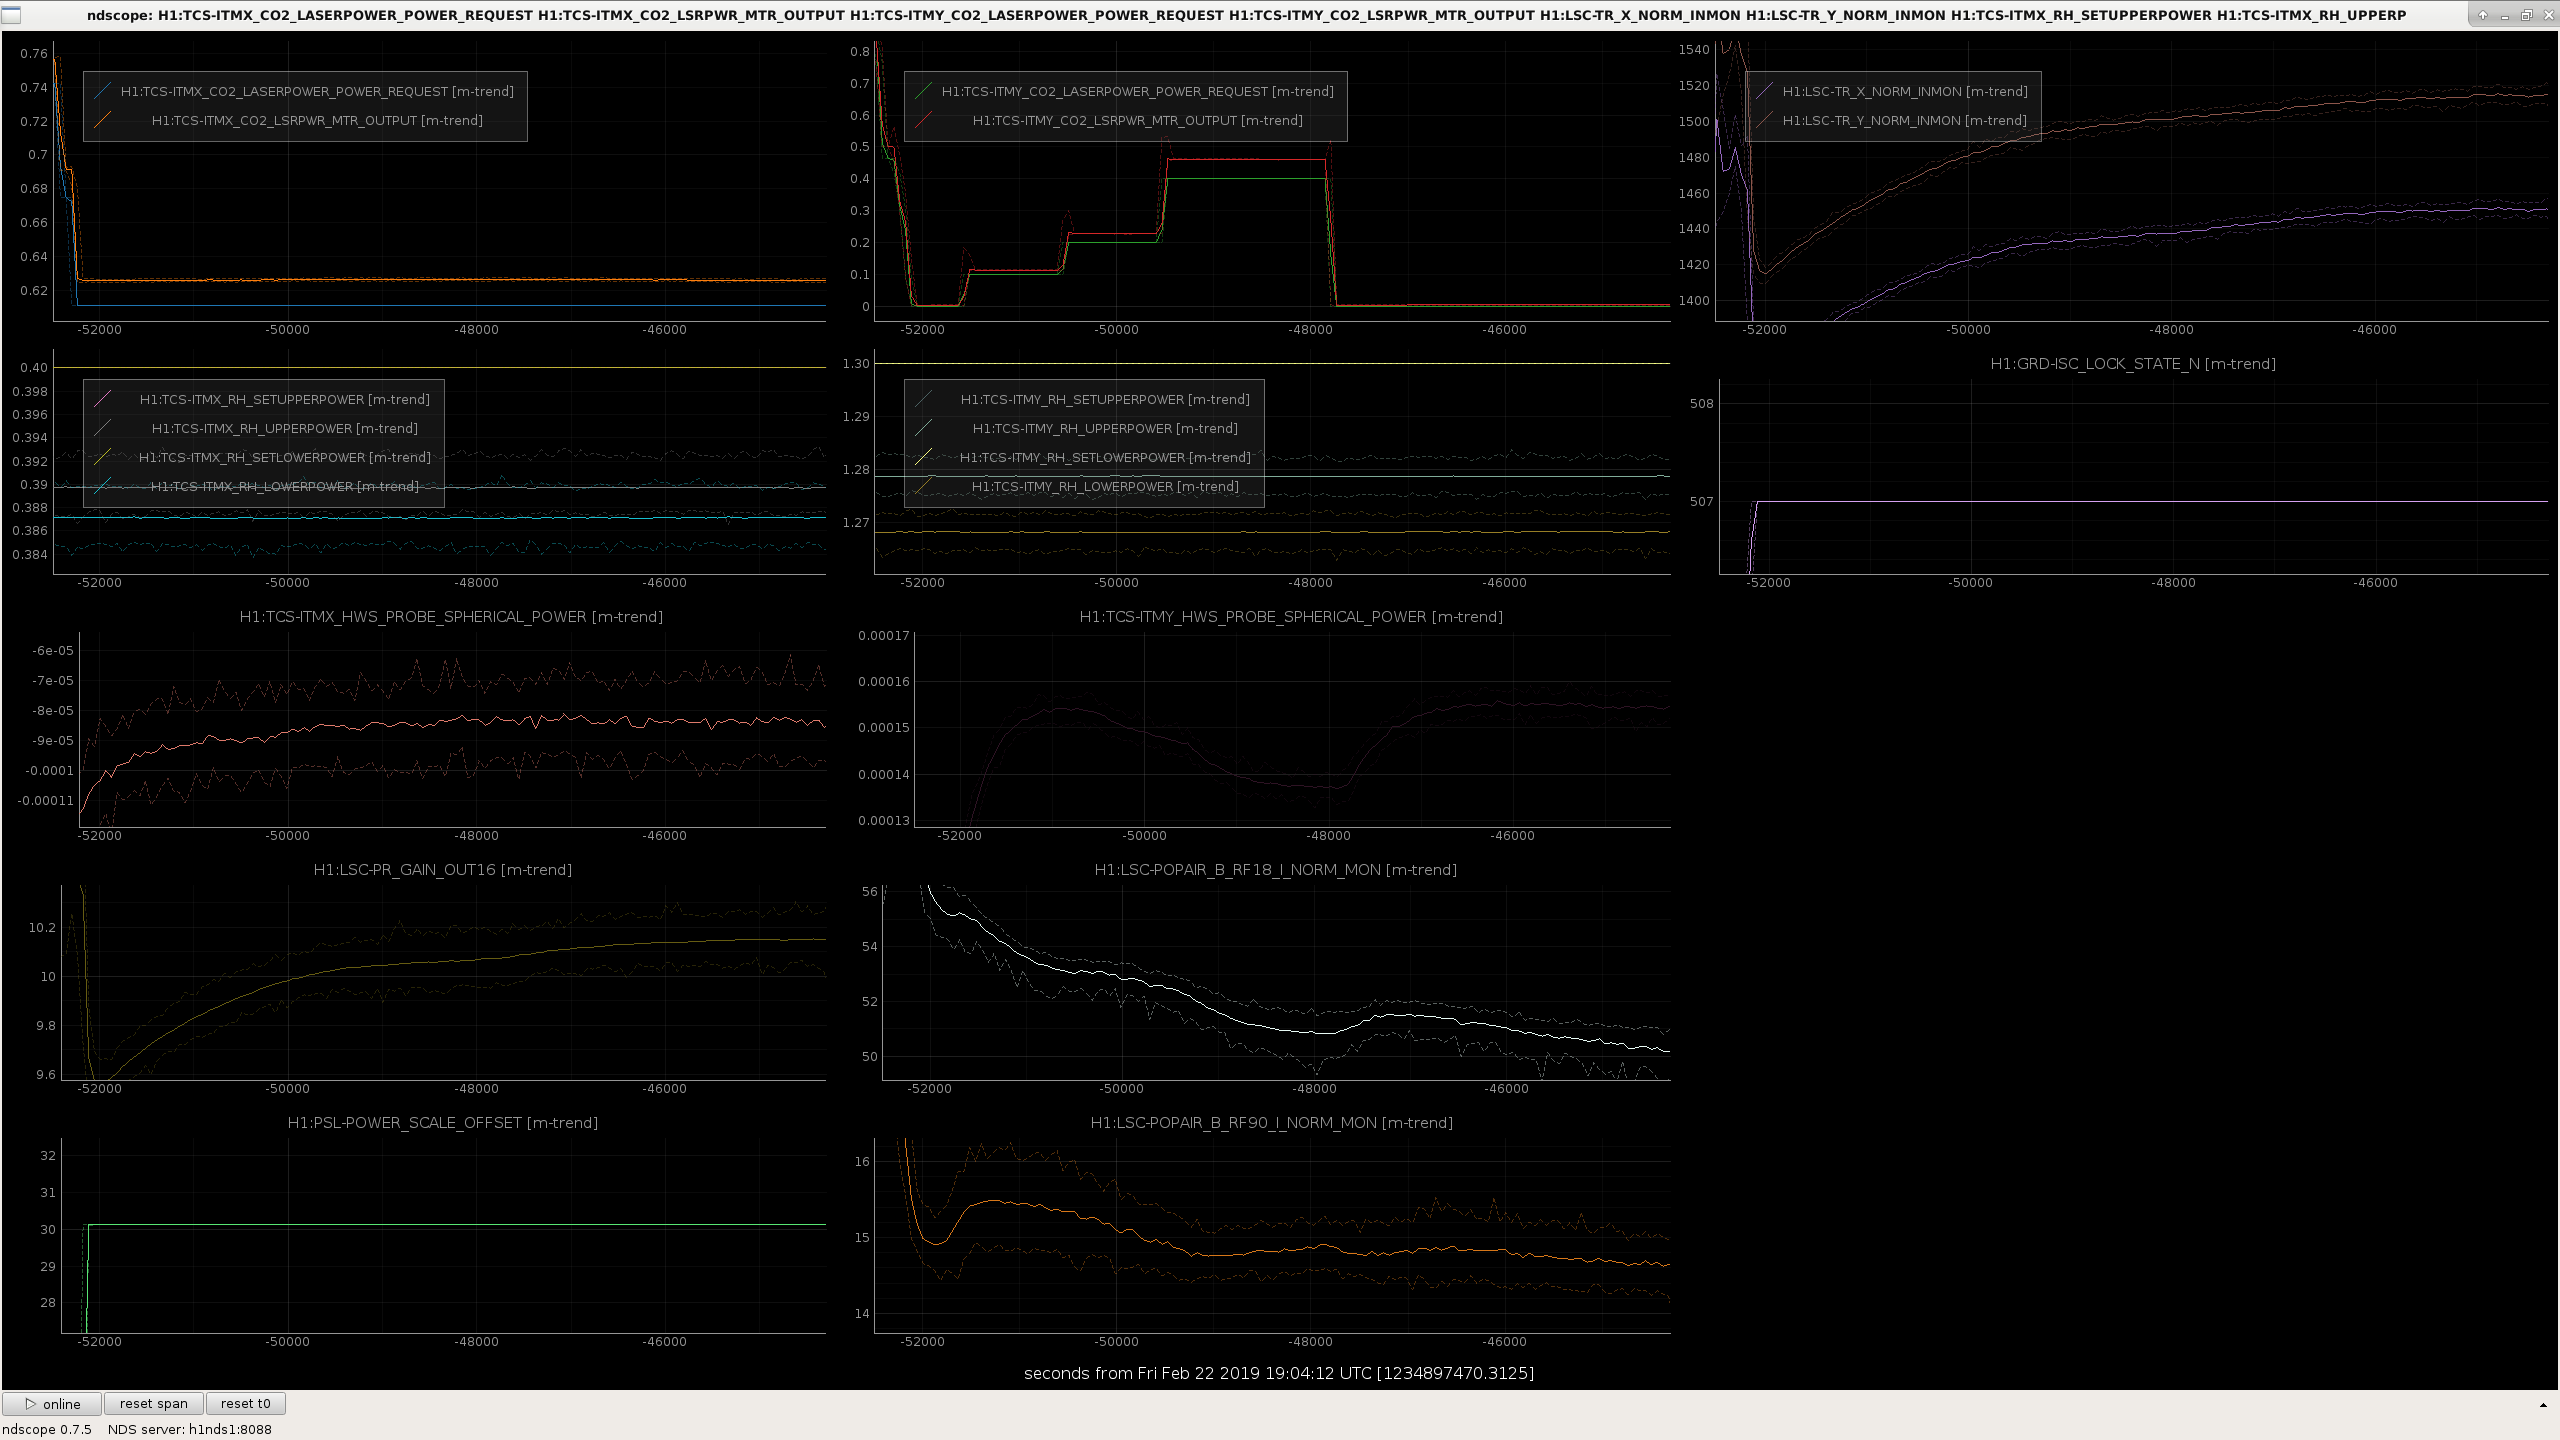
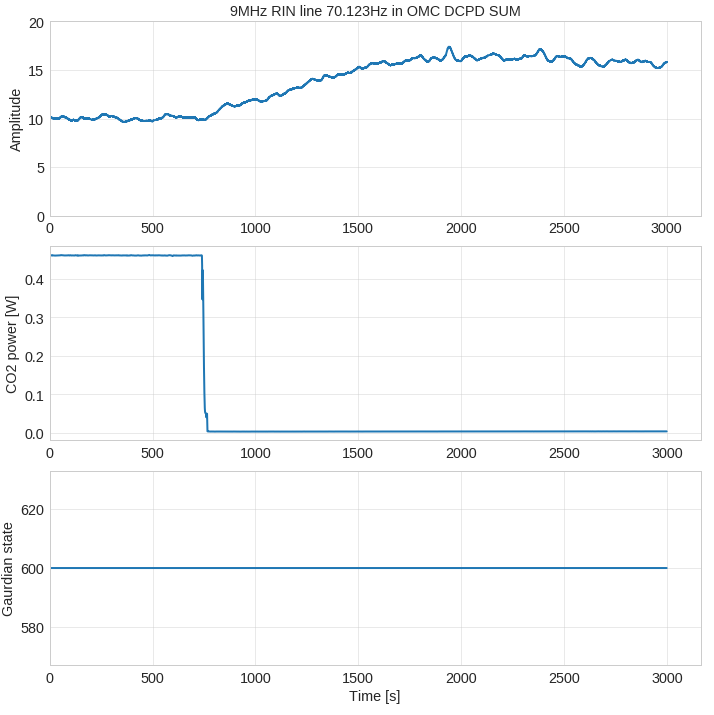
We powered up to the 30W state but didn't go to low noise ASC. We then put the mask in and stepped up in CO2Y power 100mW, 200mw, 400mW in 1000s intervals. We compare this with the 30W lock we had yesterday with the 9MHz RIN line on where we also didn't go to a low noise state. Looking at the RIN coupling we can see an improvement as the mask is introduced, then when we switched it off it goes back to as it was before. I injected a line that was 10x larger than the previous day by accident so the amplitude is rescaled and the line is less noisy. In hindsight we should have left it on a bit longer to see how it affected the steady state after 4000s, however we wanted the thermal state to return to normal for the night shift commissioning. From the data it looks as if the RIN coupling levels off between 3000-4000s. It looks to be at roughly the same level as the steady state case without the mask. Perhaps there is another dominating coupling effect at that stage where the mask no longer helps.

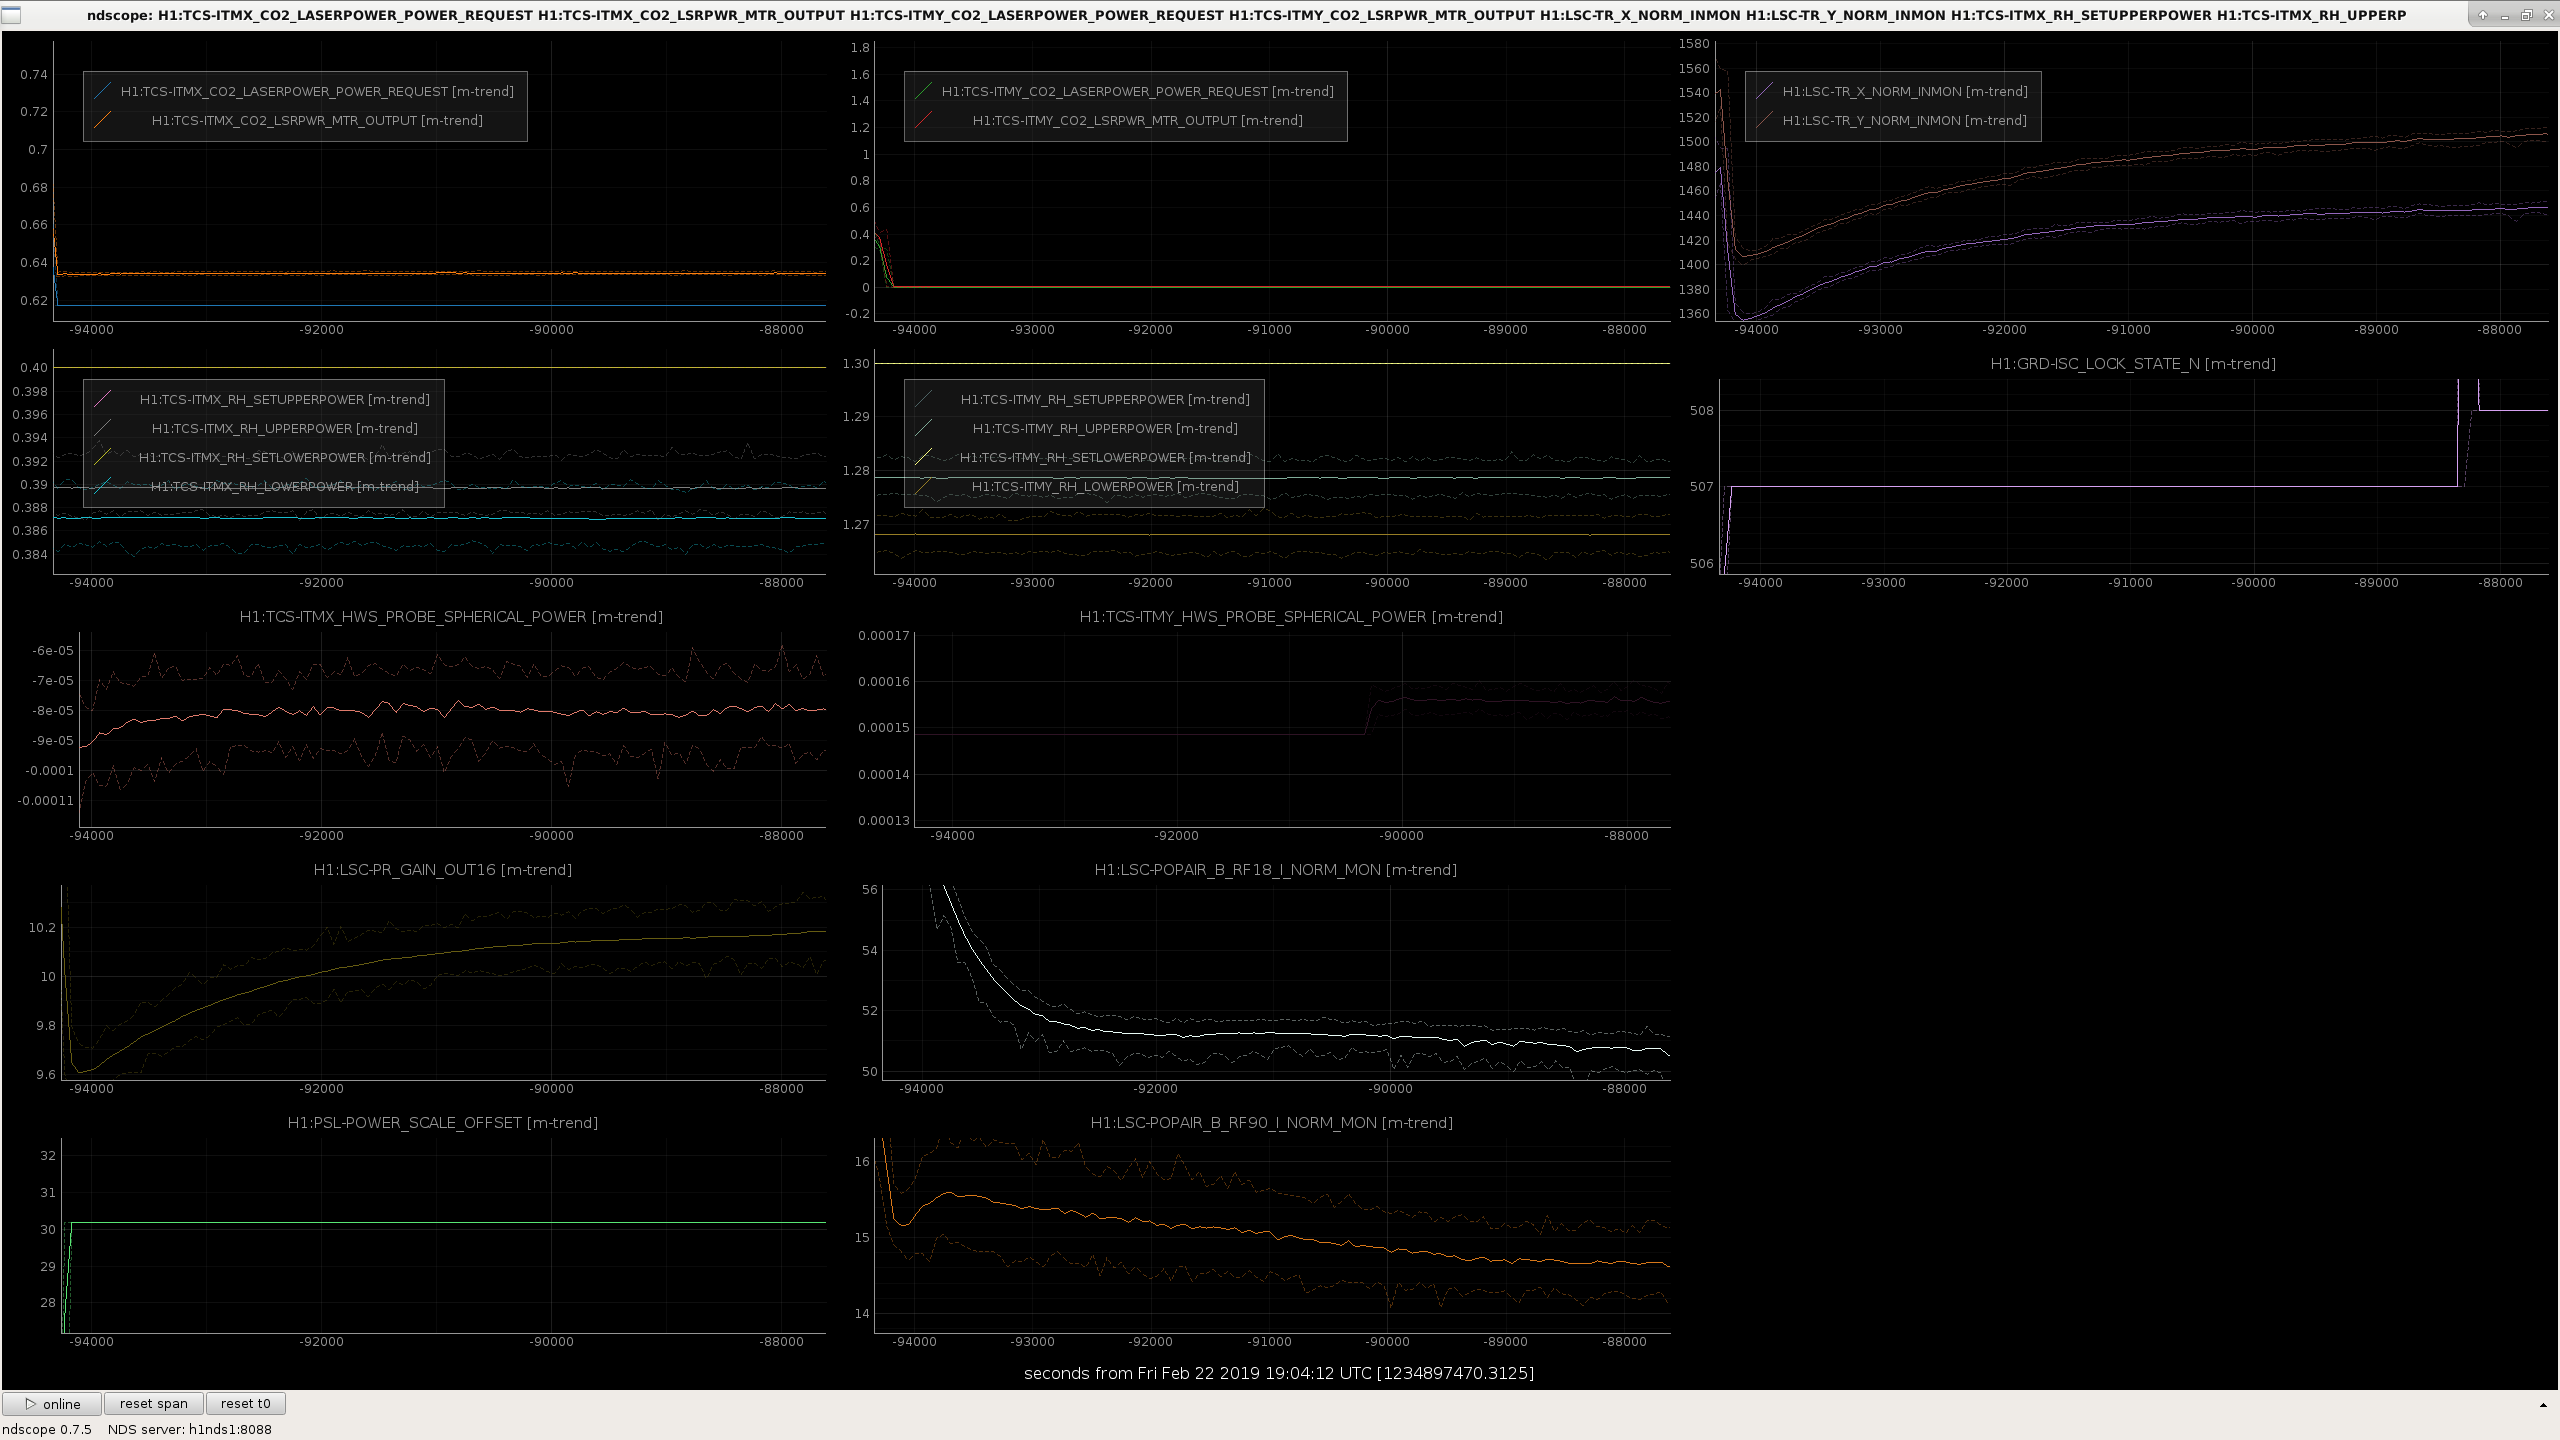
RF90/RF18/PRG/HWS traces with and without the mask.

Comparing with and without the mask we can see:

Things to try next:

Images attached to this report
Comments related to this report
craig.cahillane@LIGO.ORG - 21:11, Friday 22 February 2019 (47094)
Adding a plot of power levels of the two locks with mask and without.

PRG and arm power remain lower with CO2 ITMY mask on, but POP18 is higher.
Non-image files attached to this comment
daniel.brown@LIGO.ORG - 10:01, Monday 25 February 2019 (47118)

The other night we put the mask on once the IFO had thermalized alog 47097. The effect of the mask looked to be leveling off. However when applying the mask at a later date we also saw an improvement in the coupling.

Here is the 9 MHz RIN line amplitude at the start of the lock, when we switched the mask on, and when we switched it off. Overall saw ~30% reduction in coupling.

Images attached to this comment
daniel.brown@LIGO.ORG - 16:43, Tuesday 05 March 2019 (47315)TCS


Attached is a breakdown of the mask test with a thermalised IFO at 30W. We switched on the mask for two hours. Plotted is the OPD changes between several points:

  1. OPD change during power up before any mask is applied
  2. OPD change with the mask switched on
  3. The change in the OPD due to the mask (Difference between 1 and 2)
  4. The steady state OPD of the mask after 2 hours

What's confusing us is that we now see an OPD change that is different to when we applied the mask separately. i.e. case 4 does not look like this.

The magnitude of the optical depth change is completely different too. Case 4 has an OPD change of 40nm, whereas applying the mask out of lock gave us ~140nm. I can't think of why this would be the case, perhaps the mask induces a change in the beam which introduces a different OPD, so some non-linear effect is in play. If so, it will be difficult to predict what mask shape to actually use.

It does however have a crescent like shape similar to aidans model Aidan's model (top right image here), although that may be a coincidence.

Images attached to this comment
aidan.brooks@LIGO.ORG - 09:27, Thursday 07 March 2019 (47362)

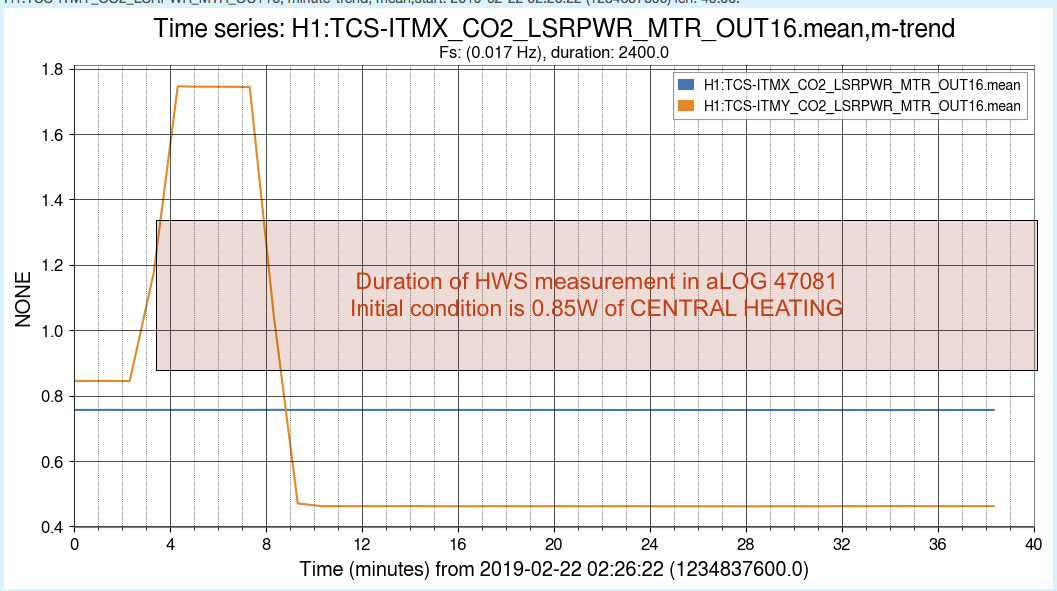
The reference for the "140nm measurement" of the CO2Y mask thermal lens was not taken at a cold state but rather with 0.85W of CENTRAL heating on. This yields a strong positive lens. If this positive lens is taken as a reference (or zero) point and then central heating is turned off, we will see a strong negative lens in the measurement.

Probably best to repeat the calibration of the CO2Y mask from a genuine cold state.

So the "140nm OPD measurement" is looking at the difference between a reference state of "0.85W central + 0.0W custom mask" and "0W central + 0.45W custom mask".


Images attached to this comment
alexei.ciobanu@LIGO.ORG - 18:17, Friday 08 March 2019 (47411)TCS

Alexei, Dan

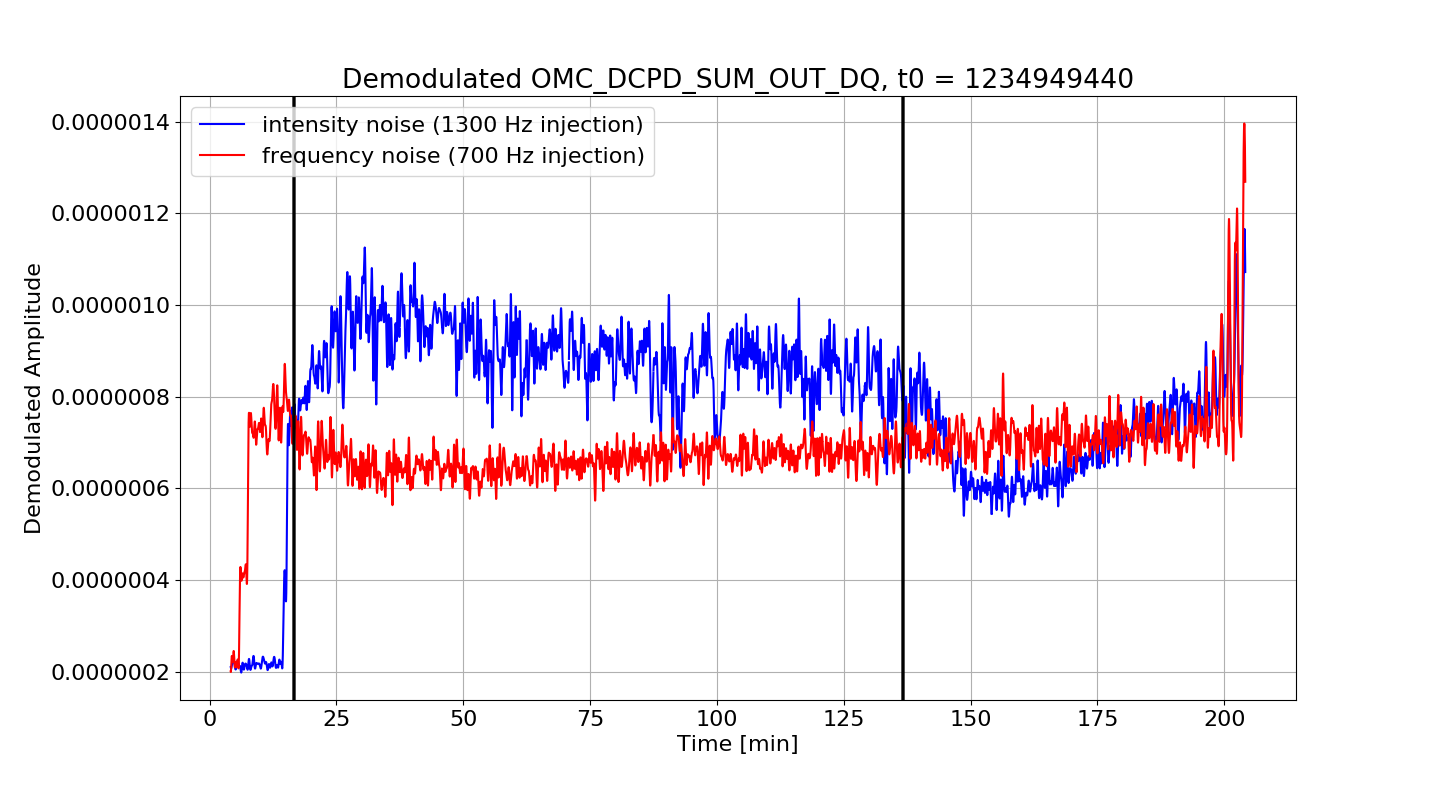
Pulled the data from OMC_DCPD_SUM_OUT_DQ corresponding to the injections of frequency and intensity noise lines as outlined in alog 47097.


The first black line is when the CO2 was switched on the second black line is when it got switched off. Looks like the mask increases intensity noise coupling but doesn't do much of anything to the frequency noise.

The ringing towards the end is likely some instability as there is a lock loss about 10 minutes after the data ends.

https://alog.ligo-wa.caltech.edu/aLOG/uploads/47411_20190308181222_alog_47081_demod.png

Images attached to this comment
Displaying reports 42701-42720 of 88665.Go to page Start 2132 2133 2134 2135 2136 2137 2138 2139 2140 End