Gerardo M., Chandra R., Kyle R.
Today we removed the two paper clip jumpers that had been added to the terminal strip withing the vacuum rack back during the CP4 bake. Filberto C. and Gerardo M. had added these in order to mimic the GV11 CLOSED and GV12 CLOSED signals required by CDS in order for us to utilize the CP4 regeneration PI loop. The nominal wiring for both of these gate valves had been removed so that they could be baked along with CP4. As such, these two signals had to be simulated via these jumpers. Ultimately, this ended up being a mute exercise as we eventually abandoned this approach altogether, opting instead to go "old school" and using a manually controlled variac instead. Today we also had to re-install the fuses associated with these two signals. Following this, Gerardo noticed a discrepancy between the Y-mid Station-specific MEDM screen vs. the overall Site Overview MEDM screen. One screen showed the correct valve status following today's signal restoration but other screen did not. He and Patrick T. sorted this out later somehow.
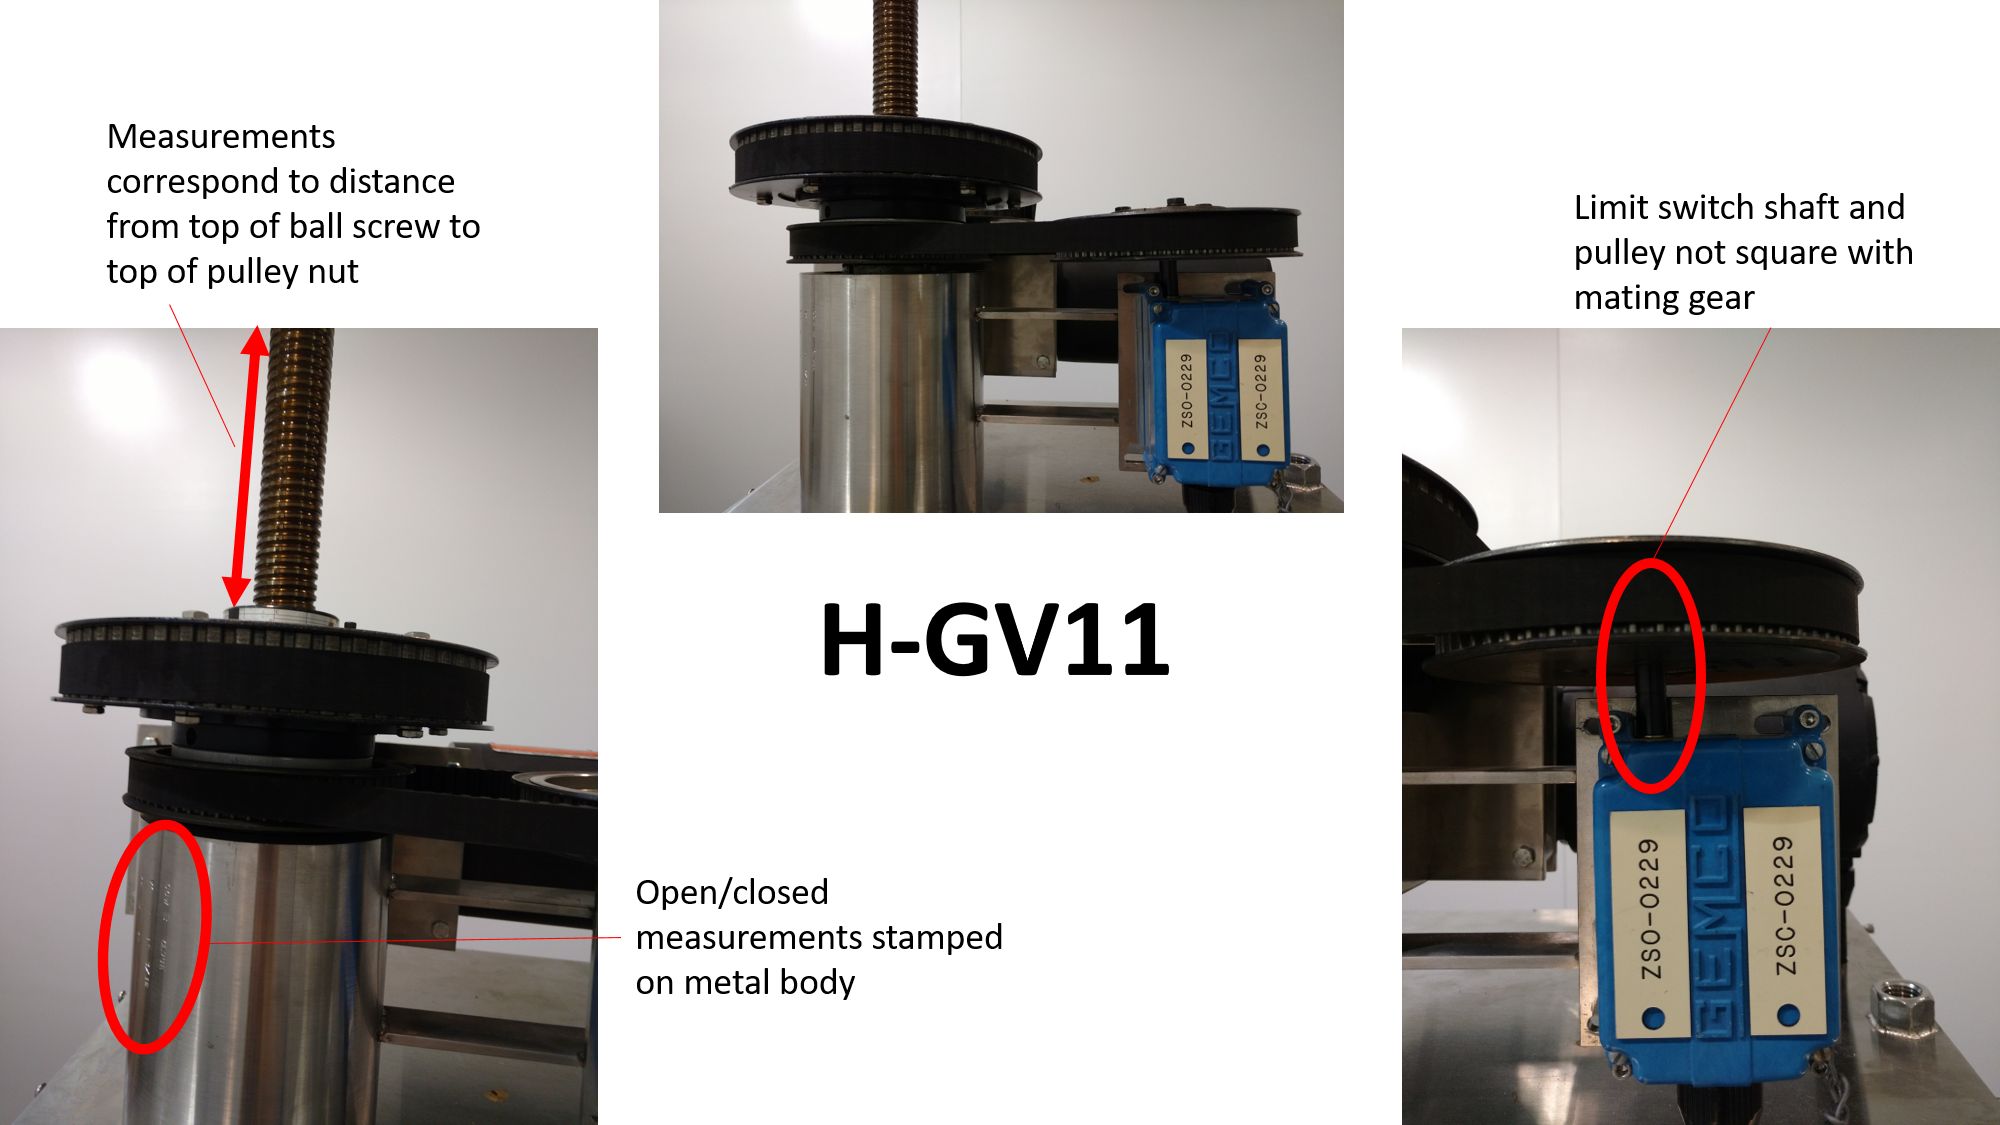
Chandra R. and I had both heard a noise last Friday when attempting to fully open GV11. The sound seemed to have emanated from the limit switch area so we opted to not fully open the valve at that time until we could fully investigate (today). The motor drive is entirely dependent upon proper setup of the limit switches and we wanted to confirm that nothing had been changed during the removal of the signal wiring. So, this morning, Chandra R. contacted Ken D. (electrician) to confirm that he had only removed the wiring from the GV11 and GV12's limit switches when preparing for the CP4 bake out and had not changed any of the mechanical setup. Ken D. confirmed that only the wiring had been removed and that the mechanical setup of the switches had been left alone. Even so, I removed the limit switch box cover plate and observed the internal workings as GV11 was stroked up and down (a few inches in each direction). I tested the OPEN and CLOSED limit switches by manually changing their states and observing that the CDS MEDM screens responded accordingly. Additionally, I confirmed that the motor drive stopped driving the valve in response to my manually closing the OPEN limit switch. Convinced that everything was normal, we fully opened GV11.
Next, we re-installed all of GV12's annulus piping (new modified version) minus the gate portion. We will finish this up tomorrow and, assuming no issues, start the hours long process of opening GV12.