Thanks for the time to the Squeezer crew! And to CoreyG for coming back for more everyday.
Pulled the feedthru again and just sitting in the area seemed to change the readout. I could do some minor manipulation of the cable and send it to the rail and put some pressure and a particular bend to get it to read reasonable values. Wasn't going to mess with fixing and end up worrying how long it would last--just pulled it and replaced it. New sensor worked fine and repeatably.
With three working vertical sensors, we got a new locked position, unlocked and quickly balanced the table. Relocked and only saw a slight shift. Did a payload consolidation and refloated. ISI damped and once things were really settled down, Isolated the platform. Left the ISI locked on stops so SQZ crew could climb around as needed.
CAVEATS:
Unable to milk the new cable through the copper braided shield, will need to disconnect from feed-thru to do that, once I find/get a milking fid. Need smaller kinder peek zip ties--the big ones we have are just too hard on the small CPS cable which could be contributing to shorting.
I still need to as-build the payload--it is different than last Thursday now.
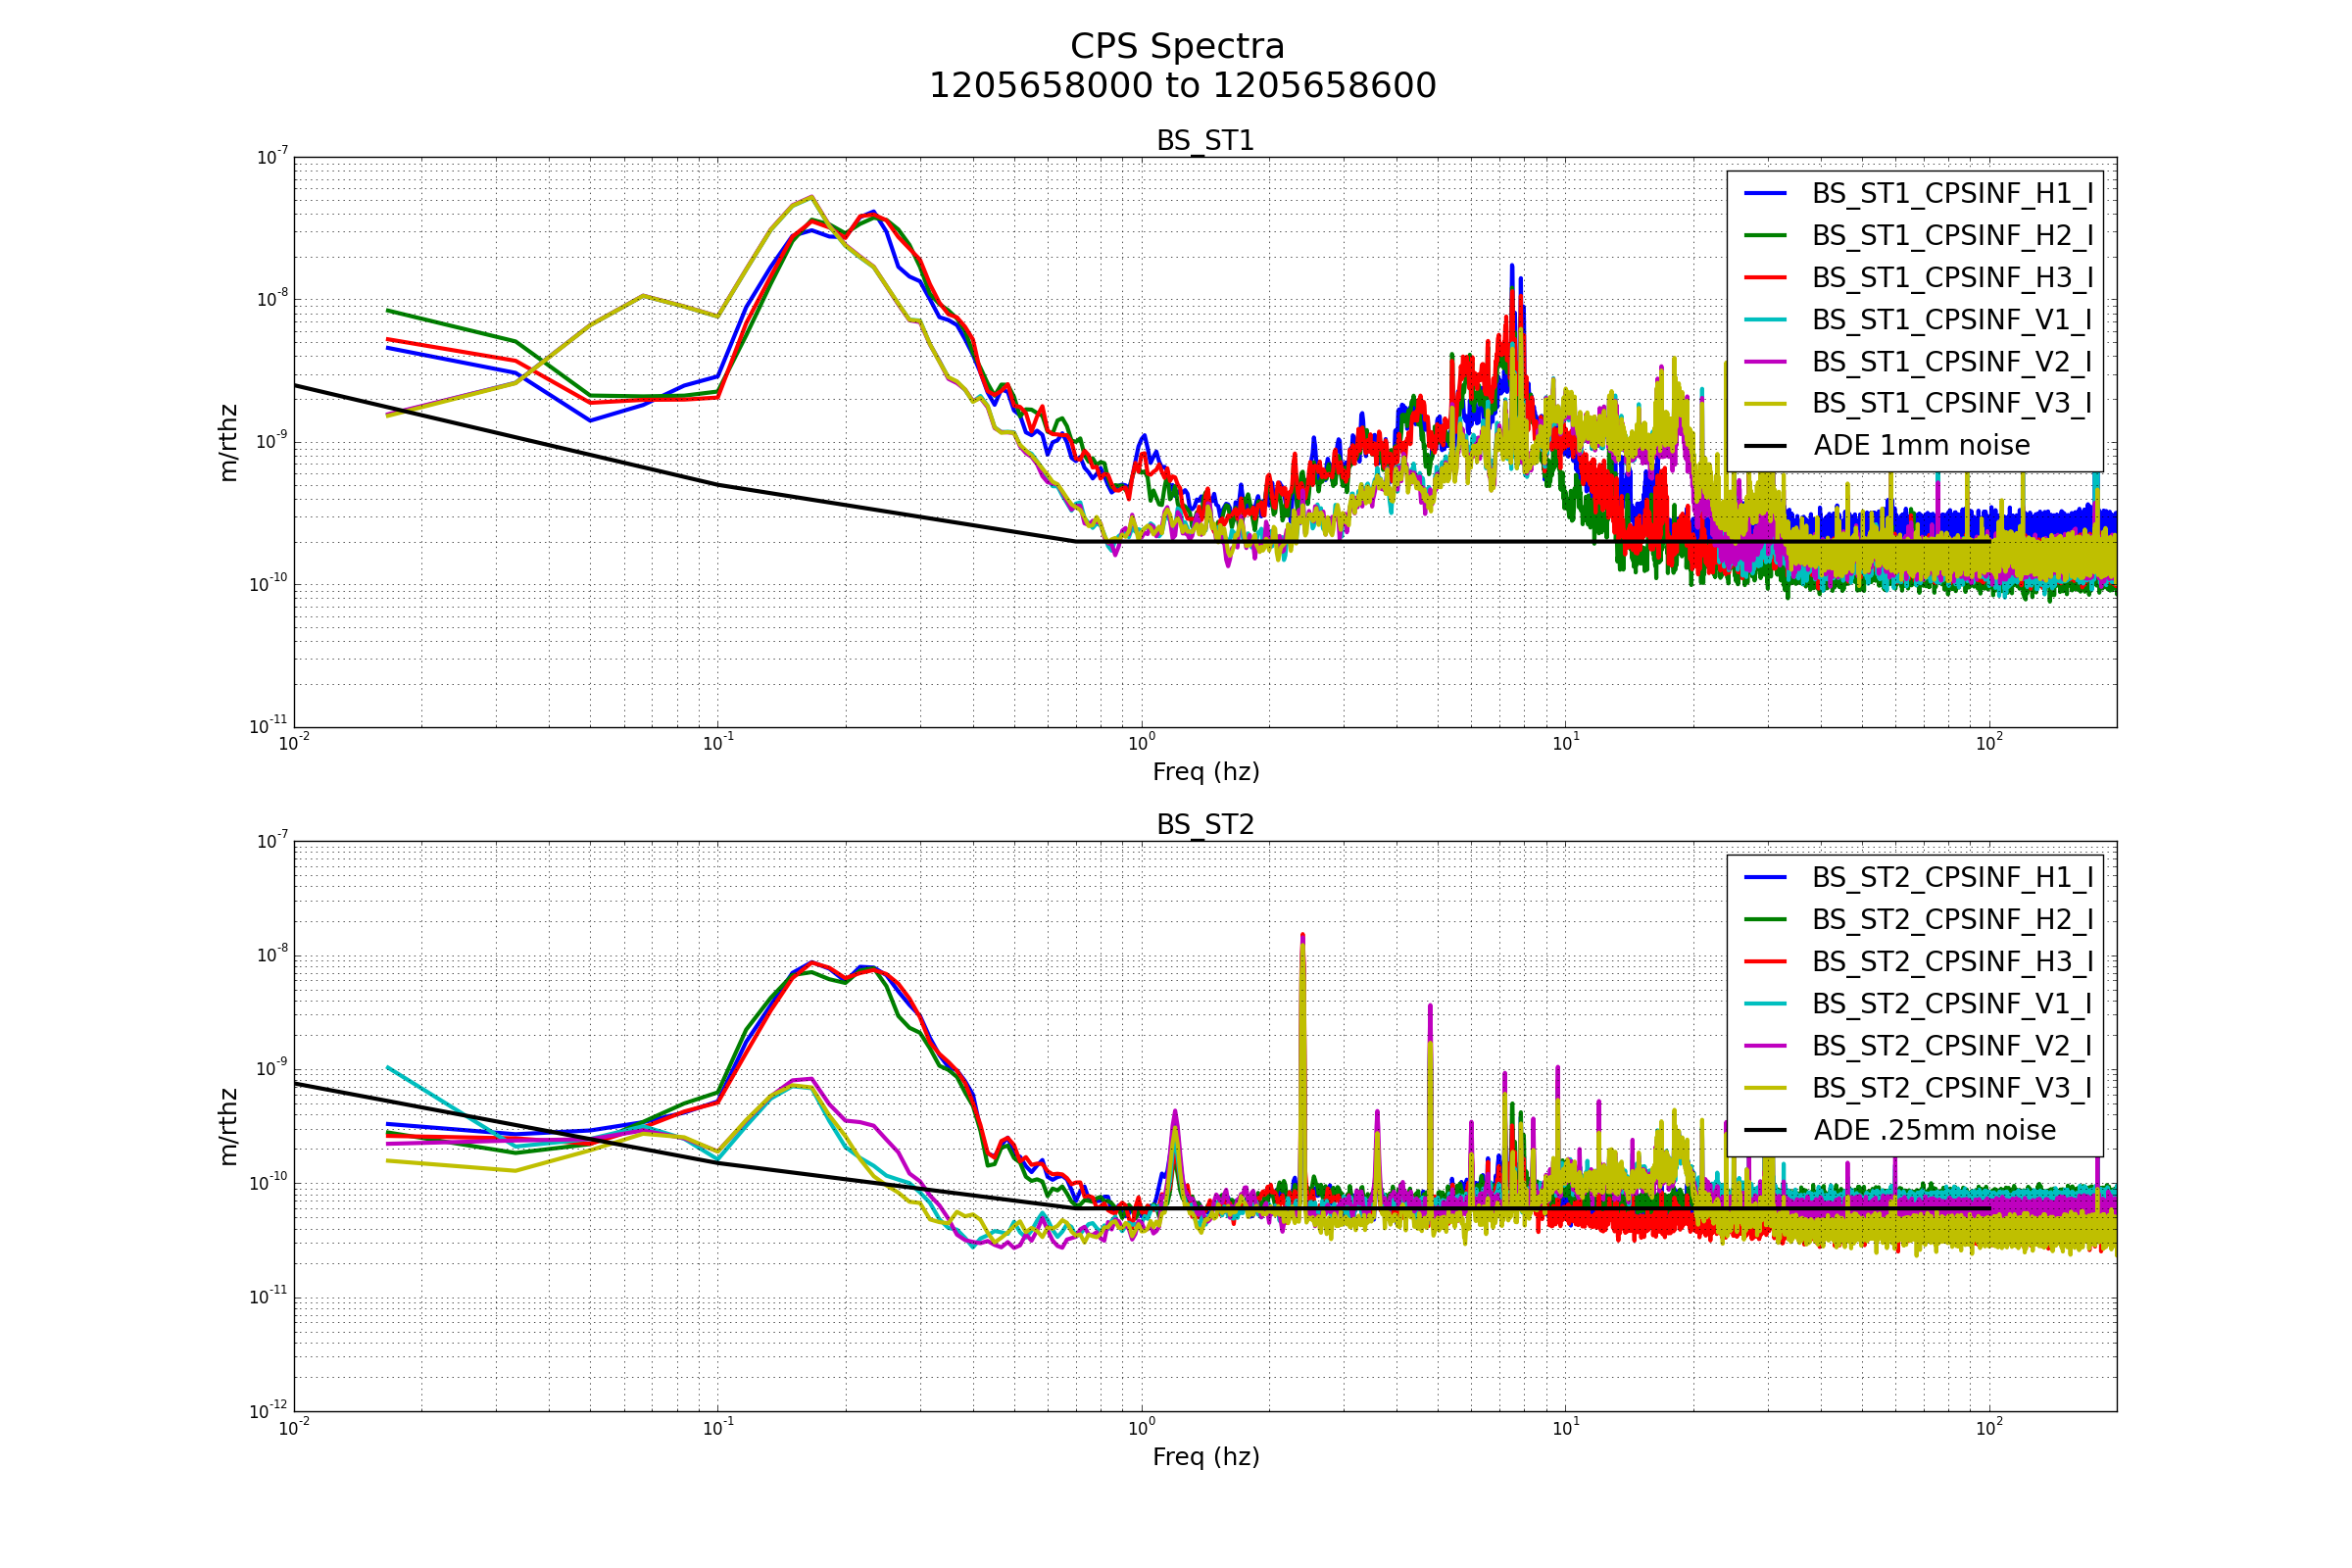
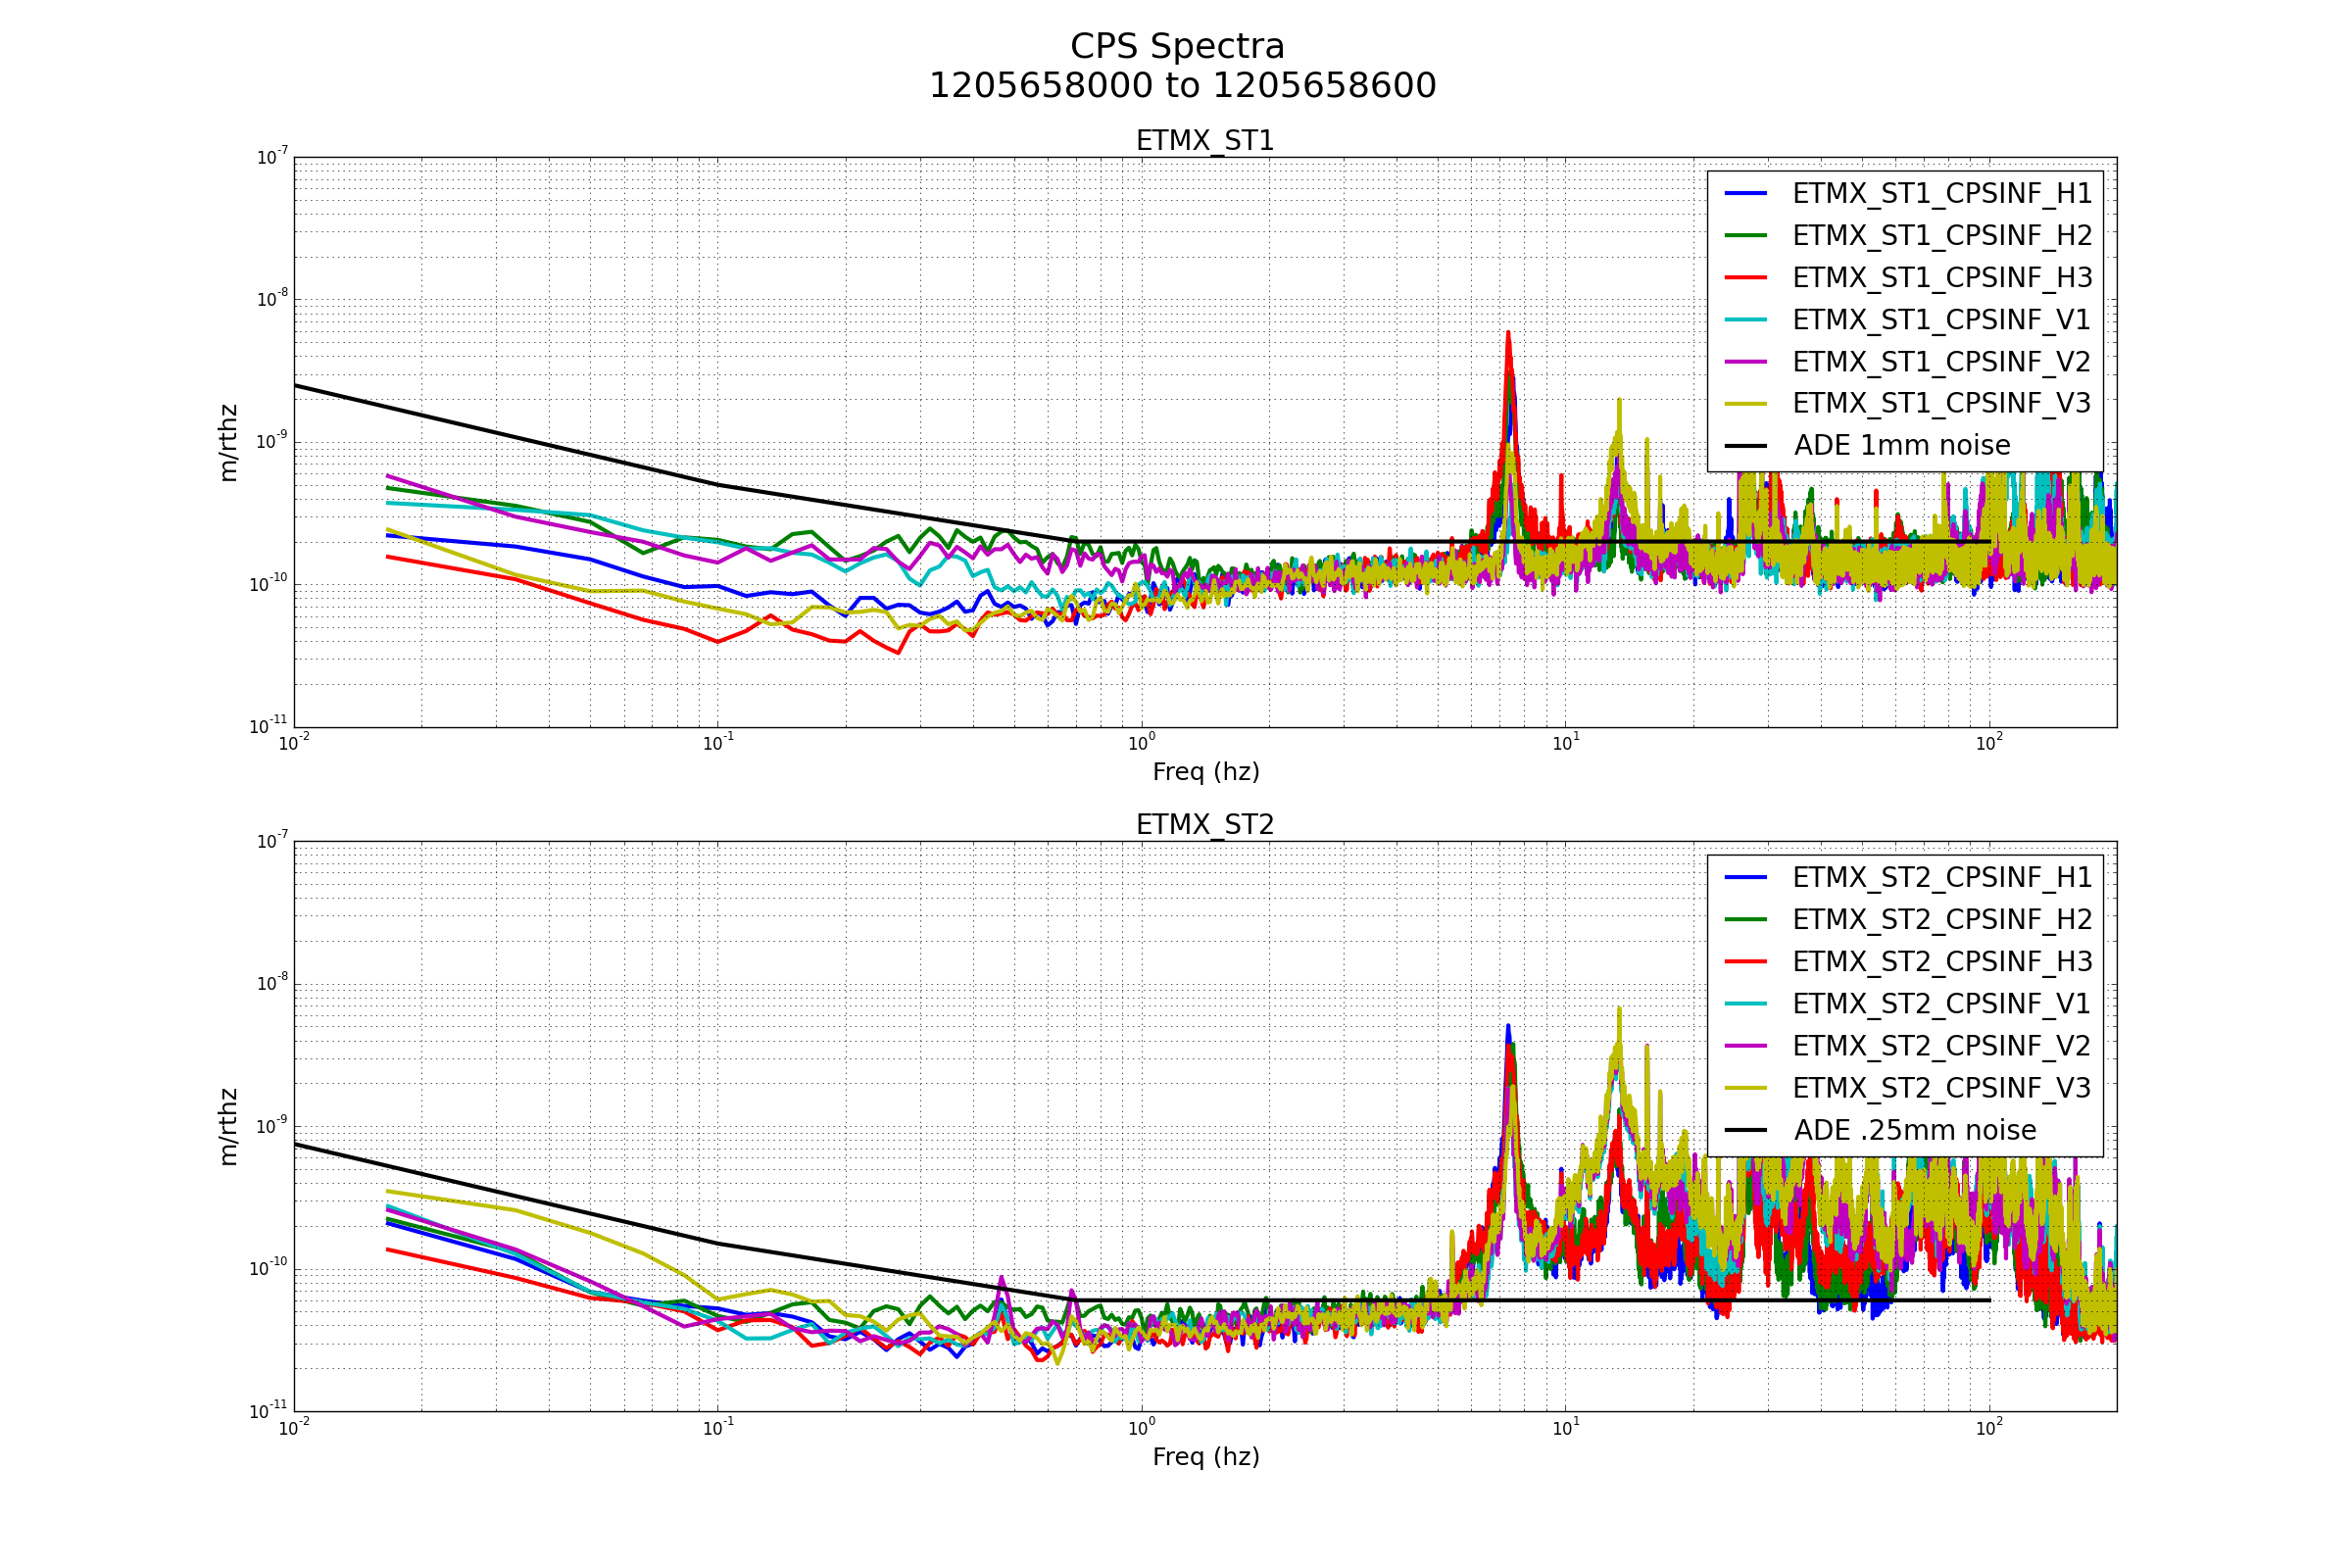
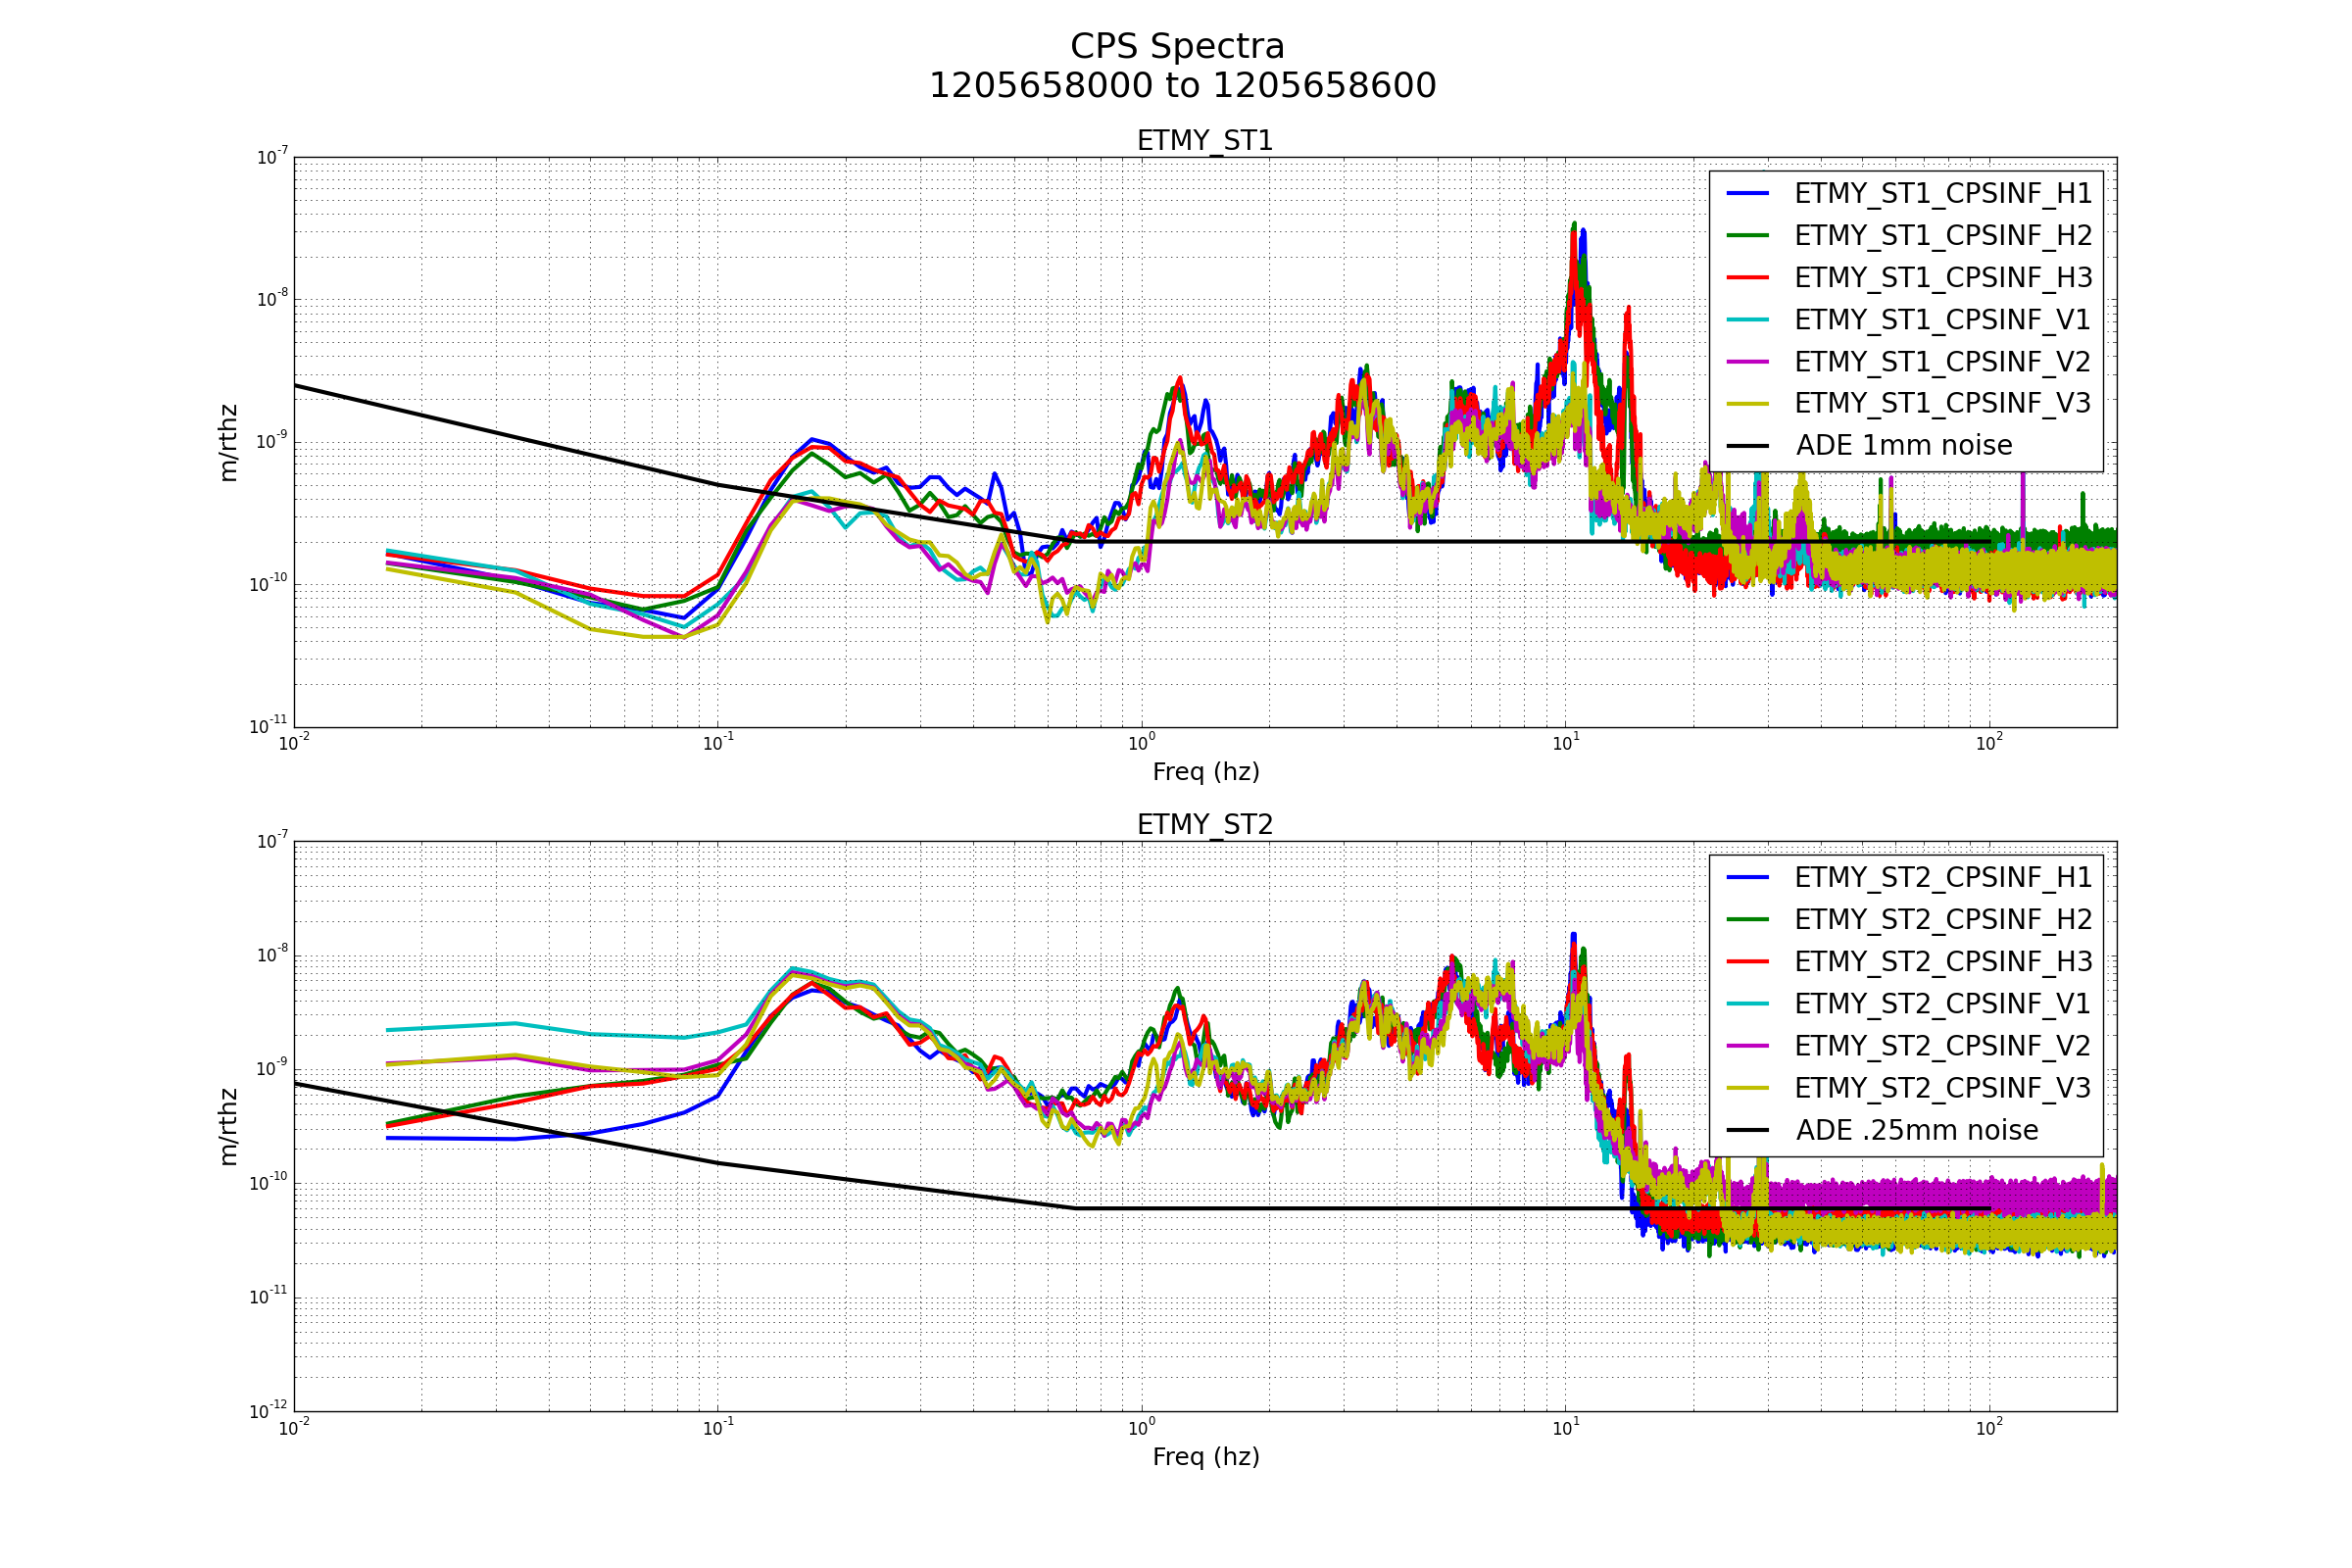
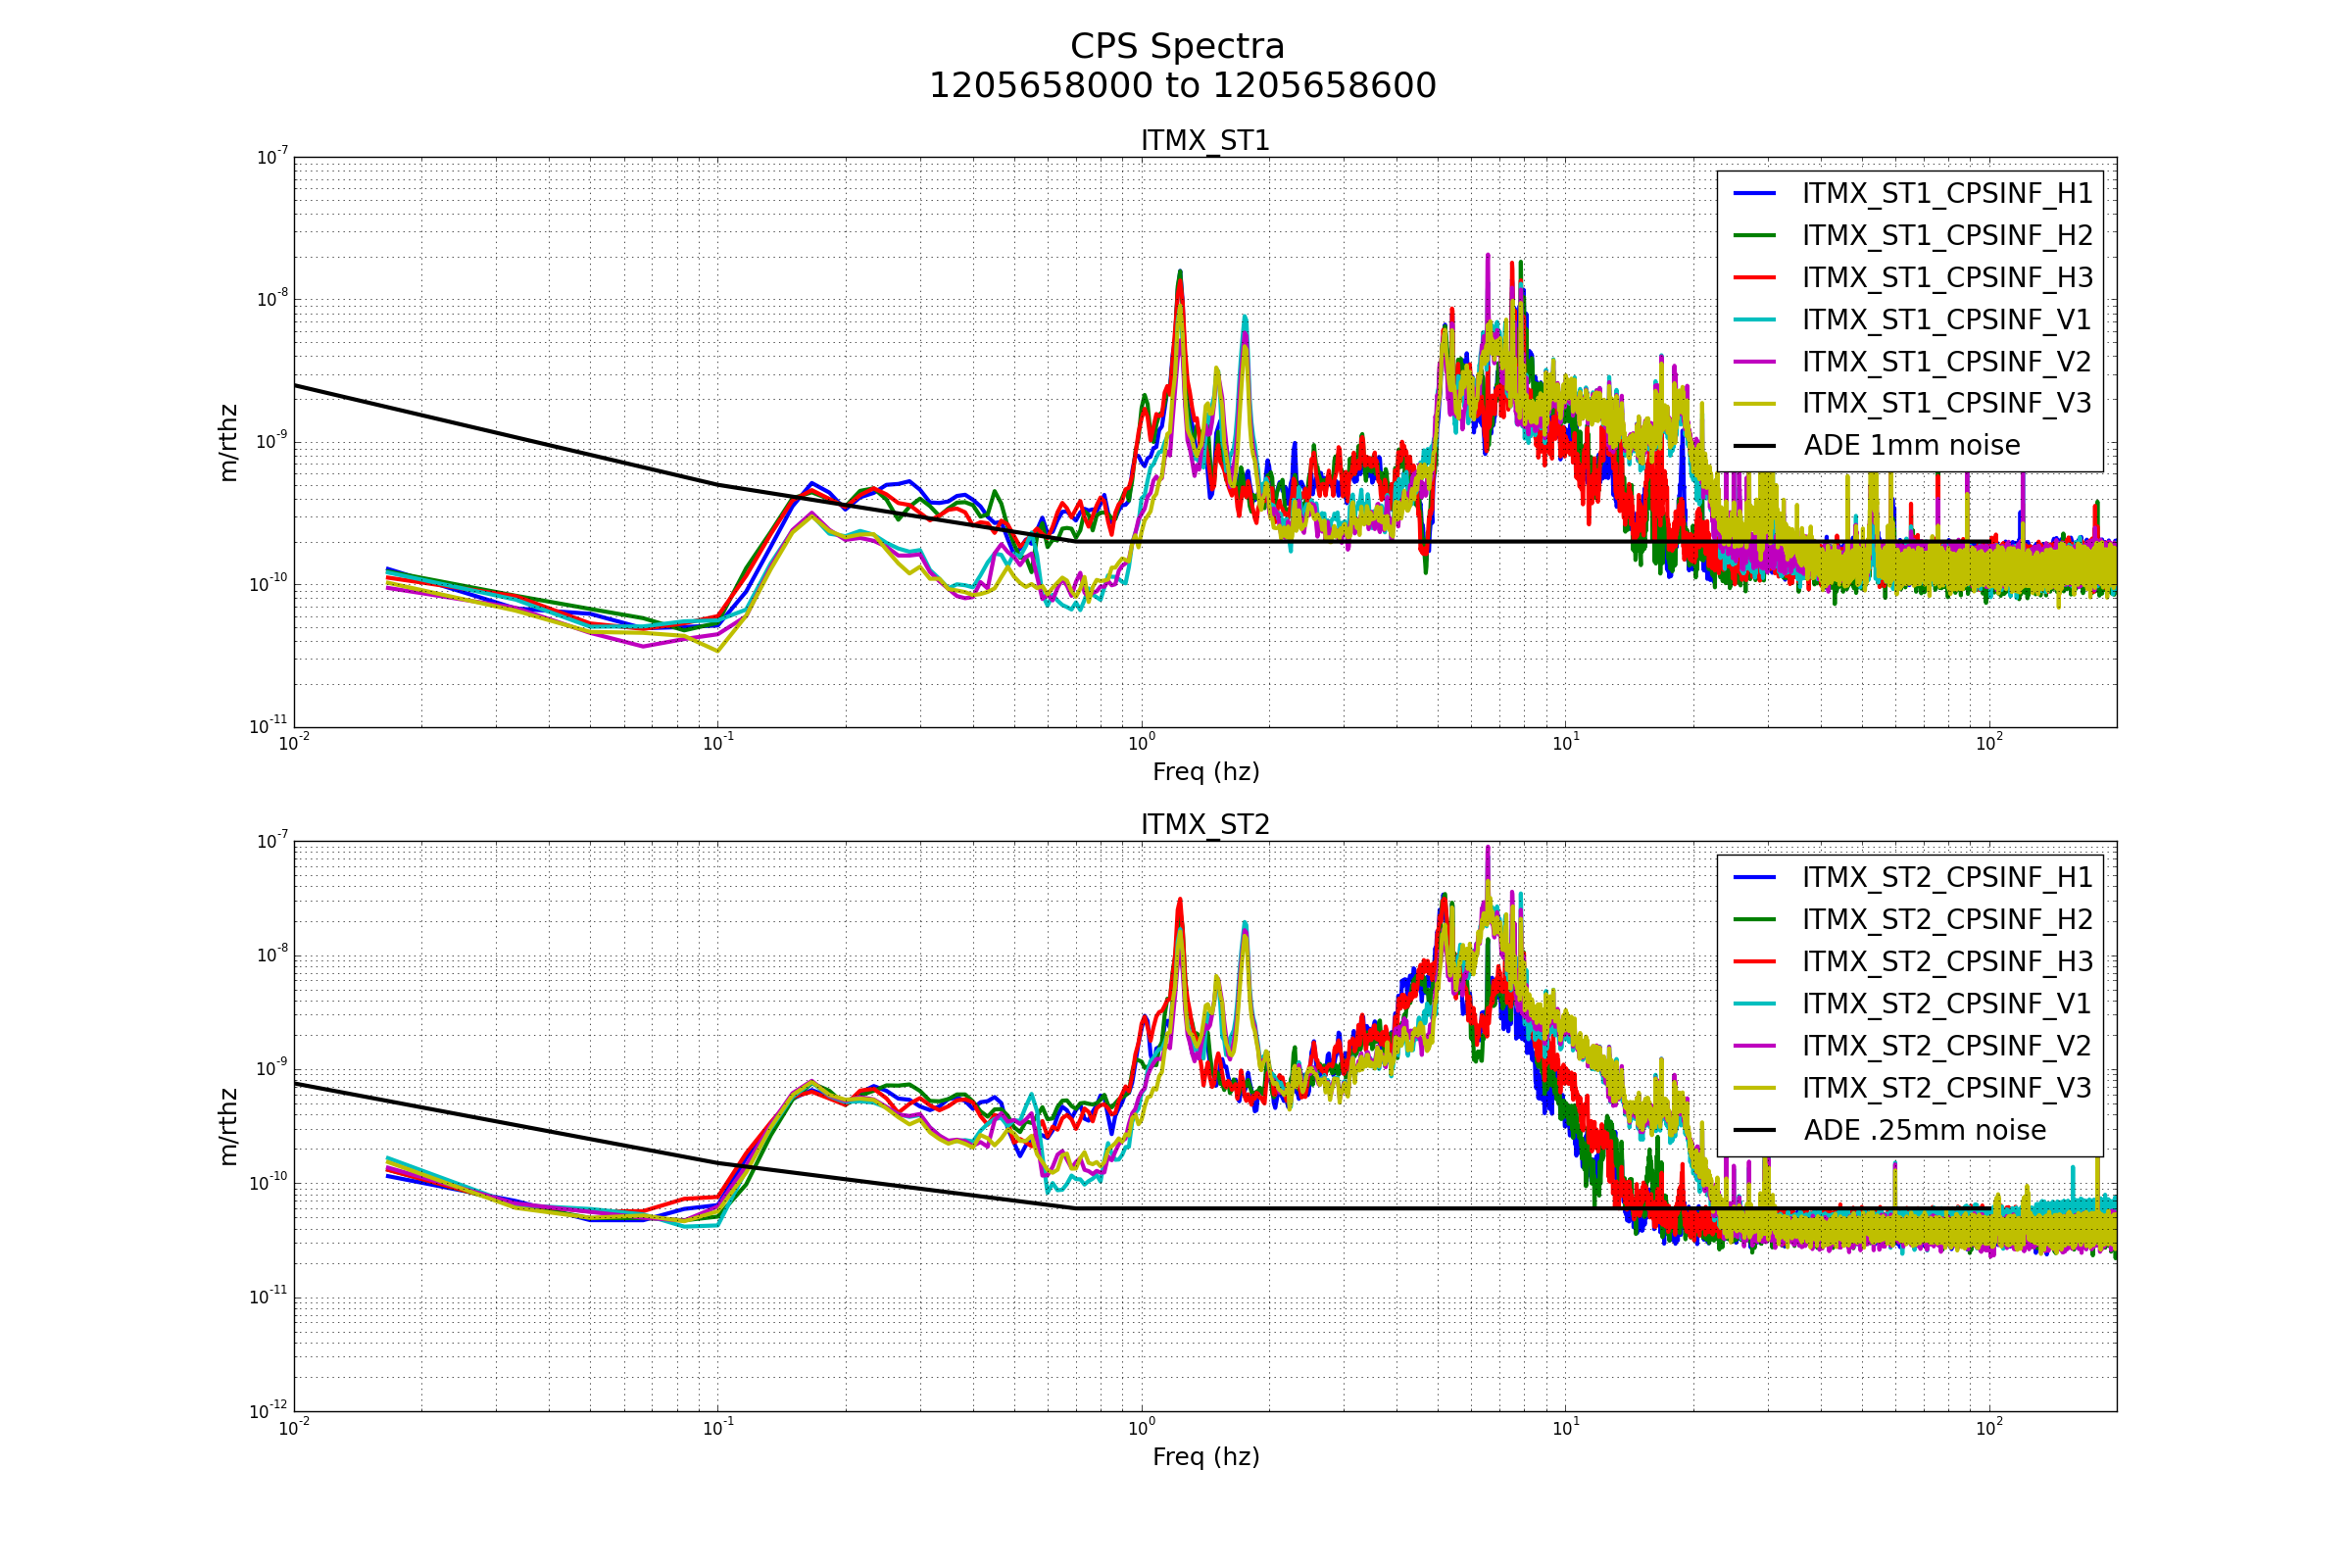
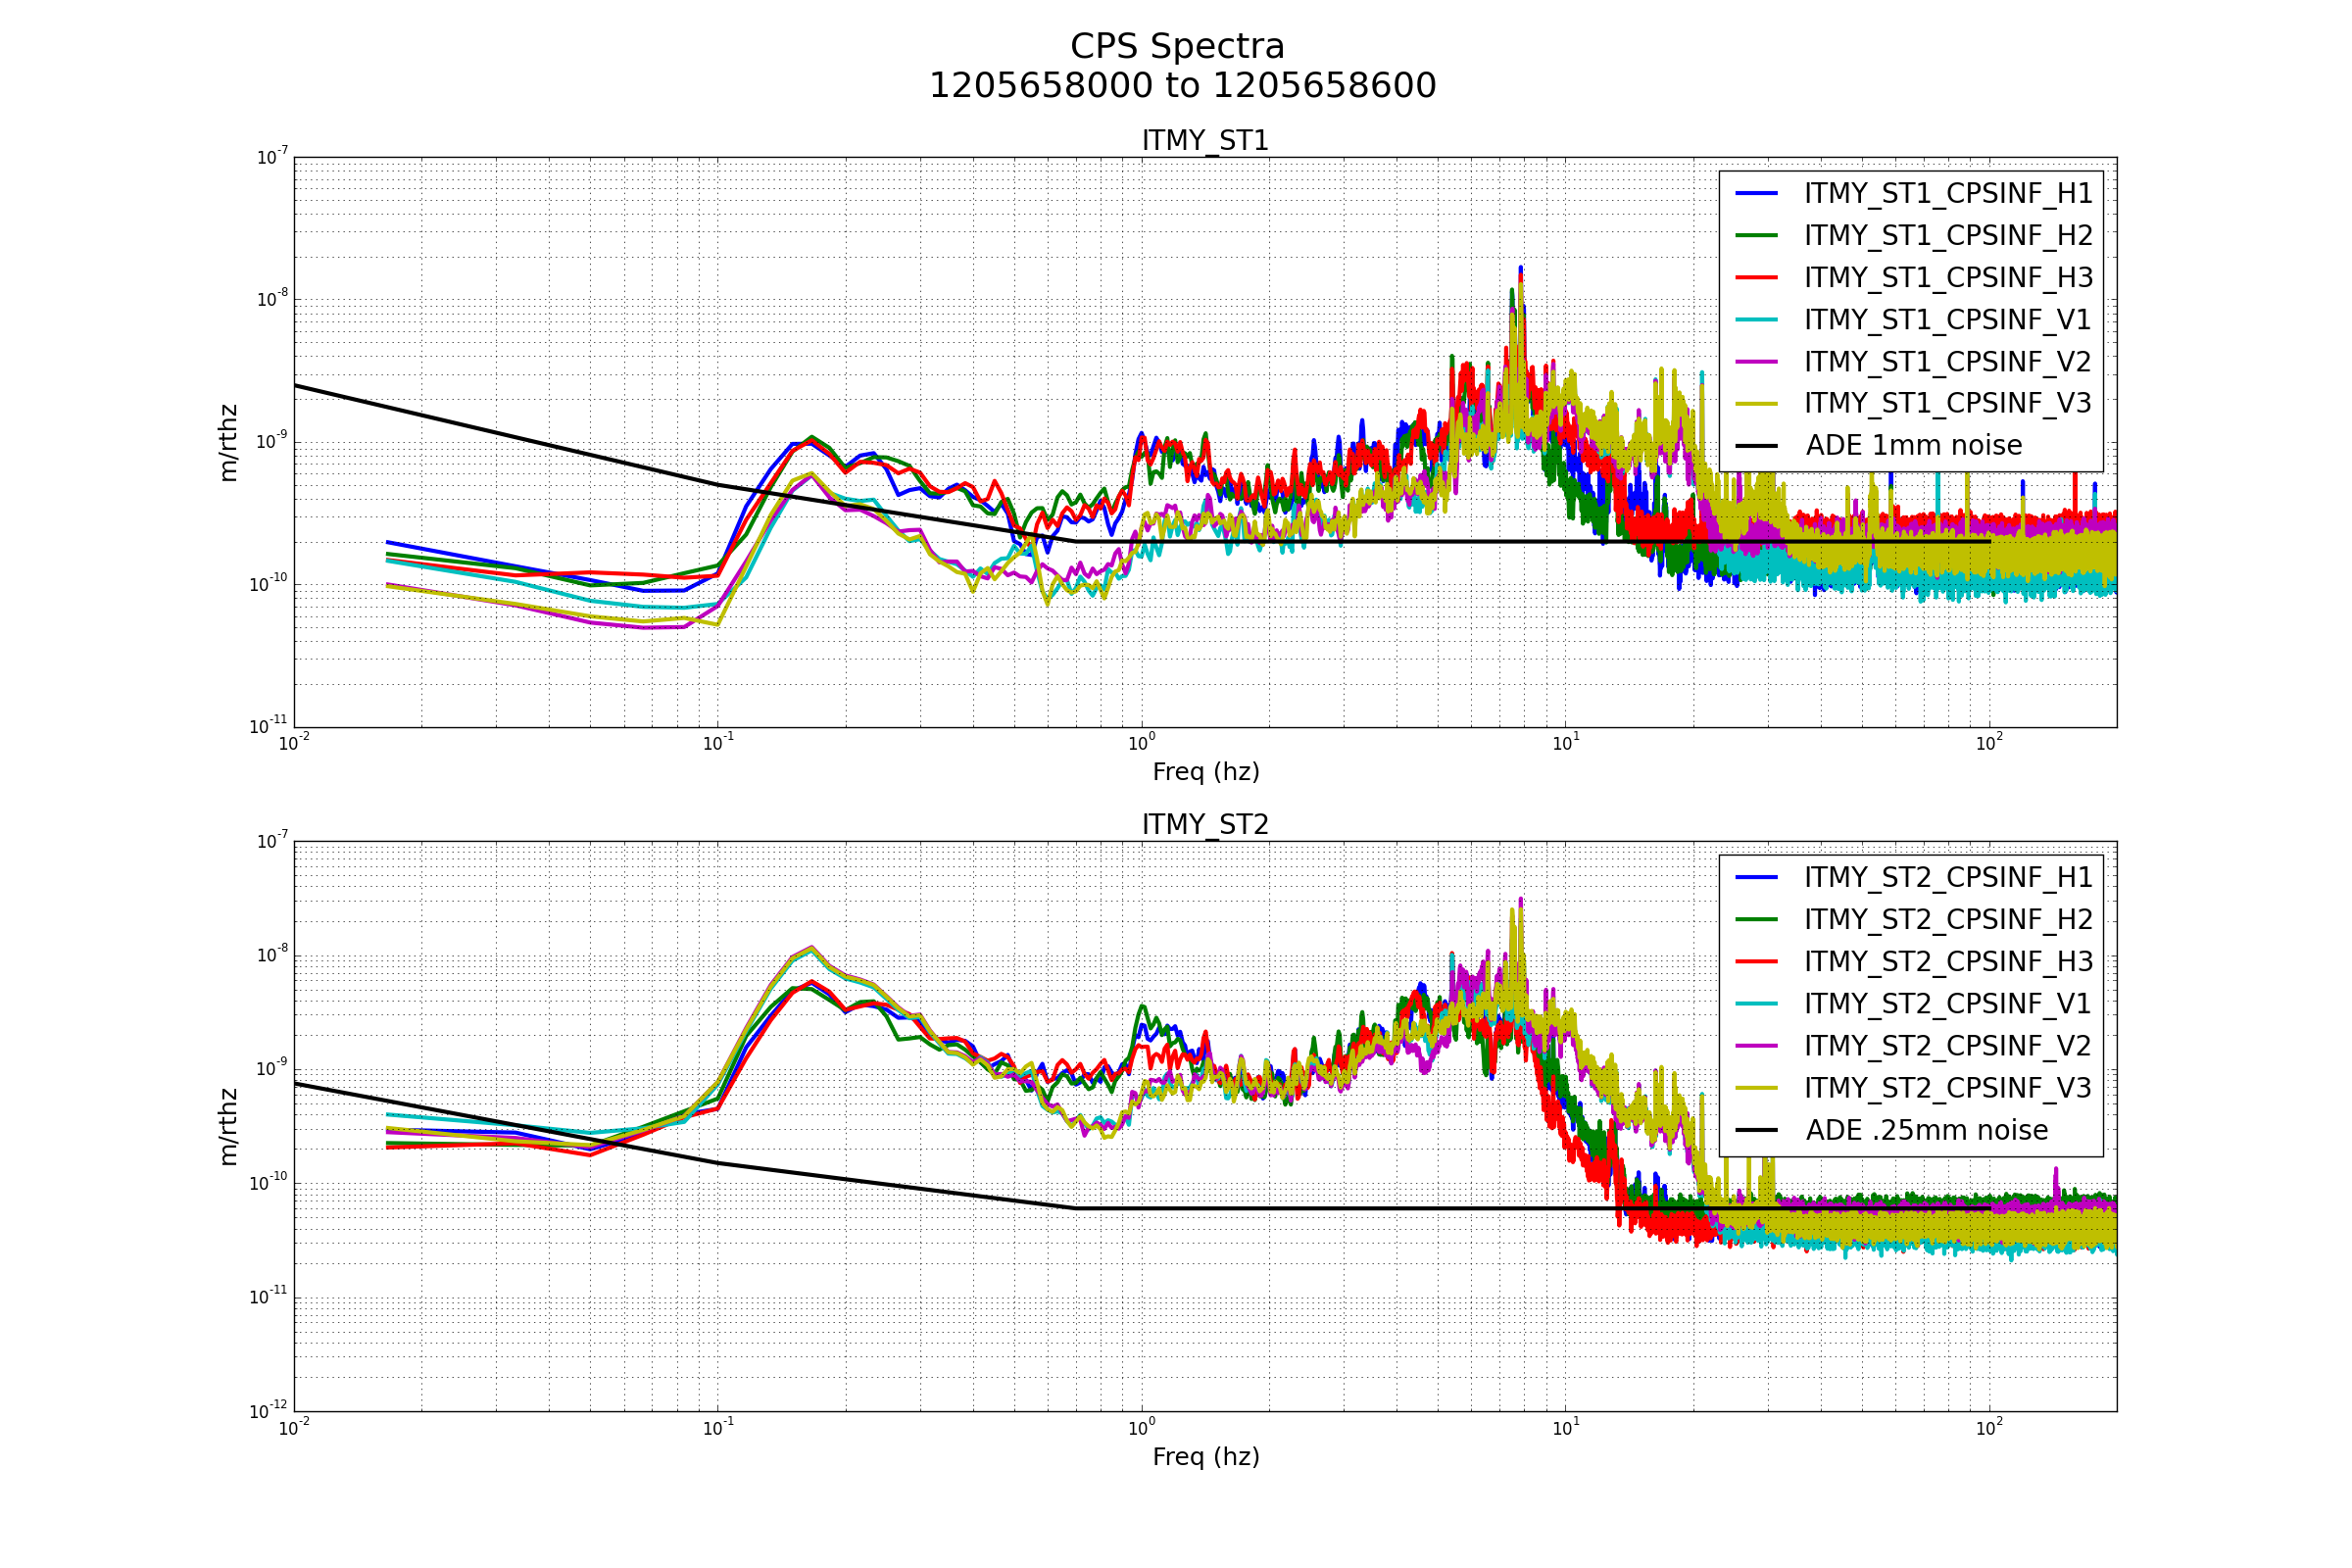
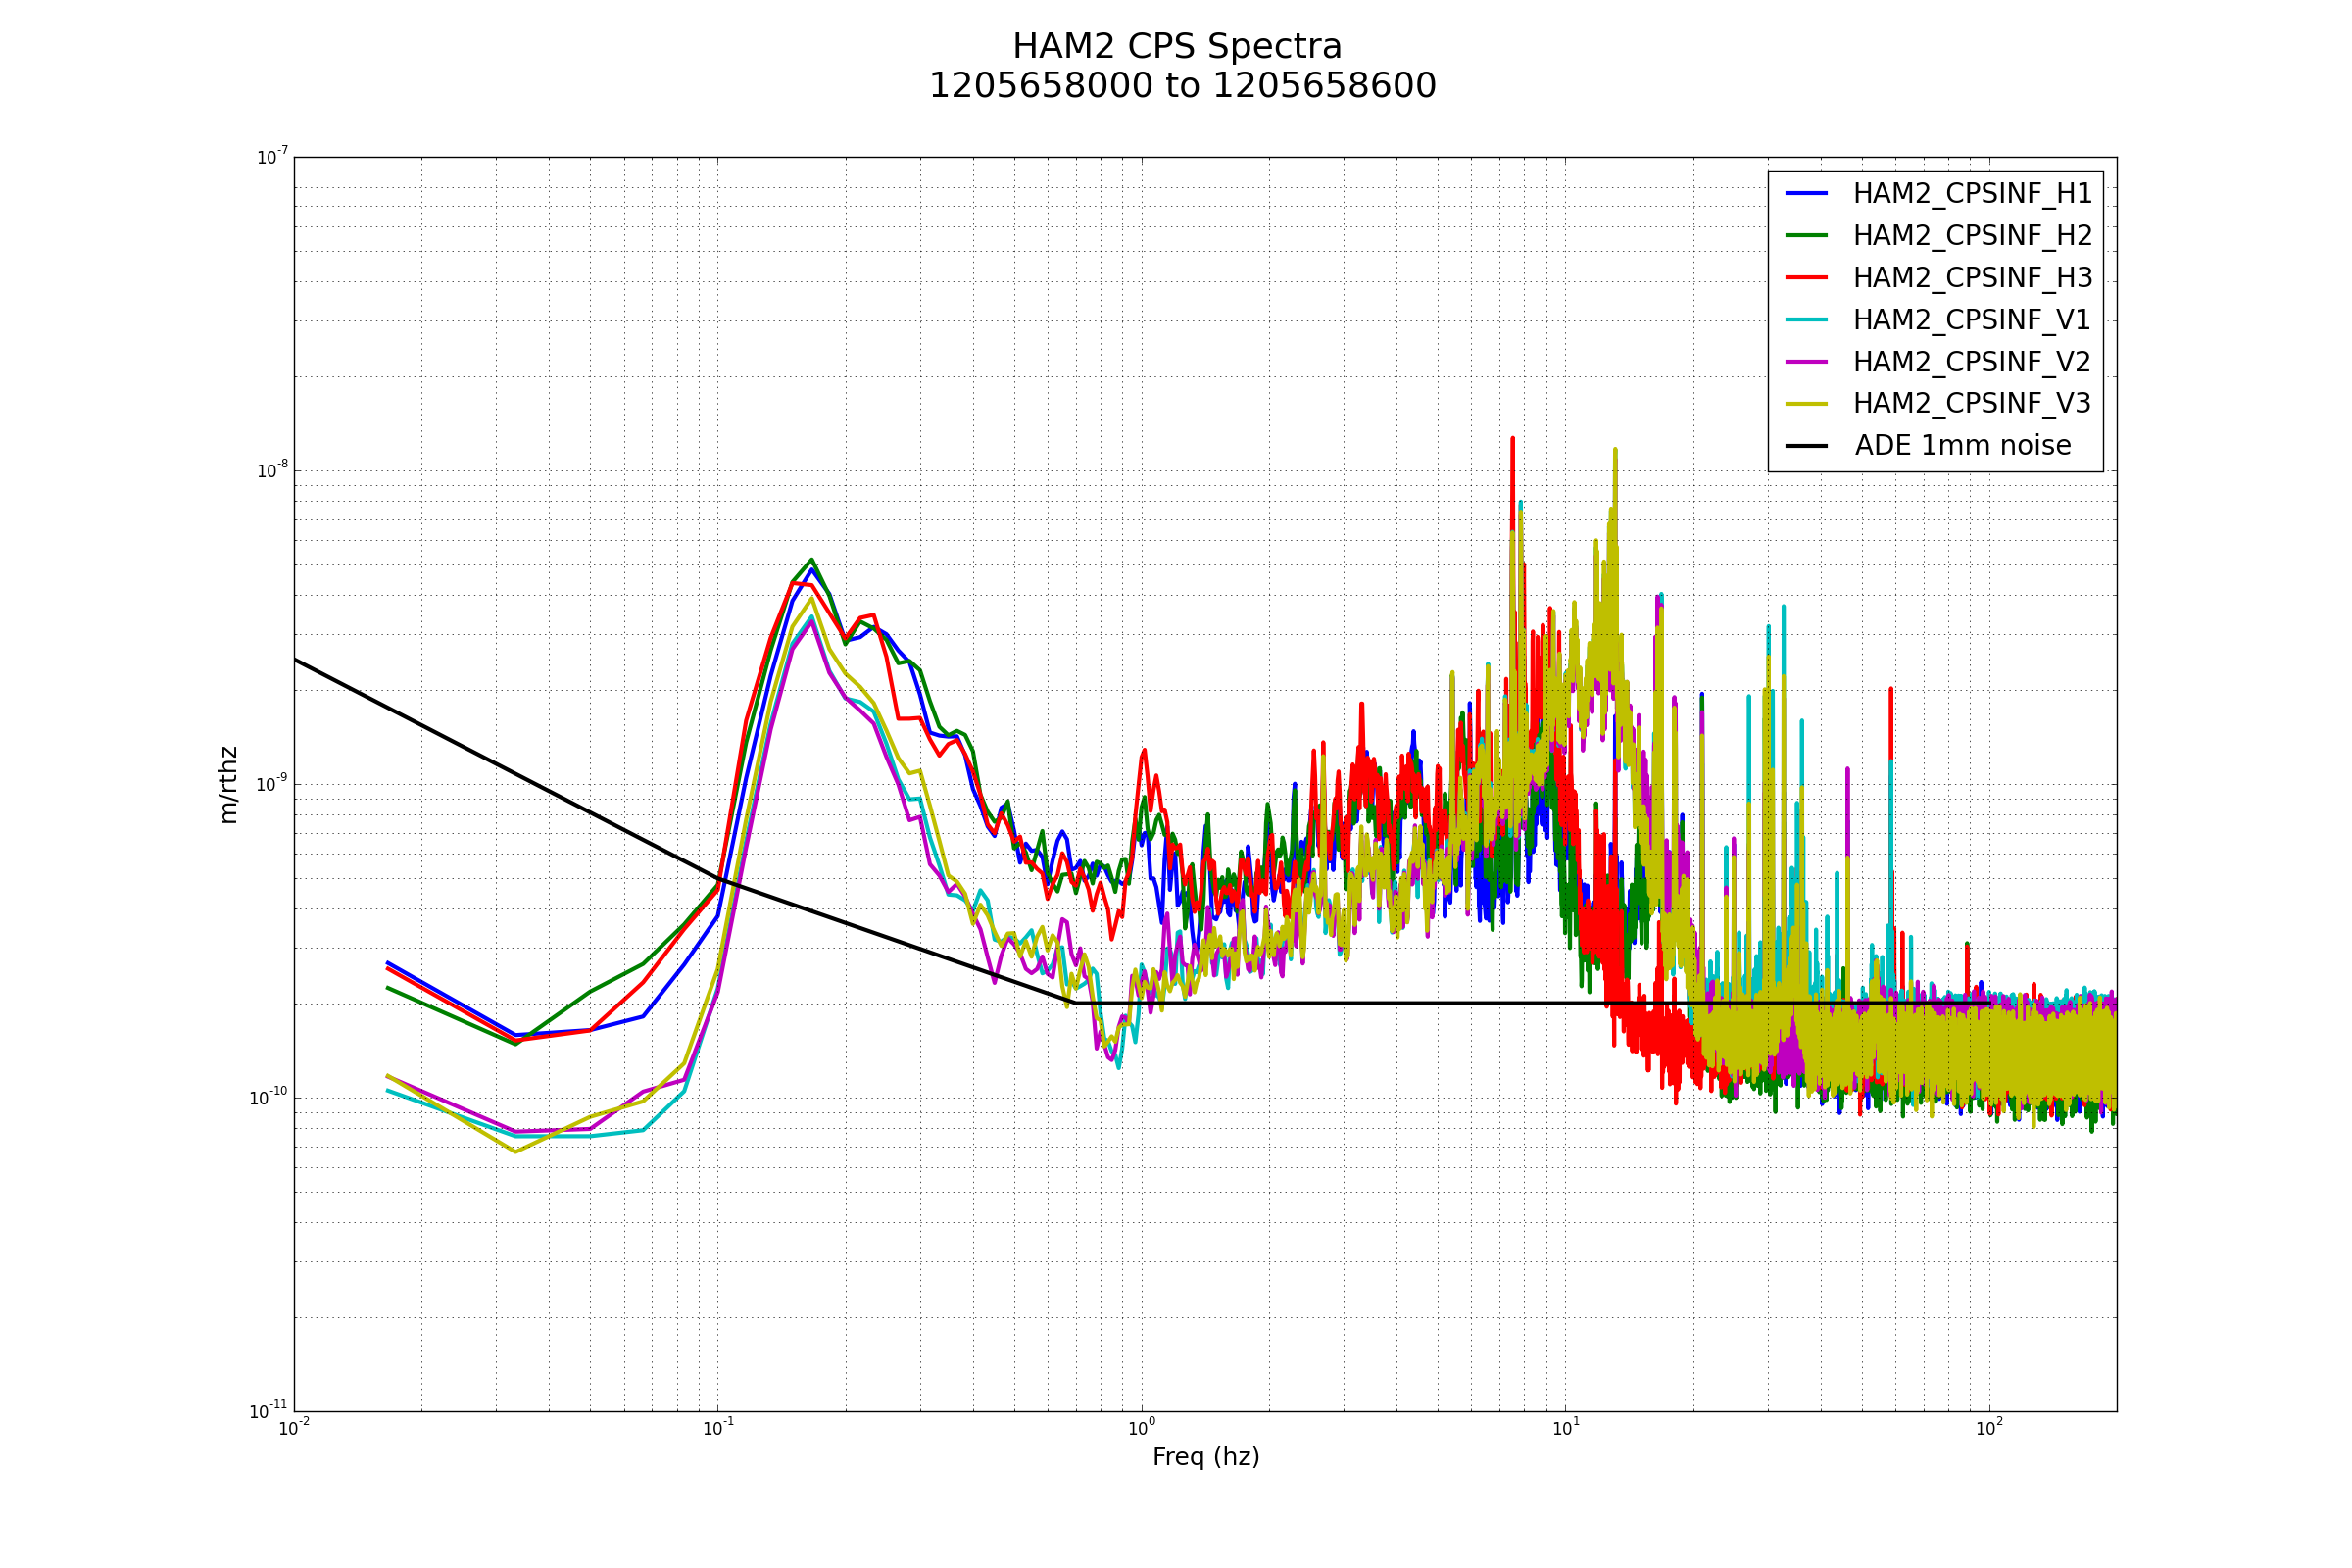
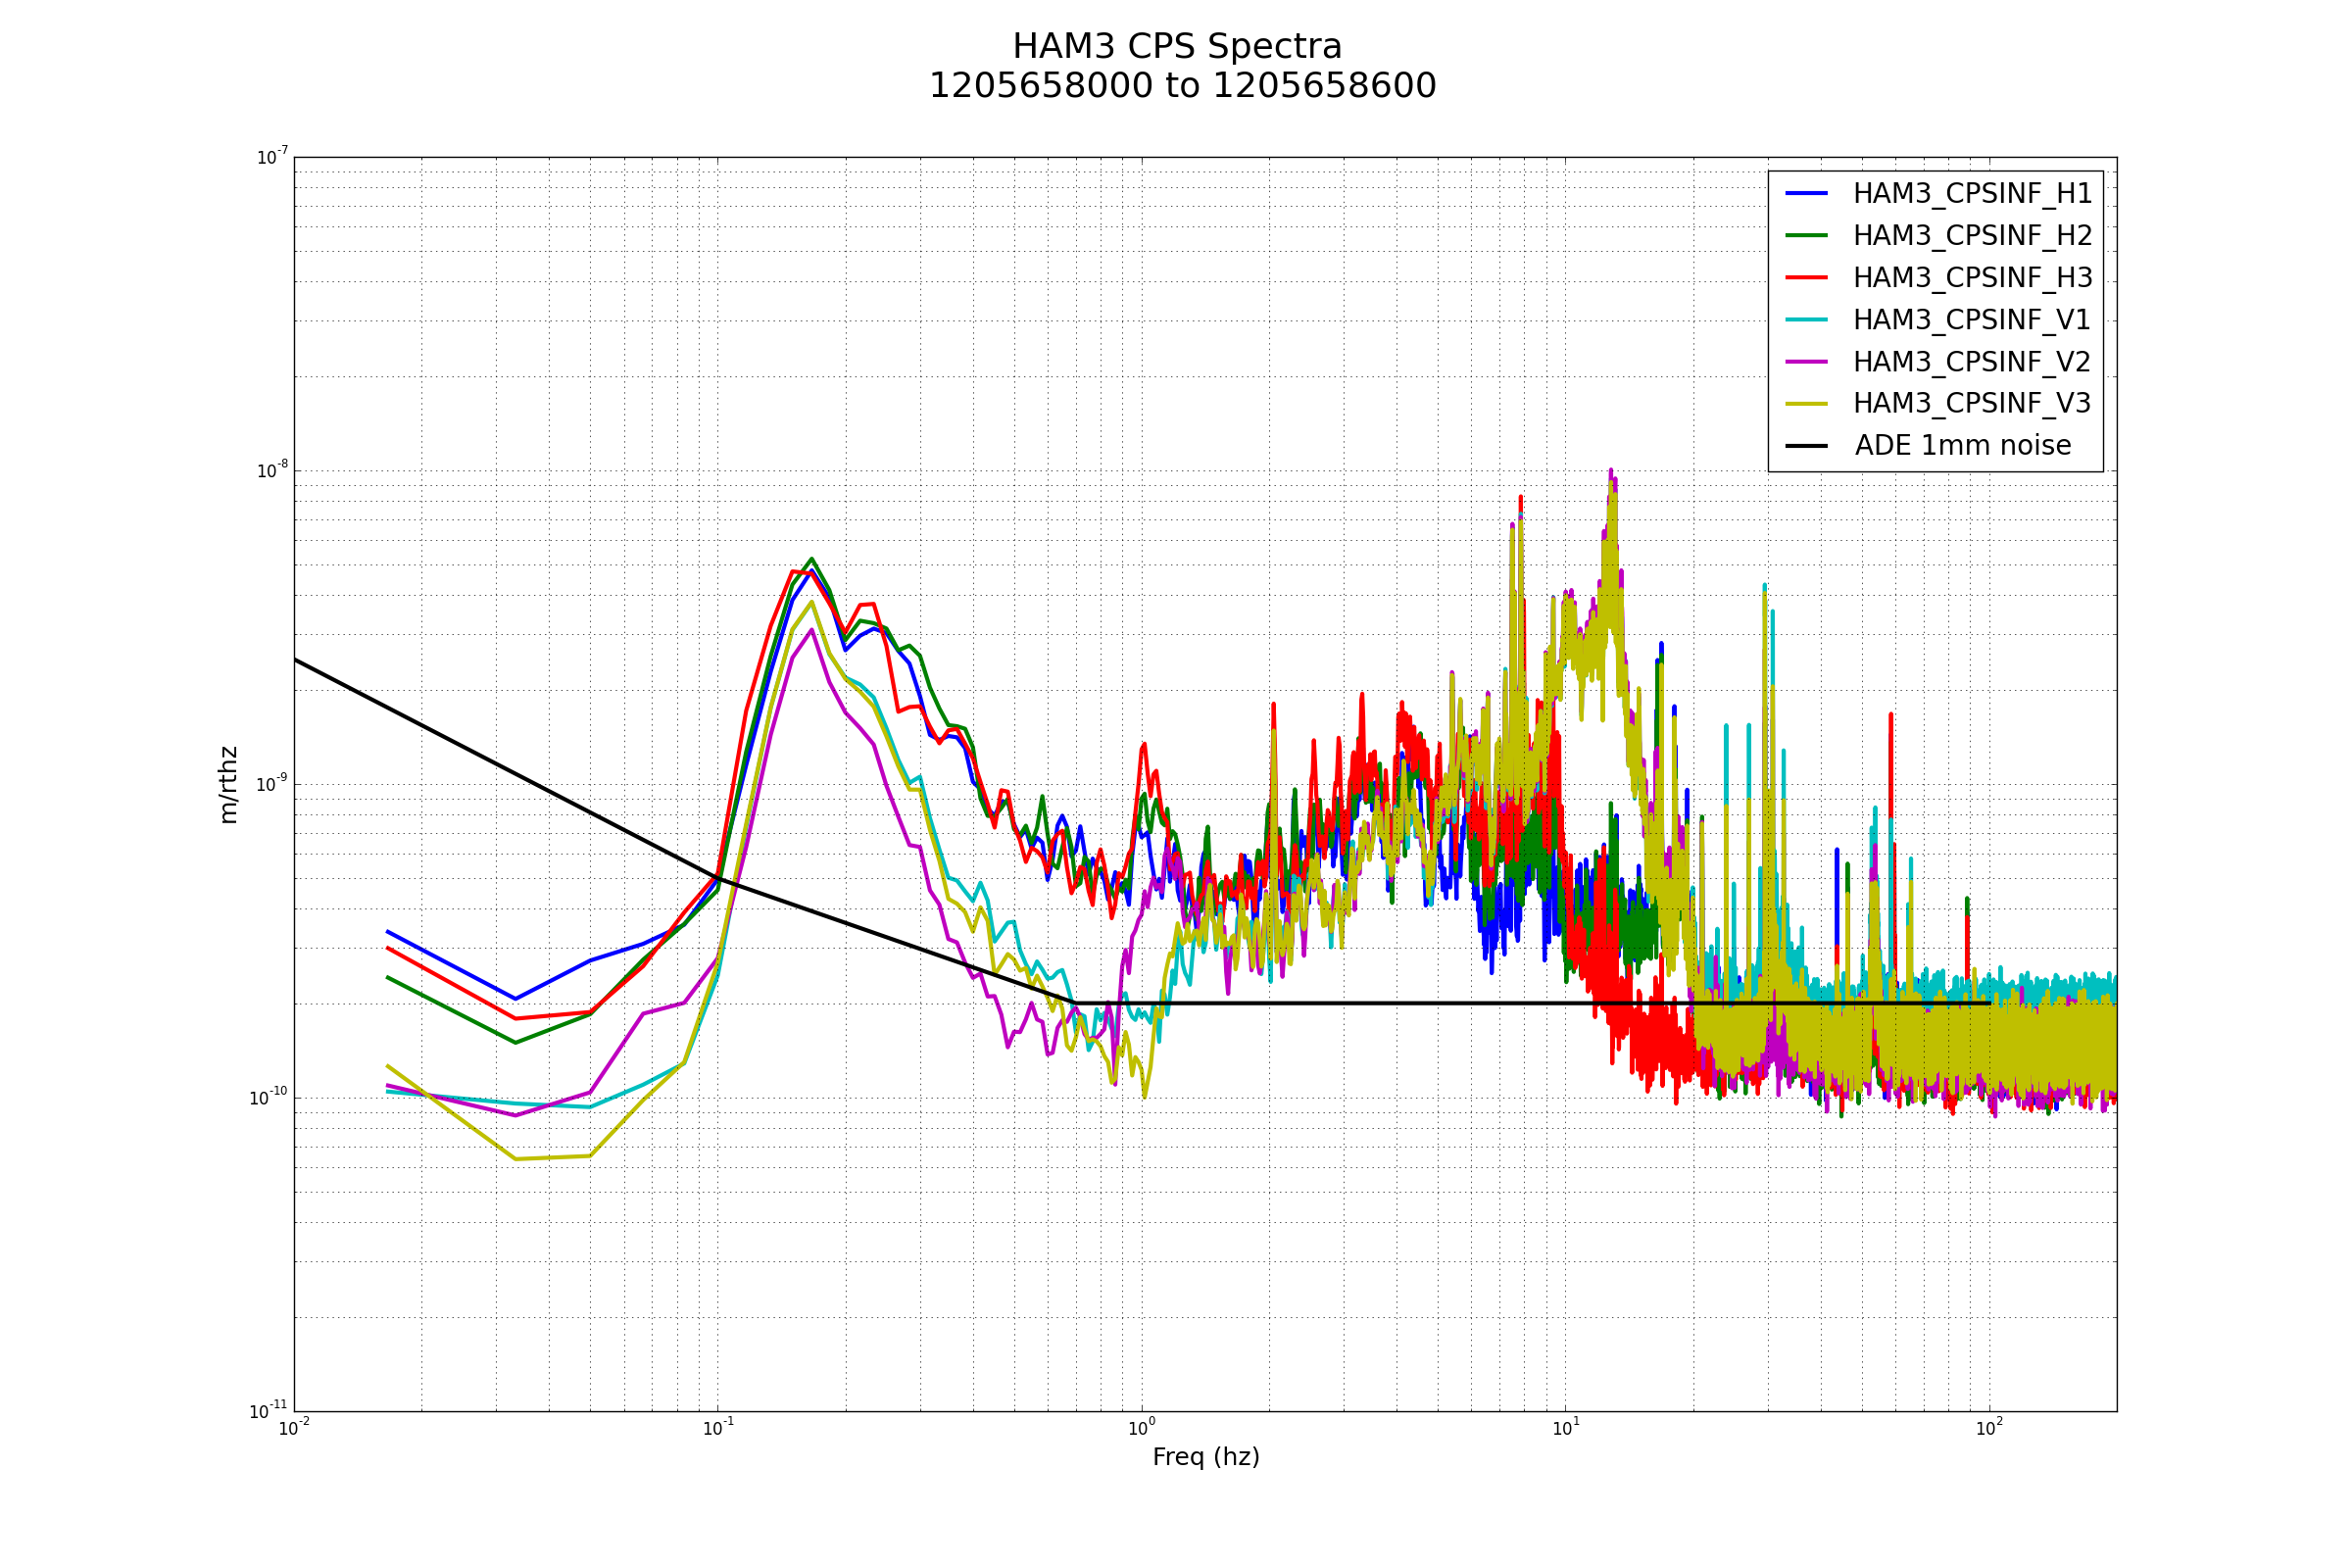
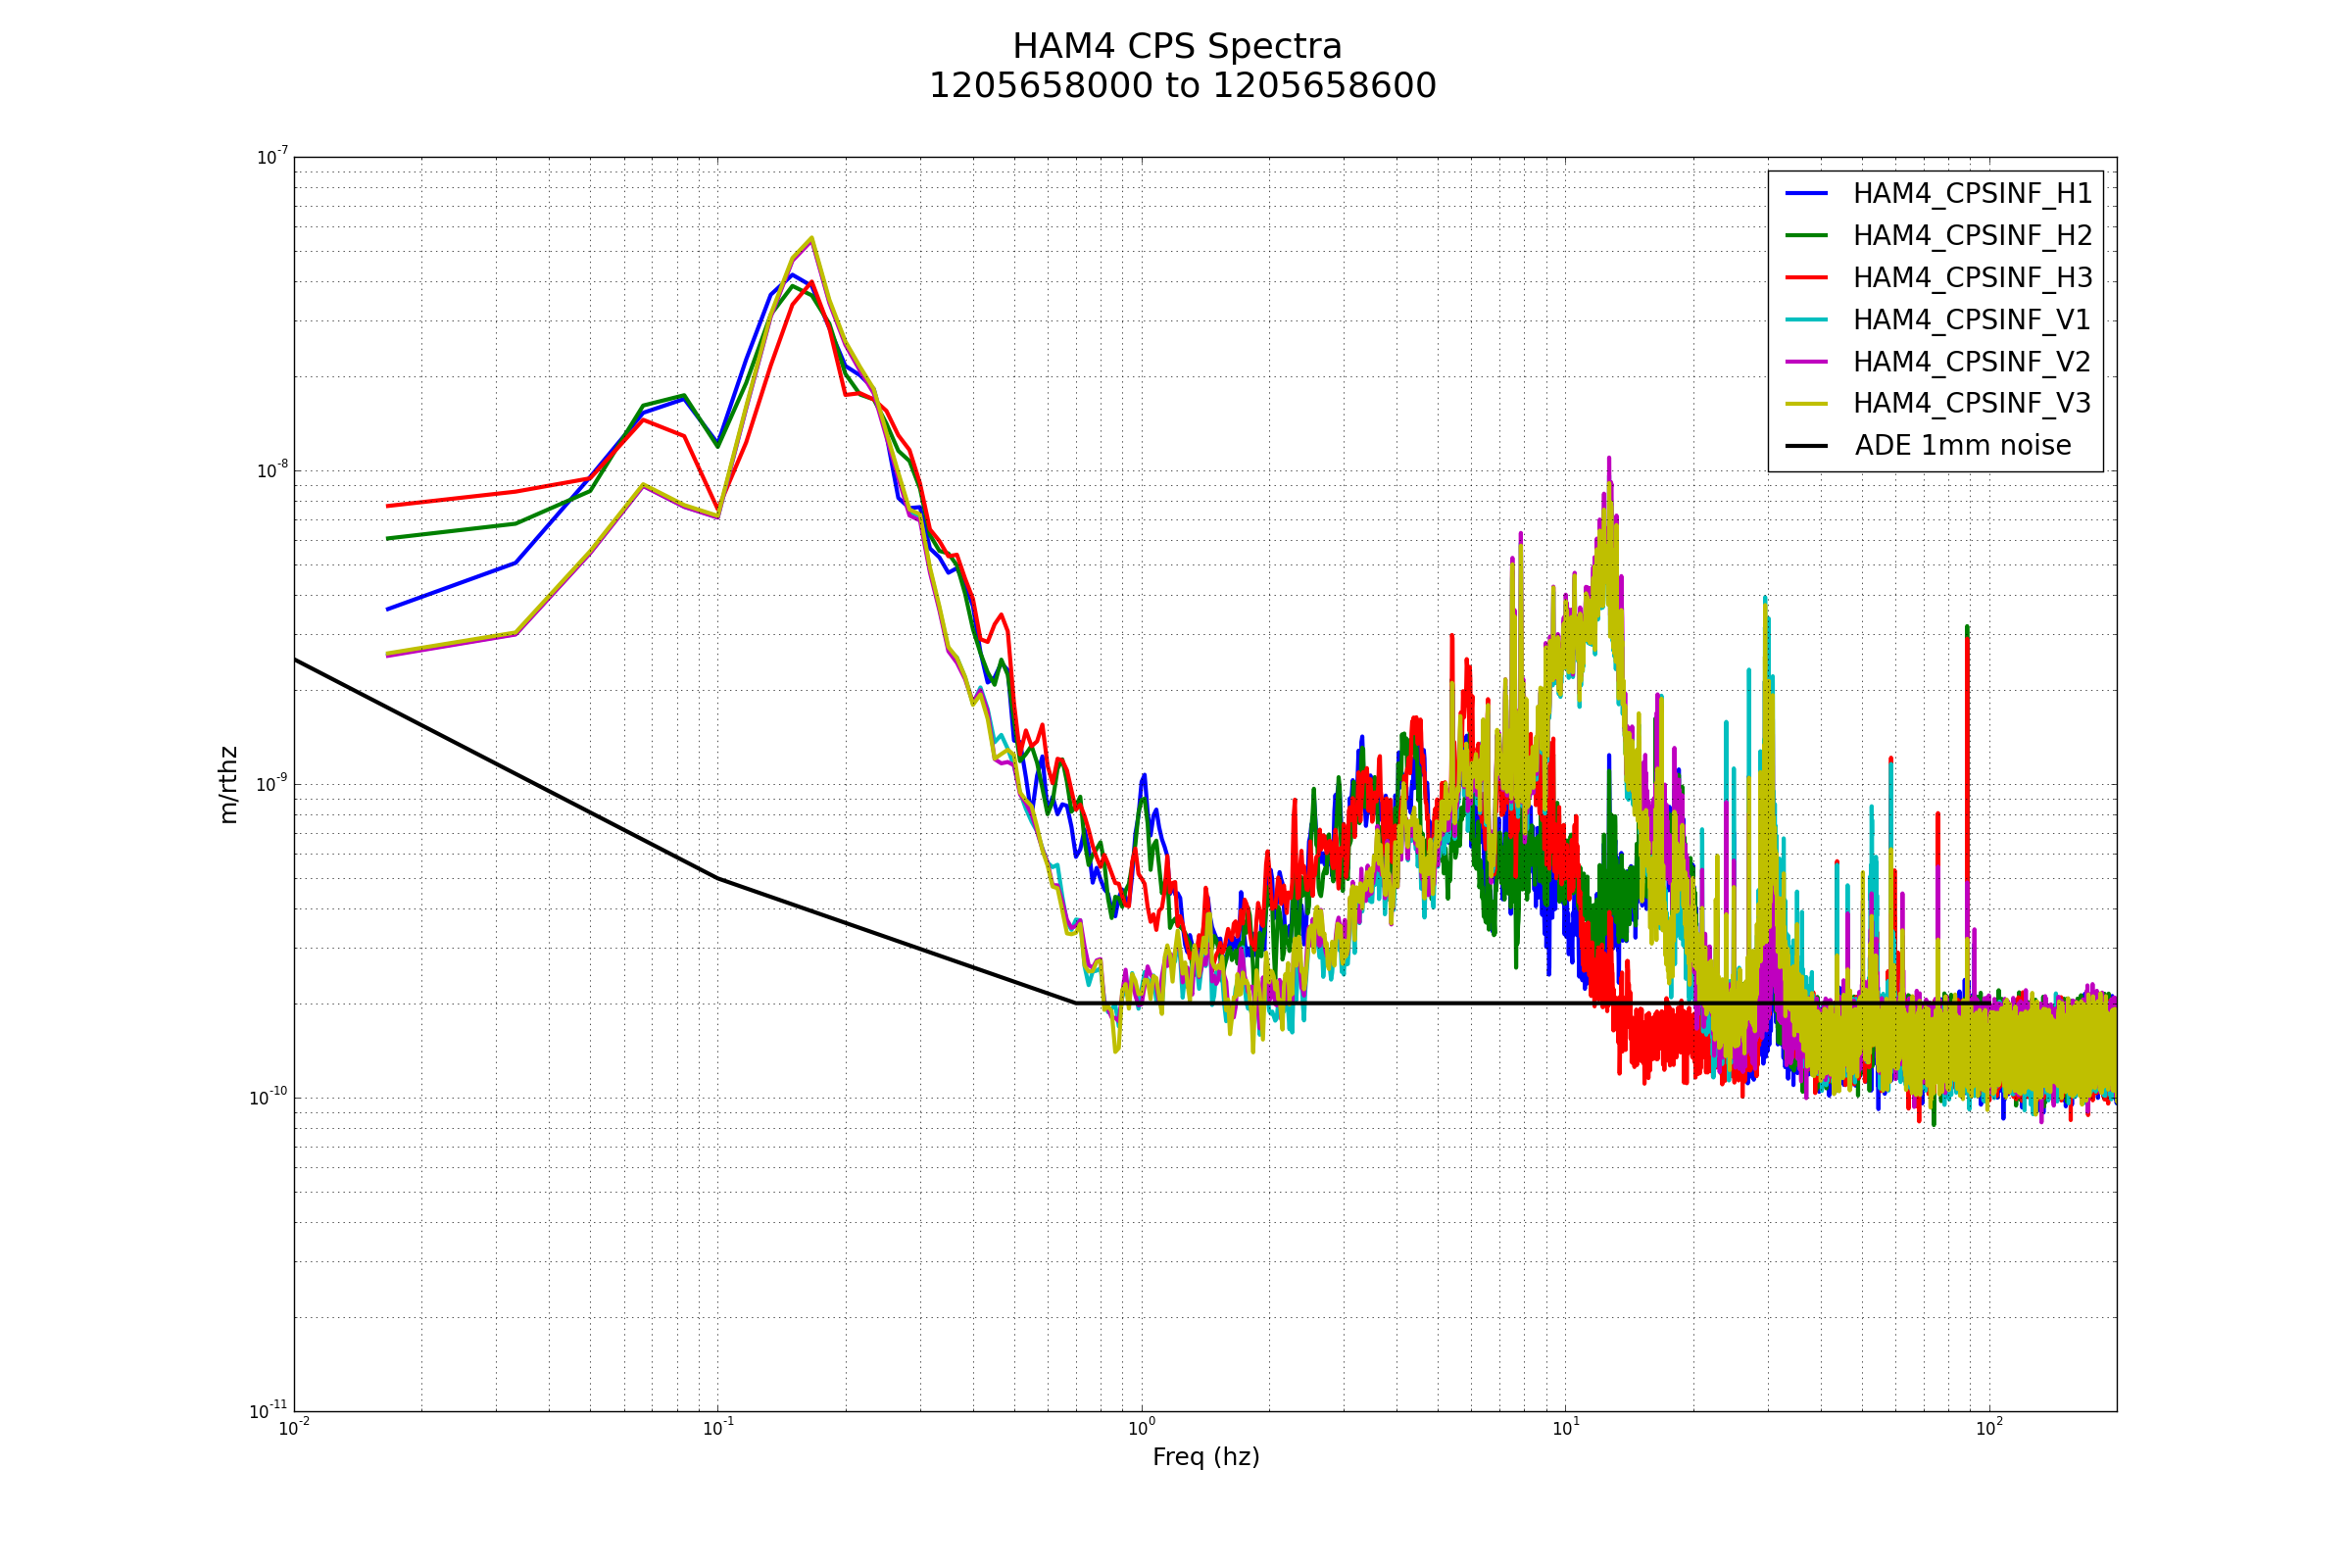
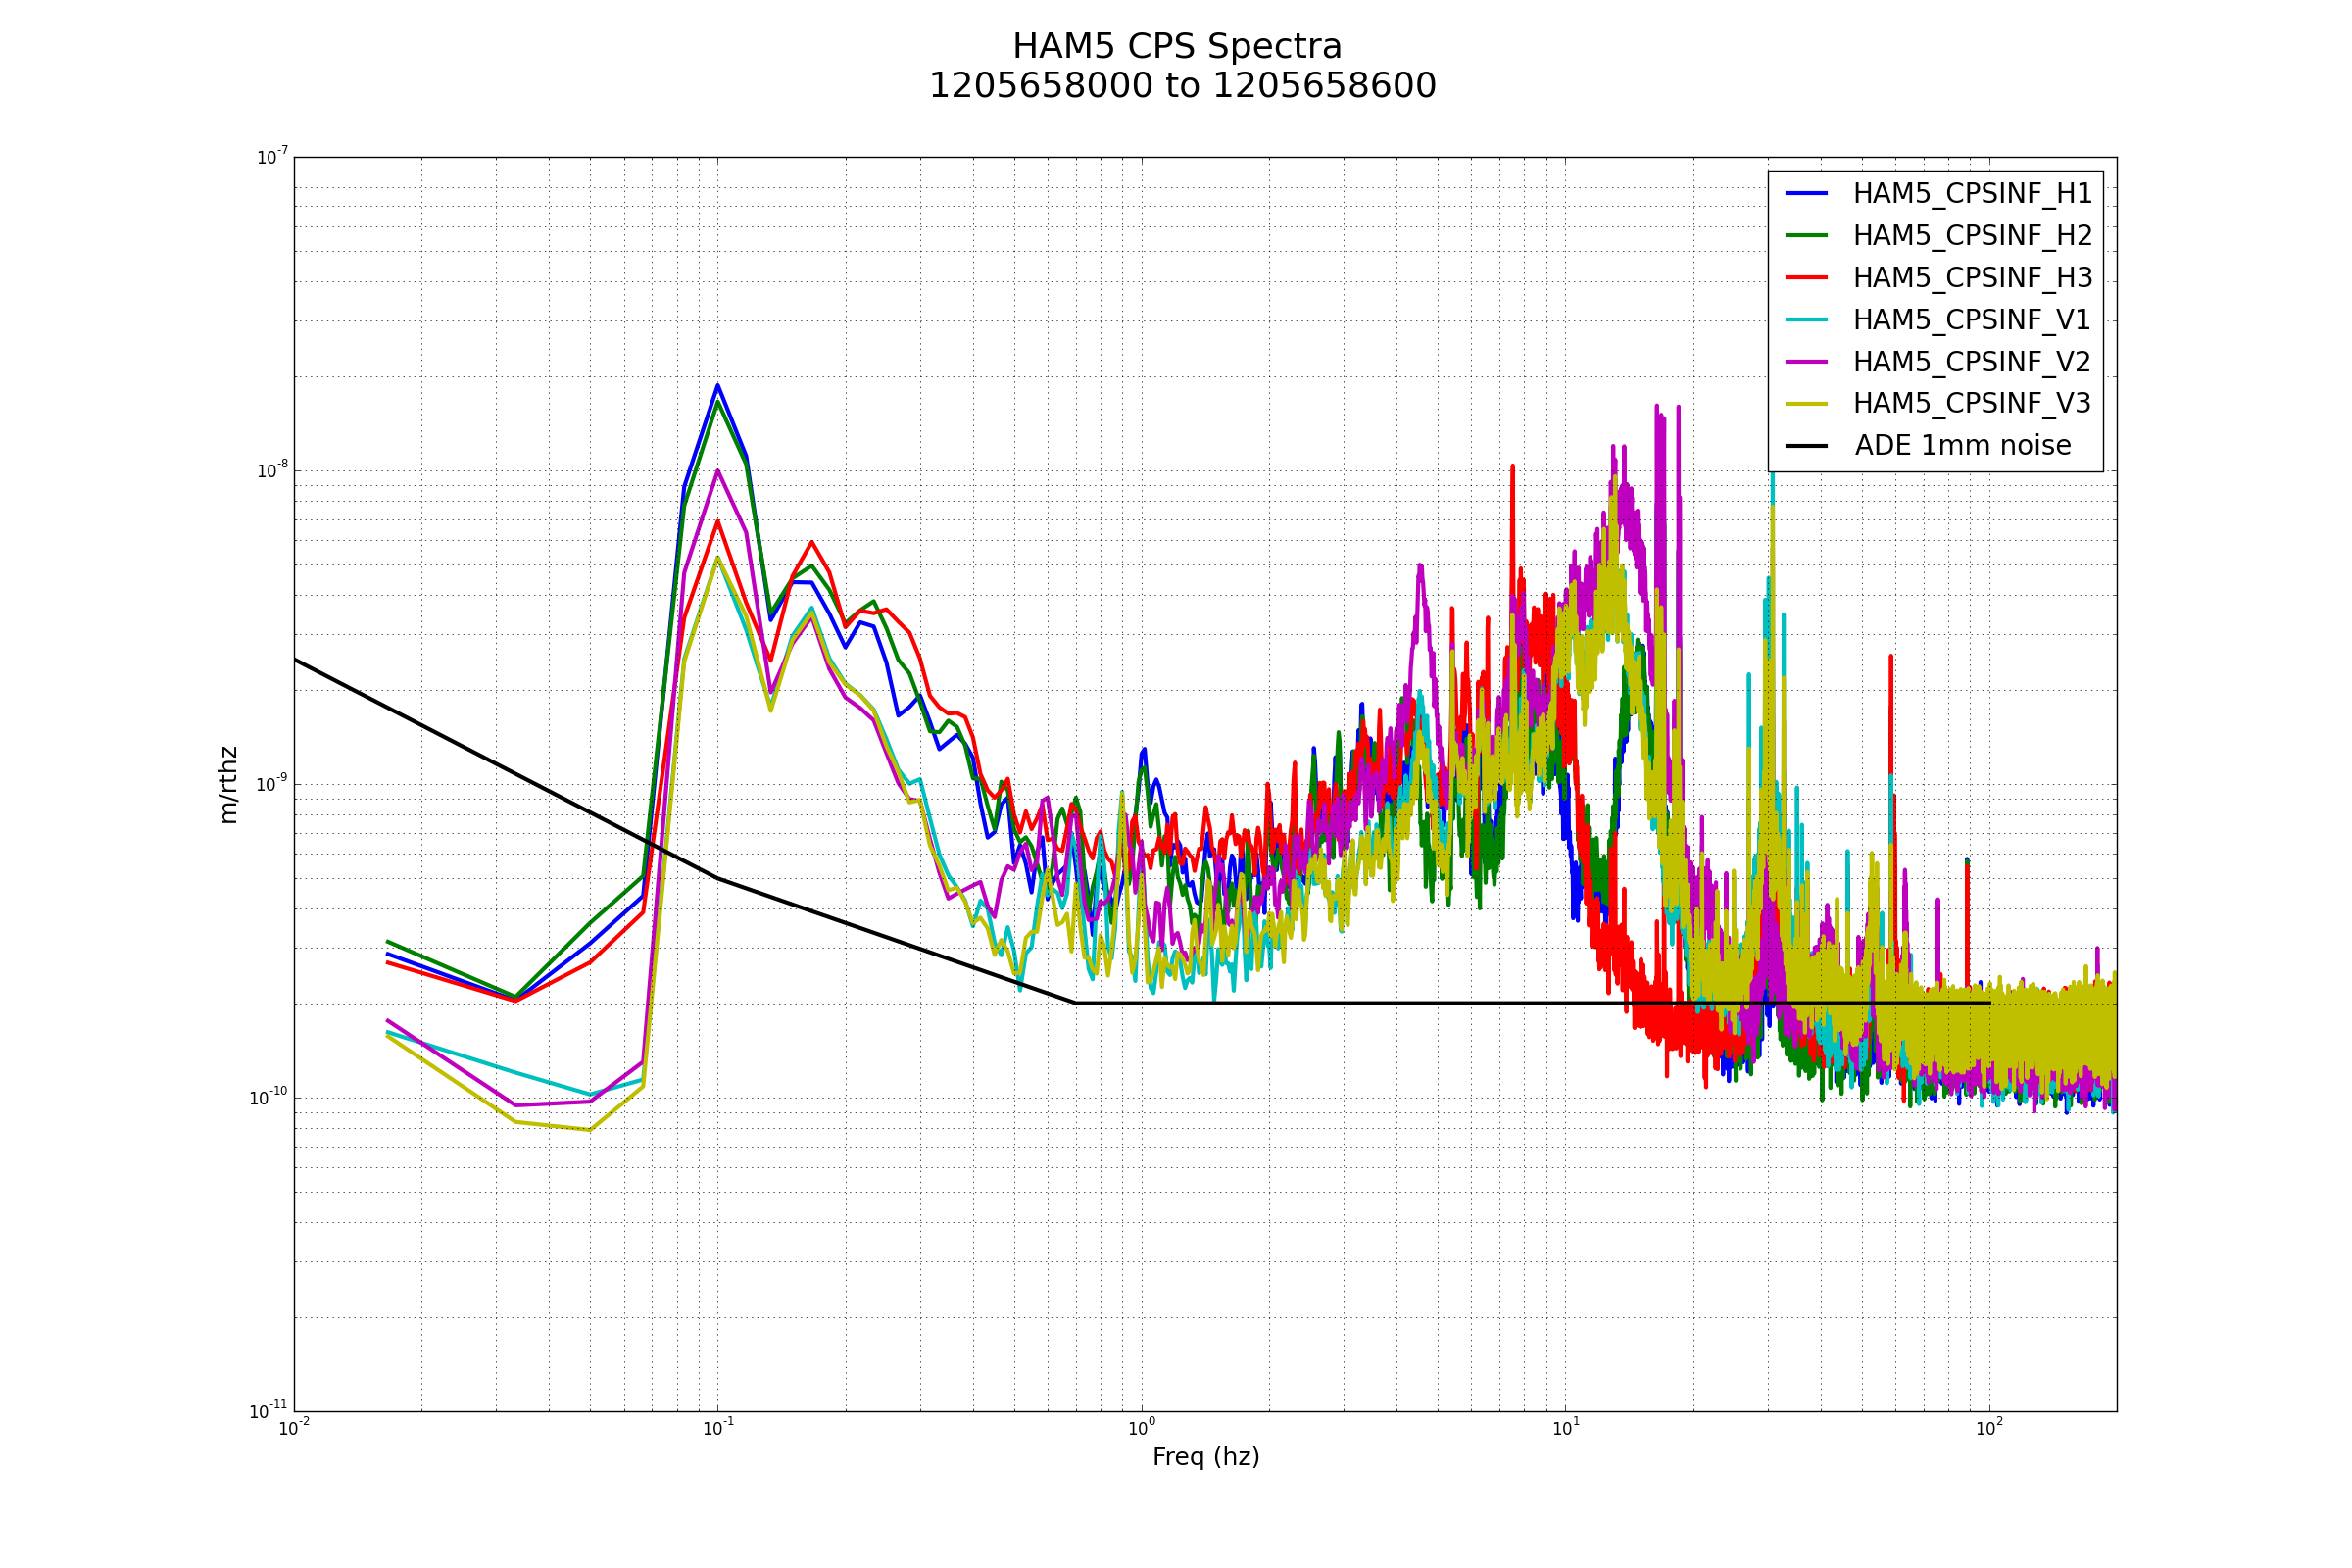
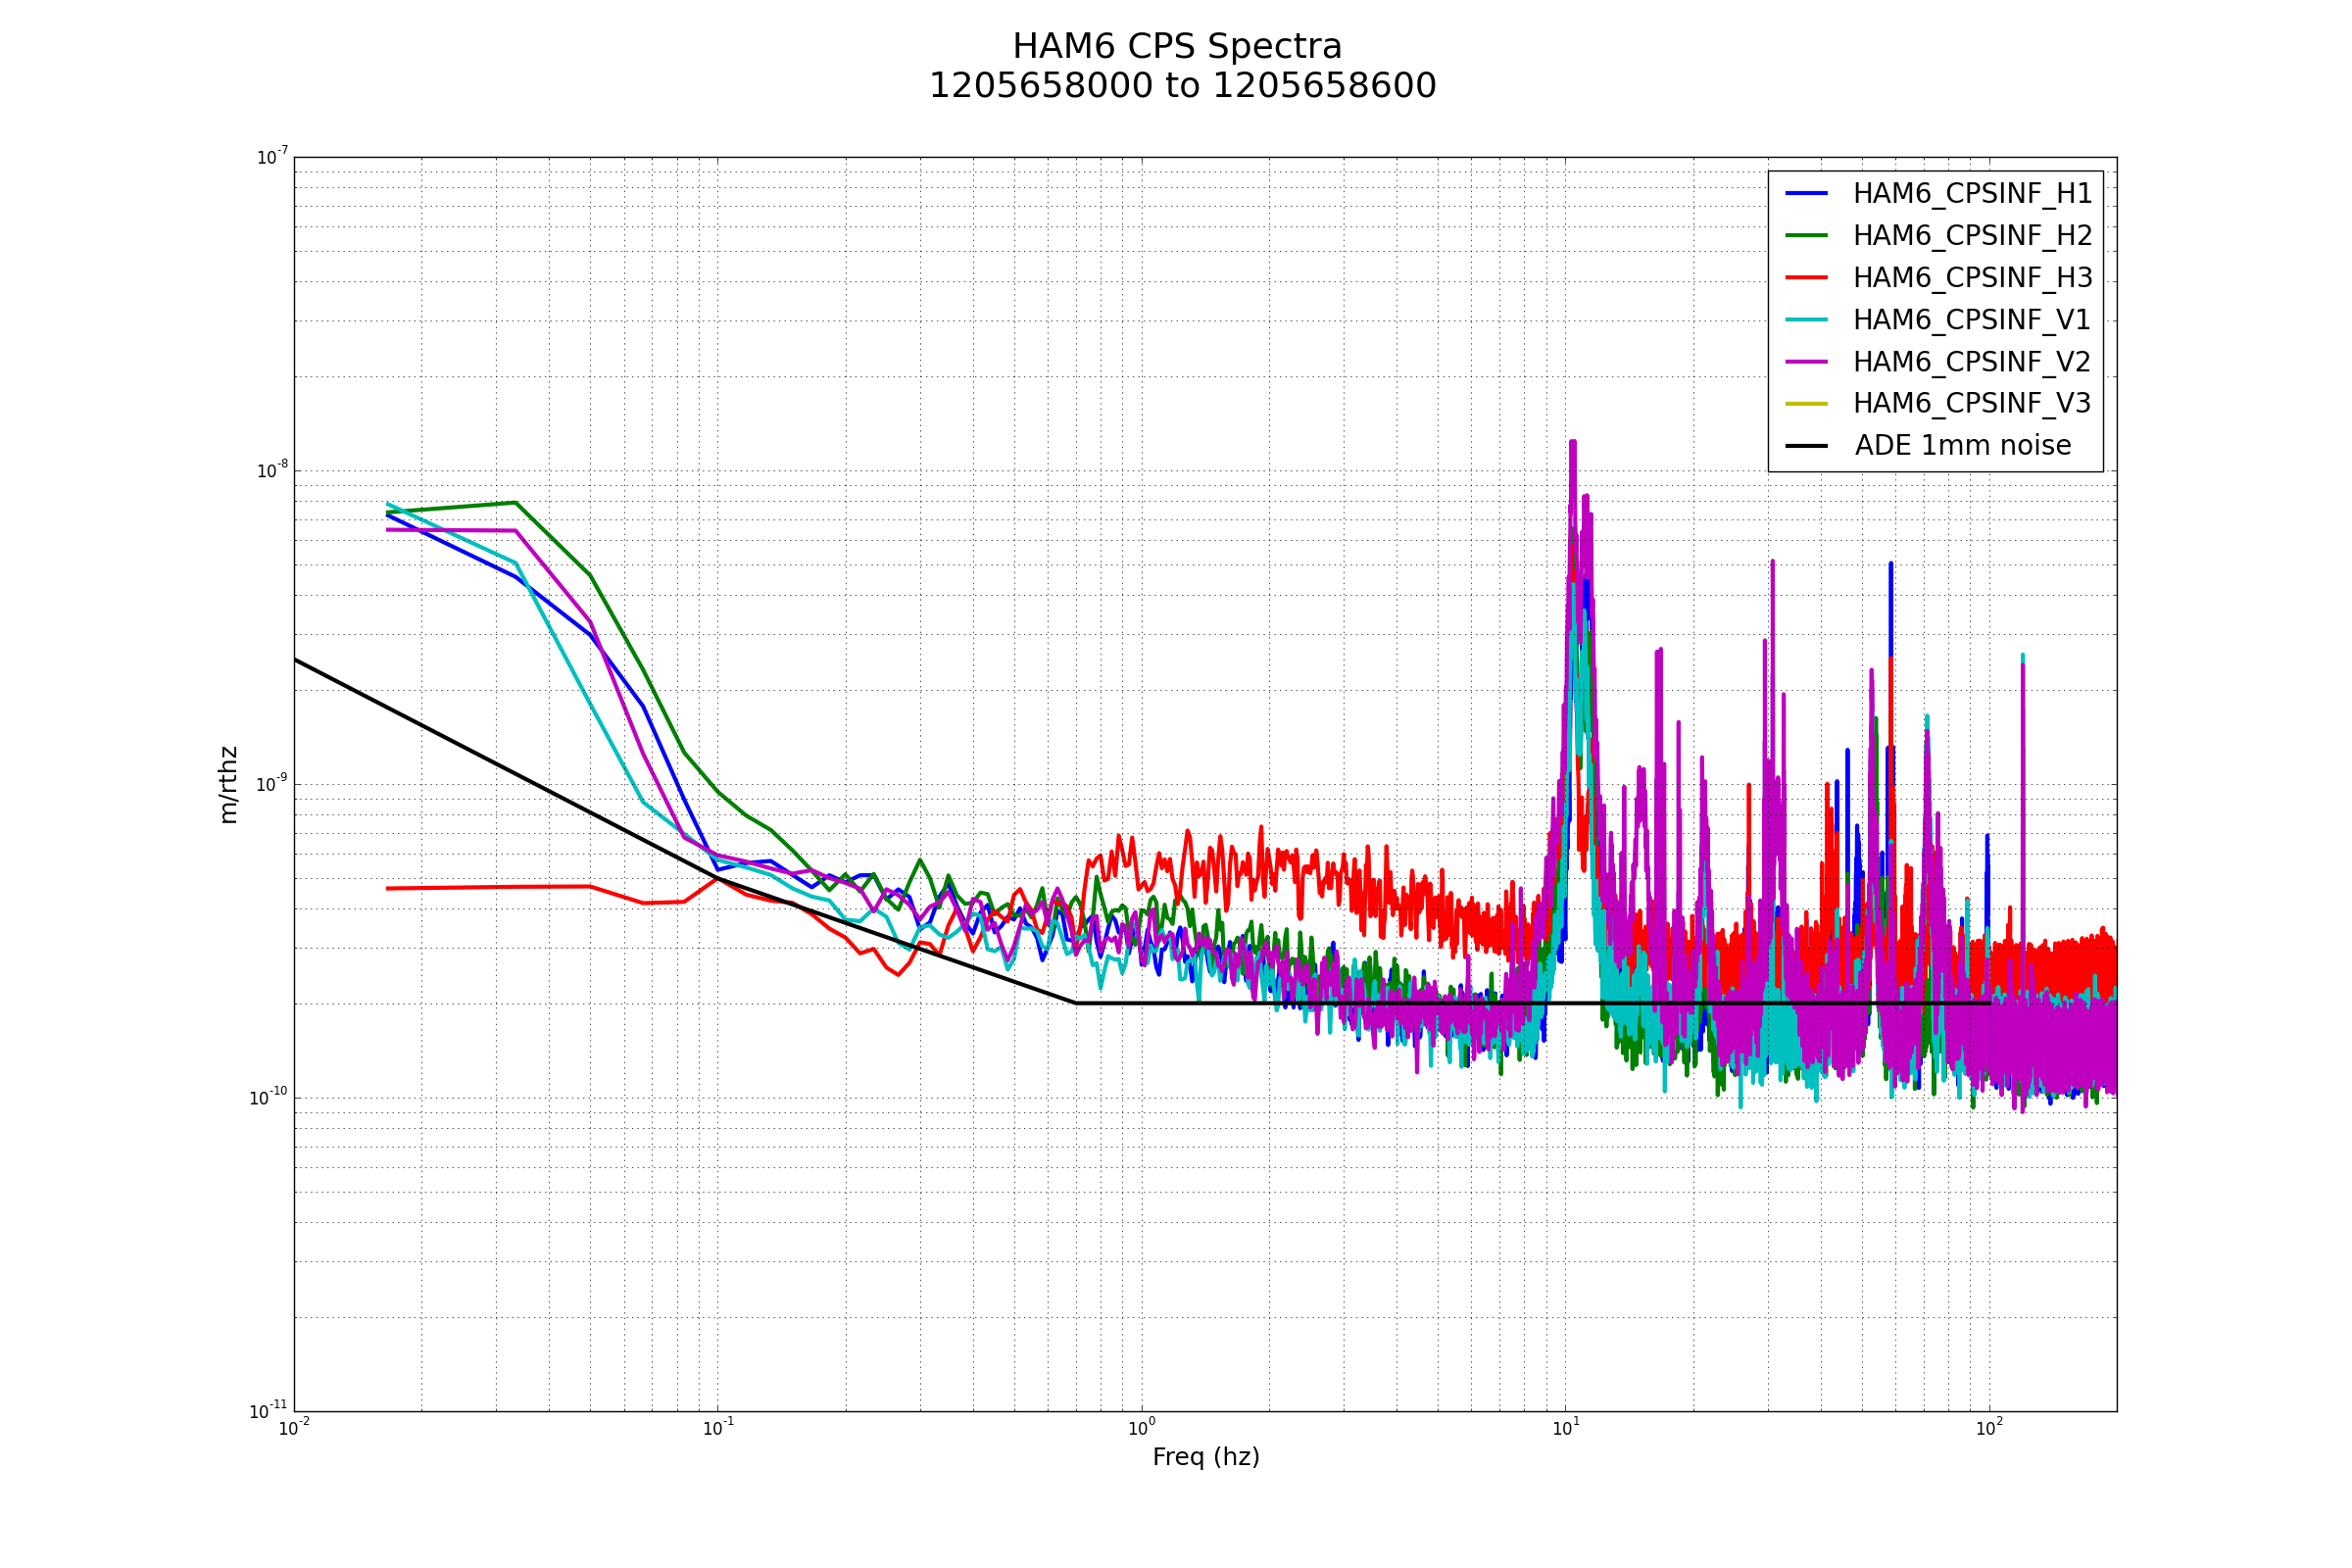
We need to get an Isolated spectra for closeout.
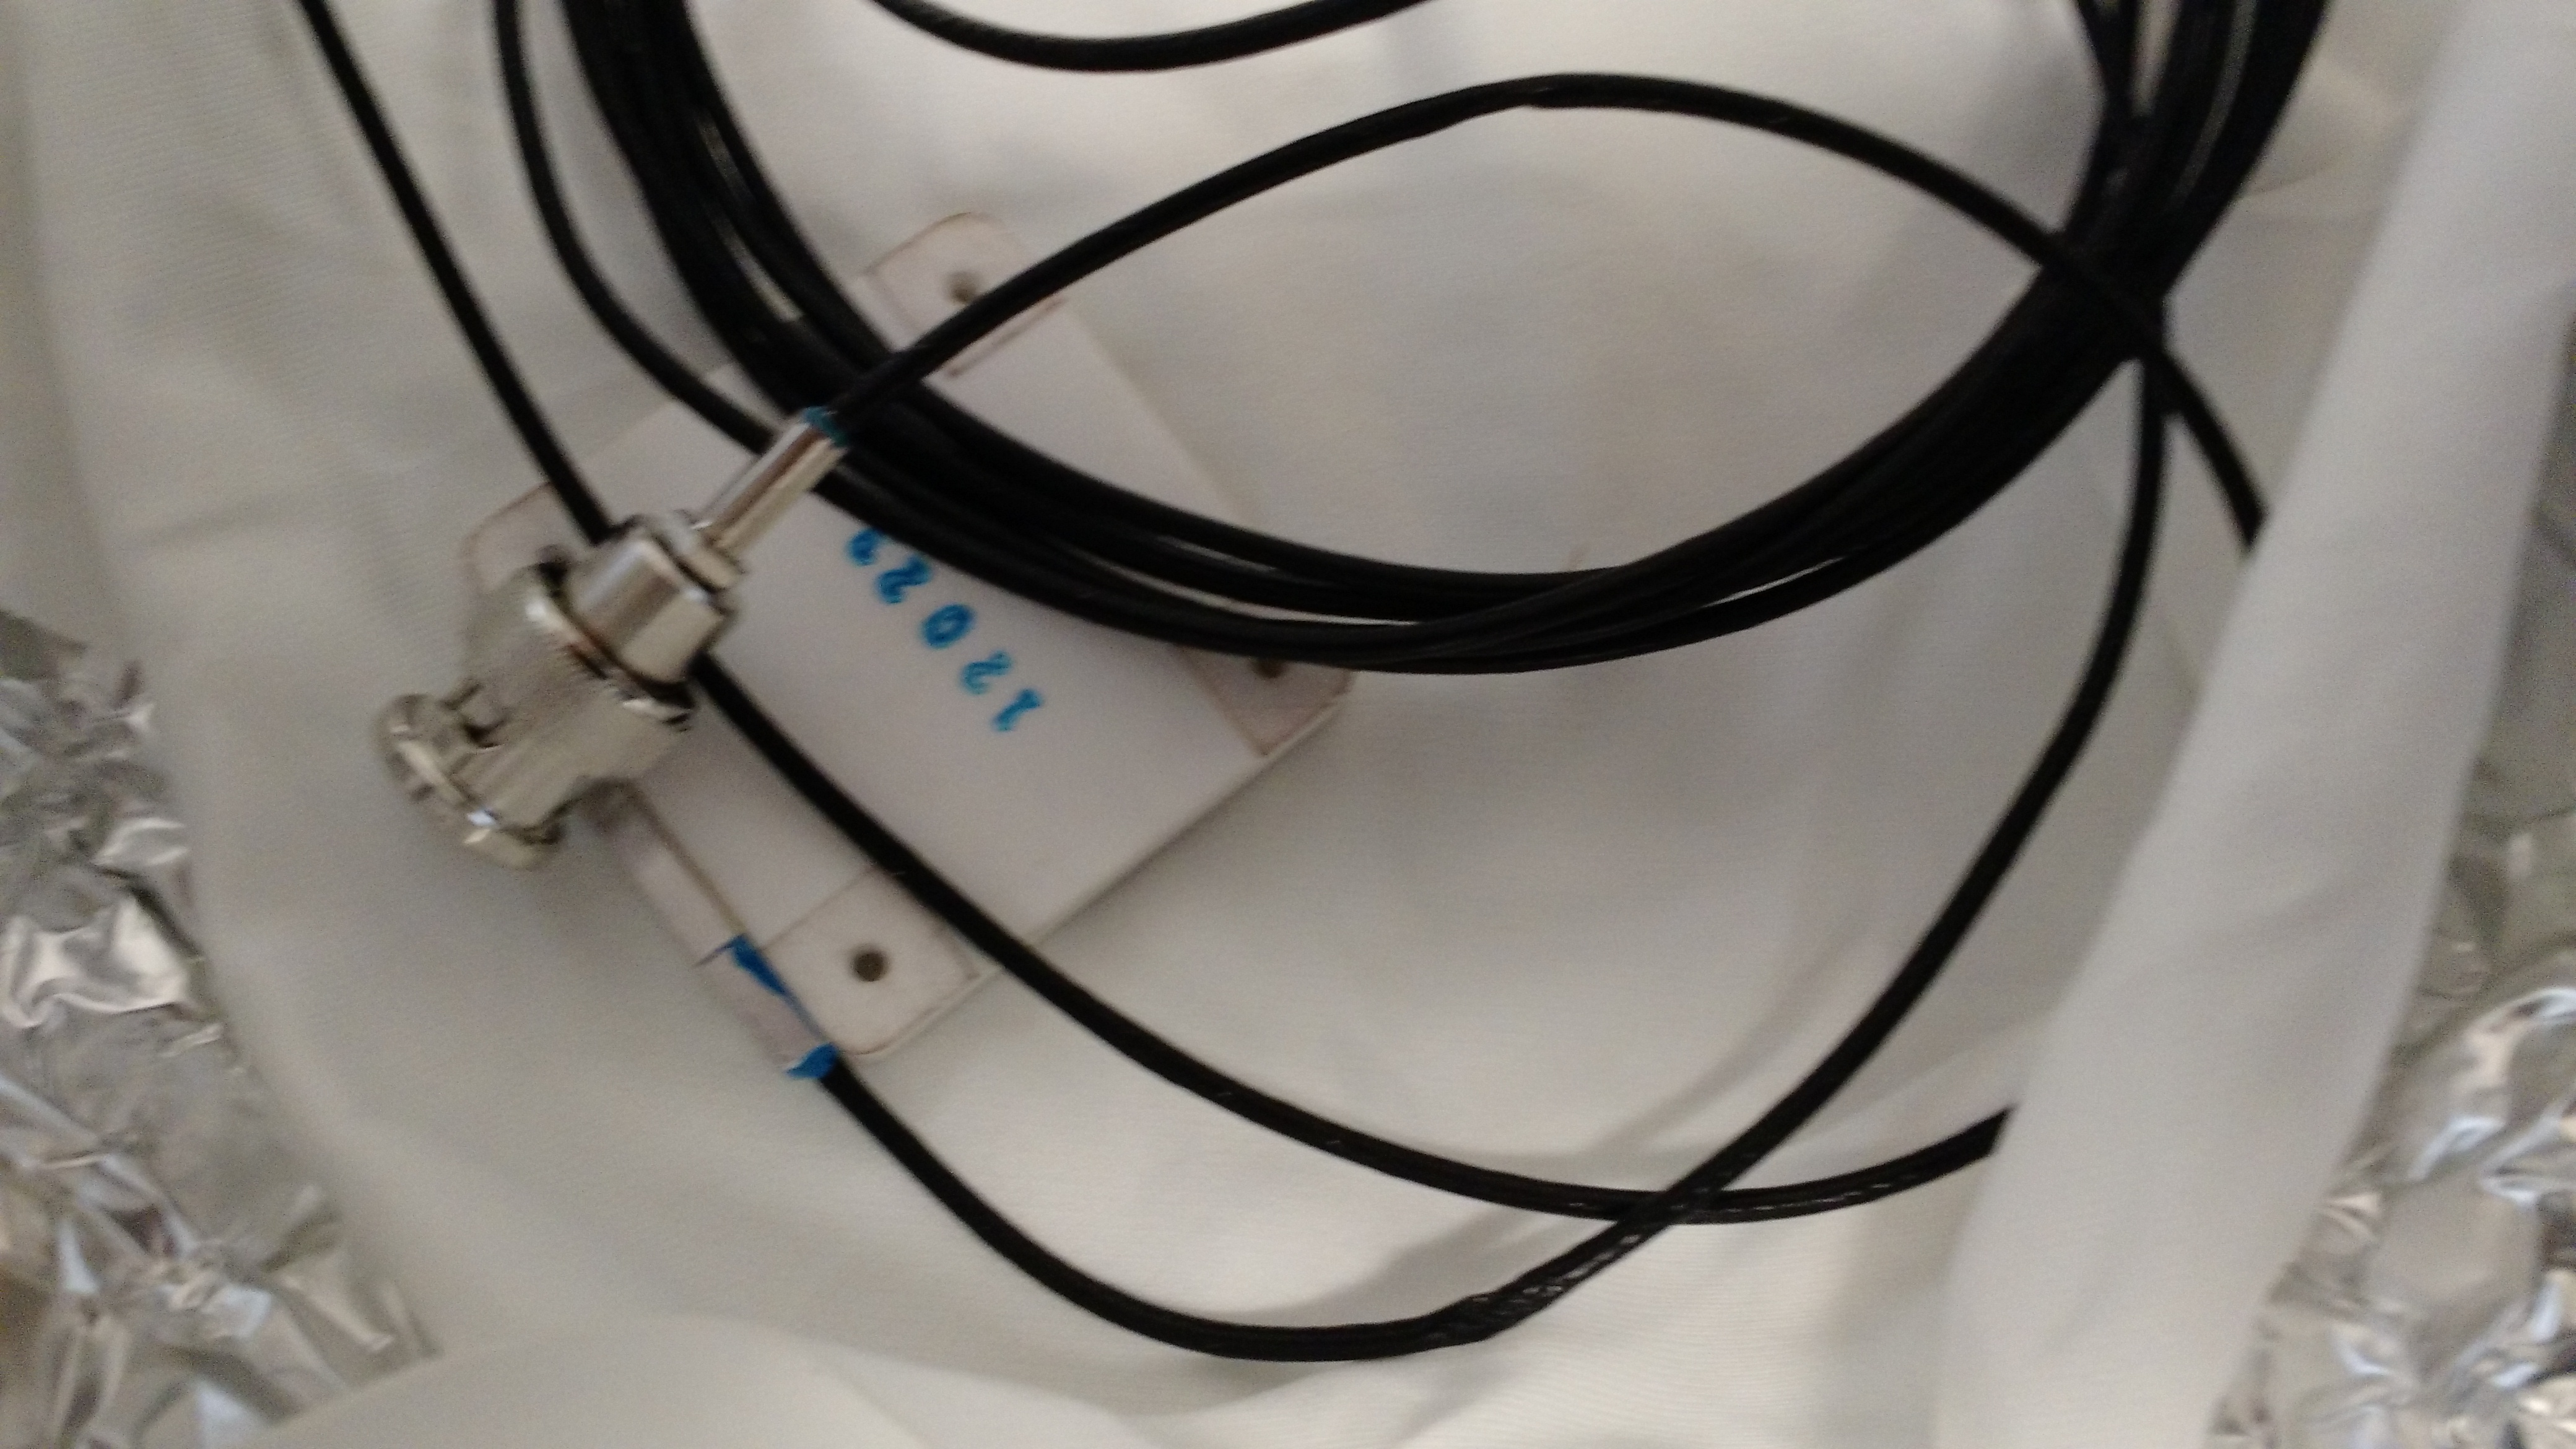
See photo below--I'll try to get some pointers on it (it is fuzzy too) but you can see where the zip ties a couple inches from the ends have damaged the insulation exposing the inner shield. There is also some shield visible at the BNC connector--this is where I was able to make it work and fail repeatably.