thomas.shaffer@LIGO.ORG - posted 19:43, Saturday 19 August 2017 (38277)
Lockloss @ 02:41UTC
No obvious cause.
No obvious cause.
TITLE: 08/19 Eve Shift: 23:00-07:00 UTC (16:00-00:00 PST), all times posted in UTC
STATE of H1: Observing at 50Mpc
OUTGOING OPERATOR: Corey
CURRENT ENVIRONMENT:
Wind: 15mph Gusts, 13mph 5min avg
Primary useism: 0.02 μm/s
Secondary useism: 0.08 μm/s
QUICK SUMMARY: All seems good and calm, 38hr lock.
TITLE: 08/19 Day Shift: 15:00-23:00 UTC (08:00-16:00 PST), all times posted in UTC
STATE of H1: Observing at 50Mpc
INCOMING OPERATOR: TJ
SHIFT SUMMARY:
Nice quiet shift with H1 locked for 38+hrs. Worth note are random visitors to the site who are in the area due to the #Eclipse2017 mania. :)
LOG:
Noticed Diag_Main message for "Seismon system not updating" at around 16:47. (Opening up the DIAG_MAIN node's Log, this message came out at 15:36utc (or 36min after Jim's shift ended).
Jim mentioned that we do not have an action to restart Seismon (he needs to get with Dave B. for troubleshooting).
Now on the Seismon medm, the Keep Alive is still flashing, and I don't see any notes on it about NO Updating.
TITLE: 08/19 Day Shift: 15:00-23:00 UTC (08:00-16:00 PST), all times posted in UTC
STATE of H1: Observing at 50Mpc
OUTGOING OPERATOR: Jim
CURRENT ENVIRONMENT:
Wind: 16mph Gusts, 9mph 5min avg
Primary useism: 0.04 μm/s
Secondary useism: 0.08 μm/s
Winds picking up a little in last hour, but otherwise quiet morning.
QUICK SUMMARY:
H1 locked for 30.5hrs. w/ range a little low at 50Mpc (low for the post-MT-EQ-epoch).
Made quick OSB walkabout w/ nothing to report.
TITLE: 08/19 Owl Shift: 07:00-15:00 UTC (00:00-08:00 PST), all times posted in UTC
STATE of H1: Observing at 49Mpc
INCOMING OPERATOR: Corey
SHIFT SUMMARY: Quiet Shift
LOG:
Locked all shift. Not much too report.
TITLE: 08/19 Eve Shift: 23:00-07:00 UTC (16:00-00:00 PST), all times posted in UTC
STATE of H1: Observing at 49Mpc
INCOMING OPERATOR: Jim
SHIFT SUMMARY: Wind is still at a consistent 20mph, but on a 22hr lock.
Looks like we just rode through 6.4M Fiji ~500km deep.
19hr lock.
TITLE: 08/18 Eve Shift: 23:00-07:00 UTC (16:00-00:00 PST), all times posted in UTC
STATE of H1: Observing at 50Mpc
OUTGOING OPERATOR: Cheryl
CURRENT ENVIRONMENT:
Wind: 16mph Gusts, 10mph 5min avg
Primary useism: 0.03 μm/s
Secondary useism: 0.09 μm/s
QUICK SUMMARY: 14hr lock at a lower 50Mpc.
TITLE: 08/18 Day Shift: 15:00-23:00 UTC (08:00-16:00 PST), all times posted in UTC
STATE of H1: Observing at 49Mpc
INCOMING OPERATOR: TJ
SHIFT SUMMARY:
LOG:
TITLE: 08/18 Day Shift: 15:00-23:00 UTC (08:00-16:00 PST), all times posted in UTC
STATE of H1: Observing at 50Mpc
OUTGOING OPERATOR: Jim
CURRENT ENVIRONMENT:
Wind: 7mph Gusts, 5mph 5min avg
Primary useism: 0.01 μm/s
Secondary useism: 0.10 μm/s
QUICK SUMMARY: after EQ, drop in range from 24 hours ago
TITLE: 08/18 Owl Shift: 07:00-15:00 UTC (00:00-08:00 PST), all times posted in UTC
STATE of H1: Observing at 52Mpc
INCOMING OPERATOR: Cheryl
SHIFT SUMMARY:
LOG:
Recovery from earthquake was rough. Jeff was waiting for violins to settle when I arrived, we got to Low Noise ESD ETMY and ISC_DRMI guardian said somethin about the ETMY ESD not being on. Didn't know what to do, so I pushed the "On" button on the ETMY SUS overview, which broke the lock. After that, I couldn't get past Locking ALS. Not knowing what else to do, I did an initial alignment. When I got to Mich alignment, I couldn't get locked on the dark fringe, at all. I eventually just put the alignment guardian in down and aligned the AS spot by eye, finished SRC and went back to locking. A few attempts at locking PRMI/DRMI and I was able to move on. Violins were a bit high after, but they damped down on their own. Ran A2L, which seemed to take an unusual amount of time to complete.
Back to observing at 9:20.
At mid shift all is well. We are at triple coincident observing. With the wind dropping a little, environmental conditions are good.
TITLE: 08/17 Day Shift: 15:00-23:00 UTC (08:00-16:00 PST), all times posted in UTC
STATE of H1: Observing at 52Mpc
INCOMING OPERATOR: Jeff
SHIFT SUMMARY: locked all shift
LOG:
Ran A2L when LLO lost lock.
Two attachments - DARM_a2l_passive:
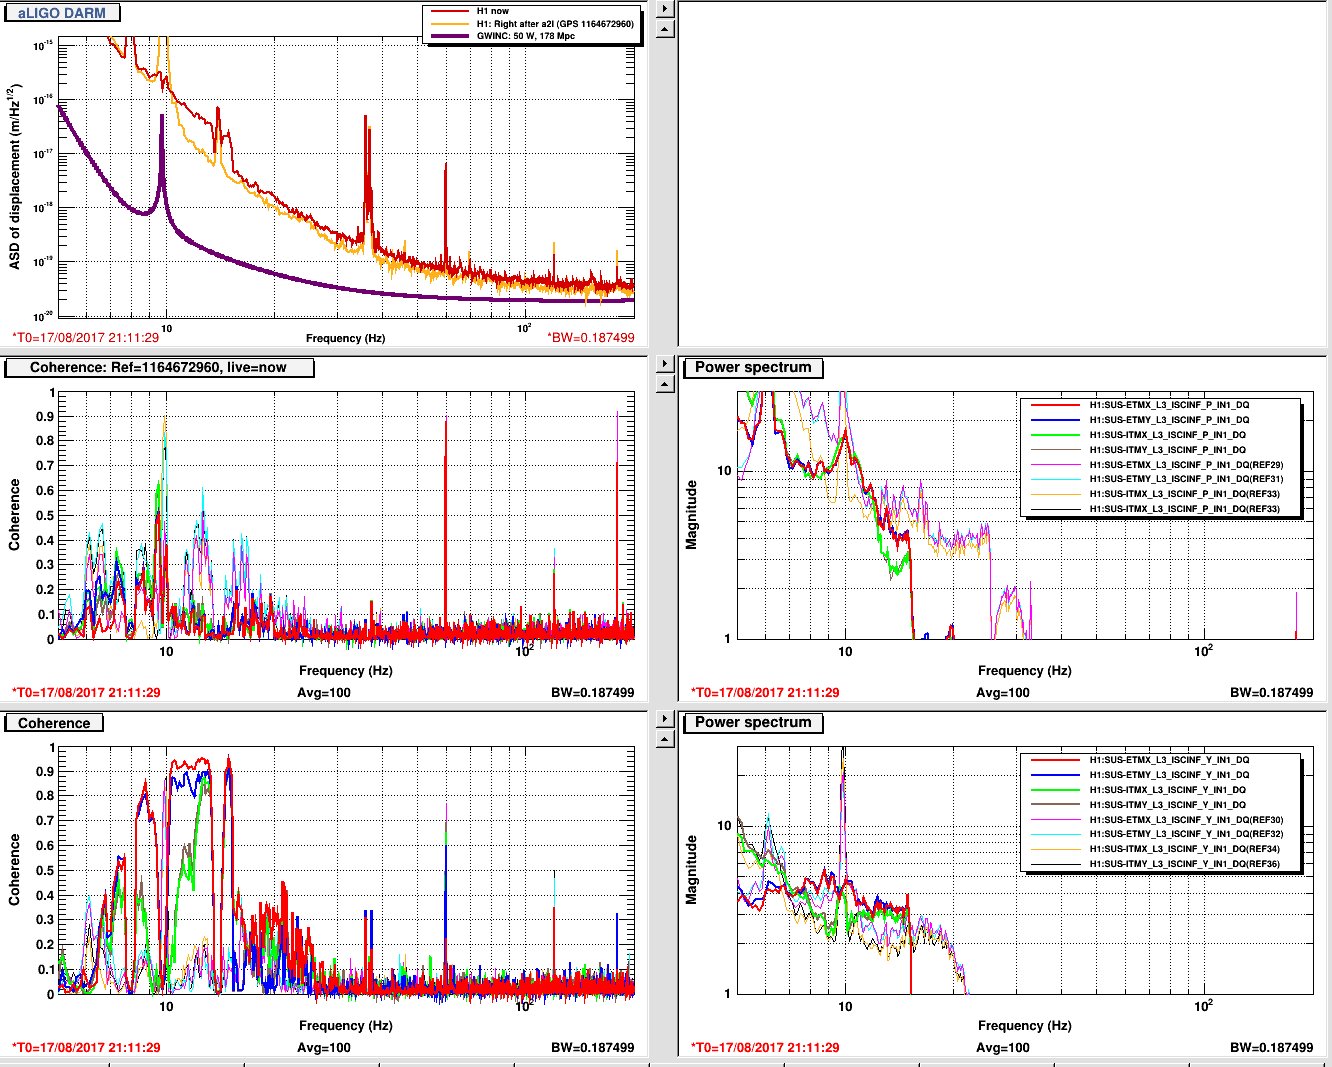
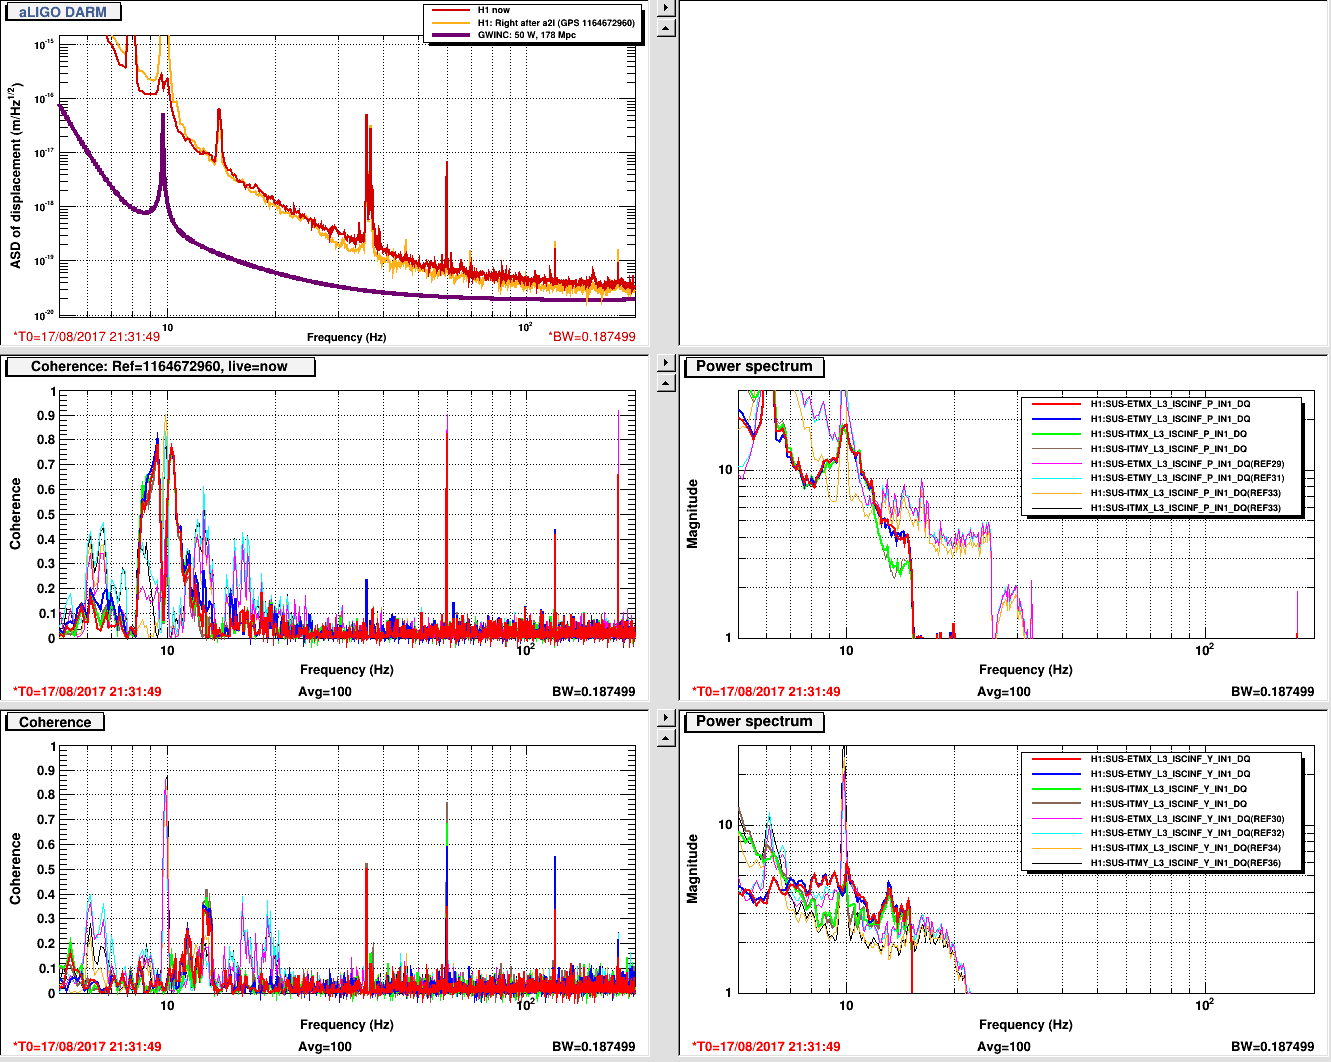
J. Kissel

I've checked the last suspensions for any sign of rubbing. Preliminary results look like "Nope."

The data has been committed to SUS repo here:
/ligo/svncommon/SusSVN/sus/trunk/HAUX/H1/IM1/SAGM1/Data/
2017-08-08_1629_H1SUSIM1_M1_WhiteNoise_L_0p01to50Hz.xml
2017-08-08_1629_H1SUSIM1_M1_WhiteNoise_P_0p01to50Hz.xml
2017-08-08_1629_H1SUSIM1_M1_WhiteNoise_Y_0p01to50Hz.xml

/ligo/svncommon/SusSVN/sus/trunk/HAUX/H1/IM2/SAGM1/Data/
2017-08-08_1714_H1SUSIM2_M1_WhiteNoise_L_0p01to50Hz.xml
2017-08-08_1714_H1SUSIM2_M1_WhiteNoise_P_0p01to50Hz.xml
2017-08-08_1714_H1SUSIM2_M1_WhiteNoise_Y_0p01to50Hz.xml

/ligo/svncommon/SusSVN/sus/trunk/HAUX/H1/IM3/SAGM1/Data/
2017-08-08_1719_H1SUSIM3_M1_WhiteNoise_L_0p01to50Hz.xml
2017-08-08_1719_H1SUSIM3_M1_WhiteNoise_P_0p01to50Hz.xml
2017-08-08_1719_H1SUSIM3_M1_WhiteNoise_Y_0p01to50Hz.xml

/ligo/svncommon/SusSVN/sus/trunk/HAUX/H1/IM4/SAGM1/Data/
2017-08-08_1741_H1SUSIM4_M1_WhiteNoise_L_0p01to50Hz.xml
2017-08-08_1741_H1SUSIM4_M1_WhiteNoise_P_0p01to50Hz.xml
2017-08-08_1741_H1SUSIM4_M1_WhiteNoise_Y_0p01to50Hz.xml

/ligo/svncommon/SusSVN/sus/trunk/HTTS/H1/OM1/SAGM1/Data/
2017-08-08_1544_H1SUSOM1_M1_WhiteNoise_L_0p01to50Hz.xml
2017-08-08_1544_H1SUSOM1_M1_WhiteNoise_P_0p01to50Hz.xml
2017-08-08_1544_H1SUSOM1_M1_WhiteNoise_Y_0p01to50Hz.xml

/ligo/svncommon/SusSVN/sus/trunk/HTTS/H1/OM2/SAGM1/Data/
2017-08-08_1546_H1SUSOM2_M1_WhiteNoise_L_0p01to50Hz.xml
2017-08-08_1546_H1SUSOM2_M1_WhiteNoise_P_0p01to50Hz.xml
2017-08-08_1546_H1SUSOM2_M1_WhiteNoise_Y_0p01to50Hz.xml

/ligo/svncommon/SusSVN/sus/trunk/HTTS/H1/OM3/SAGM1/Data/
2017-08-08_1625_H1SUSOM3_M1_WhiteNoise_L_0p01to50Hz.xml
2017-08-08_1625_H1SUSOM3_M1_WhiteNoise_P_0p01to50Hz.xml
2017-08-08_1625_H1SUSOM3_M1_WhiteNoise_Y_0p01to50Hz.xml

/ligo/svncommon/SusSVN/sus/trunk/HTTS/H1/RM1/SAGM1/Data/
2017-08-08_1516_H1SUSRM1_M1_WhiteNoise_L_0p01to50Hz.xml
2017-08-08_1516_H1SUSRM1_M1_WhiteNoise_P_0p01to50Hz.xml
2017-08-08_1516_H1SUSRM1_M1_WhiteNoise_Y_0p01to50Hz.xml

/ligo/svncommon/SusSVN/sus/trunk/HTTS/H1/RM2/SAGM1/Data/
2017-08-08_1520_H1SUSRM2_M1_WhiteNoise_L_0p01to50Hz.xml
2017-08-08_1520_H1SUSRM2_M1_WhiteNoise_P_0p01to50Hz.xml
2017-08-08_1520_H1SUSRM2_M1_WhiteNoise_Y_0p01to50Hz.xml

Will post results in due time, but my measurement processing / analysis / aLOGging queue is severely backed up.
J. Kissel

Process the IM1, IM2, and IM3 data from above. Unfortunately, it looks like I didn't actually save an IM4 Yaw transfer function, so I don't have plots for that suspension.

I can confirm that IM1, IM2, and IM3 do not look abnormal from their past measurements other than a scale factor gain. Recall that the IMs had their coil driver range reduced in Nov 2013 (see LHO aLOG 8758), but otherwise I can't explain the electronics gain drift, other than to suspect OSEM LED current decay, as has been seen to a much smaller degree in other larger suspension types.

Will try to get the last DOF of IM4 soon.
All HTTSs are clear of rubbing.

Attached are
- the individual measurements to show OSEM basis transfer function results,
- each suspensions transfer functions as a function of time
- all suspensions (plus an L1 RM) latest TFs just to show how they're all nicely the same (now)

Strangely, and positively, though RM2 has always shown an extra resonance in YAW (the last measurement was in 2014 after the HAM1 vent work described in LHO aLOG 9211), that extra resonance has now disappeared, and looks like every other HTTS. Weird, but at least a good weird!
J. Kissel

Still playing catch up -- I was finally able to retake IM4 Y. Processed data is attached. Still confused about scale factors, but the SUS is definitely not rubbing, and its frequency dependence looks exactly as it did 3 years ago.
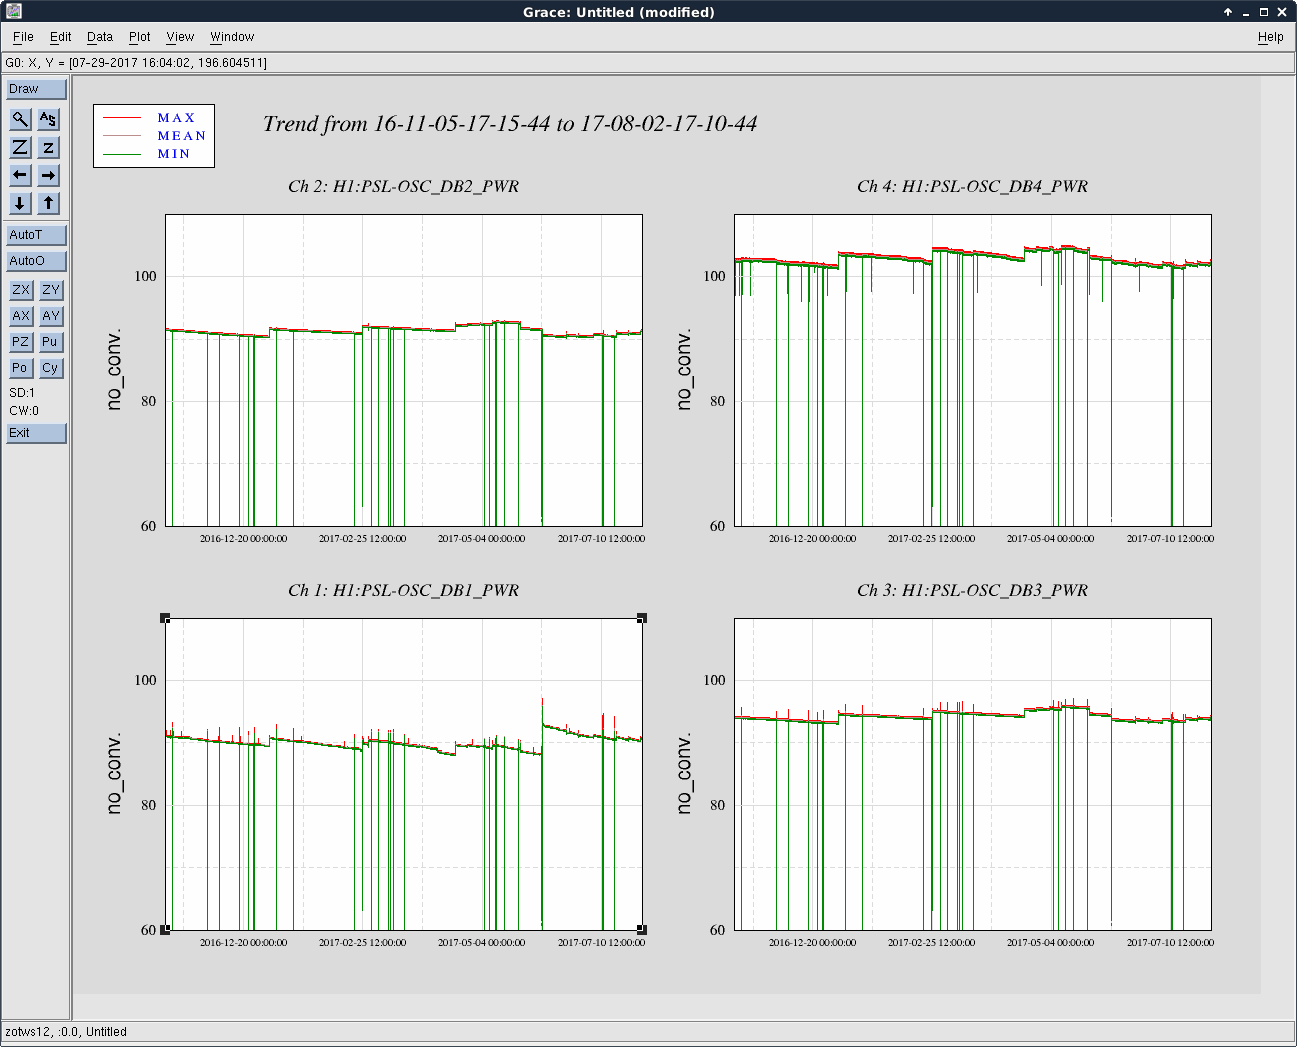
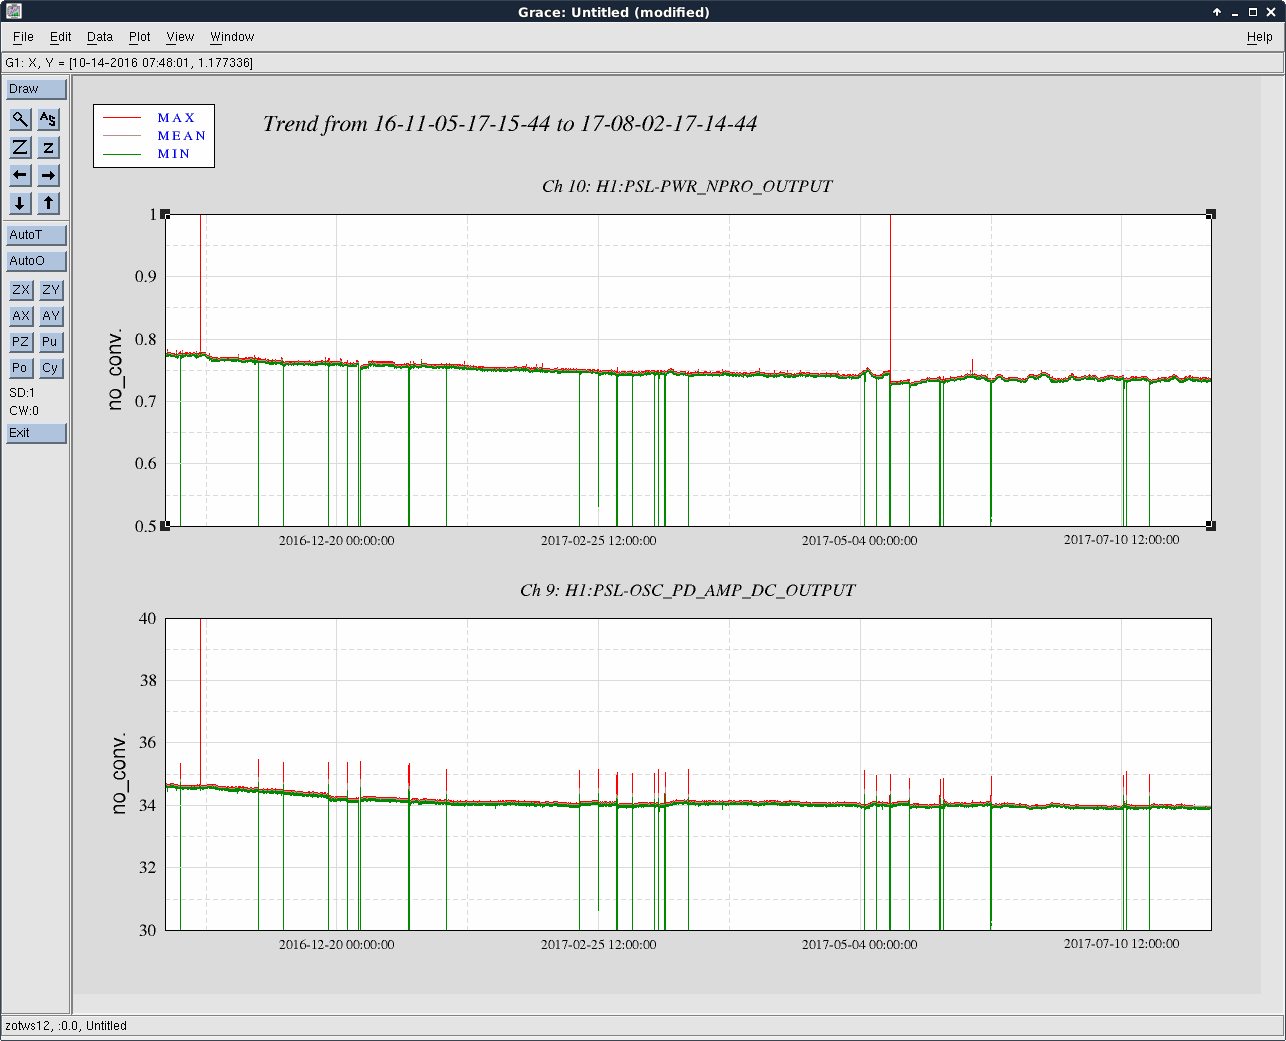
Attached are two 270-day trends of the HPO diode box powers (in relative %, first attachment) and the 35W FE and NPRO power (second attachment). Start date of the trends is 11-5-2016, roughly 3.5 weeks before the start of O2.
It is clear when we started adjusting the HPO diode box operating currents on 4-18-2017; previous to that date we were adjusting the currents on an as-needed basis. The large jump in H1:PSL-OSC_DB1_PWR near the end of the trend is when we swapped that diode box for a spare in early June. I was also going to include a trend of the HPO DB operating currents, but a read-back issue with DB3 makes this useless; the power supply reports an operating current to the PSL Beckhoff of 100 A, not the 52.3 A displayed on the front of the power supply (a power supply swap should fix this issue, planning for this as well after O2). In light of that I will make a plot similar to Matt's here and post it as a comment.
On the 2nd attachment, it is clear the drop in the FE power coincides with the drop in the NPRO power. This is an issue because we are currently unable to increase the FE power by adjusting the FE DB operating currents or temperatures; we suspect this is due to the low NPRO power. It should be noted that the calibration of H1:PSL-PWR_NPRO_OUTPUT is not correct; the NPRO output power was measured back in May to be 1.36 W. We will correct this when we swap our aging NPRO for a spare at the end of O2.
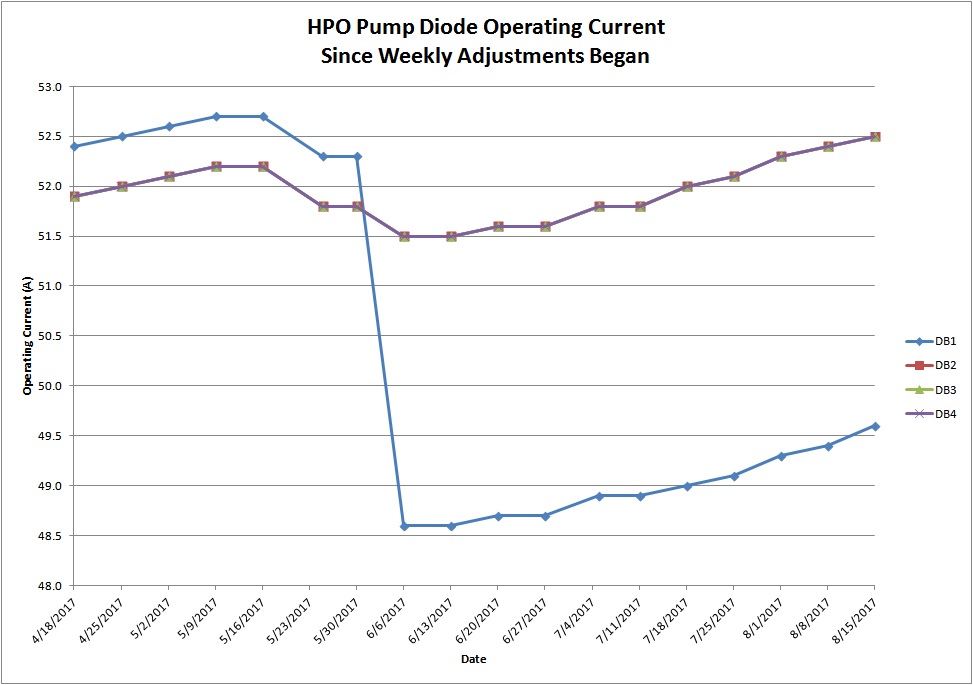
Attached is a graph of the HPO pump diode box operating current for the 4 HPO diode boxes. Graph starts on 4/18/2017, the date we started weekly adjustments of the operating current. The swap of DB1 is clearly seen on 6/6/2017. Since then the current increases have been linear, which we expect.


Not sure when it went away, but No longer have the "Seismon system not updating" message, and it looks like we've had a few earthquakes post since having the message earlier this morning. ("Keep Alive" continues to flash.)
There are a several ways Seismon can die, the keep alive only tells you about one of them. The diag_main test looks at the system time (what gps time the front thinks it is ( I think)). This clock stops under different conditions than the keep alive, but is also subject to temporary freezes, not sure of the cause. The diag main test looks for the seismon system time to be a minute or more out of sync with another front end ( I think LSC). There is also a light on the "compact" seismon screen that comes on if the difference is greater than 5 seconds, this should have been on when Corey looked, if he was looking at the compact screen.