[Sheila, Jenne, JeffK]
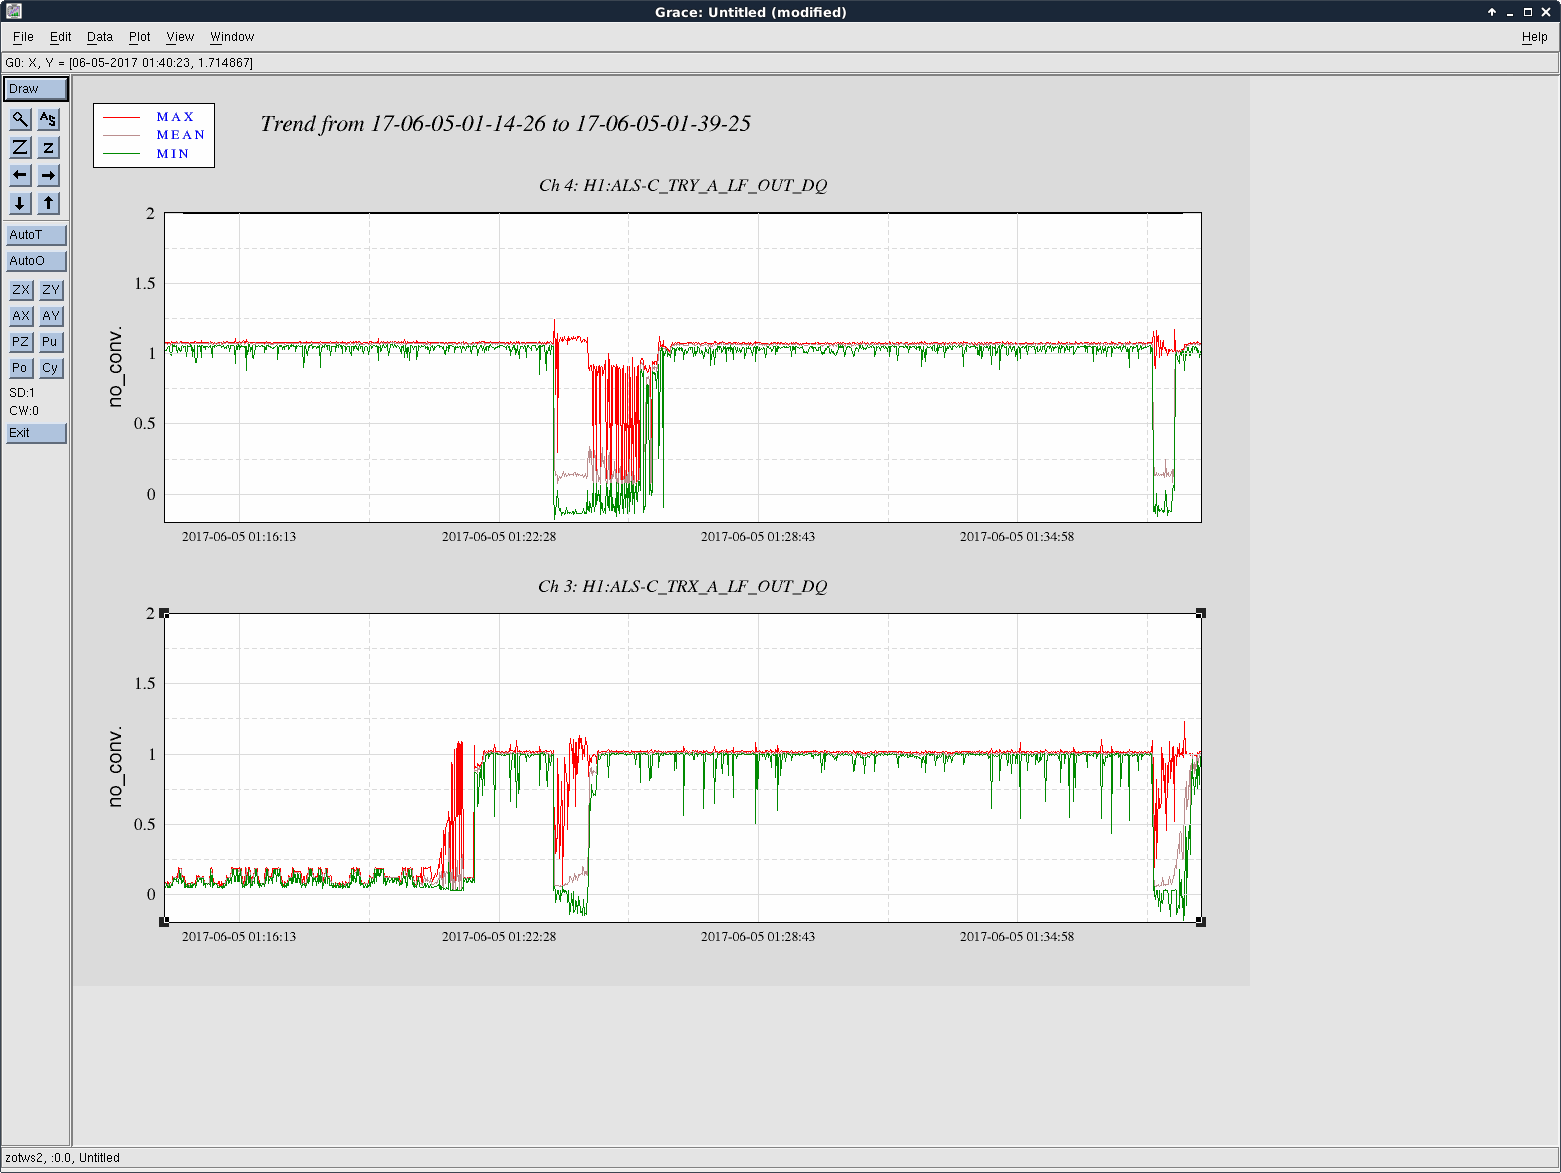
Frustratingly, we spent much of the day struggling to transition from ALS COMM to IR Trans. We dug through old alogs, we measured various loops and crossovers, and started figuring out a new order of operations for doing the transition, and then finally discovered that it just worked the original way when we forgot to load the guardian after coding in there our new-fangled sequence. Incredibly frustrating. Even half an hour or so before we were not able to do the original sequence and keep the lock. This is clearly something that we need to address eventually, but it's tricky if it seems to have just gone away. We've always had occasional locklosses around this transition and just trying again would work, so maybe if we solve the greater problem that plagued us this afternoon, we'd also solve that.
Anyhow, once we were able to get past the ALS->Trans handoff, we focused on trying to get the rest of the IFO up and working, since the problem seems to have mysteriously disappeared.
The first big lock we had, we let the guardian take us all the way to NomLowNoise. At first the new AS36 SRM ASC input matrix elements from alog 36578 seemed okay, but something was clearly funny since the control signal kept increasing even though the error signals were centered around zero - the zero point of the error signals was moving. That seemed to go away, and we had several minutes of nice lock. Then, in the last 2 minutes or so, the SRC ASC control signals got very large, and we lost lock before we could open those loops. So, re-doing the SRM ASC input matrix is back on the to-do list. The rest of the locks tonight we stayed on the dither loops for the SRM alignment.
The next 2 big locks were lost after the noise tunings state, with an oscillation that seems to originate in the INP1 ASC loops at a teeny bit over 1Hz. One of those locks we had skipped the 9MHz modulation depth reduction, and one we didn't, and we can stay indefinitely long on LownoiseESD_ETMY, so I think it's something in the Noise_Tunings state that is causing trouble. The 2nd of these two locks, when we did do the 9MHz reduction, we also saw oscillations in DHARD and MICH pitch. So, we need to figure out why we can't hold the lock, but it does not seem to be related to the CSOFT loop (ex. when I had the gain up too high, and we lost lock with a 2.75 Hz oscillation) or the dP/dTheta, since this is around 1Hz which is too high for that. Also, we don't see it in the CSOFT loop until much later than other loops.
We ran A2L - we ran it 3 times because ETMX was so far off that it needed help by hand to get close, otherwise it would have taken forever. I'll look at what this means for our spot positions tomorrow.
Jeff is writing a separate log post about all the CARM loop measurements taken tonight, since we still have lots of freq noise at high frequency. We're suspecting that we need to retune TCS, and perhaps that will help some of these other problems (at least SRM ASC)?
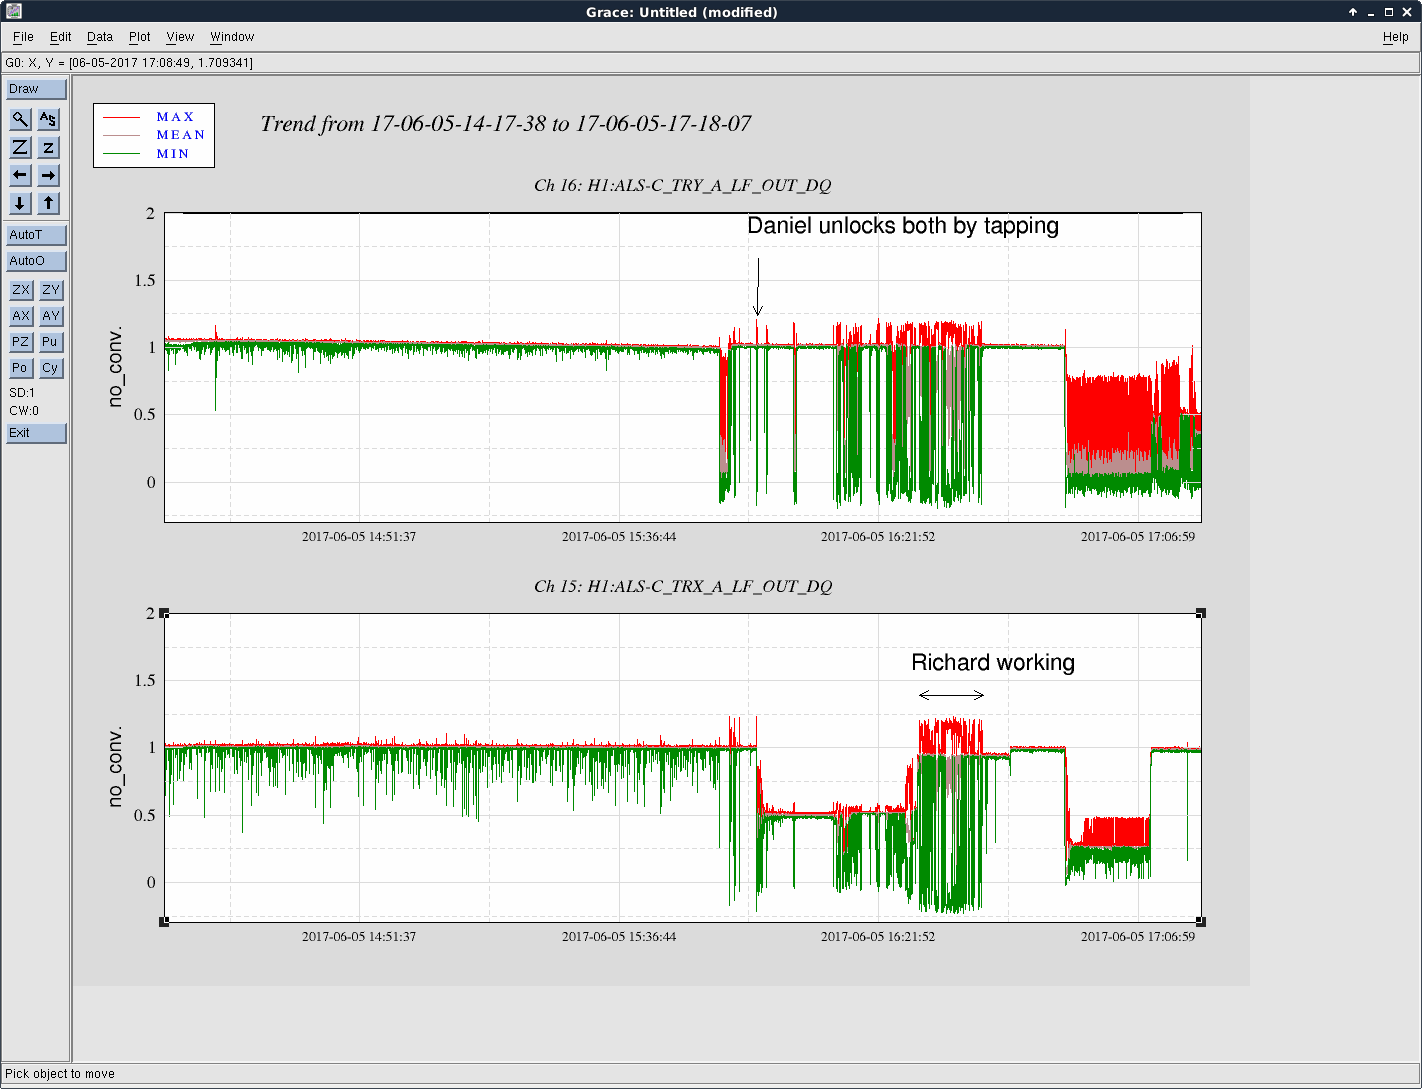
Sadly, after losing our 3rd big lock for the night, we seem to be back at having trouble doing the ALS->Trans CARM handoff :( . Sheila tried doing the nominal guardian state, but with an LSC-TR_CARM offset of -0.8, but we lost lock, so now we've gone back to the nominal guardian order, and we'll have to look into this further tomorrow. Actually, we tried again doing the order listed below by hand, but without the 16% gain matching and later reallocation, and we lost lock. So, either we need to include that gain, or this order doesn't actually work.
----------------------
Notes to self about the order for the ALS->Trans handoff that seemed to work (although it was probably just getting better on its own) :
* ALS-C_REFL_DC_BIAS lower than normal, 20 or 24 rather than nominal 28 (although the max gain we could use seemed to increase toward nominal as time went on......). Do not let LSC-REFLBIAS FM4 come on. FM6 still okay.
* LSC-TR_CARM offset to -1.0 rather than the nominal -0.5, to put us closer to IR resonance.
* Increase LSC-TR_CARM gain by 16% to make up the difference between gain of 24 and gain of 28, but putting the gain in front of the integrator in this series of 3 filter banks.
* Turn on LSC-REFLBIAS FM4.
* Jump to guardian's CARM_ON_TR state (skipping PREP_TR_CARM, which was just done by hand in a different order).
* Reallocate gain for rest of guardian states: LSC-TR_CARM back to nominal of 1 and ALS-C_REFL_DC_BIAS gain to nominal of 28.
* Allow guardian to go forward as normal.

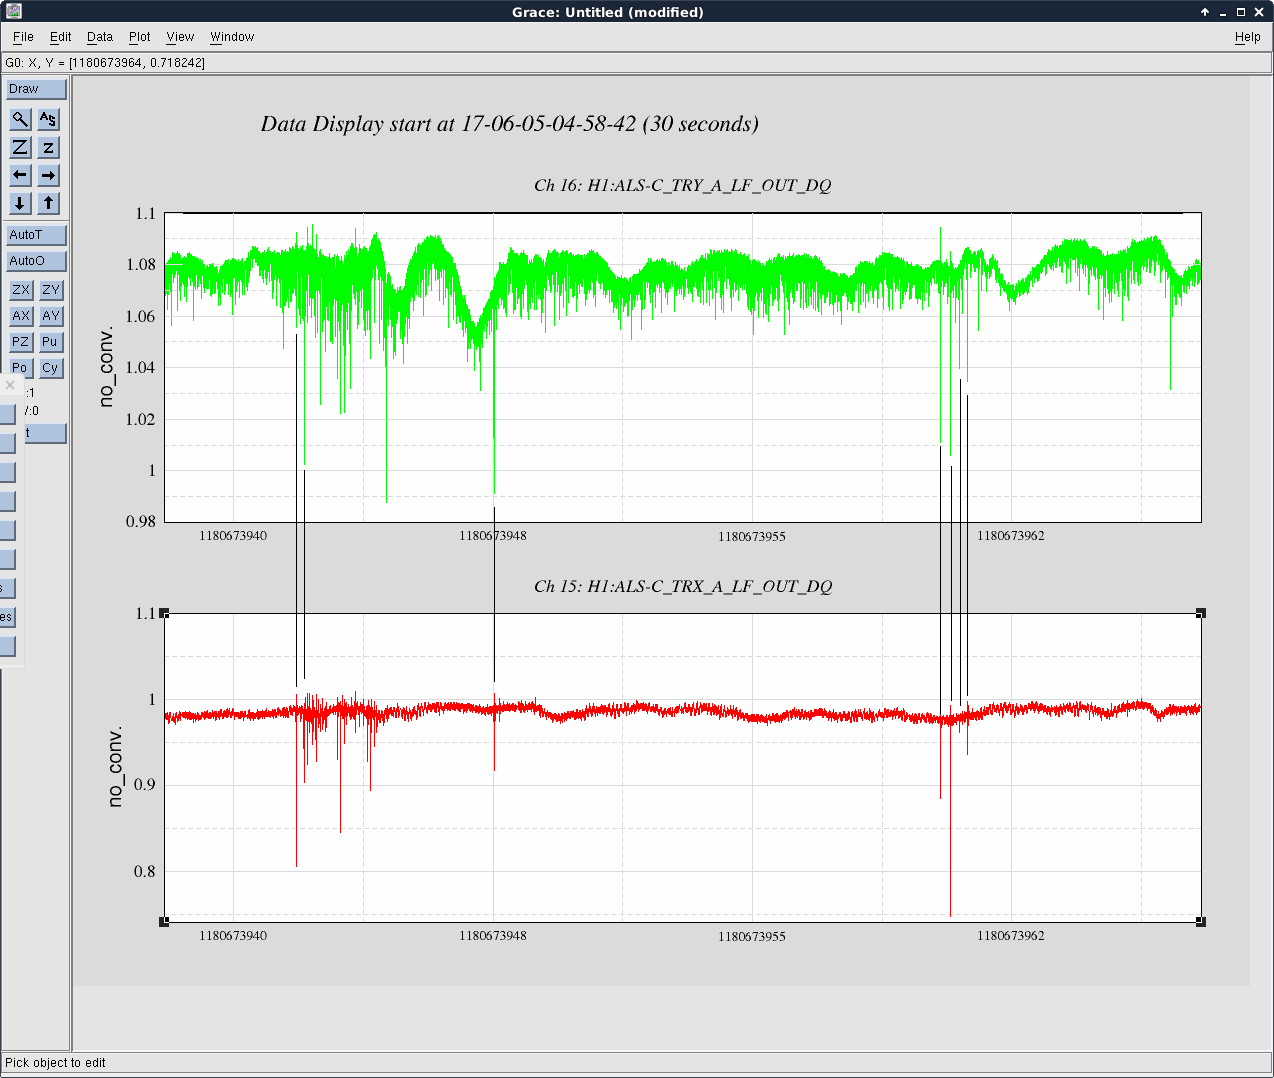
Here is a spectrum and some coherences from tonight's lock. The gold trace is from before the vent.