Displaying reports 56521-56540 of 82985.Go to page Start 2823 2824 2825 2826 2827 2828 2829 2830 2831 End
Reports until 02:09, Saturday 14 May 2016
H1 AOS (SEI, SUS)
cheryl.vorvick@LIGO.ORG - posted 02:09, Saturday 14 May 2016 (27196)
Optical Lever 7 Day Trends

Attached are 7 day pitch, yaw, and sum trends for all active H1 optical levers.

Images attached to this report
H1 General
cheryl.vorvick@LIGO.ORG - posted 01:48, Saturday 14 May 2016 (27195)
Ops Eve Summary:

State of H1: locked in Low Noise, with 68.4Mpc

Activities:

H1 ISC
sheila.dwyer@LIGO.ORG - posted 23:37, Friday 13 May 2016 - last comment - 23:38, Friday 13 May 2016(27192)
back to almost low noise

Sheila, Craig, Cheryl

Tonight we are stable at 25 Watts, without the ISS 3rd loop on and no SRM control.  The range is just below 70 Mpc, and the spectrum seems non stationary with lots of loud glitches which aren't due to anything much that we have been doing.  

There is a broad peak around 60Hz, which is not something I've seen before, Craig found there is coherence with LSC signals there.  As expected we have a lot of noise from CHARD below 30 Hz.  We decided to try blending with the transmon QPDs.  We started with a simple blend, two poles at 4 Hz for the refl WFS and a complimentary filter for the QPDs.  This reduced the noise (and the coherence) but we still need to improve this a bit, probably with a .  We simply used the combination of TMS QPDs that is orthogonal to what we are using for the soft loops, so we might be able to find a combination that has better SNR for CHARD than what we are currently using.  Once the coherence with CHARD yaw was reduced we have more coherence with pit, so blending this will probably be one of our next jobs.  The current settings are in the screenshot.

The IFO has been basically undisturbed since 6:05 UTC, but we aren't easily able to hit the intent button, maybe because of old excitations...  

Images attached to this report
Comments related to this report
craig.cahillane@LIGO.ORG - 23:38, Friday 13 May 2016 (27193)ISC
S. Dwyer, C. Cahillane

We took a reference spectrum before turning on the blending of the CHARD Y error signal and after. (Plot 1)  You can see where we win at about 20 Hz.
Now that we have damped CHARD yaw noise at low frequency, we have CHARD pitch noise...  

Also, Plot 2 shows coherence between MICH, PRCL, and SRCL to DARM, particularly around 60 Hz.  
Images attached to this comment
H1 ISC (IOO, PSL)
kiwamu.izumi@LIGO.ORG - posted 20:40, Friday 13 May 2016 - last comment - 13:37, Sunday 15 May 2016(27190)
ISS third loop closed

Evan, Kiwamu,

In this afternoon, we closed the ISS third loop which are meant to damp the arm power fluctuation.

We confirmed that it suppressed the common arm power fluctuation at around 0.5 Hz by 10 dB nominally. We tested this loop at various PSL power from 2 to 25 W. Further sophistication of the loop shape can be done if necessary.


[nominal settings]

[injection point changed]

The original plan was to inject the third loop signal to either TRANSFER1 or 2 input. However it turned out that they have seem to have a factor of 10 attenuation, we ran into a range issue where the DAC output and SR560 (which is meant as a dewthitening filter) saturated before getting to the nominal servo gain. We instead moved the injection point to the one for the second loop by disconnecting the second loop and plugging the third loop cable.

Also, there is a low-pass-ish response somewhere in the second loop injection path which let us put a lead filter in FM3.

[Instability at 25 W]

With a 25 W PSL, we see an instability that occured at 0.24 Hz. Similarly to the usual arm power instability at 0.4 - 0.5 Hz, it modulated the arm power, but the frequency seems to be a bit low and it coupled to the HARD mode. This instability seems to happen regardless of whether the third loop is closed or not. A possible source might be an unstable ASC loop. Currently  under investigation.

Images attached to this report
Comments related to this report
evan.hall@LIGO.ORG - 13:37, Sunday 15 May 2016 (27200)

The third loop signal now goes through an SR560 with an inversion, so the gain should now be +0.04 in the filter module.

H1 FMP
bubba.gateley@LIGO.ORG - posted 18:18, Friday 13 May 2016 - last comment - 19:30, Friday 13 May 2016(27187)
Chilled water pump at End Y tripped
I just received a call from Cheryl in the control room saying the chilled water pump at EY was in alarm. I looked at the screen and chilled water pump #1 had tripped. I started pump 2.
Comments related to this report
bubba.gateley@LIGO.ORG - 19:17, Friday 13 May 2016 (27188)
Chilled water pump 2 did not appear to allow the chiller to start so I cleared the fault on pump 1 and restarted pump 1. The water temperature is now falling. I will continue to monitor.
cheryl.vorvick@LIGO.ORG - 19:30, Friday 13 May 2016 (27189)

00:51:52UTC - pump 1 shuts off, temperatures climb

01:13:24UTC - pump 2 turned on, temperatures take a small dip, but continue to climb

02:03:32UTC - pump 1 turned on again, temperatures for chilled water start to fall

02:15:35UTC - EY VEA temperature starts to fall, after reaching a peak of 69.5F, from an average of 68F

02:27:15UTC - EY VEA temperature reaches 68.1F, and chilled water supply/return have leveled out at 43F/48FF

LHO General
corey.gray@LIGO.ORG - posted 16:04, Friday 13 May 2016 (27164)
DAY Ops Summary

Summary:

Jason worked on the PSL DBB in the morning and various commissioning activities have been going on during the day.  Have had it at DC Read Out for last few hours during the afternoon for ISS work.

If winds pick up, Jim asked Commissioners to give him a call to take the End Station ISIs to a certain state.

H1 Locking Notes:

After a lockloss, there were some FSS issues (resolved by toggling Autolocker).  Kiwamu also noticed an oscillation with the ISS Diffracted Power (on the plot on the ISS medm, the max/min/mean signals are all separated from each other by quite a bit).  To remedy this,

Day's Activities

H1 CDS (CAL, CDS)
keita.kawabe@LIGO.ORG - posted 15:36, Friday 13 May 2016 (27185)
duotone timing script changed to accomodate the new iop 4x downsampling filter of RCG3.0.X

Since the new 64k to 16k decimation filter of RCG3.0.X has about 12us smaller delay for duotone, I changed two duotone scripts:

/ligo/svncommon/CalSVN/aligocalibration/trunk/Common/MatlabTools/timing/scienceFrameDuotone.m and scienceFrameDuotoneStat.m.

If you specify gps time larger than 1144501217 (Apr/12/2016 13:00:00 UTC) for L1, or 1146322817 (May/03/2016 15:00:00 UTC) for H1, the new decimation filter is used to assess the expected delay in ADC.

For O1 data (first attachment), the old scripts (left) and the new one (right) generate the same results except a negligible offset of 0.047us (first attachment). The difference comes from the fact that the decimation delay was hard coded in the old script.

I also confirmed that the scripts generate correct timing information that is consistent with that of O1 (second attachment right).

Images attached to this report
H1 ISC
ross.kennedy@LIGO.ORG - posted 15:22, Friday 13 May 2016 (27153)
Tracking mecahnical modes for PI control

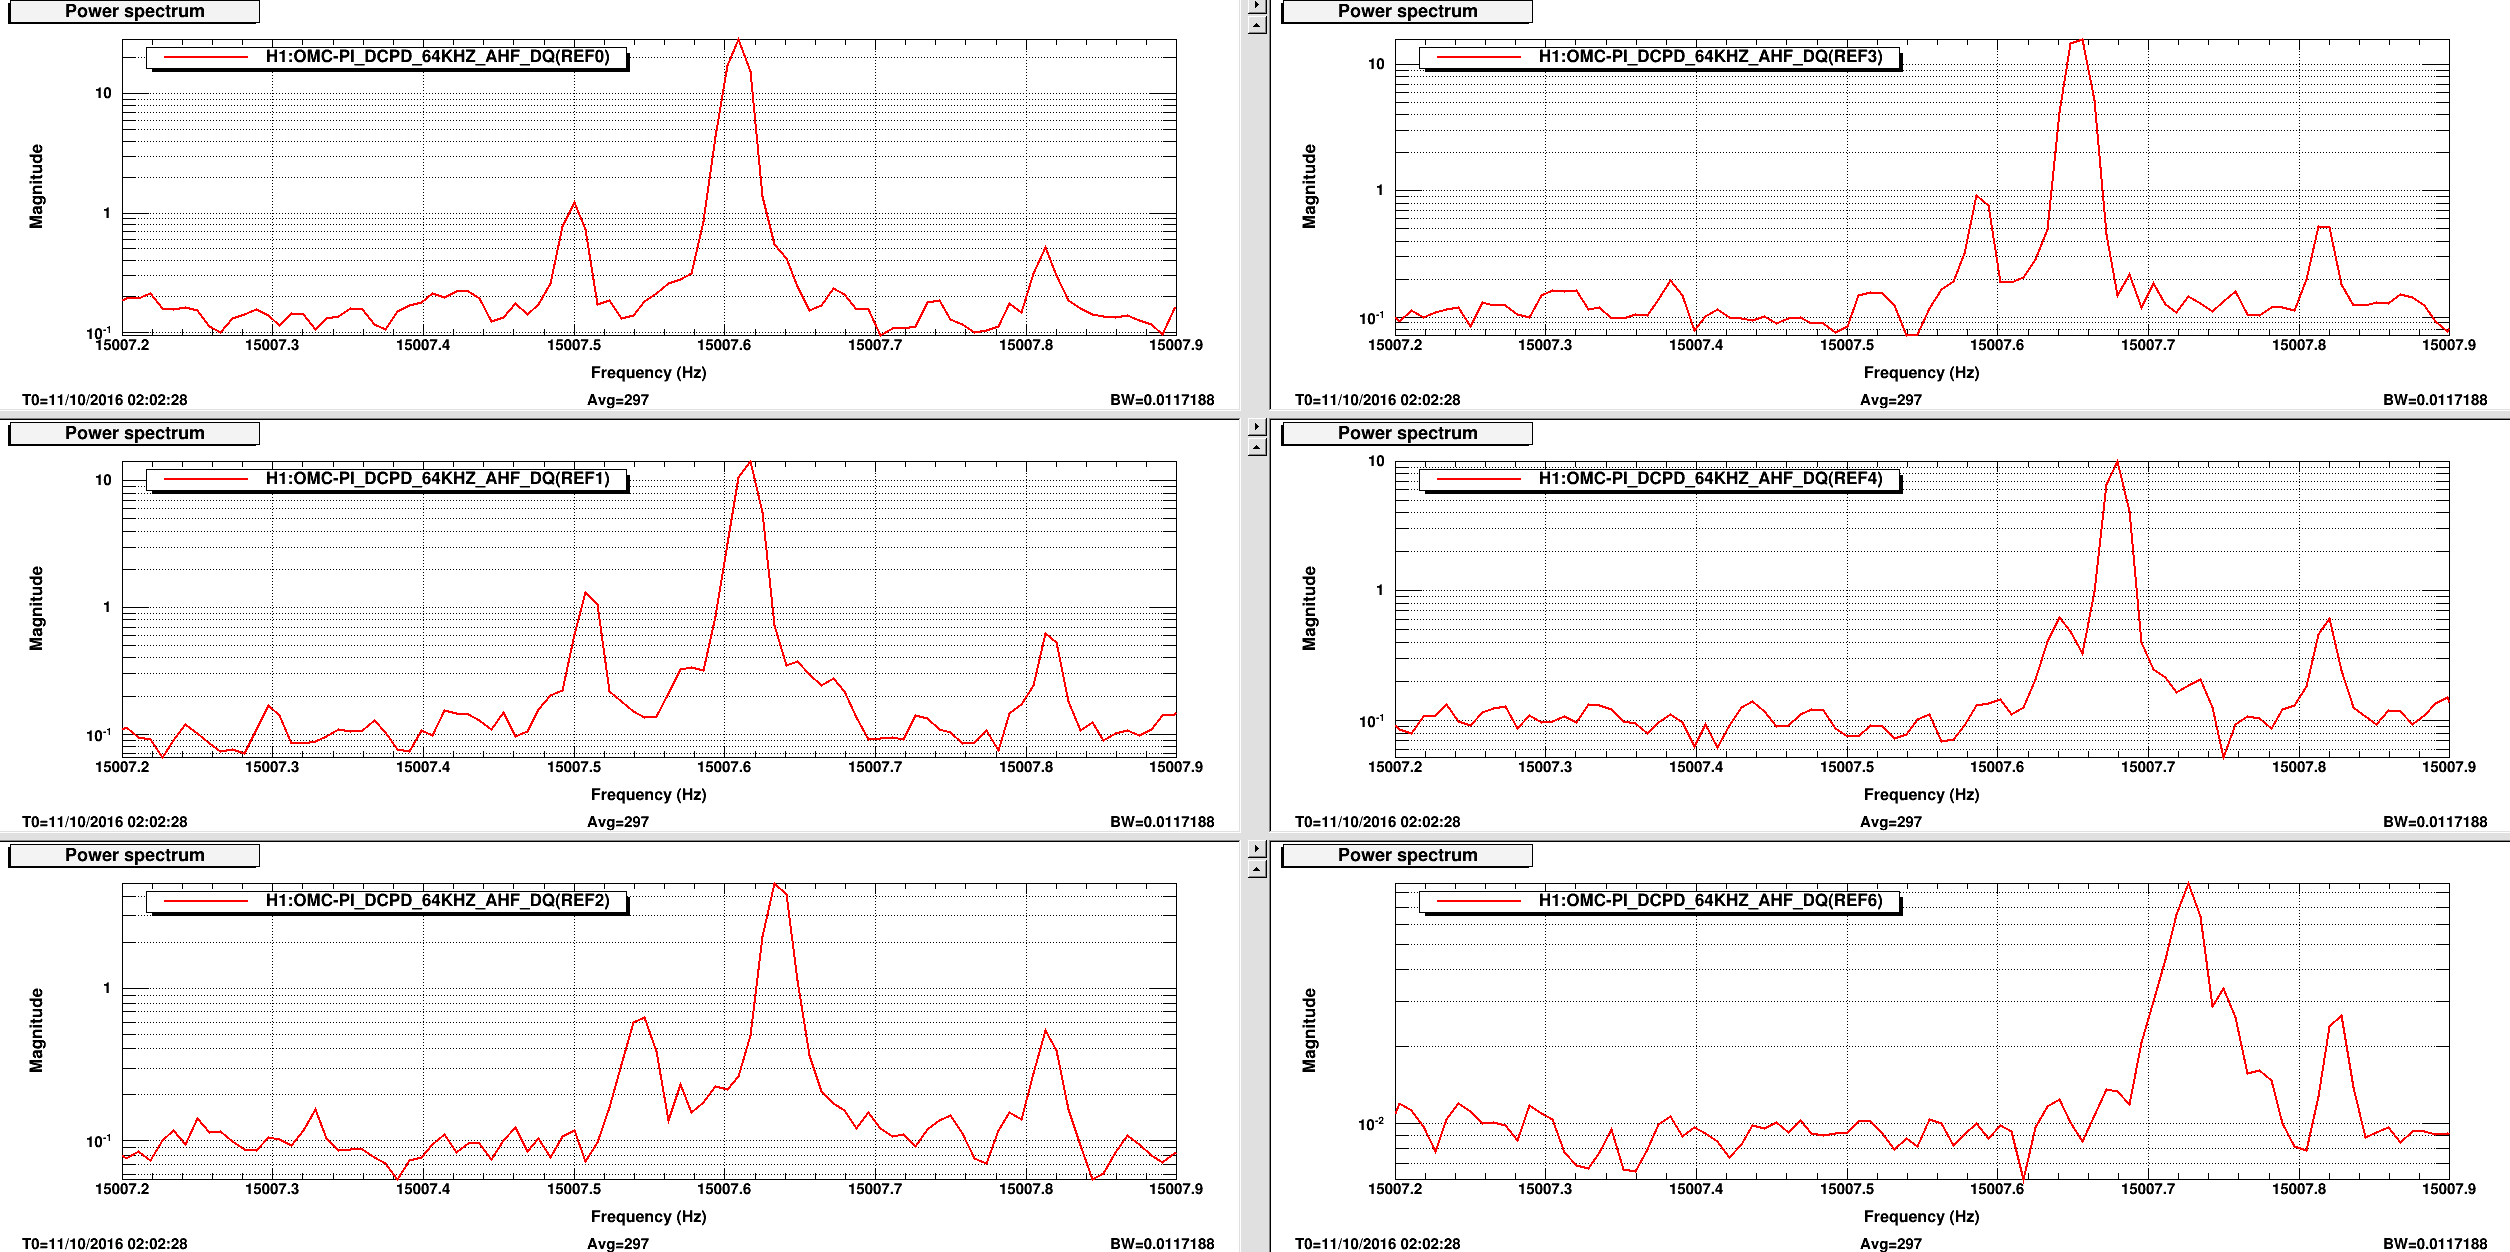
Ross, Tega 

We have been using the new h1omcpi and h1susetmxpi models to look at mechanical modes  in OMC DCPD which should be related to parmatetric instabilities. Only the OMC DCPDA is used as subtracting the A and B signals seemed to remove the lines from our spectrum i.e. they must be completely in phase with each other. This signal is being used instead of the QPD transmission signal as it has a much higher SNR for these modes.

Starting in the 64kHz h1omcpi model, the signal (H1:OMC-PI_DOWNCONV_DEMOD_SIG_IN1) is first down converted to DC using a local oscillator set at the frequency of the particular mechanical mode. The I and Q phase signals are then passed via PCIE to the 16kHz h1omc model where they are low passed with a 64Hz corner frequency, multiplexed and sent across to the 16kHz h1pemex model using RFM. The signals are then demuxed and sent to the 64kHz h1susetmxpi model. At this point these signals are low passed again to avoid imaging  and then upconverted back to the frequency of the mode. The I and Q phase signals are then summed which effectively leaves the original signal with a bandpass due to the lowpassed signal being upconverted (H1:SUS-ETMX_PI_OMC_UC1). We are then able to use our linetracking tool iwave to track the particular line you are interested in (H1:SUS-ETMX_PI_MODE_OUT). 

This was process was used to track a selection of lines around 15000 Hz which should be related to some of the mechanical modes. The hope is that we can now use the iwave tracked signals to damp these modes using ESD assuming we know what lines relate to each test mass. 

Images attached to this report
H1 ISC
nutsinee.kijbunchoo@LIGO.ORG - posted 15:06, Friday 13 May 2016 - last comment - 16:03, Monday 16 May 2016(27183)
PSL power precisions measurement

Quick conclusion:

Bad news: The further away the rotation stage has to travel, the less accurate the measured requested power becomes.

Good news: The uncertainty is within 1-3%.


Slightly more details:

Images attached to this report
Comments related to this report
nutsinee.kijbunchoo@LIGO.ORG - 16:03, Monday 16 May 2016 (27229)

A little further investigation shows that the power deviation during the second set of measurements started at 58th measurement where 19 W jumped to nearly 20 W and 54 W jumped to 56 W (first attachment). This jump did not correspond to the measured angles which stayed consistant throughout the measurement (second attachment). Third attachment shows the histogram of power of the first set of measurement (going back and forth between 0W and 3W) that didn't appear to have any power jump.

Images attached to this comment
LHO VE
chandra.romel@LIGO.ORG - posted 14:20, Friday 13 May 2016 - last comment - 17:49, Friday 13 May 2016(27182)
CP 5 & 6 PIDs
Richard changed PID settings on CP 5 & 6 today. Current settings:

CP5
Gain: 7
Integral: 460
Set Pt: 90

CP6
Gain: 6
Integral: 360
Set Pt: 88

Set points are set lower than nominal 92% so PID experiments can continue Monday.
Comments related to this report
chandra.romel@LIGO.ORG - 17:49, Friday 13 May 2016 (27186)
Liquid levels of CP 5 & 6 have settled to the set points.
Images attached to this comment
LHO VE
chandra.romel@LIGO.ORG - posted 14:15, Friday 13 May 2016 - last comment - 09:22, Monday 16 May 2016(27181)
CP3 overfill
1:30pm local

1/2 turn open on LLCV bypass --> took 33:17 min. to overfill CP3. 

Raised LLCV from 20% to 21%.
Comments related to this report
chandra.romel@LIGO.ORG - 09:22, Monday 16 May 2016 (27211)
Temp induced
Images attached to this comment
chandra.romel@LIGO.ORG - 08:05, Saturday 14 May 2016 (27197)
CP3 Dewar is being filled this Tuesday so LLCV may need to be lowered again.
H1 CAL (CAL, ISC, SUS)
darkhan.tuyenbayev@LIGO.ORG - posted 13:37, Friday 13 May 2016 - last comment - 14:49, Tuesday 17 May 2016(27180)
SUS ETMY L2 and L3 stages compensation filters updated with measured zeros and poles

Kiwamu, Darkhan,

We updated the ETMY L1 stage (UIM) compensation filters FM2, FM3, FM4, FM7, FM8, FM9 of ETMY_L1_ESDOUTF_{UL,LL,UR,LR} with zeros and poles more accurately fitted to the most recent measurements by Jeff K. from ER8 (LHO alogs 20846, 21283). We have not updated the acquisition circuit zero-pole pair, because the measurements do not include the response of this circuit (for details see LHO alog 21142).

We've also updated the ETMY L2 stage (PUM) compenstation filters FM1, FM2, FM3, FM6, FM7, FM8 of ETMY_L2_ESDOUTF_{UL,LL,UR,LR} to their fitted values (LHO alogs 20846, 21232).

Python scritps were used to load new vailes into the Foton file, the scripts are based on Kiwamu's script for updating filter in the L3 stage (ESD) (LHO alog 27150). The scripts are committed to CalSVN at

Runs/PreER9/H1/Scripts/SUS/setH1SUSETMY_UIMDriver_compensations.py
Runs/PreER9/H1/Scripts/SUS/setH1SUSETMY_PUMDriver_compensations.py

Notes for CAL FOLKS:

Comments related to this report
jeffrey.kissel@LIGO.ORG - 14:49, Tuesday 17 May 2016 (27246)
J. Kissel, K. Izumi, D. Barker

Dave noticed that these changes to the foton filter file never were pushed to the H1SUSETMY front-end with a LOAD COEFFICIENTS, so we 've loaded them just now.

While at it, we've made the necessary update to the CAL-CS actuation compensation, which involved simply turning OFF (and subsequently deleting to avoid future confusion) FM6 of the H1:CAL-CS_DARM_ANALOG_ETMY_L2 and H1:CAL-CS_DARM_ANALOG_ETMY_L3 filter banks called "mis_coil" that were originally installed before O1 (see LHO aLOG 21275).
H1 TCS (ISC, TCS)
aidan.brooks@LIGO.ORG - posted 13:00, Friday 13 May 2016 (27179)
TCS simulation code agrees very nicely with HWS-X measurement of self-absorption. HWS-Y, still very noisy

I checked the output of the HWS vs the expected thermal lens from the online simulation code. The results are posted below. As you can see the time series agree very well with each other, certainly within the error bars of the HWS measurement ... at least just looking in dataviewer. (I rescaled the time series from diopters into micro-diopters and reset the HWS value to match the SIM value at t=0).

The HWS measurement is double-passed through the lens and while the simulation predicts the single-pass value: hence a factor of 2 difference between them.

The HWSY data is extremely noisy and shows almost no correlation with the simluation data.

Images attached to this report
H1 SUS
sheila.dwyer@LIGO.ORG - posted 00:16, Friday 13 May 2016 - last comment - 15:45, Monday 16 May 2016(27158)
coil driver switching causing locklosses

It looks like we need to do something about the triple coil drivers that we switch in lock, especially PRM M3.  We have lost lock a good fraction of the times that we have tried to switch in the last month or so.  Screenshot is attached, I also filed an FRS ticket hoping that someone might make an attempt to tune the delays while people are in the PSL tomorrow morning.  FRS ticket #5489 

Images attached to this report
Comments related to this report
rana.adhikari@LIGO.ORG - 12:17, Friday 13 May 2016 (27178)ISC, Lockloss

Is the DAC spectrum post-switch using up a large fraction of the range? If the noise in the PRC loop has change a little bit it could make this transition less risky.

sheila.dwyer@LIGO.ORG - 12:25, Saturday 14 May 2016 (27198)

Here's the PRM drive from last night's lock, in which we just skipped the PRM M3 BIO switching leaving the low pass off (BIO state 1). It seems like we should have plenty of room to turn the low pass on without saturating the DAQ.  

Images attached to this comment
jeffrey.kissel@LIGO.ORG - 15:45, Monday 16 May 2016 (27226)
FRS Ticket #5489 closed in favor of a long-term fix Integration Issue #5506 (which is now also in the FRS system) and for an eventual ECR. Work permit #5880 indicates we'll install the fix tomorrow. See LHO aLOG 27223.
H1 CAL (CAL)
craig.cahillane@LIGO.ORG - posted 18:47, Thursday 12 May 2016 - last comment - 16:49, Friday 13 May 2016(27154)
Calibration Kappa Covariance Triangle Plots
C. Cahillane

I have generated corner plots of the time-dependent kappas to check their covariance.

There are six kappa values: 
1) Kappa_tst Mag
2) Kappa_tst Phase [Rads]
3) Kappa_pu Mag
4) Kappa_pu Phase [Rads]
5) Kappa_C
6) Cavity Pole F_CC

We do get some values of covariance that are comparable with variance... However, all values, including variance, are sub-percent.  
I anticipate that if propagated into the uncertainty budget, all covariant terms would be negligible.  We cannot be sure, however, without doing the work.

For the LLO Kappa Triangle Plots, please see LLO aLOG 26134
Images attached to this report
Comments related to this report
jeffrey.kissel@LIGO.ORG - 16:49, Friday 13 May 2016 (27184)
J. Kissel, C. Cahillane

A couple of notes from a discussion between Craig and I about these results:
(1) The "Var" and "Covar" results reported on the plots are actually the square root of the respective element in the covariance matrix, multiplied by the sign of the element. Thus the reported "Var" and "Covar" value is directly comparable to the uncertainty typically reported, but the off-diagonal elements retain the sign information of the covariance.

(2) Lest ye be confused -- the (co)variances (which are actually uncertainty values) are report at the *top* of each sub-plot, and the upper most variance value (for |k_TST|) is cut off. The value is 0.00234.

(3) In order to compute the statistical uncertainty of these time-dependent systematic errors for the C02 uncertainty, Craig computed a running median (where the width of the median range was 50, once-a-minute data points; +/- 25 points surrounding the given time's data point) over the entire O1 time series, subtracted that median from every given data point, and took the standard deviation of residual time-series assuming that what remains is representative of the Guassian noise on the measurement. See original results in LHO aLOG 26580, though that log reports a range of 100 (+/- 50) once-a-minute points which has since been changed to the above-mentioned +/- 25 points for a more physical time-scale (but only changes the results at the 5% of the reported already ~0.3-0.5% uncertainty, i.e. the reported relative uncertainty of 0.002 change by 0.00005).

For these plots, where he went a step further and computed the full covariance matrix on all time-dependent factors in order to address the question "is there any covariance between the statistical uncertainties, given that they're computed using -- in some cases -- the same calibration line?"). In doing so, he'd first taken the exact same median-removed time-series for each time-dependent factor, but found that the data set (i.e. the 2D and 1D histograms) was artificially biased around zero. We know now this was because, often, the median *was* the given time's value and residual was zero. Thus, instead, he recomputed the running median, disallowing the given time's value to be used in the median calculation. Graphically,

    x   x x     x         x           x  x 
      x    x x    x   x      x x  x    x   x
         x     x x      x  x     x  x      x x 
        [------------\_/-------------]
  x   Raw data      
 \_/  Given time's central value to which a median will be assigned and subtracted.  
[---] Median Window

As one can see in his attached plots, that successfully de-biases the histogram.


(4) The following time-dependent systematic error uncertainties *are* indeed covariant:
    (a) kappa_TST with kappa_PU (in magnitude and phase) -- the actuation strength of the PUM and TST mass stages.
    (b) kappa_C with f_cc -- the IFO optical gain and cavity pole frequency

    We know and expect (b), as has been shown in Evan's note T1500533. What's more is that it's *negatively covariant, so what estimation of the uncertainty we have thus far been making -- ignoring the covariant terms -- is actually an over estimate, and all is "OK."

    We also expect (a), because of how the two terms are calculated (see T1500377) and because they're also calculated from the same pair of lines. Sadly, we see that sqrt(covariance) is *positive* and of comparable amplitude to the sqrt(variance). But -- said at little more strongly than Craig suggests -- for these terms that have positive covariance comparable to the variance, the absolute value of both variance and covariance corresponds to an uncertainty (i.e. sqrt(variance)) on the 0.3-0.5% level, which is much smaller than other dominant terms in the uncertainty, as can be seen for example in pgs 3 and 4 of the attachment "05-Jan-2016_LHO_Strain_Uncertainty_C03_All_Plots.pdf" in LHO aLOG 24709. 

As such, we deem it sufficient to continue to ignore all covariant terms in the statistical uncertainty of these time-dependent parameters because they're either negative or, where positive, contribute a negligible amount to the overall statistical uncertainty budget compared with other, static statistical uncertainty terms.


Displaying reports 56521-56540 of 82985.Go to page Start 2823 2824 2825 2826 2827 2828 2829 2830 2831 End