jeffrey.bartlett@LIGO.ORG - posted 10:53, Friday 02 December 2016 (32104)
PSL Dust Alarms
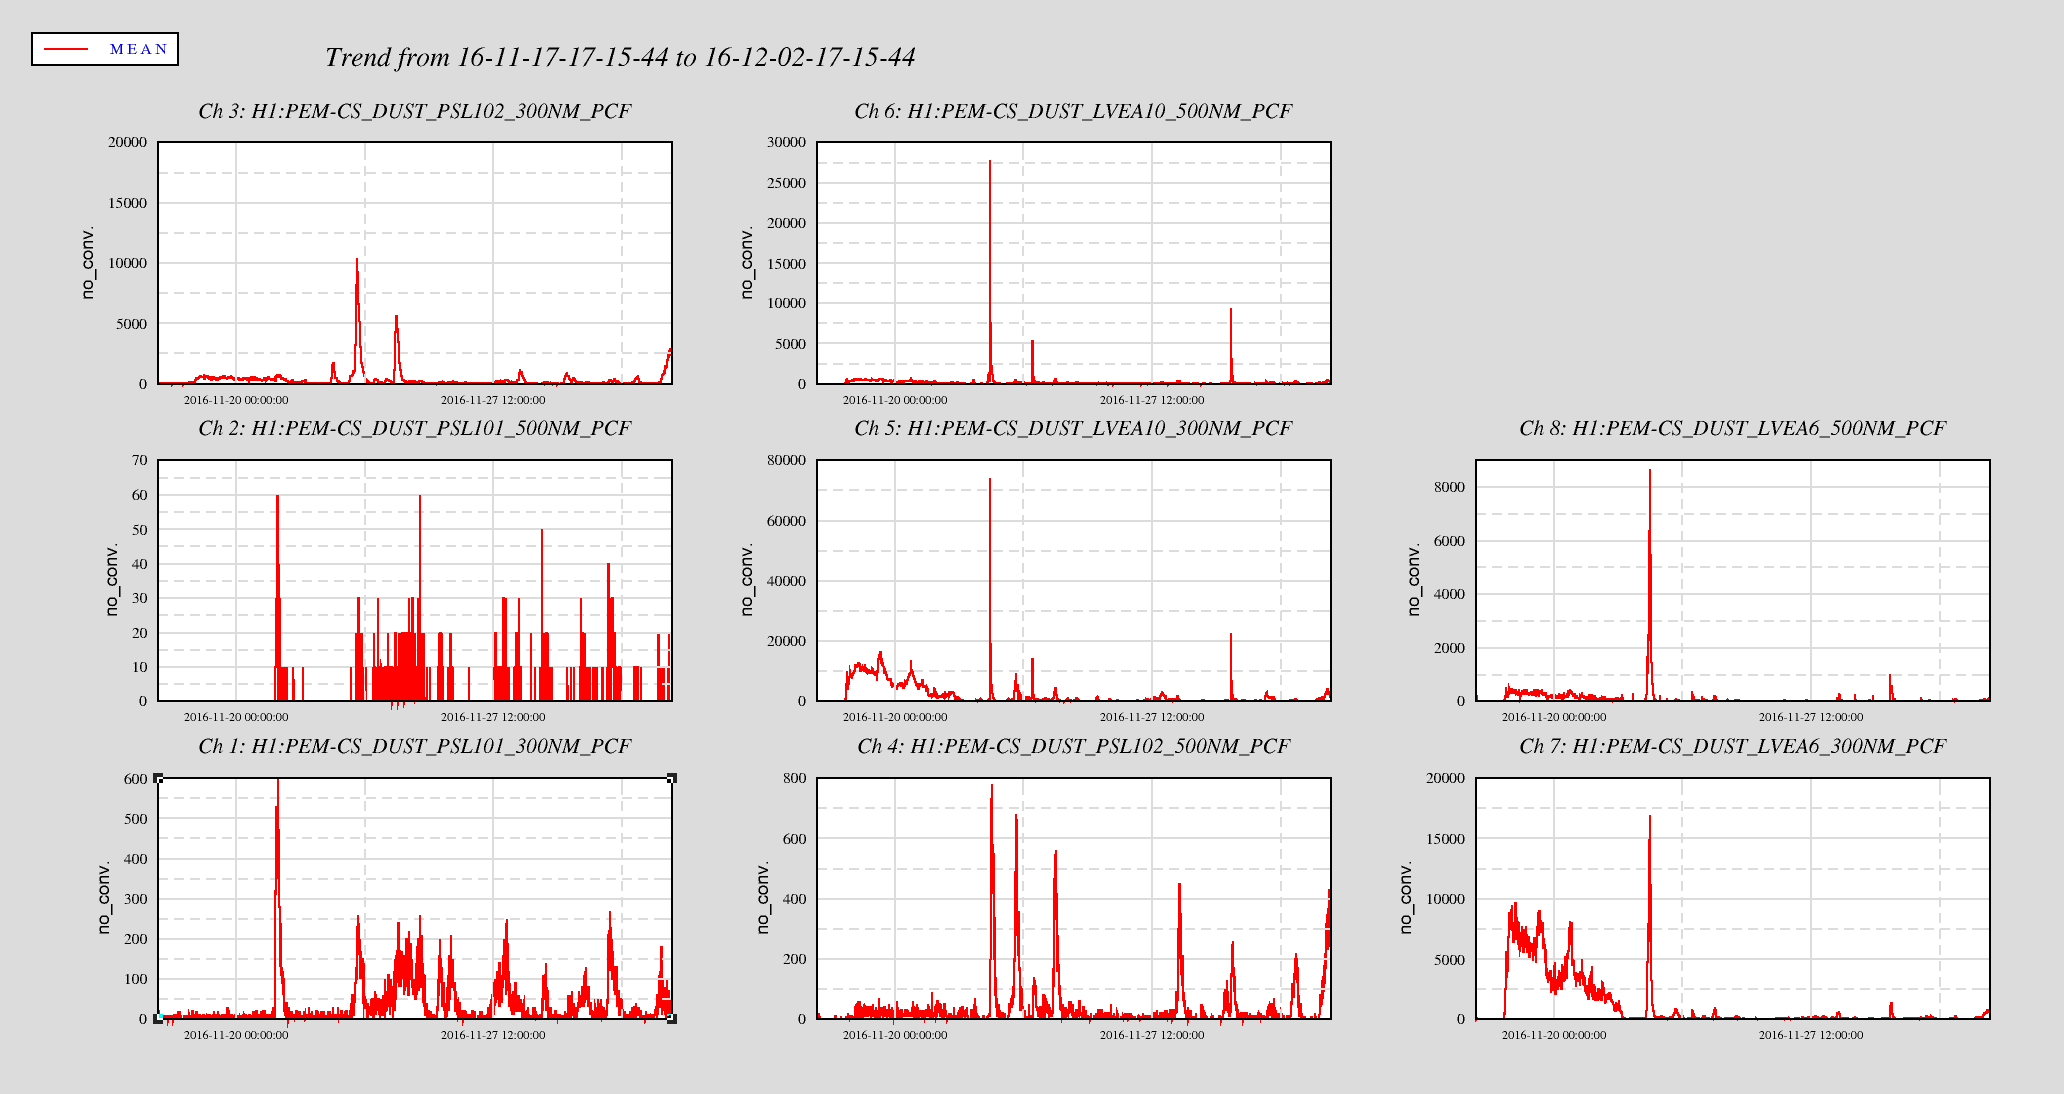
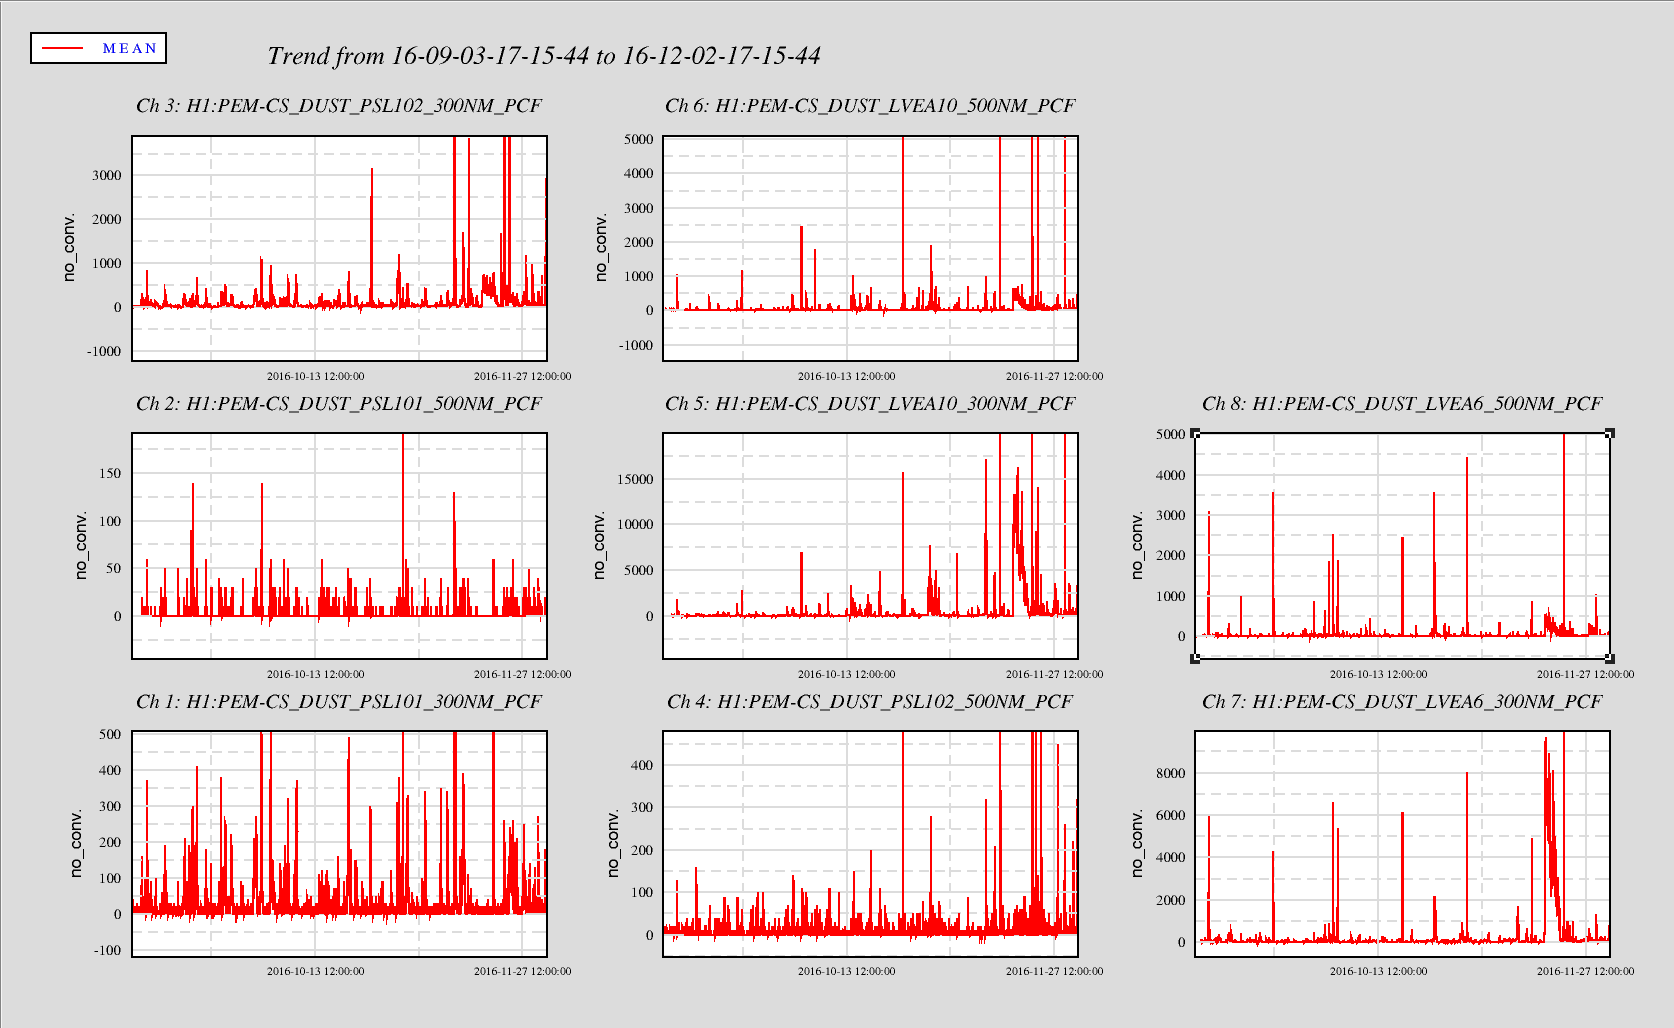
   Ops has been seeing high dust count alarms in the PSL. Trended the PSL and LVEA dust monitors for 15 and 90 days. The trends show constant major alarm dust levels in the PSL enclosure (Monitor PSL101) in the 0.3u particles and several 0.5u alarm level events. This trend holds for the PSL Anti-Room (PSL102) as well, although at a lower level of alarm raising events.
   The PSL Enclosure and the Anti-Room have not been cleaned for quite some time. Will arrange for a cleaning of the PSL during the next maintenance window. If this does not lower the PSL dust counts, will need to start looking into the air filtration system feeding the PSL enclosure.
Images attached to this report