I've been working on a prototype epics interface to the seismon system. It currently has several moving parts.
EPICS IOC
Runs on h1fescript0 as user controls (in a screen environment). Code is
/ligo/home/controls/seismon/epics_ioc/seismon_ioc.py
It is a simple epics database with no processing of signals.
EVENT Parser, EPICS writer
A python script parses the data file produced by seismon_info and sends the data to EPICS. It also handles the count-down timer for future seismic events.
This runs on h1hwinj2 as user controls. Code is
/ligo/home/controls/seismon/bin/seismon_channel_access_client
MEDM
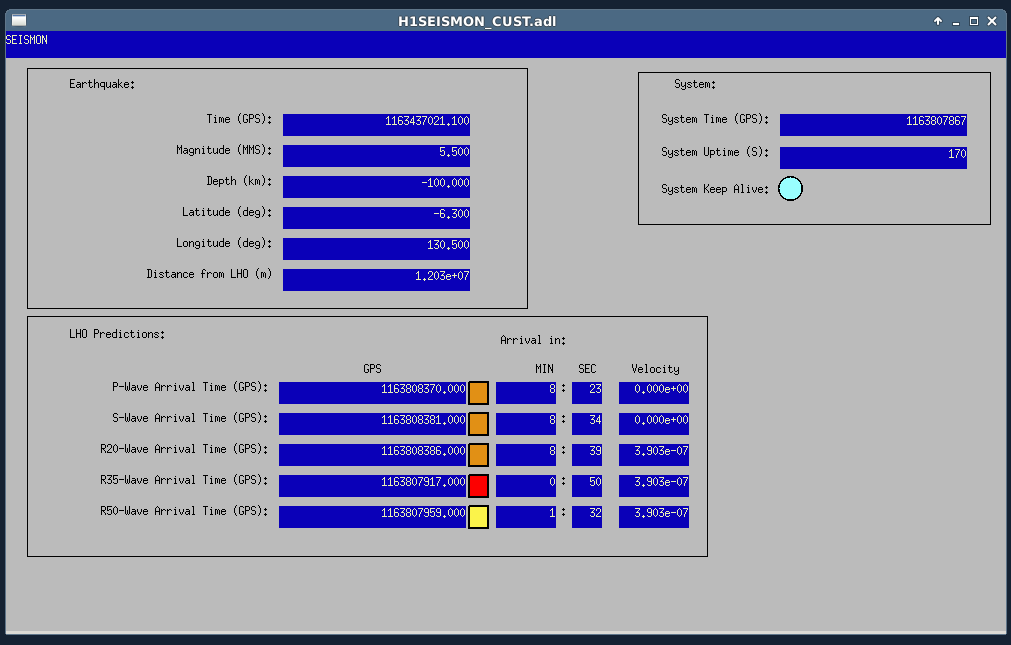
A new MEDM called H!SEISMON_CUST.adl is linked to the SITEMAP via the SEI pulldown (called SEISMON). Snapshot attached.
The countdown for the P,S,R waves are color coded for the arrival time of the seismic wave
ORANGE more than 2 mins away
YELLOW between 1 and 2 minutes away
RED less than 1 minute away
GREY in the past
If the system freezes and the GPS time becomes older than 1 minute, a RED rectangle will show to report the error.

We had been in a GRB standown period from 23:13UTC before H1 lost lock.