jeffrey.kissel@LIGO.ORG - posted 17:20, Tuesday 22 November 2016 (31742)
Controling DARM with PCAL Infrastructure Now Installed
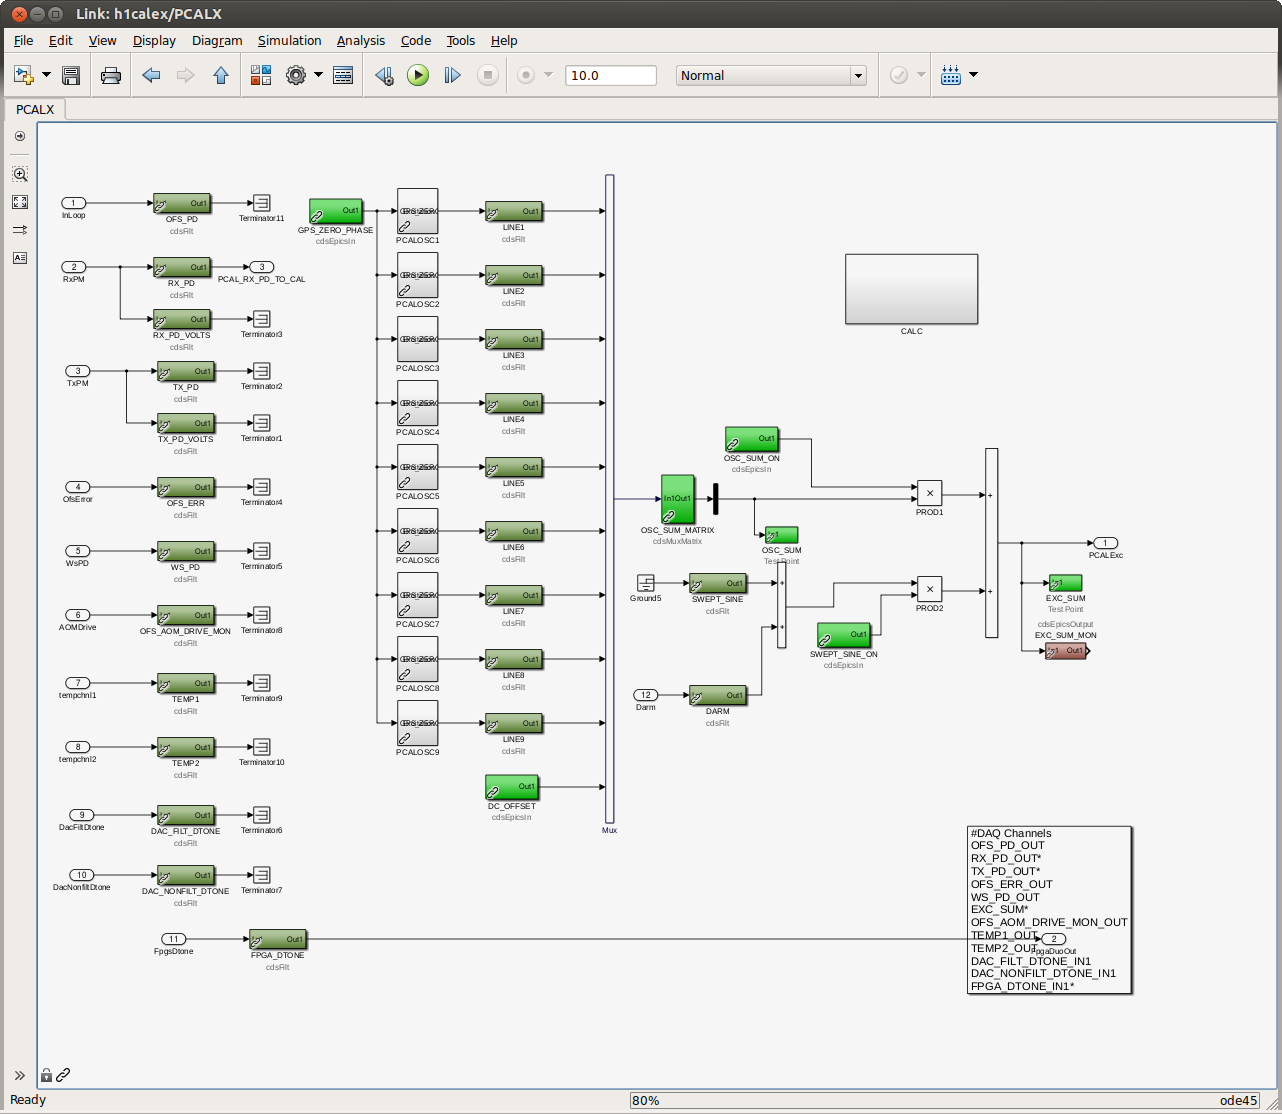
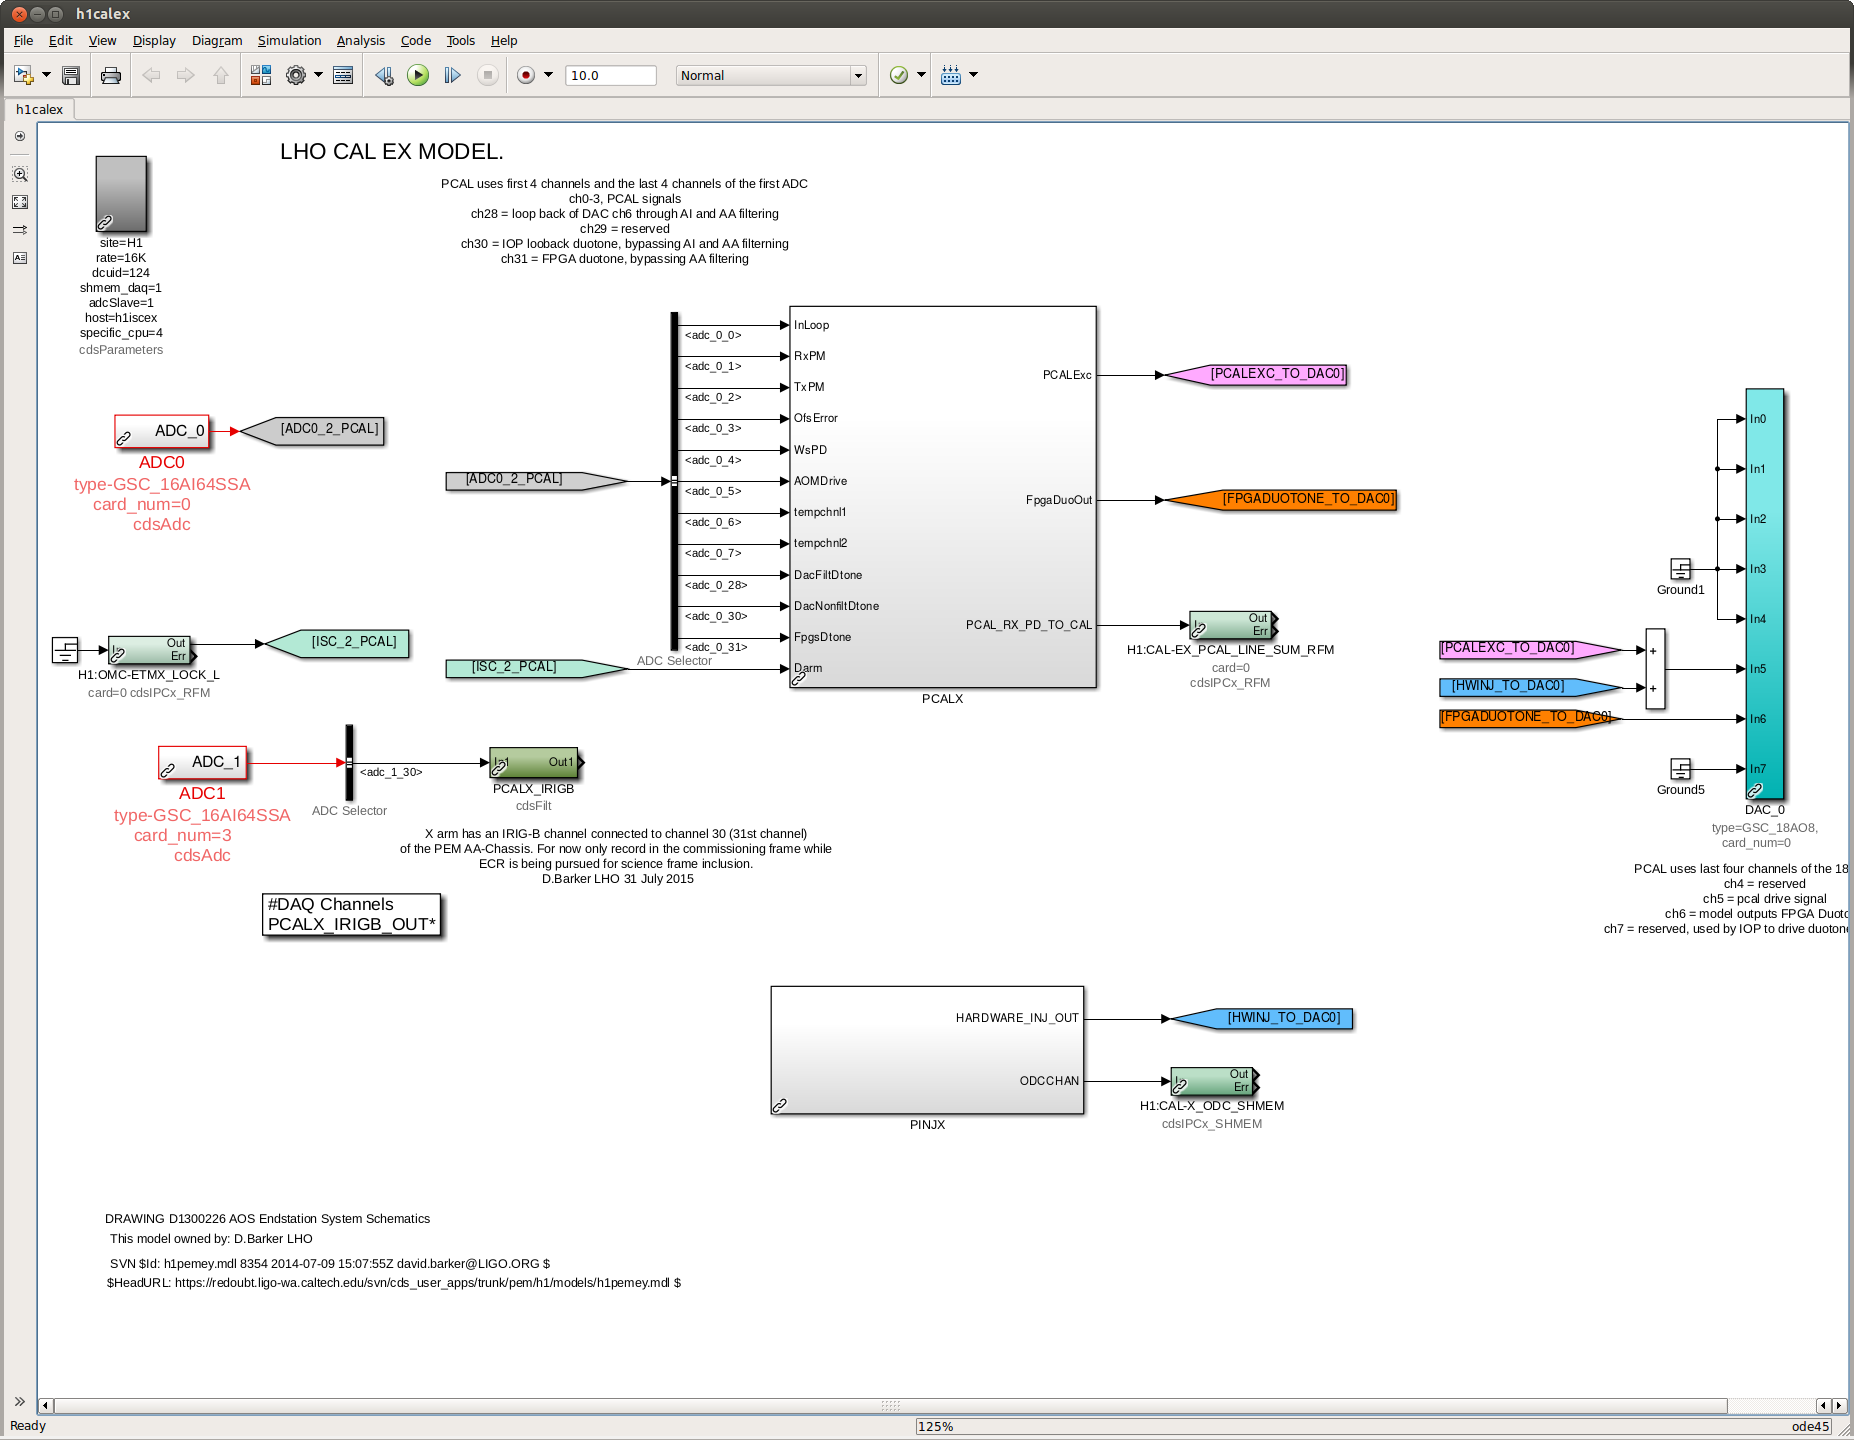
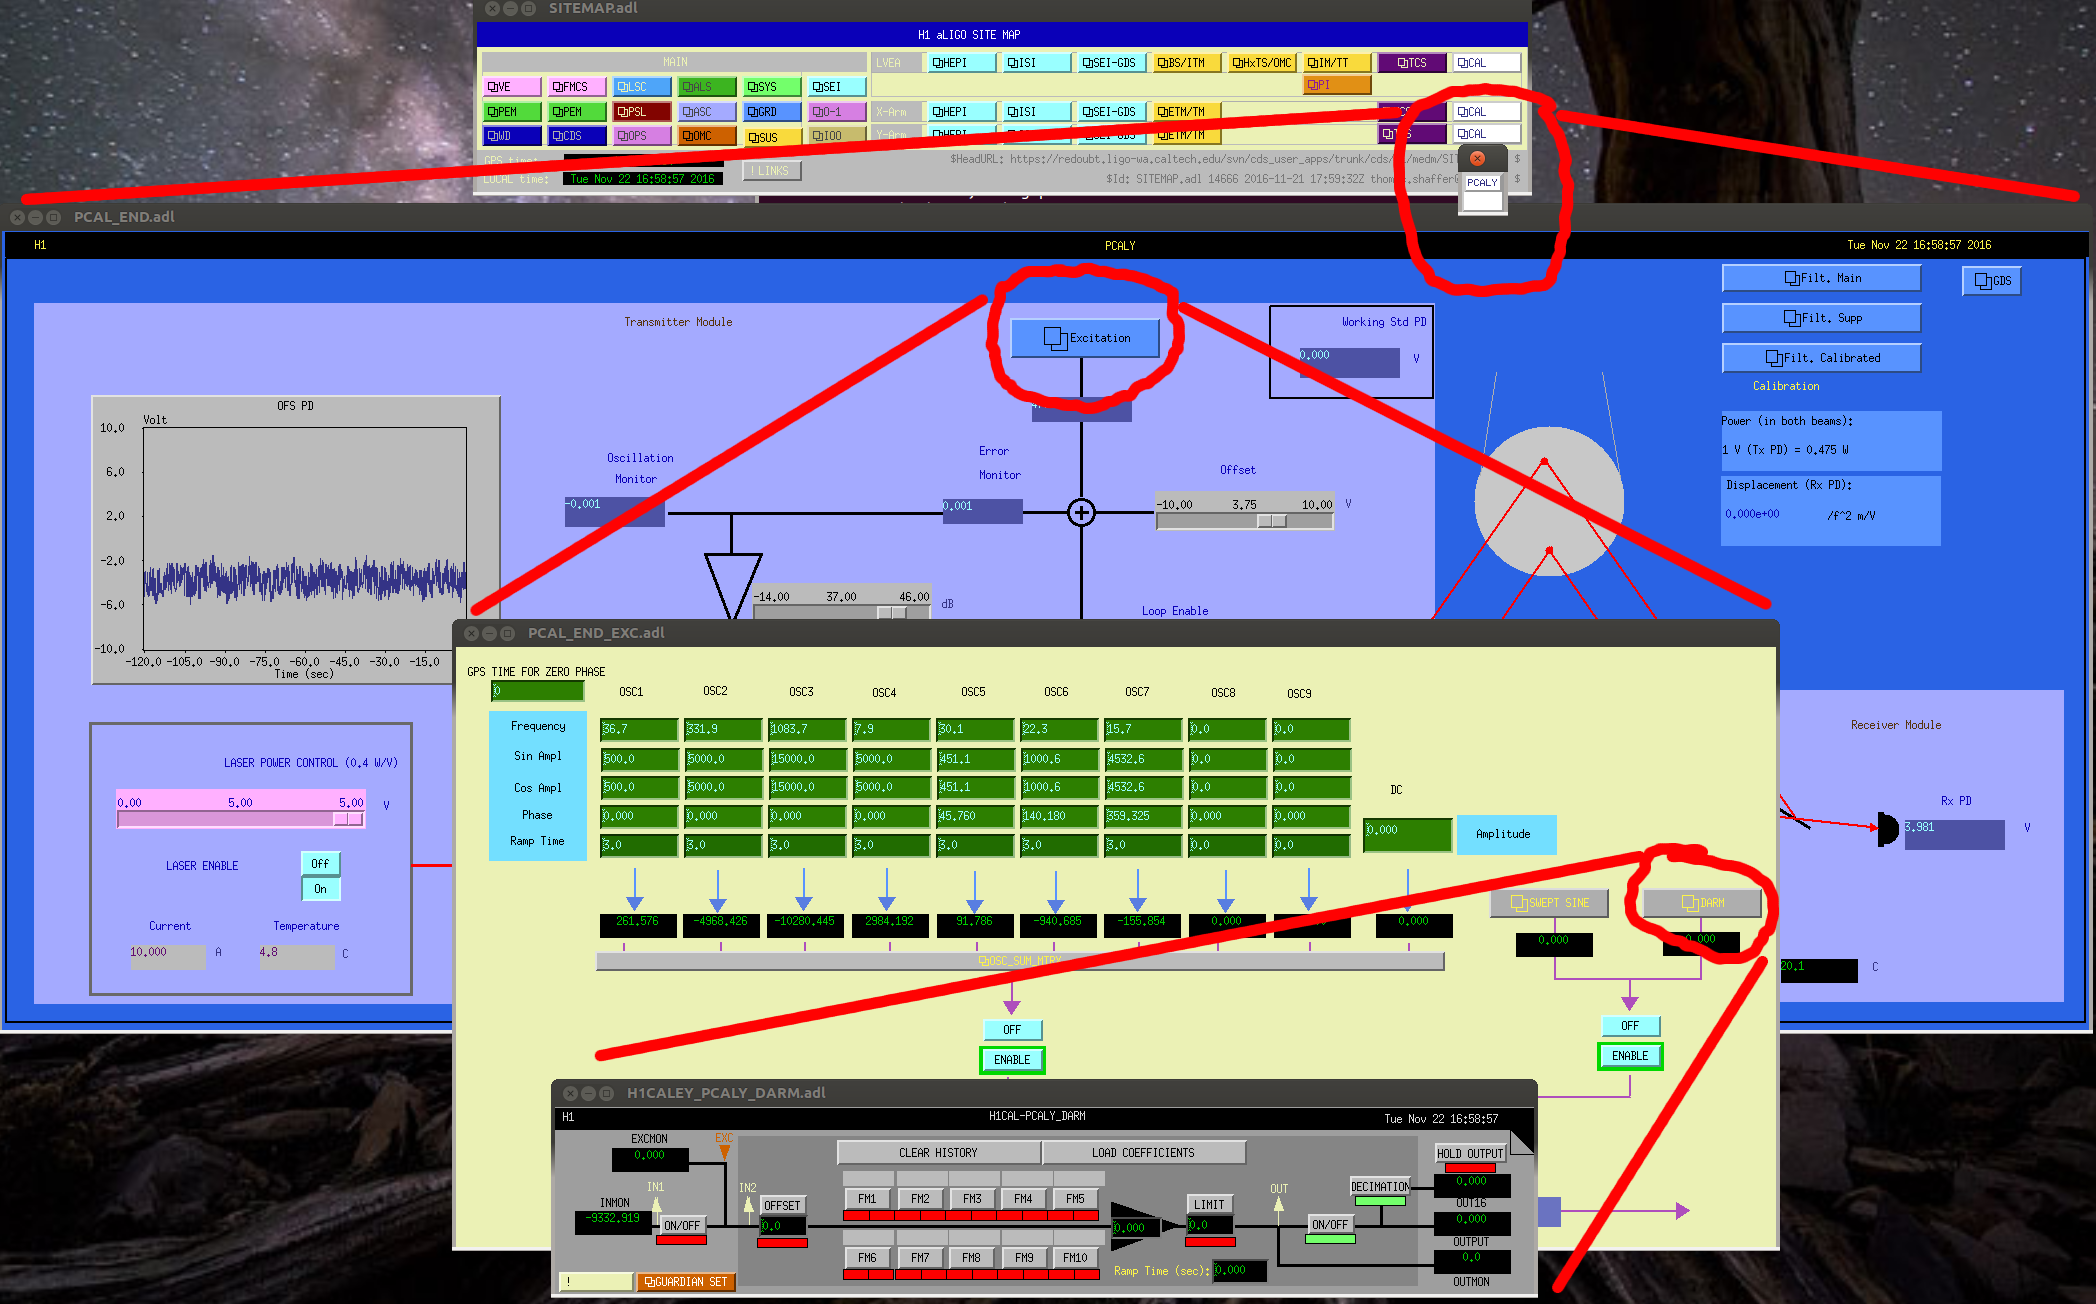
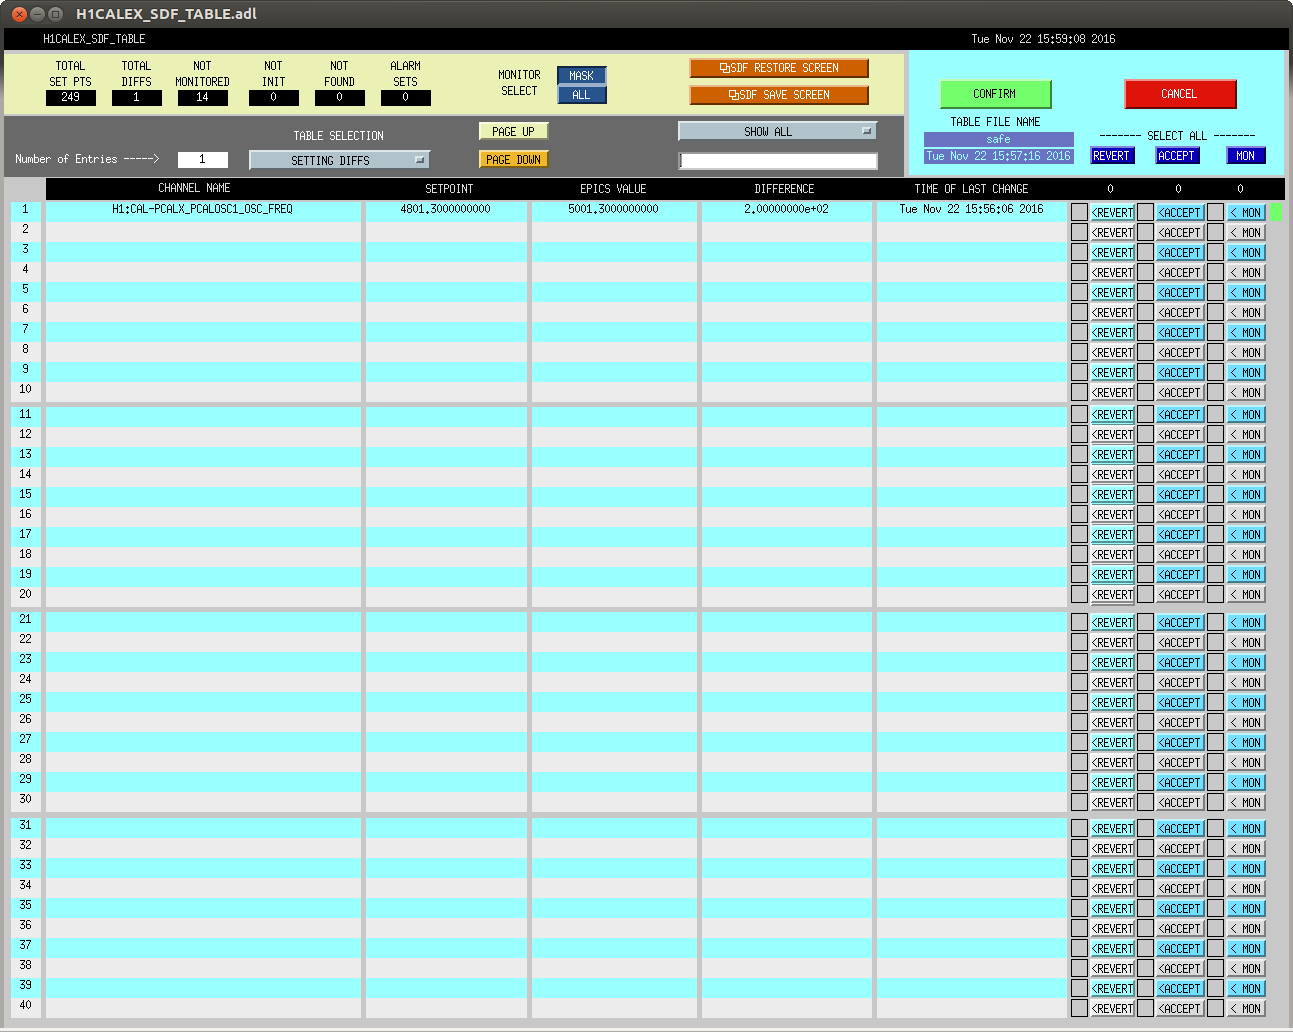
J. Kissel,
ECR E1600340
II 6665
WP 6338

I've installed the infrastructure that allows for control of the IFO's DARM DOF with either (or both) PCALs as designed by LLO (see LHO aLOG 29509). Unfortunately, because this was implemented quickly -- this is not decided in the LSC output matrix, but a combination of gains downstream.

This change required an update to the common library part,
    /opt/rtcds/userapps/release/cal/common/models/PCAL_MASTER.mdl,
modifications to both PCAL model's top-level
    /opt/rtcds/userapps/release/cal/h1/models
    h1calex.mdl
    h1caley.mdl,
and a DAQ restart after installation and restarts of both end-station cal models.
Also, I've updated the PCAL_END excitation screen,
    /opt/rtcds/userapps/release/cal/common/medm/PCAL_END_EXC.adl
However, I discovered that the PCAL overview
    /opt/rtcds/userapps/release/cal/common/medm/PCAL_END.adl
also need modification to pass down the correct macro variables from that it received from the SITEMAP. Otherwise the new path to the new PCAL_DARM filter bank was ill-defined and wouldn't open. I've committed the changes to the top level models, as well and the PCAL overview screen in there respective locations in the SVN.

For now, to transition from using ETM DARM control to PCAL DARM control, one should leave the LSC output matrix pointing to the correct end station's QUAD, but zero the
H1:SUS-ETM[X/Y]_L3_ISCINF_L_GAIN (i.e. the first longitudinal input to the SUS), and turn on that end-stations PCAL DARM control bank, H1:CAL-PCALY_DARM. Of course, you have to design the appropriate filtering to account for the difference between the ESD drive and PCAL drive, which I have not yet done.
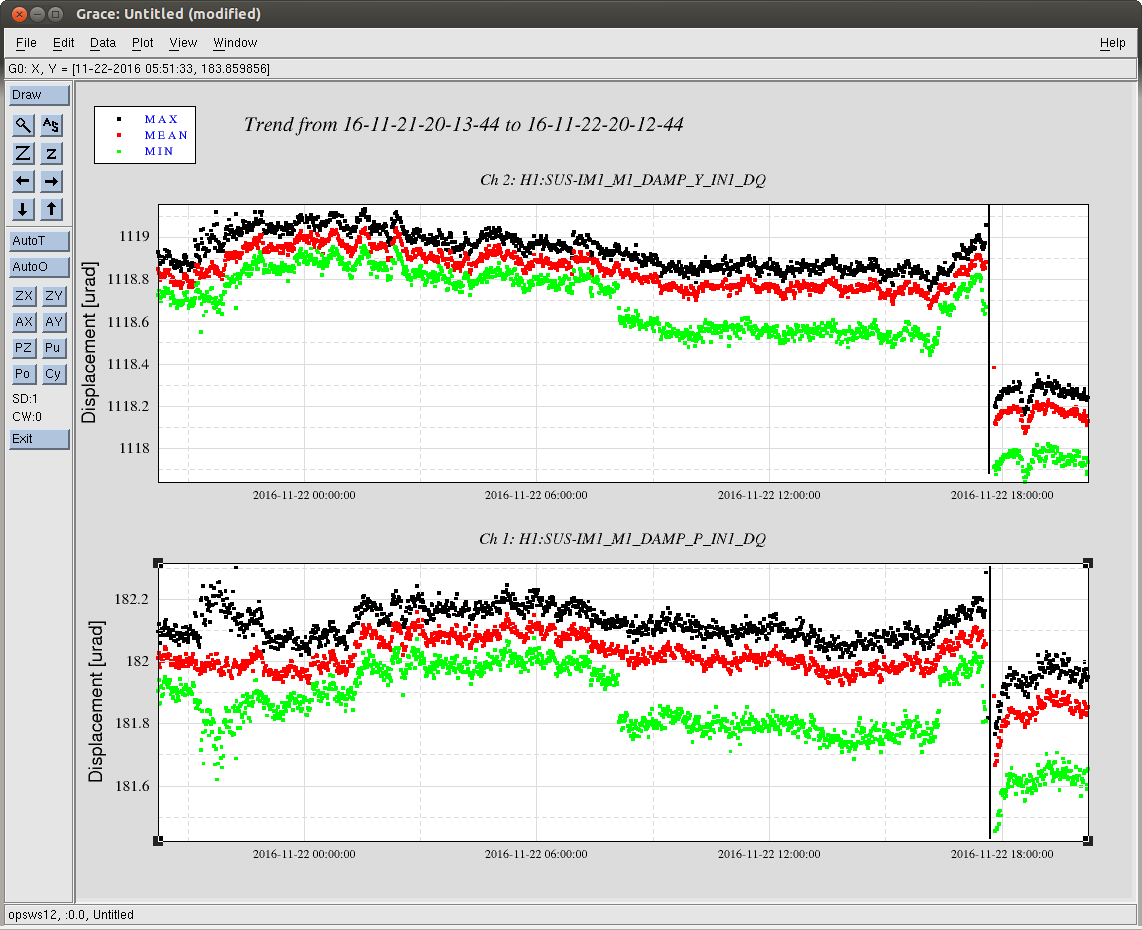
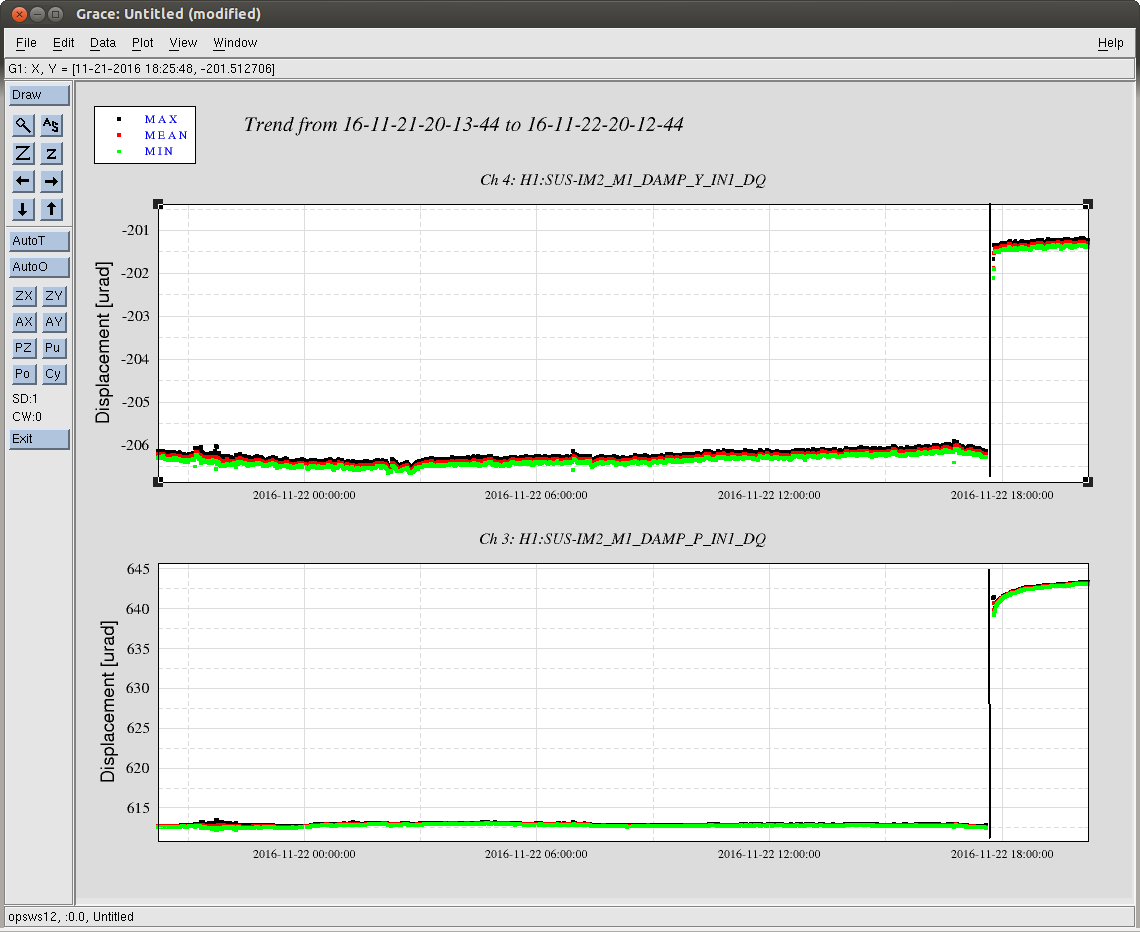
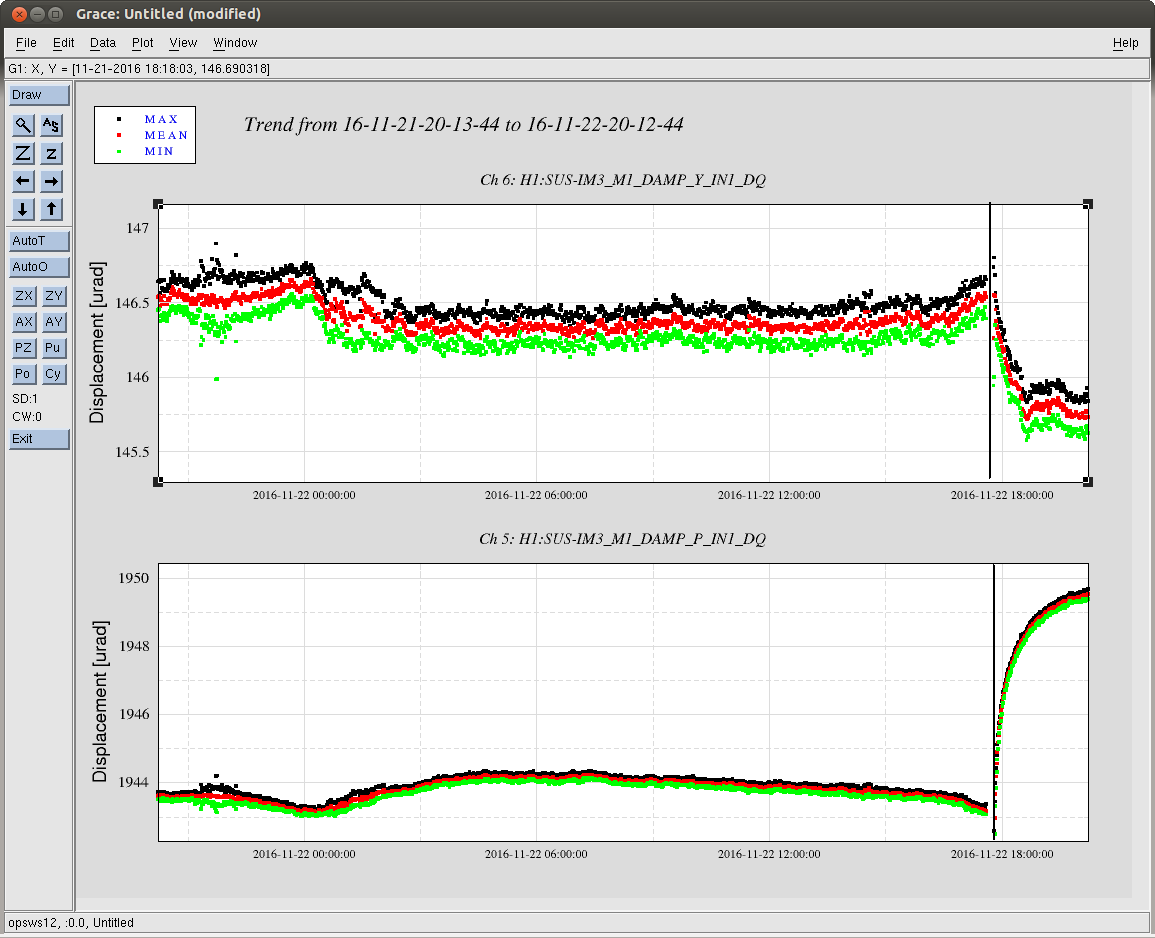
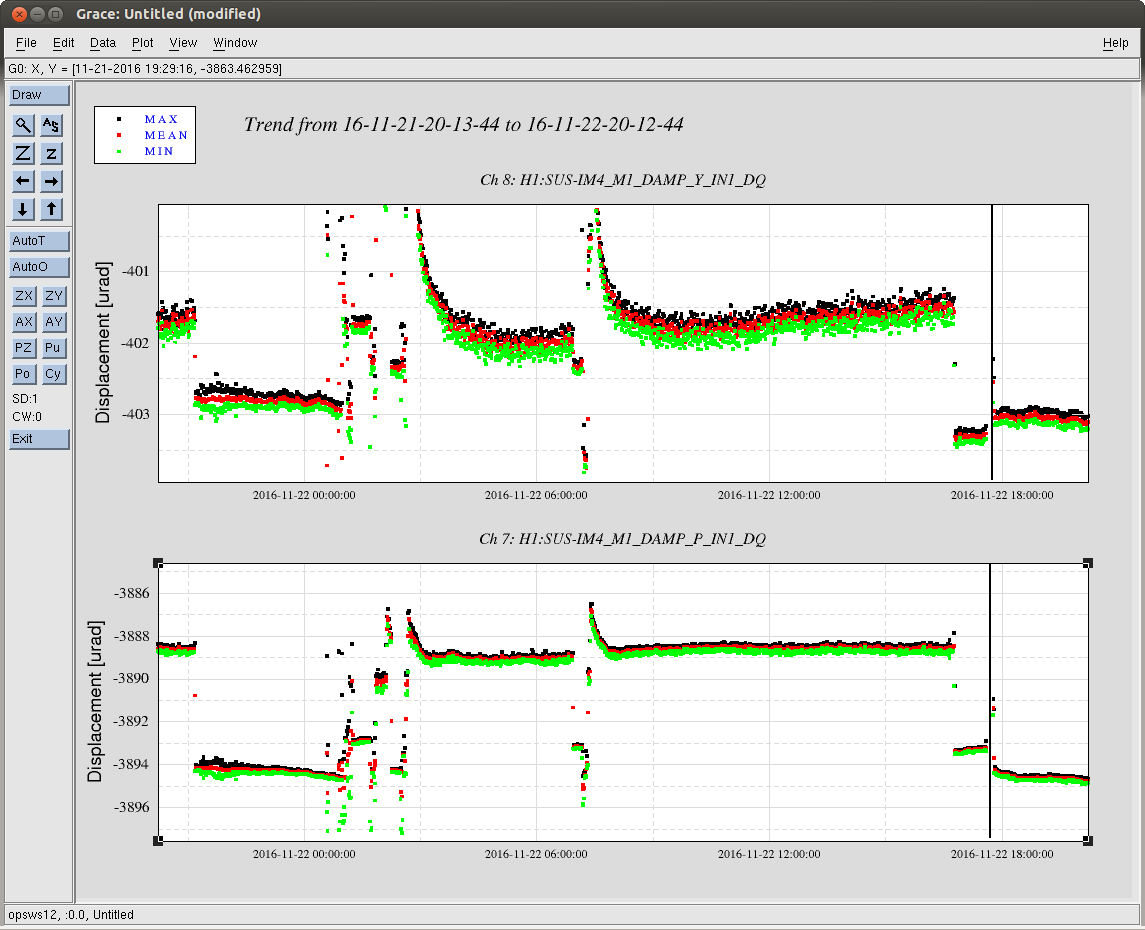
Images attached to this report