After Sheila's log about the BS causing locklosses, I wanted to check a few things in the guardian code and I found what looks like conflict in the code. In /opt/rtcds/userapps/release/isi/h1/guardian/ ISI_BS_ST2.py, line 4
ISOLATION_CONSTANTS['CART_BIAS_DOF_LISTS'] = ([ ] , [ ])
the empty brackets at the end indicate the ISI is not set to restore any Cartesian locations. This is supposed to be the code that sets what dofs are restored when the ISI re-isolates, and is particular to the beamsplitter.
However, in /opt/rtcds/userapps/release/isi/common/guardian/isiguardianlib/isolation/ CONST.py lines 102 (for BSC ST1) and 122 (for BSC ST2) both read
CART_BIAS_DOF_LISTS = ([], ['RZ']),
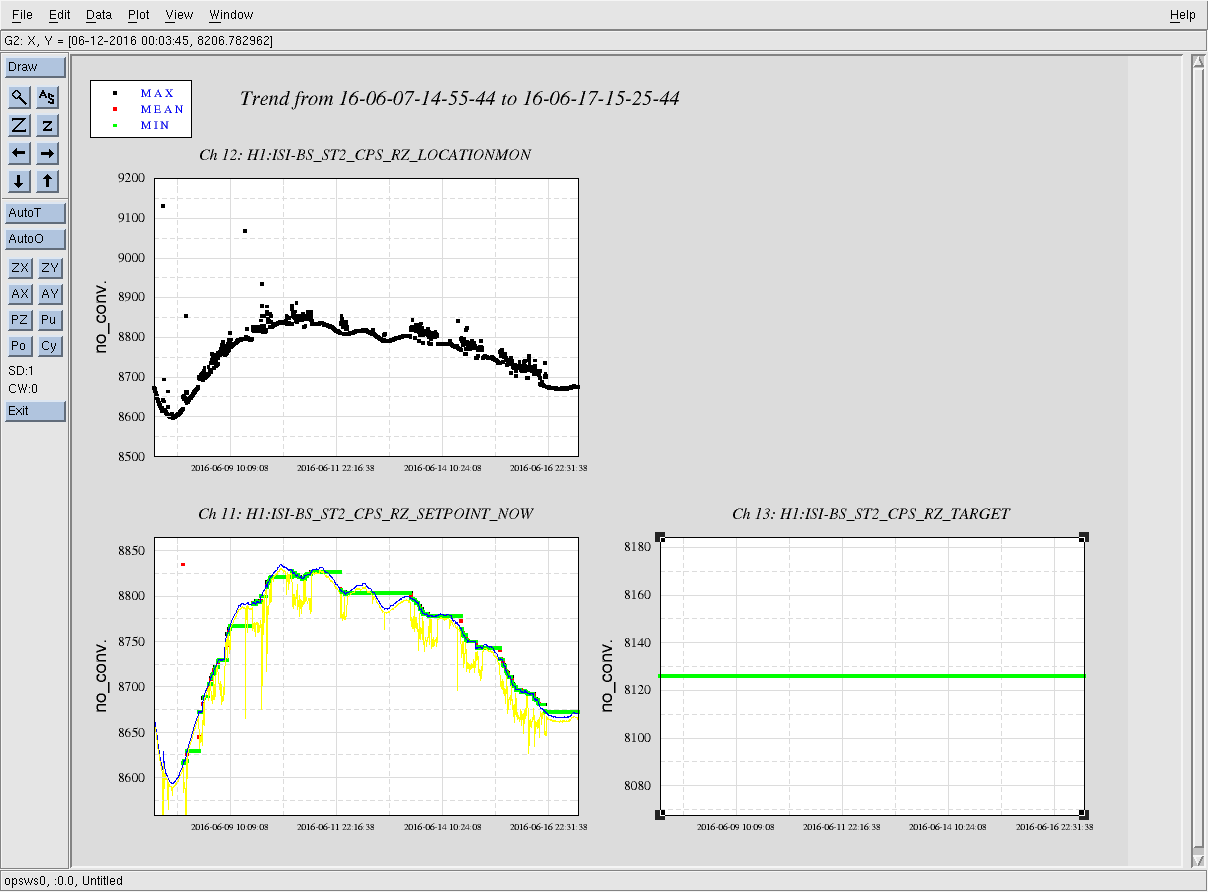
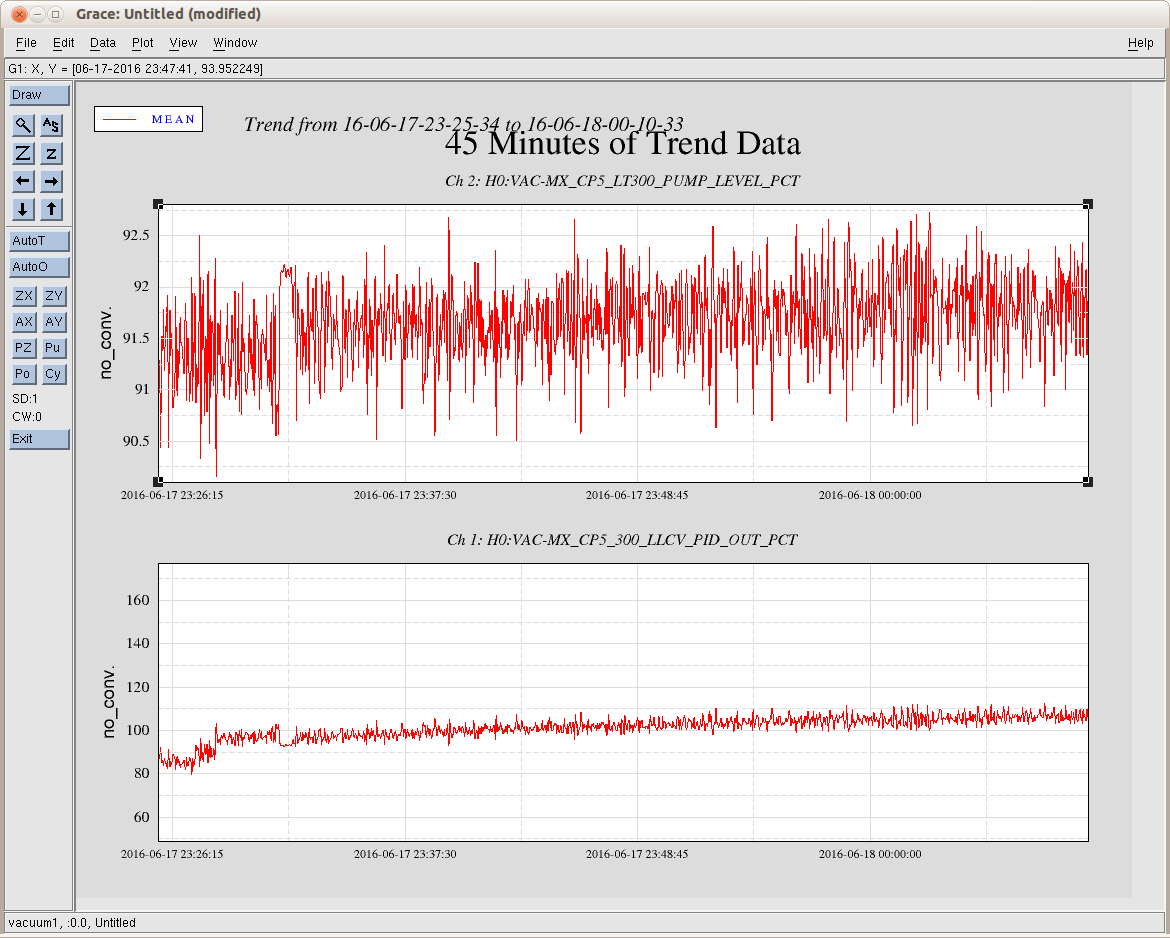
CONST.py is common code, and I would interpret this to mean that all BSCs are restoring a stored RZ location. This isn't a problem for the other BSCs, because they never change state, but if we turn on the ST2 loops for the BS, this code could force the ISI to rotate some after the loops come on. The attached trend shows the last ten days of the BS ST2 RZ setpoint and locationmon, and they track each other, so I dont think the BS is returning to some old RZ location, but someone who understands this code should explain it to me.