gerardo.moreno@LIGO.ORG - posted 16:13, Thursday 14 April 2016 (26594)
HAM6 CDS Signal Cable
Extended, routed and terminated CDS signal cable for HAM6 annulus ion pump controller.
Extended, routed and terminated CDS signal cable for HAM6 annulus ion pump controller.
Apparently, I missed this task in my queue. I "shot-the-gap" with these.
Reference FAMIS #4668
Mia culpa, I changed the name of the second spare PEM ADC channel at the corner station to H1:PEM-CS_ADC_4_27_16K_OUT_DQ but forgot to change the actual rate in the DAQ block. I corrected this, restarted h1pemcs and restarted the DAQ.
On the DAQ restart: mx_stream restarted needed on h1oaf0 and h1pemmx. h1fw1 kernel crashed on startup, needed power cycle.
Set H0:VAC-EY_CP7_LIC400_LLCV_POS_CTRL_PCT_DEAD_BAND to 0.5.
Apologies for the late entry.
C. Cahillane

Per Jeff's suggestion, I have detrended the calibration time-dependent kappas to get the true all of O1 uncertainty associated with the kappas.

This was done to eliminate the spikes in calibration uncertainty we would see from changes in the detector, such as ESD bias flips.

I detrended by finding the median kappa for a range of 100 kappas around a specified gpstime.  Then I would subtract the original kappa from the found median.  I then took the standard deviation over all of O1 from the detrended kappas.  These are the numbers reported in the histogram titles.
From this method, we get sub-percent and sub-degree uncertainty, due to the massive numbers of kappas we have.  I think this is fine as long as we understand why the detector configuration changed at every kappa-jump.

To see the LLO kappa detrends, please see LLO aLOG 25677
Ops EVE Shift. All time in UTC.
23:23 Jeff K. to EY to kick on ETMY ESD driver.
23:30 Dave restart SUS ETMX PI and PEM CS (added 2 mic at 16 kHz) models.
23:52 Jeff K. back. Power supply had tripped.
00:50 Nutsinee and Kiwamu walked around the LVEA to check on viewports. All of them are covered. We turned the CO2 controller boxes on so we can do some measurement.
02:23 Everybody's gone home. I think I'm going to end my log here.
Also I haven't done the measurement I wanted to do so the CO2 controller boxes are still on (but no output to the test masses. The laser is turned off on medm screen).
I have added SRM, SR2 and SR3 to the ADS (alignment dither system) part of the ASC. All necessary IPCs were already there, they were just grounded. Now we can send the dither signal to the SR mirrors, and also actuate on them with the demodulated signal if we so choose. We'd like to use this (at least looking at the demodulated sigal) to help us find the correct operating point for the SRC ASC signals.
While I was doing that, I also added the ability to blend the DHARD error signals, in case we decide to do that after we try CHARD error signal blending.
MEDM screens for the DHARD blending are done, although I have not yet completed the screen modifications for the ADS.
The rest of the medm screens are now done.
Dan completed the Q-Logic switch and SATA-BOY raid move from LSB to warehouse. The frame gap on h1fw0 is 12:01 - 17:58 PDT.
We installed Jenne's latest h1asc model and restarted the DAQ. h1fw1 did not start cleanly via monit and h1fw0 was having issues around the restart time. The framewriters did not sync-up with each other, maybe an issue in the time order of the asc and daq restarts. I did a second DAQ restart (with subsequent h1fw1 panic crash) which synced everything up. Moral of the story, if a fw is misbehaving, do not restart the DAQ until it is stable.
The power stabilisation was worked on today.  No real success to speak of.
The offset for the AOM drive signal was adjusted to diffract ~5W of light.

The servo was intermittent at low frequencies.  Examination of the photodiode
monitor signals showed changes in level at low frequencies.  This might be due
to interference between the main beam of the laser and some junk light from the
laser, even though the photodiodes are located after the pre-modecleaner.  The
symptoms seem to be eased when the pre-modecleaner servo gain was reduced.
However doing that reduces the unity gain of the pre-modecleaner servo.

We will take another look at the output of the laser tomorrow.


Jason, Peter
Tega and Ross installed new h1susetmxpi model. I modified h1pemcs for Robert, renaming the spare ADC DAQ channels with their datarate, and increasing the rate of the first two from 2kHz to 16kHz.
A new edcu file H1EDCU_BRSEY.ini was added to the DAQ, this adds the new Beckhoff EY BRS slow channels.
After both models were restarted, the DAQ was restarted. The DAQ is still running with only h1fw1 while LDAS maintenance is ongoing.
Extended, routed and terminated CDS signal cable for HAM1 annulus ion pump controller.
I started these nodes and will have them run overnight to see how they handle. The purpose of these nodes is to watch their respective BRS and report what state it is in, in the node's state (ie. if the damper is on, the state will be DAMPER_ON). In the future, these nodes will help the SEI configuration nodes to determine if the BRS is in a good condition to be used for sensor correction.
We got the EPICS IOC running on the BRSY computer and now have a collection of EPICS channels which hold detailed information about BRSY. Below is a list of the channels with some brief descriptions. For more detailed descriptions along with troubleshooting guide see T1600103.
Channel List:
H1:ISI-GND_BRS_ETMY_DAMPTIMEOUT, damping time out in number of cycles, read/write
H1:ISI-GND_BRS_ETMY_AMPBIT, amplitude status
H1:ISI-GND_BRS_ETMY_BOXBIT, BRS electronics box status
H1:ISI-GND_BRS_ETMY_CBIT, C# running bit
H1:ISI-GND_BRS_ETMY_DAMPBIT, Damping state
H1:ISI-GND_BRS_ETMY_MODBIT, Beckhoff modules status
H1:ISI-GND_BRS_ETMY_USER, User damping logic control, read/write, (0 stops damping from ever turning on, 1 allows damping to turn if necessary)
H1:ISI-GND_BRS_ETMY_CAMERA, Camera status
H1:ISI-GND_BRS_ETMY_LIGHTSRC, Light source status
H1:ISI-GND_BRS_ETMY_TEMPL, Left temperature sensor in 0.01℃
H1:ISI-GND_BRS_ETMY_TEMPR, Right temperature sensor in 0.01℃
H1:ISI-GND_BRS_ETMY_VEL, Sqrt(velocity)
H1:ISI-GND_BRS_ETMY_HIGHTHRESHOLD, Damping high threshold, read/write, above which the damping turns on
H1:ISI-GND_BRS_ETMY_LOWTHRESHOLD, Damping low threshold, read/write, below which the damping timeout begins
Also, we've uploaded both the PLC code and the C# code to the SVN under slowcontrols.
Title:  04/13/2016, Day Shift 15:00 – 23:00 (08:00 – 16:00) All times in UTC (PT)
State of H1: IFO unlocked. HAM6 being pumped. Work on PSL is ongoing
Commissioning:
Outgoing Operator: N/A

Activity Log: All Times in UTC (PT)

15:00 (08:00) – Start of shift
15:44 (08:44) Christina & Karen – Going into LVEA for cleaning
15:52 (08:52) Kyle – Going into LVEA to move vacuum pump from north side of HAM6
15:57 (08:57) Keita – Going to ISCT1 to do fit checking
16:09 (09:09) Peter – Going into LVEA to make measurements
16:14 (09:14) Gerardo – Going to Y-End to recover Pump cart
16:28 (09:28) Peter – Out of the LVEA
16:29 (09:29) Chris – Beam sealing on the X-Arm near the corner station
16:42 (09:42) Filiberto – Taking job shadows into CER
16:50 (09:50) Filiberto & Job shadows – Going to Mid-Y to prep for vacuum system changes
16:58 (09:58) Kyle – Out of the LVEA
17:05 (10:05) Gerardo – Back from End-Y
17:09 (10:09) Kyle & Gerardo – In LVEA craning the pump cart over the beam tube
17:15 (10:15) Peter & Jason – Going into the PSL enclosure
18:10 (11:10) Dale – Taking job shadows on LVEA tour
18:14 (11:14) John – Going to both mid stations to check property tags
18:38 (11:38) Dale – Out of LVEA
18:50 (11:50) Filiberto – Back from Mid-Y
18:52 (11:52) Filiberto – Going to Mid-X
19:06 (12:05) Dave & Jim – 	DAQ restart
				Taking down FW0 for several hours to move disks
				Taking down NDS0 – May cause Guardian to crash
19:15 (12:15) Filiberto – Back from Mid-X
19:19 (12:19) Kyle – Out of LVEA
19:29 (12:29) Jason & Peter – Finished in the PSL enclosure
19:31 (12:31) Jim – Restarting H0EPIC2 to fix a pegged CPU
19:49 (12:49) Jeff K. & Evan – Going to End-X to hunt for noise
20:51 (13:51) Krishna – Going to End-X for BRS code changes
21:40 (14:40) Filiberto – In Beer Garden working on Newtonian array
21:46 (14:46) Peter & Jason – In LVEA around PSL racks
21:55 (14:55) Chandra & John – In LVEA at GV3
22:15 (15:15) Keita – Finished moving the ISCT6 table back into place at HAM6
22:18 (15:18) John & Chandra – Out of the LVEA
22:26 (15:26) Krishna – Back from End-X
22:58 (16:58) Jeff K. & Evan – Back from End-X


End of Shift Summary:

Title: 04/13/2016, Day Shift 15:00 – 23:00 (08:00 – 16:00) All times in UTC (PT)
Support:
Incoming Operator: Nutsinee

Shift Detail Summary: Chamber pump down continues at HAM6. The PSL team is working on a power stabilization problem located outside the PSL enclosure. Various other groups are taking advantage of the IFO being unlocked to address problems, upgrades, and fixes.
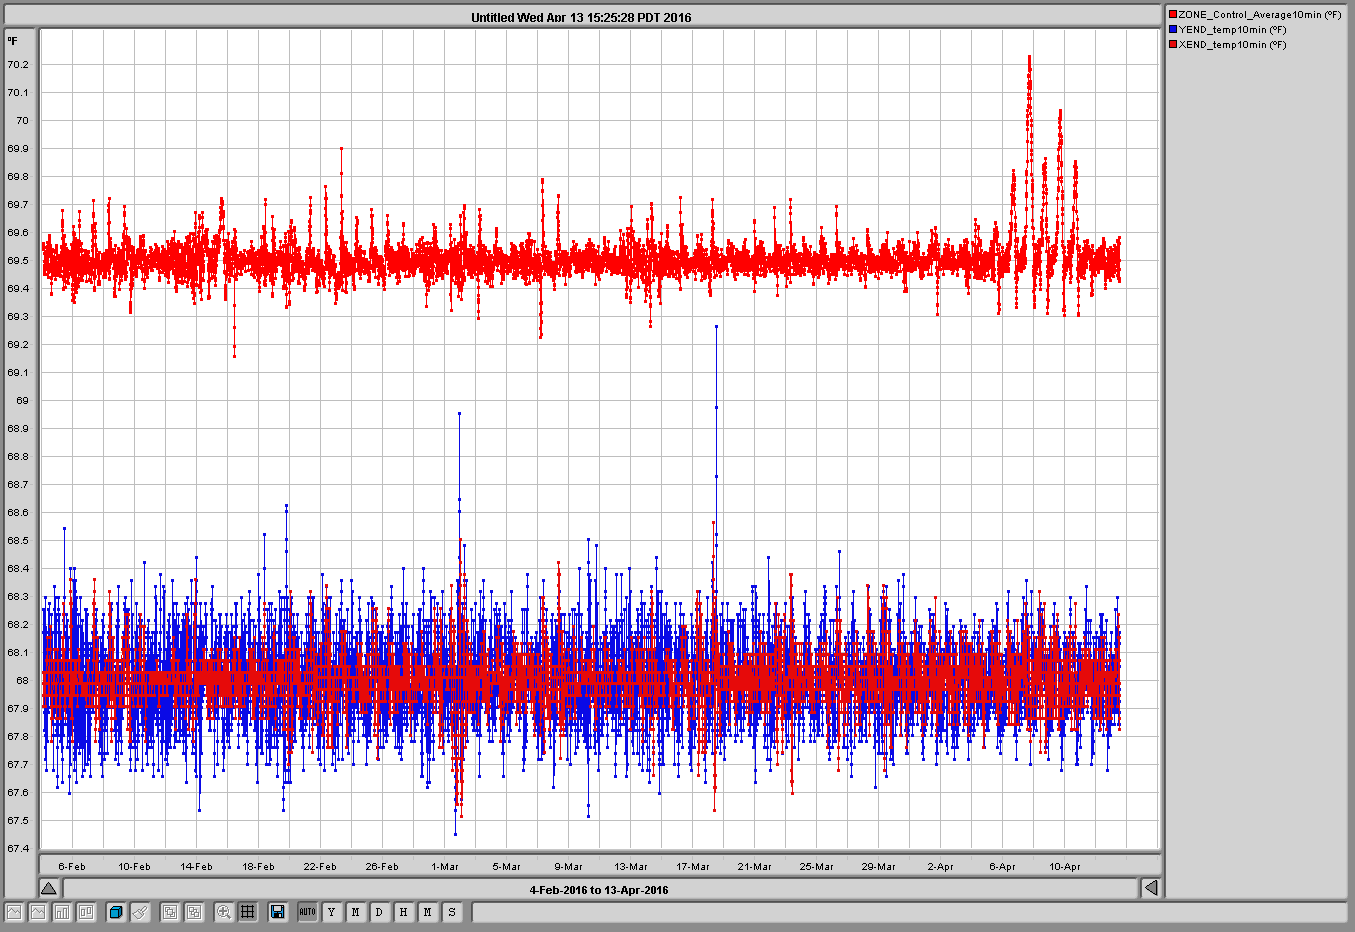
The plot "VEAs" displays the average temperature for the two end station VEAs and the LVEA average (Zone_Control_AVerage)
These are 10 minute samples.
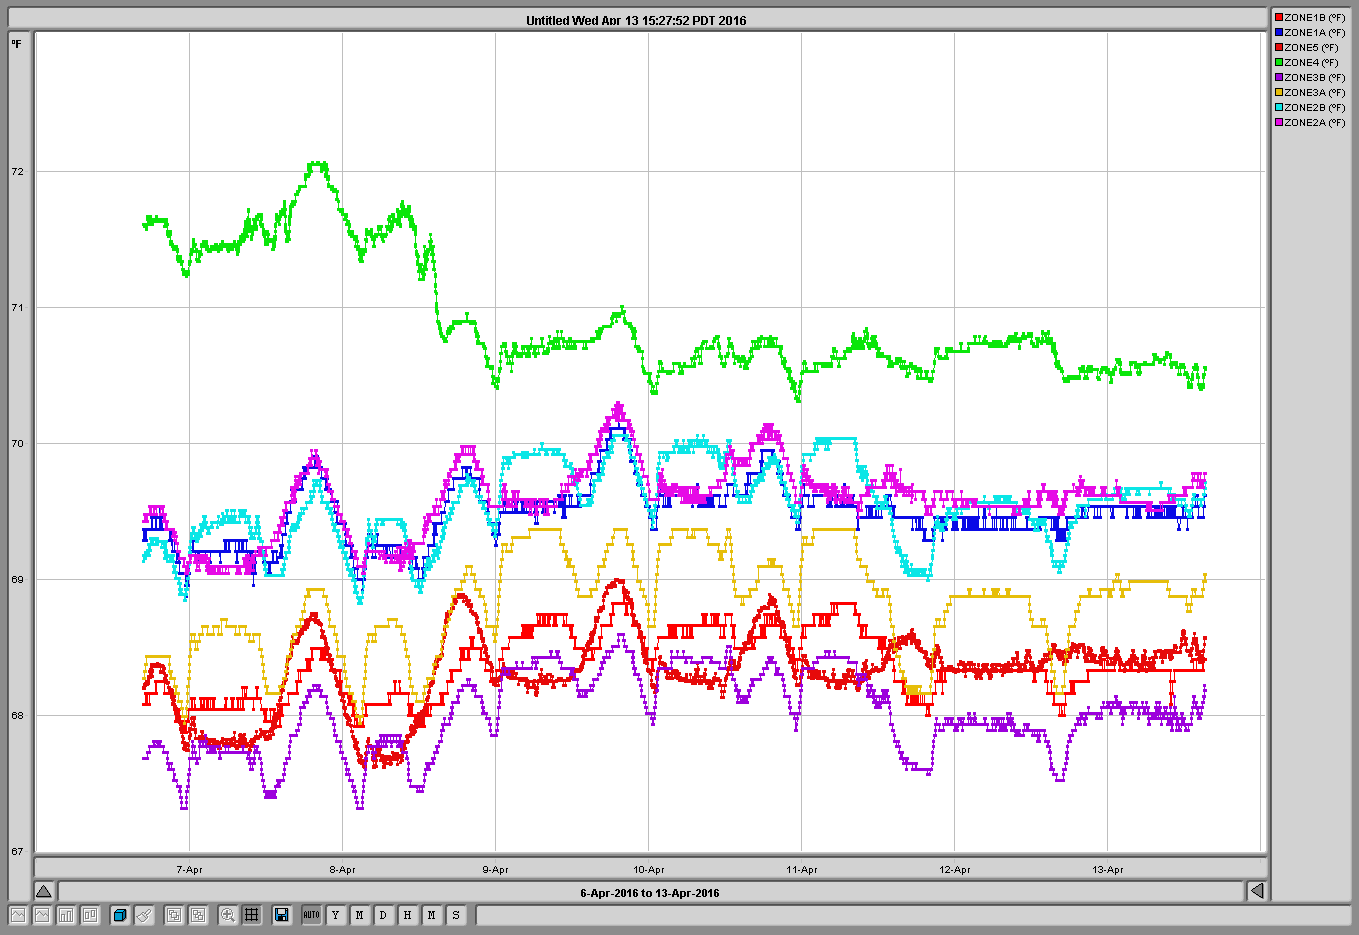
Note that the End VEAs consist of one zone while the LVEA has 8 zones (shown in plot LVEAzones - one minute samples)
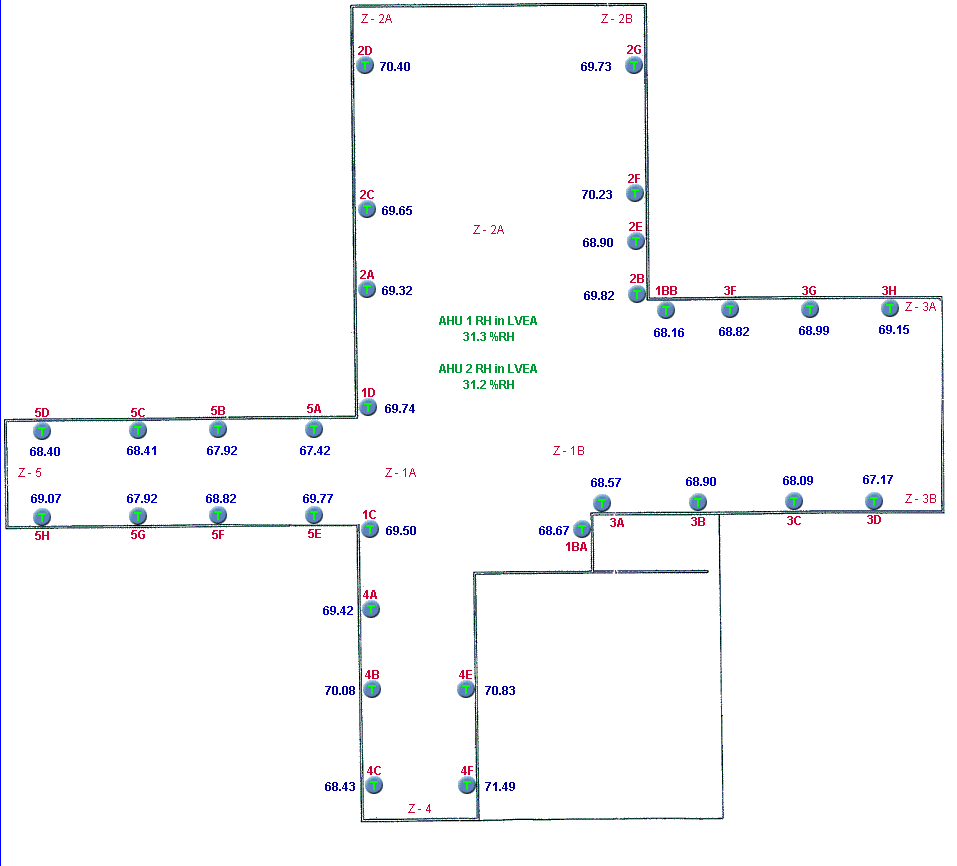
Zonedef shows all the temperature sensors in the LVEA.
At LHO we do not control the zones individually (since disabling the SCR controls years ago) We control to an average Zone_Control_AVerage which averages most of the sensors in the LVEA with the exception of a few outliers. For example, sensor 3D, zone 3B, is excluded since it senses drafts from an exterior door near by.
MCL PZT mirror assy was assembled except the mirror itself and was put at a random location on ISCT1. This is for POP-X.
I did some follow-up tests today to understand the behavior of the DARM cavity pole. I put an offset in some ASC error points to see how they affect the DARM cavity pole without changing the CO2 settings.
I conlude that the SRC1 ASC loop is nominally locked on a non-optimal point (when PSL is 2 W) and it can easily and drastically changes the cavity pole. The highest cavity pole I could get today was 362 +/- a few Hz by manually optimizing the SRC alignment.
[The tests]
This time I did not change the TCS CO2 settings at all. In order to make a fair comparison against the past TCS measurements (26264, 26245), I let the PSL stay at 2 W. The interferometer was fully locked with the DC readout, and the ASC loops were all engaged. The TCS settings are as follows, TCSX = 350 mW, TCSY = 100 mW. I put an offset in the error point of each of some ASC loops at a time. I did so for SRC1, SRC2, CSOFT, DSOFT and PRC1. Additionally, I have moved around IM3 and SR3 which were not under control of ASC. All the tests are for the PIT degrees of freedom and I did not do for the YAWs. During the tests, I had an excitation line on the ETMX suspension at 331.9 Hz with a notch in the DARM loop in order to monitor the cavity pole. Before any of the tests, the DARM cavity pole was confirmed to be at 338 Hz by running a Pcal swept sine measurement.
The results are summarized below:
The QPD loops -- namely CSOFT, DSOFT, PRC1 and SRC2 loops -- showed almost no impact on the cavity pole. The SOFTs and PRC1 tended to quickly degrade the power recycling gain rather than the cavity pole. I then further investigated SRC1 as written below.
[Optimizing SRC alignment]
I then focused on SRC1 which controlled SRM using AS36. I switched off the SRC1 servo and started manually aligning it in order to maximize the cavity pole. By touching PIT and YAW by roughly 10 urads for both, I was able to reach a cavity pole of 362 Hz. As I aligned it by hand, I saw POP90 decreasing and POP18 increasing as expected -- these indicate a better alignment of SRC. However, strangely AS90 dropped a little bit by a few %. I don't know why. At the same time, I saw the fluctuation of POP90 became smaller on the StrioTool in the middle screen on control room's wall.
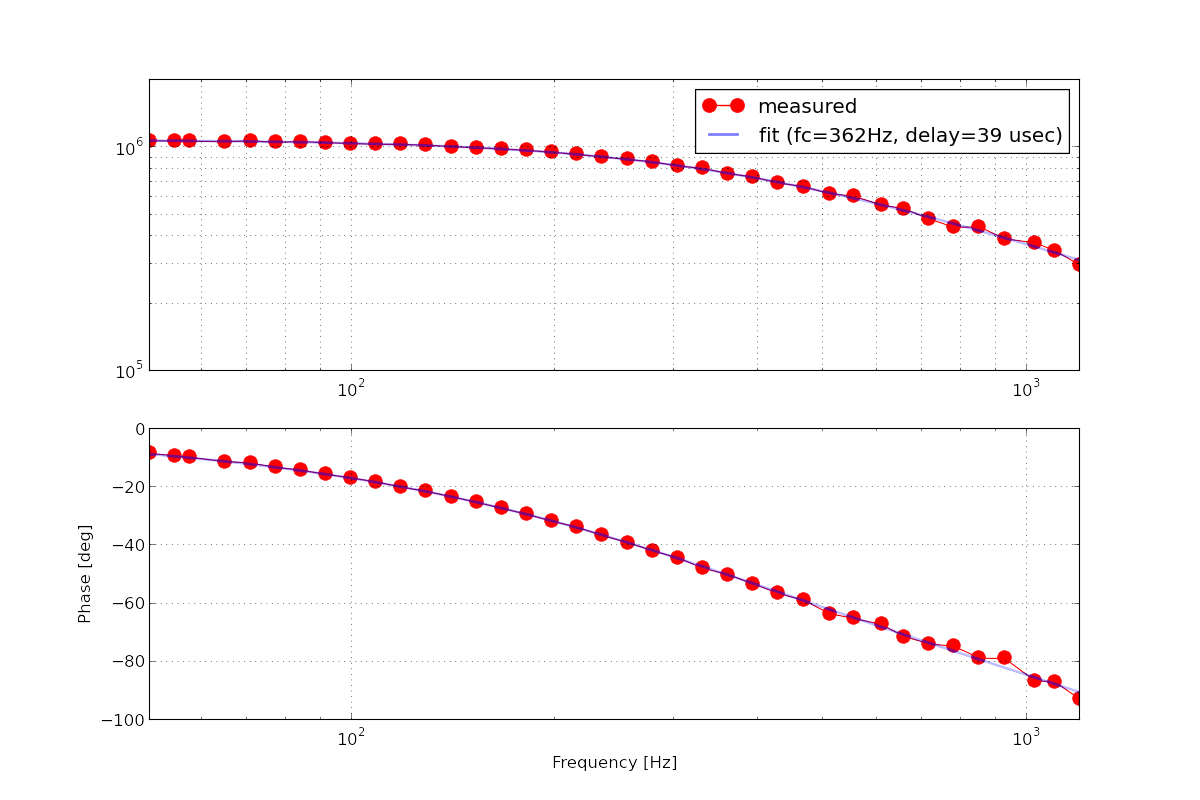
In order to double check the measured cavity pole from the excitation line, I ran another Pcal swept sine measurement. I confirmed that the DARM cavity pole was indeed at 362 Hz. The attached is the measured DARM sensing function with the loop suppression taken out. The unit of the magnitude is in [cnts @ DARM IN1 / meters]. I used liso to fit the measurement as usual using a weighted least square method.
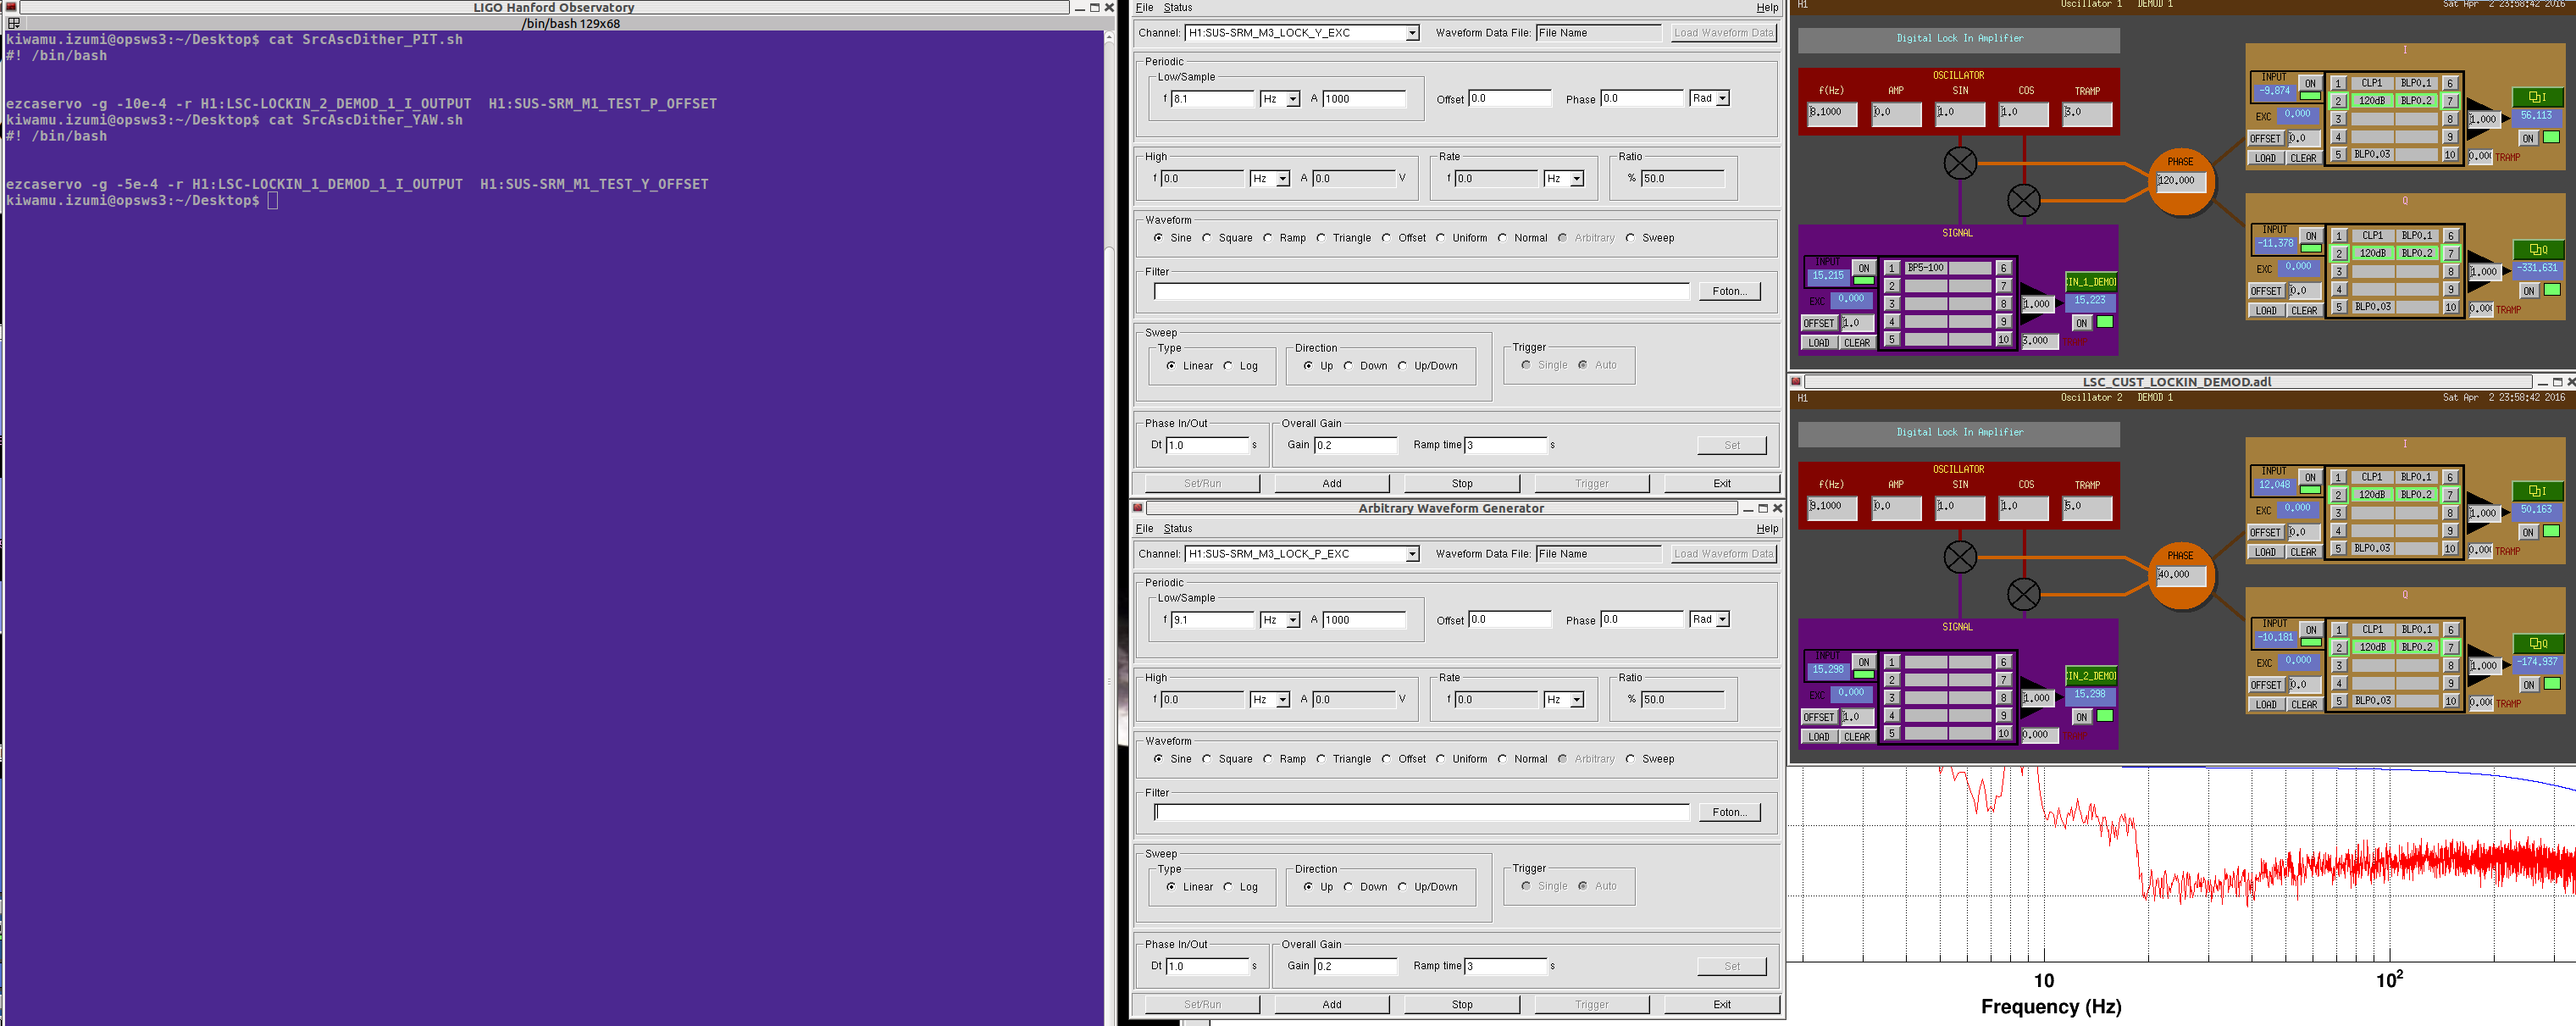
By the way, in order to keep the cavity pole at its highest during the swept sine measurements, I servoed SRM to the manually adjusted operating point by running a hacky dither loop using awg, lockin demodulators and ezcaservos. I have used POP90 as a sensor signal for them. The two loops seemingly had ugf of about 0.1 Hz according to 1/e settling time. A screenshot of the dither loop setting is attached.
Probably interestinmg to take a look at ASC_ASA/B_36/90/DC, and see, if there is a better combintion available.
It occurs to me that we might try putting some offsets into the centering loops for the SRC WFS. Can we find a pointing location where the AS36 signals give us an optimal alignment for the SRC?
On a somewhat parallel thought, Evan and I wonder if we could set offsets in the SRC1 loops after choosing an alignment based on some dither lines? Maybe we don't want always-on dither lines, but we could use them to help us figure out what our optimal alignment is.
Here are some more data.
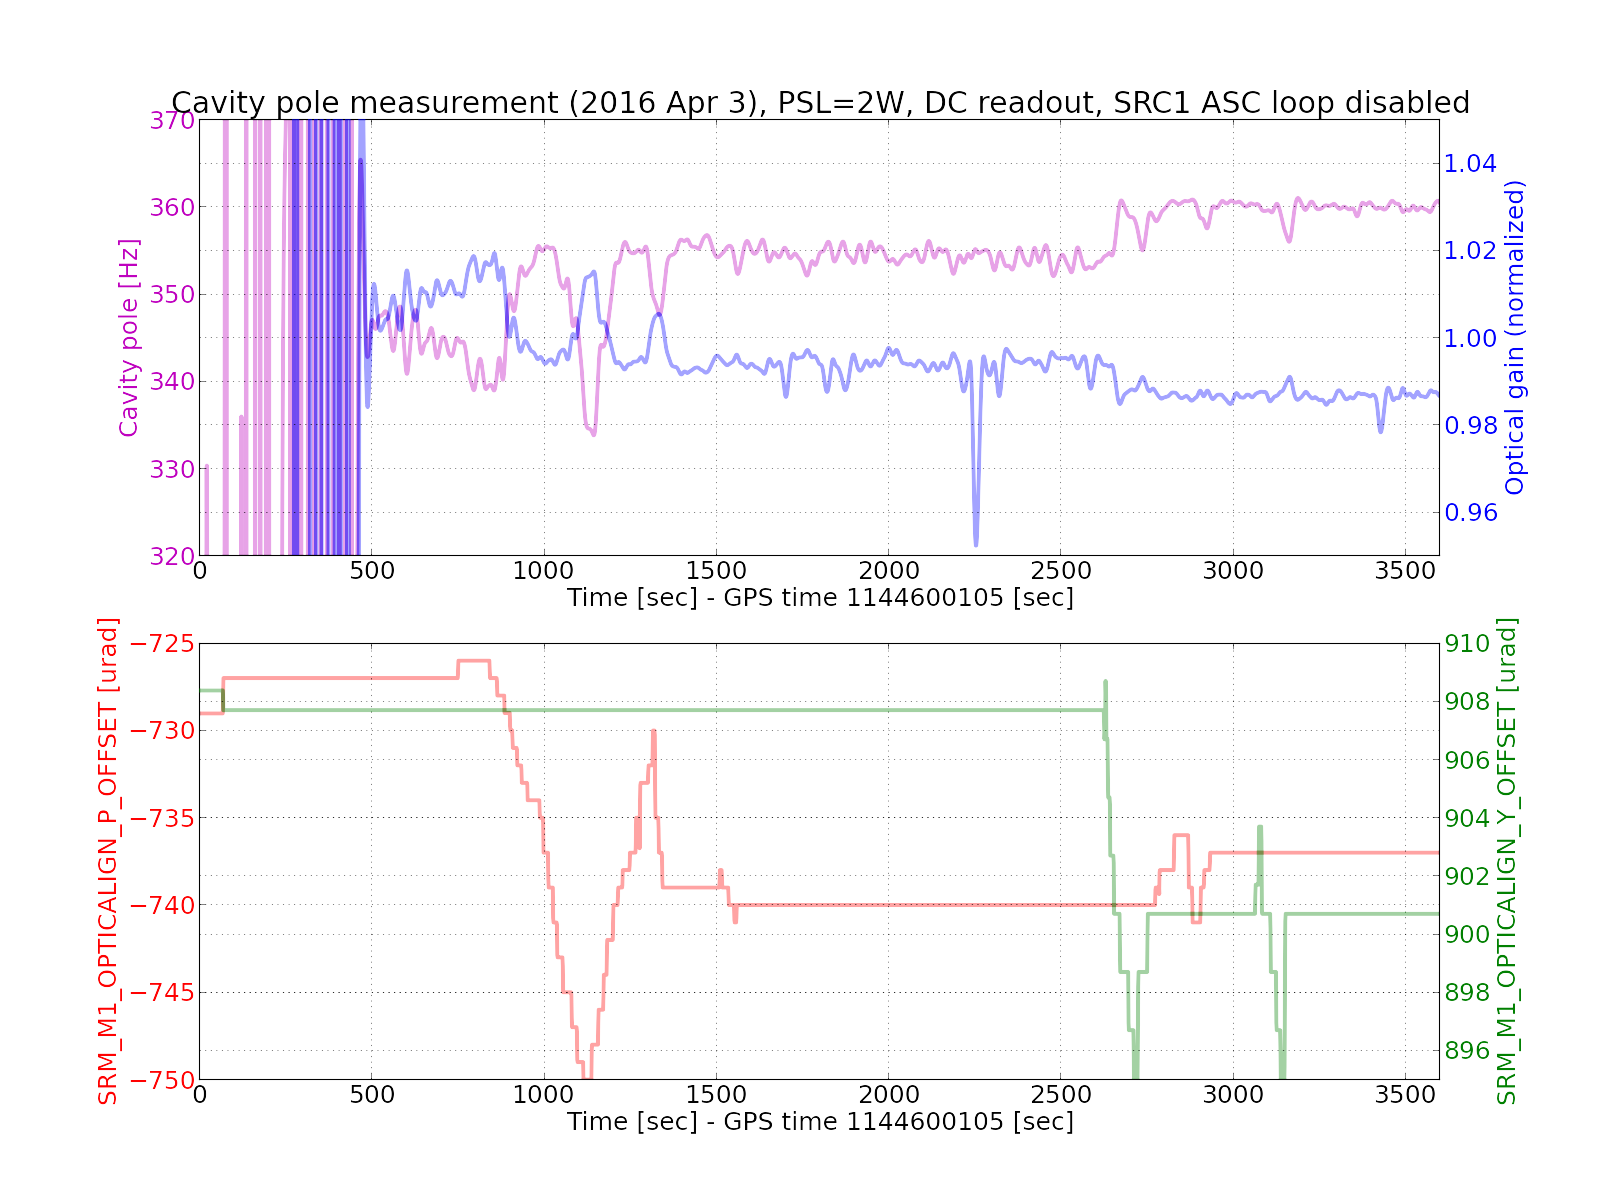
In this plot, full lock was achieved at some point between 0 and 500 sec. A small change in the SRM alignment offsets are due to the DRMI guardian completing the ASC offload to the top mass before decreasing the CARM offset. The measurement of the cavity pole and optical gain is valid only after 500 sec or so.
As I mentioned in the last ISC call, the cavity pole frequency and optical gain are anti-correlated -- one goes up and the other goes down.
The below shows a summary of my manual SRM alignment.
| Before | After | Difference (after - before) | |
| SRM PIT | -727 urad | -737 urad | -10 urad |
| SRM YAW | 908 urad | 901 urad | -7 urad |
As I wrote in the original entry, I steered SRM PIT and YAW by -10 and -7 urad respectively.
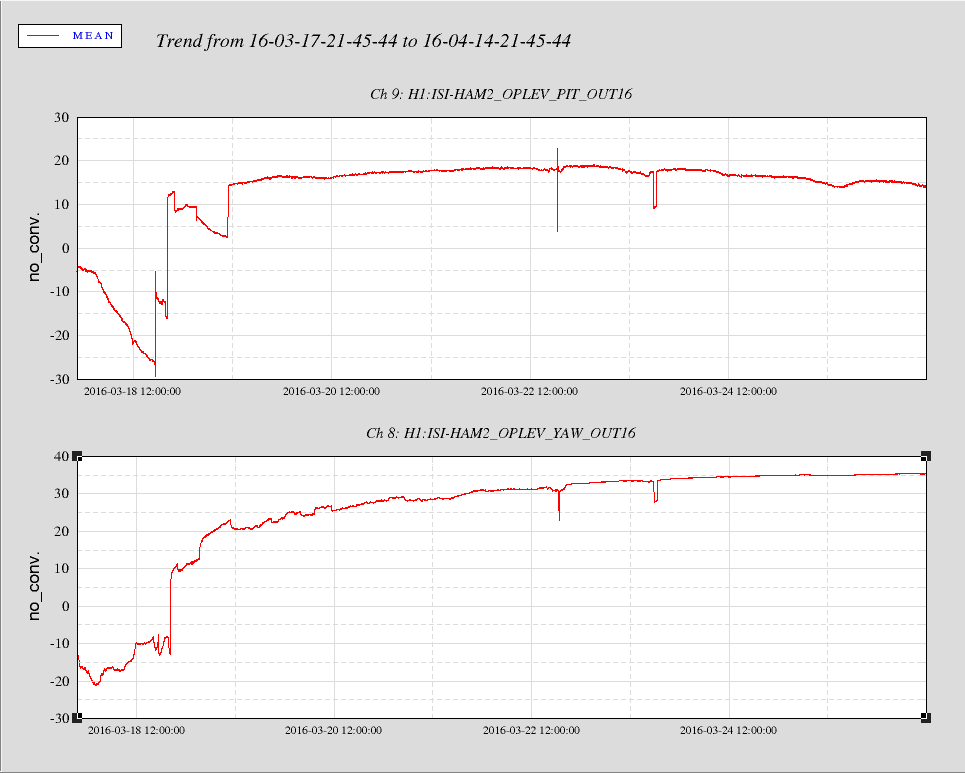
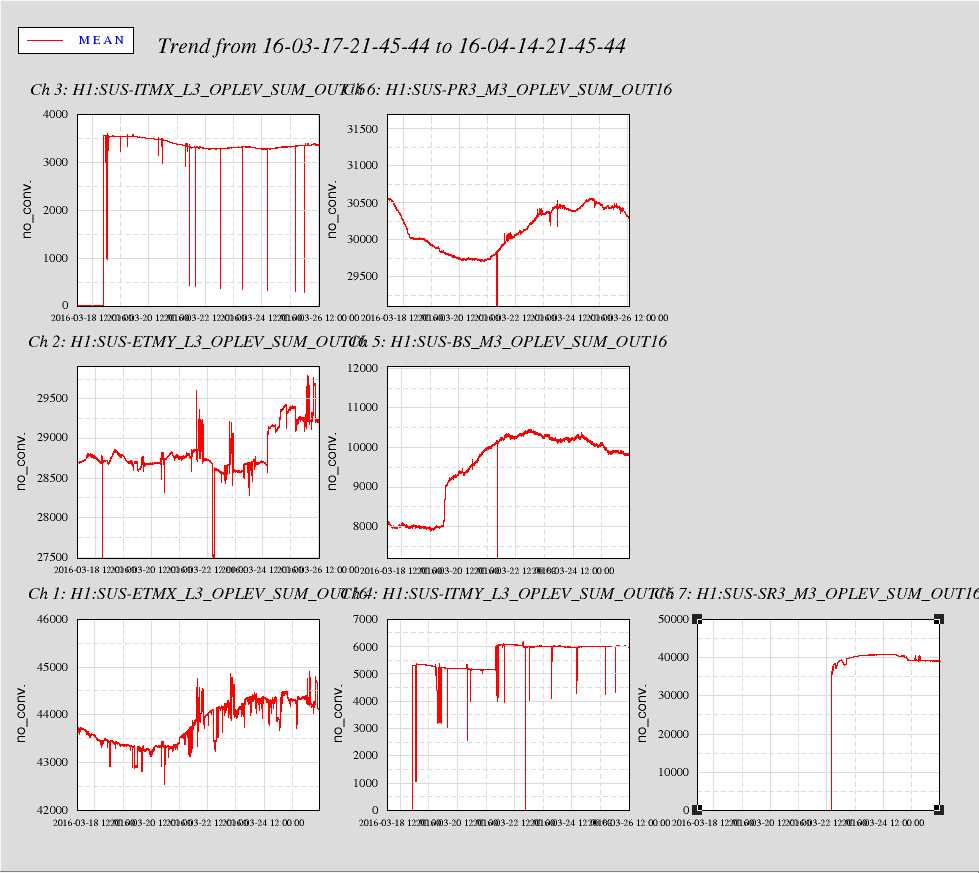
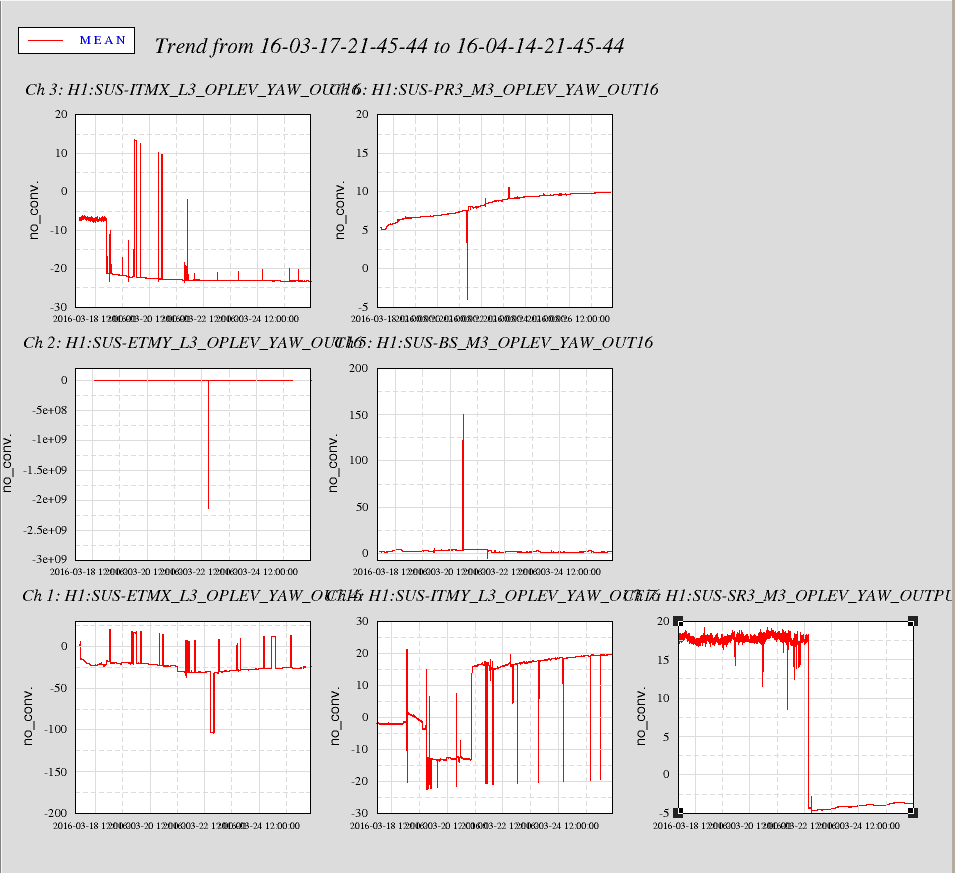
Also I attach a screen shot of trends showing the 2f RF signals during the same period.
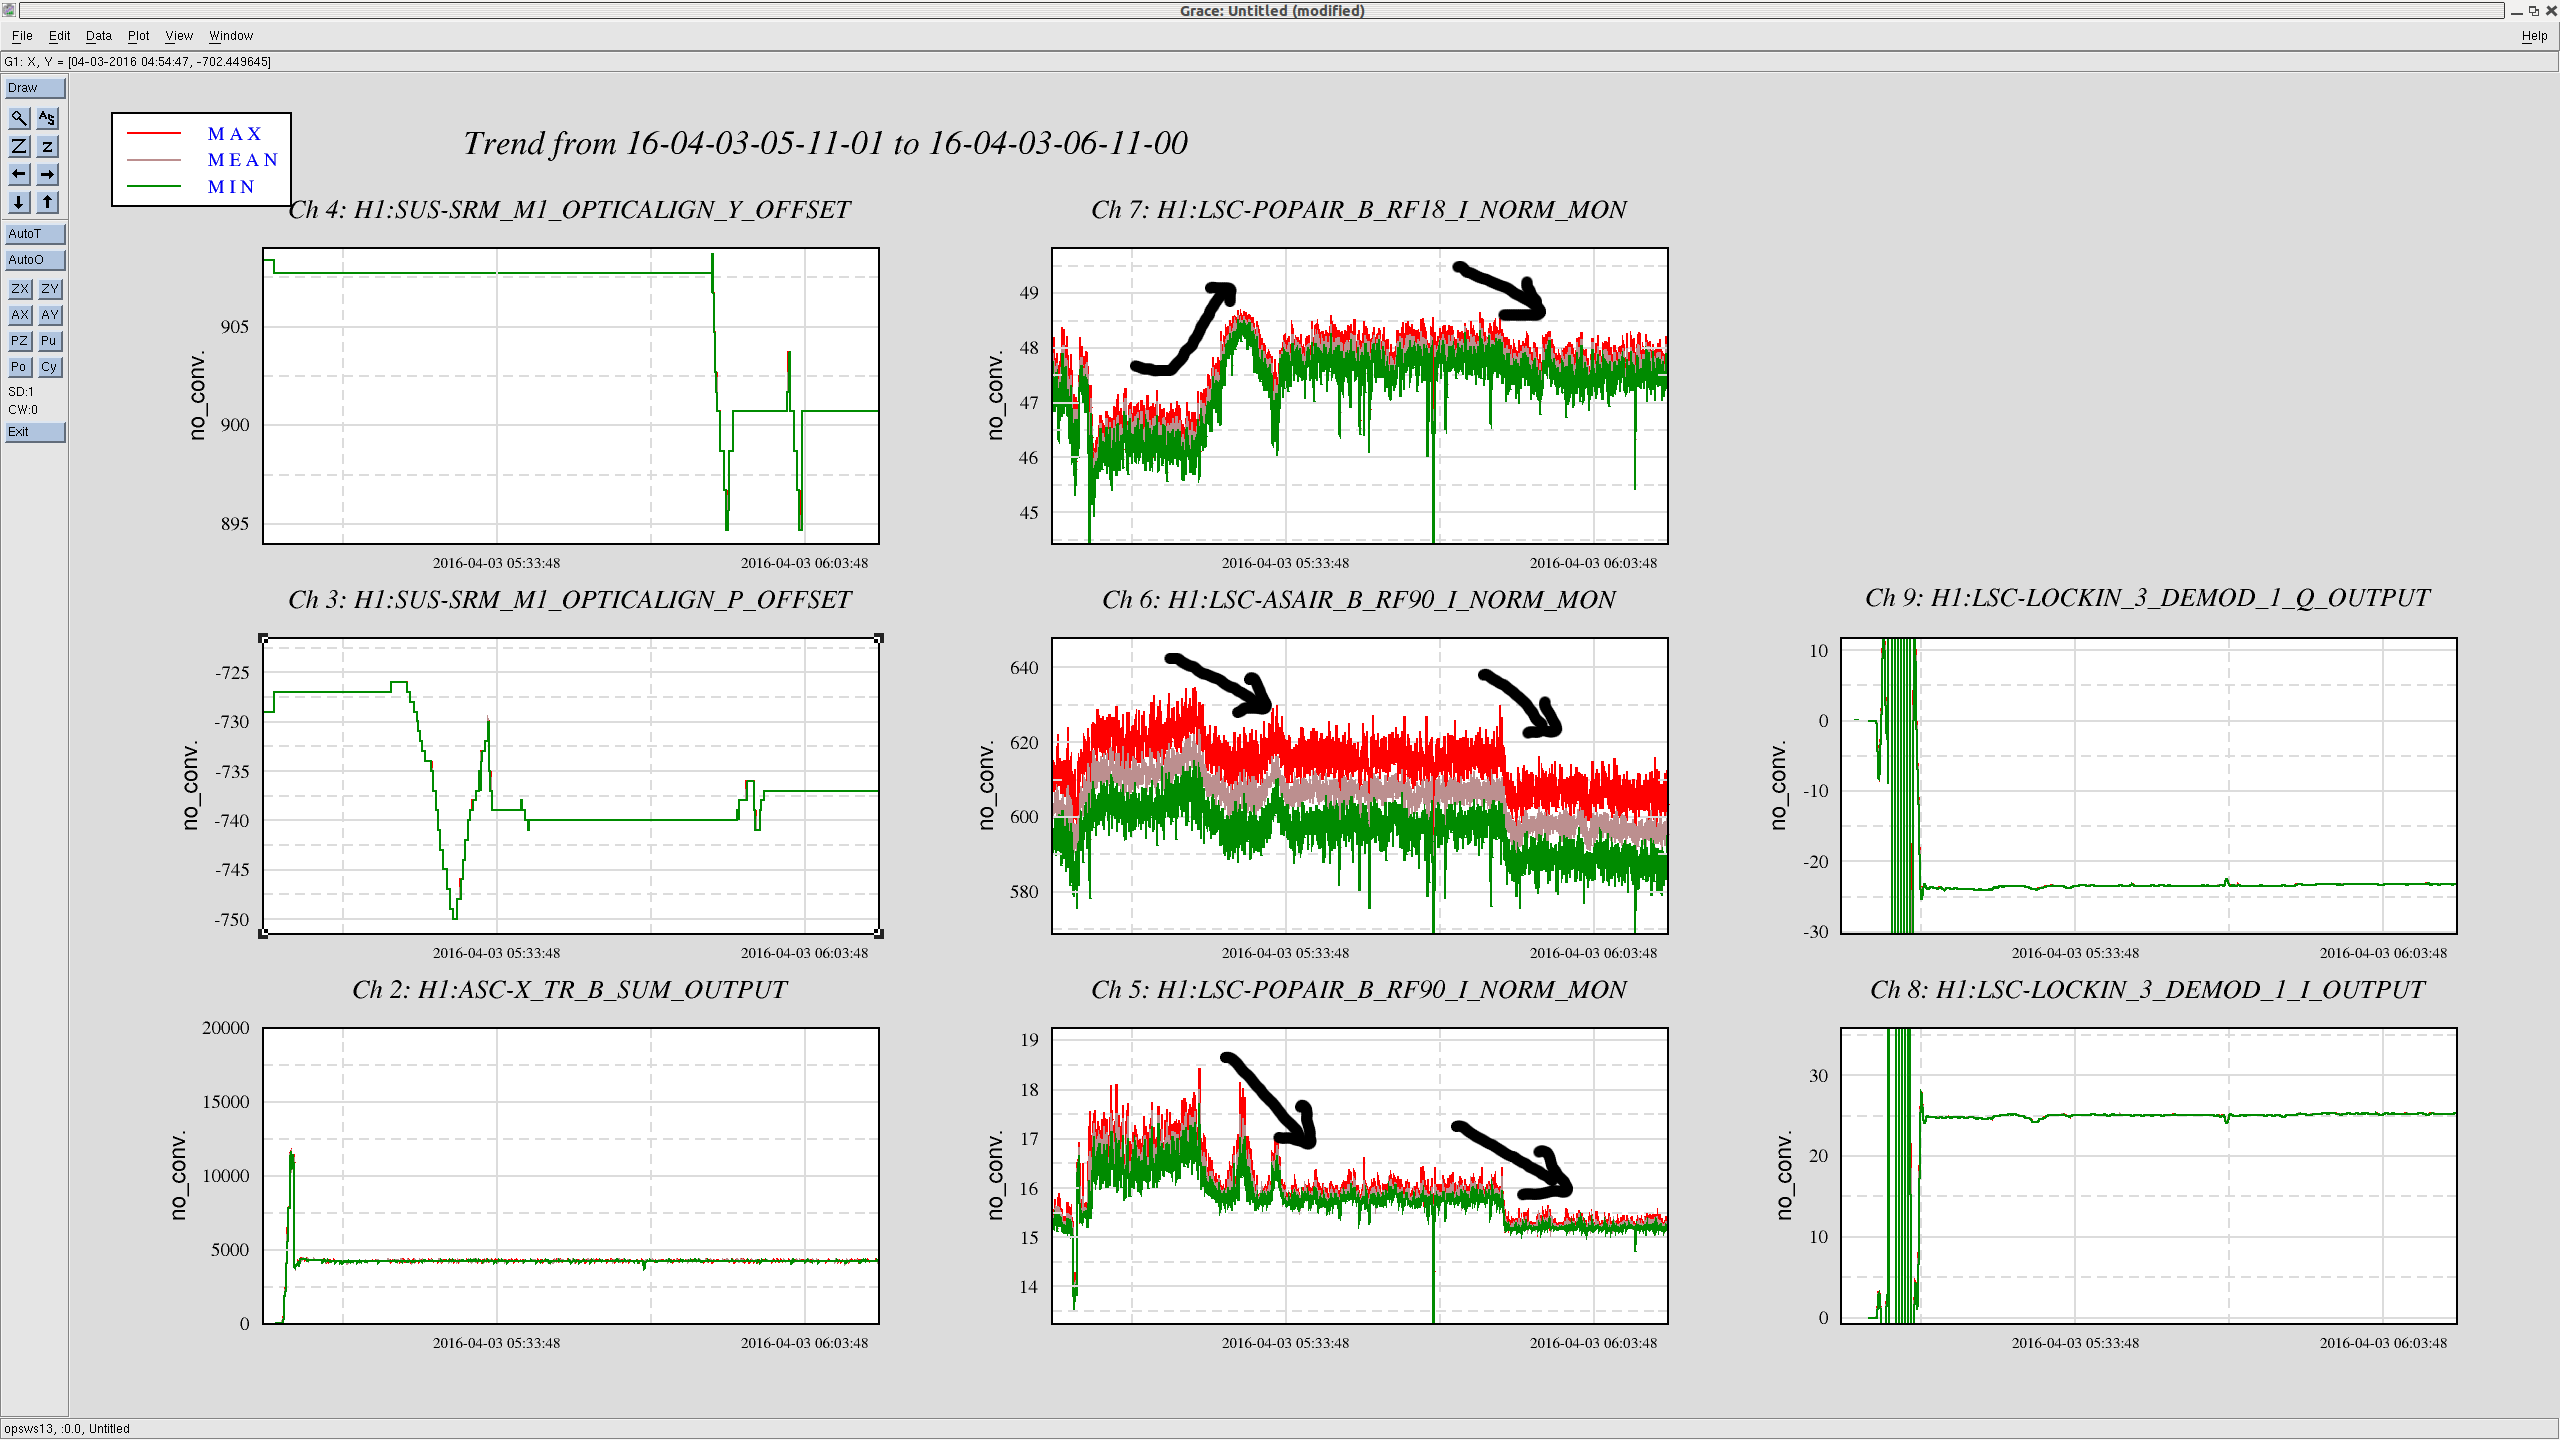
As the cavity pole increases the POP90 consistently decreases. This is what we expected because SRC sucks more light into it. POP18 also increased at the beginning which is good. However it decreased slightly after I aligned SRM yaw for some reason. The most outrageous one is AS90. As the cavity pole increased, the AS90 kept decreasing. I have no idea why.
Conclusion (again): it is the SRC alignment that changes the cavity pole.
[SRM and SR2 alignments]
I completely forgot about the SRC2 loop which controls the pointing of the output beam on to ASC_AS_C. This loop was active during my measurement silently correcting SR2 and SRM as I manually moved SRM. So I checked the witness sensors to see how much they actually moved instead of looking at my adjustment of the SRM alignment.
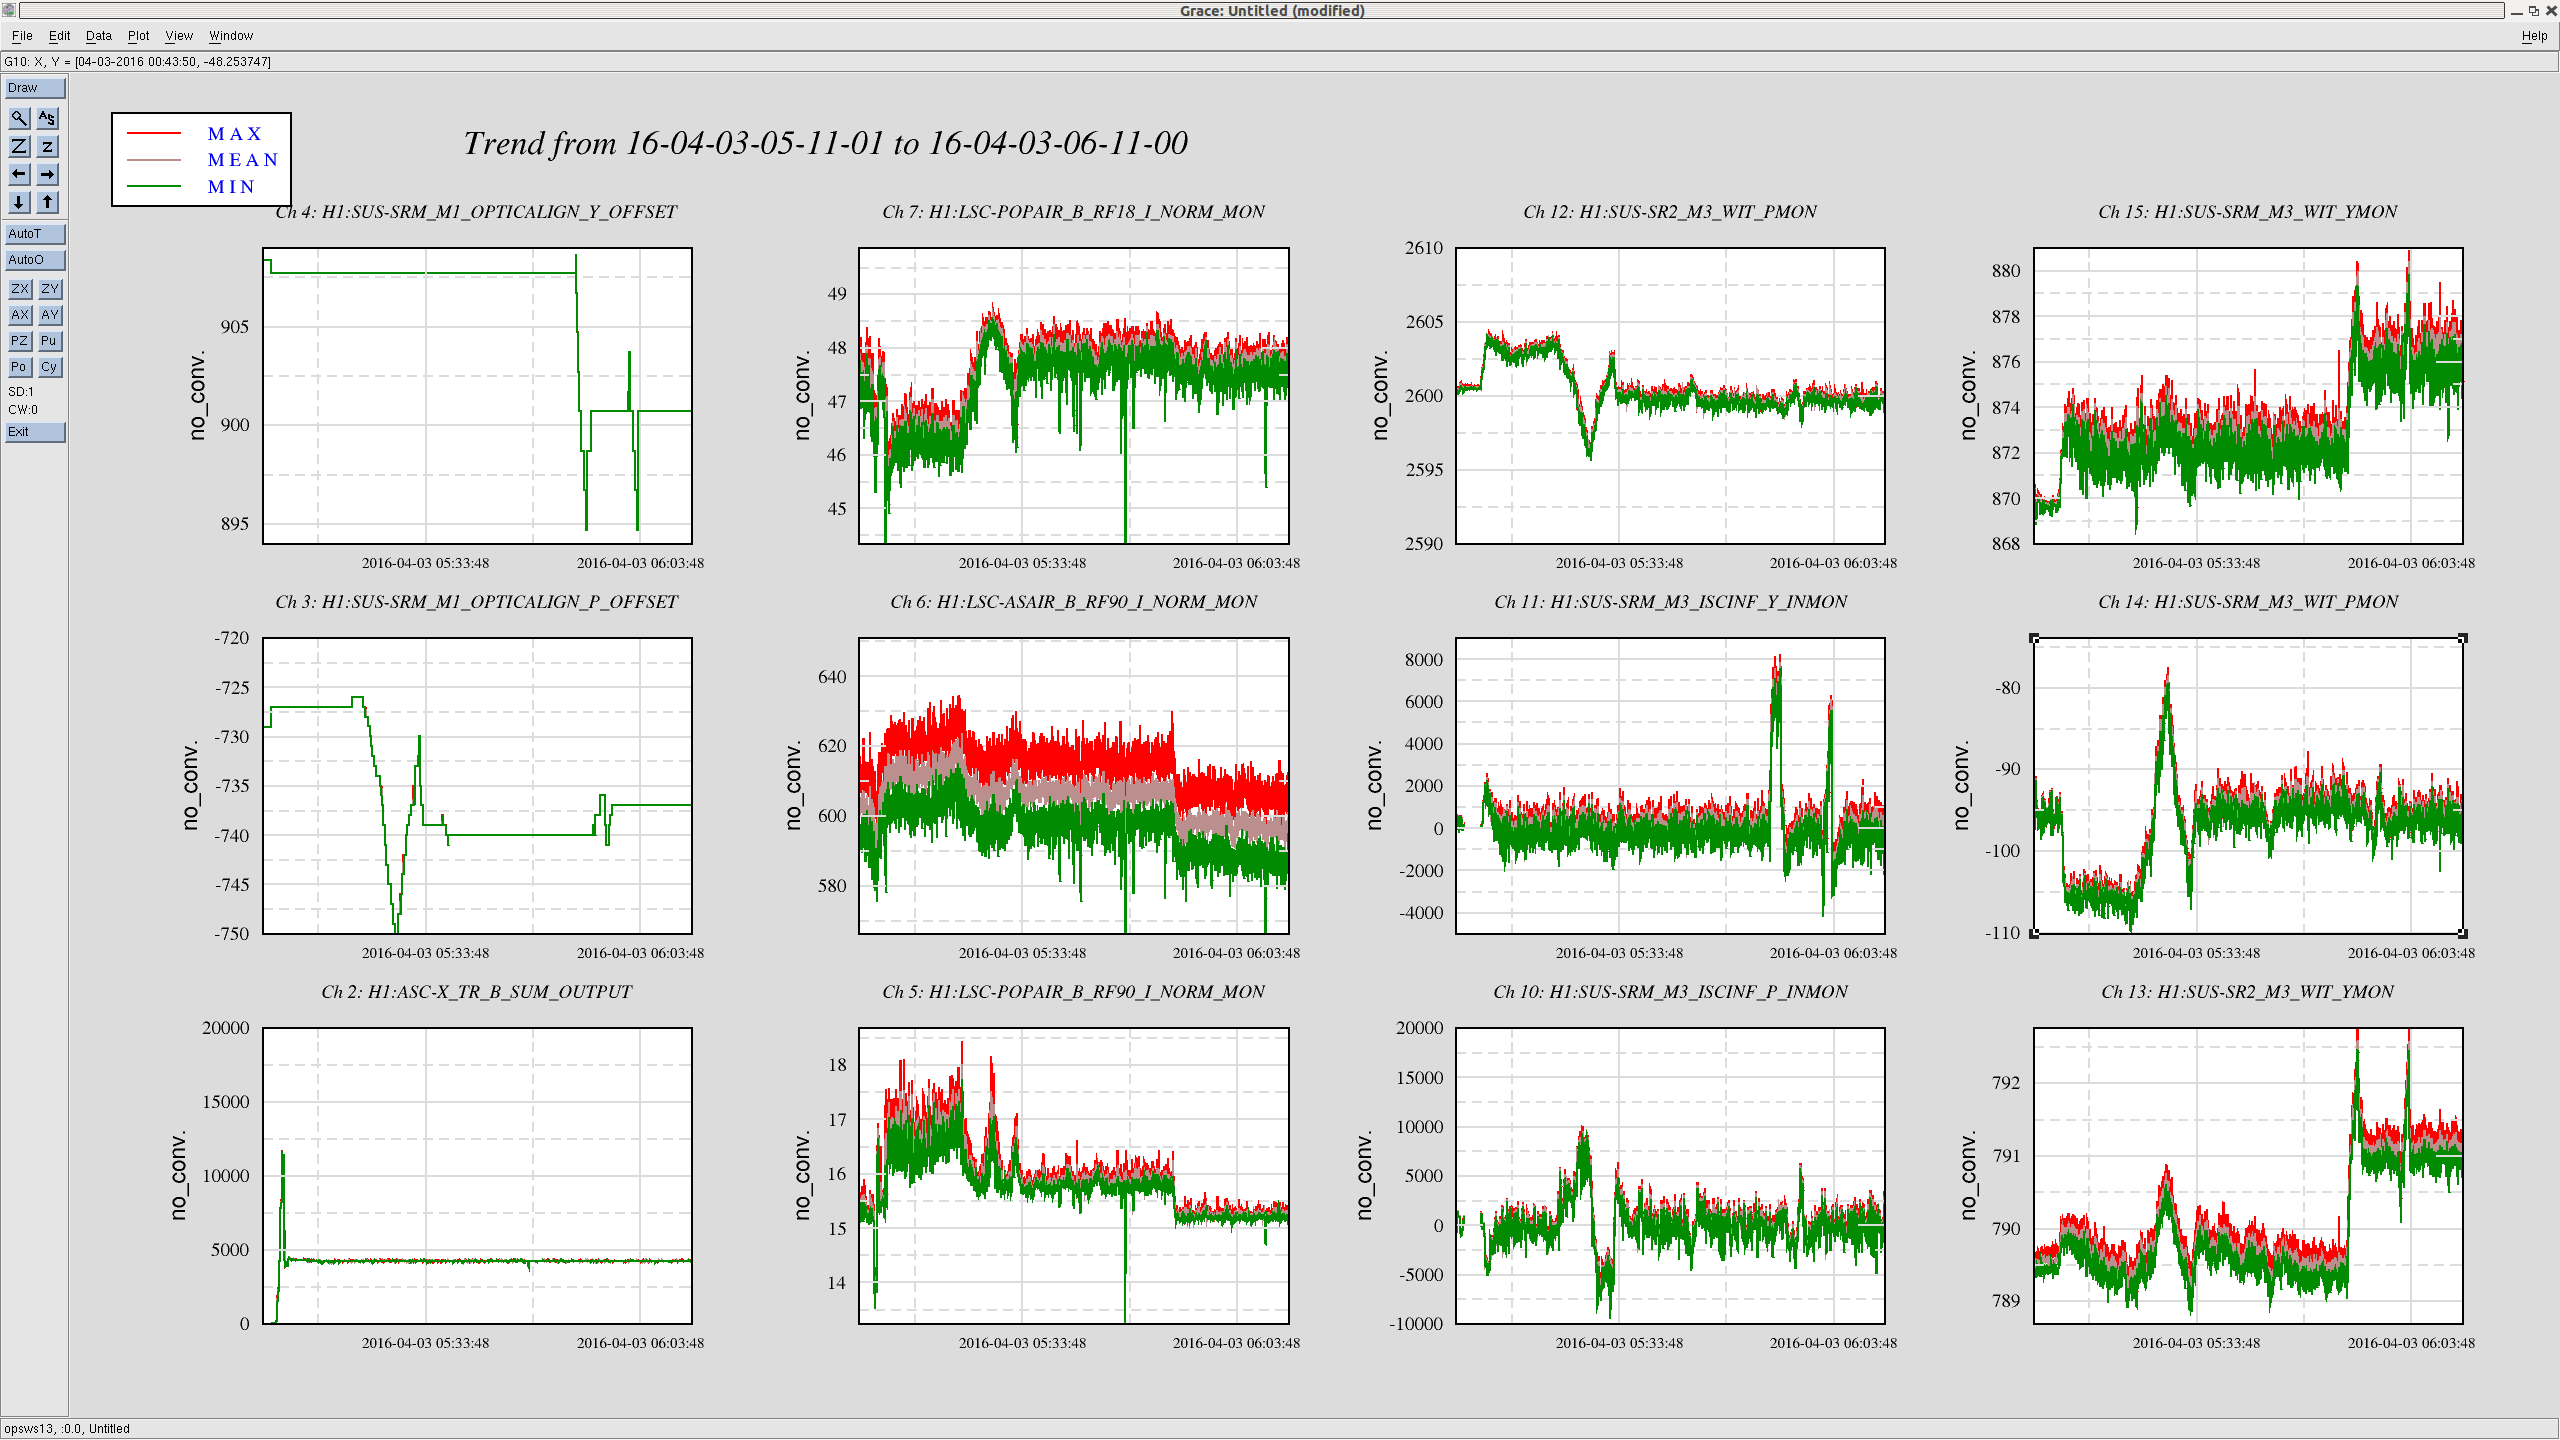
As you can see, SRM actually moved to the opposite direction in its angles due to the SRC2 loop counteracting on my adjustment. In total they have moved by the amounts listed in the table below.
| before | after | difference (after-before) | |
| SRM pit | -105 urad | -95 urad | 10 urad |
| SRM yaw | 873 urad | 876 urad | 3 urad |
| SR2 pit | 2603 urad | 2600 urad | -3 urad |
| SR2 yaw | 790 urad | 791 urad | 1 urad |
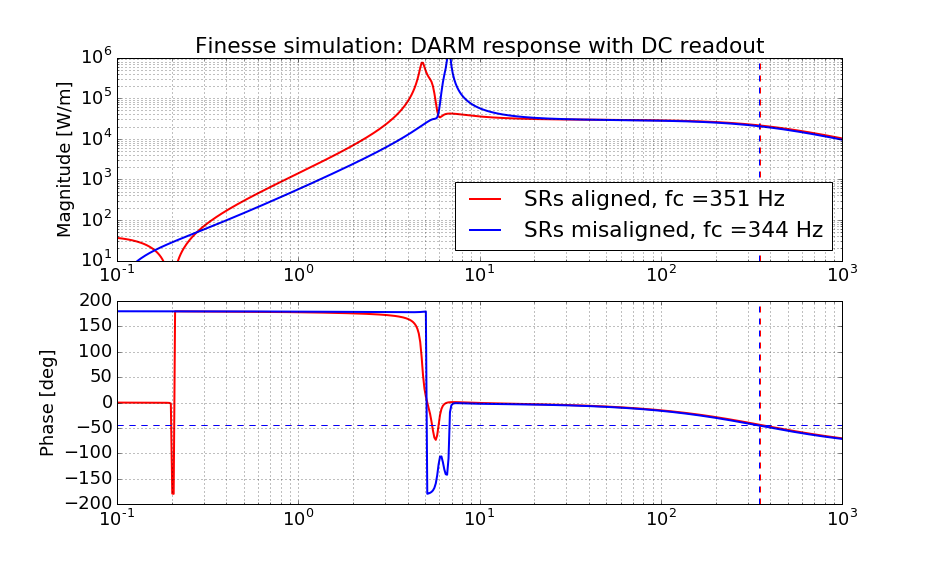
[A finesse simulation also suggests that the cavity pole is a strong function of SRs' alignment]
With the above misalignment values in hand, I then ran a finesse simulation to see if I can reproduce a similar result. Indeed, I could change the cavity pole from an optimum of 366 Hz to 344 Hz in the simulation (while my measurement was from 360-ish Hz to 345-ish Hz). The attached is a simulated DARM response with and without these misalignment.
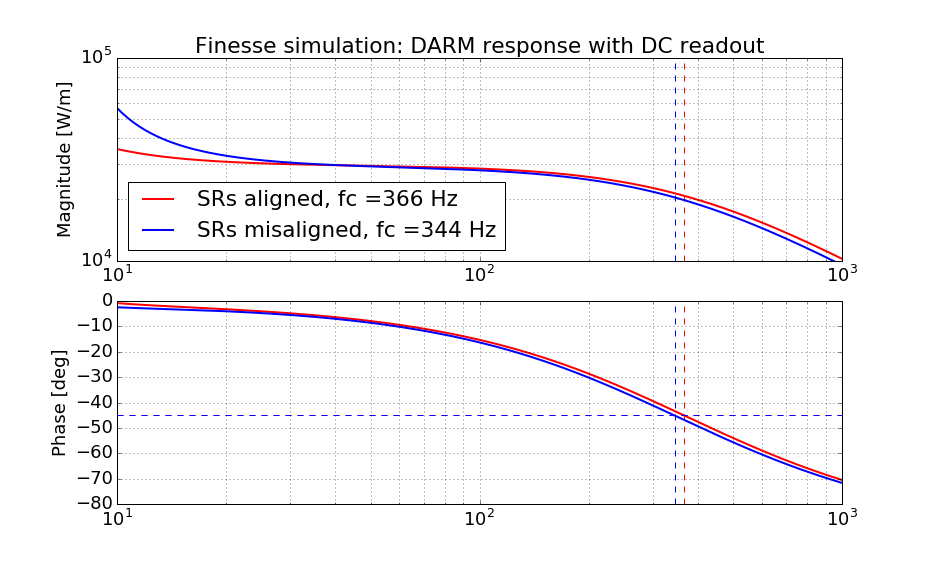
Because I was too lazy to fit out the effect of the time delay and next FSR peak, I simply searched for a frequency point where the phase rotates by 45 deg as a cavity pole frequency. This probably makes the absolute calibration of the cavity pole somewhat inaccurate, but the difference between the two cavity pole frequencies should be moreorless accurate.
Also I attach the finesse code in pdf format.
Addendum:
In the finesse simulation, the DARM response showed some difference at low frequencies between the two results. So I re-ran the same code and extended the frequency range to 0.1 Hz. It is seemingly due to a radiation pressure effect. I don't have a good explanation why it changed by SRs' alignment.