J. Kissel, E. Goetz
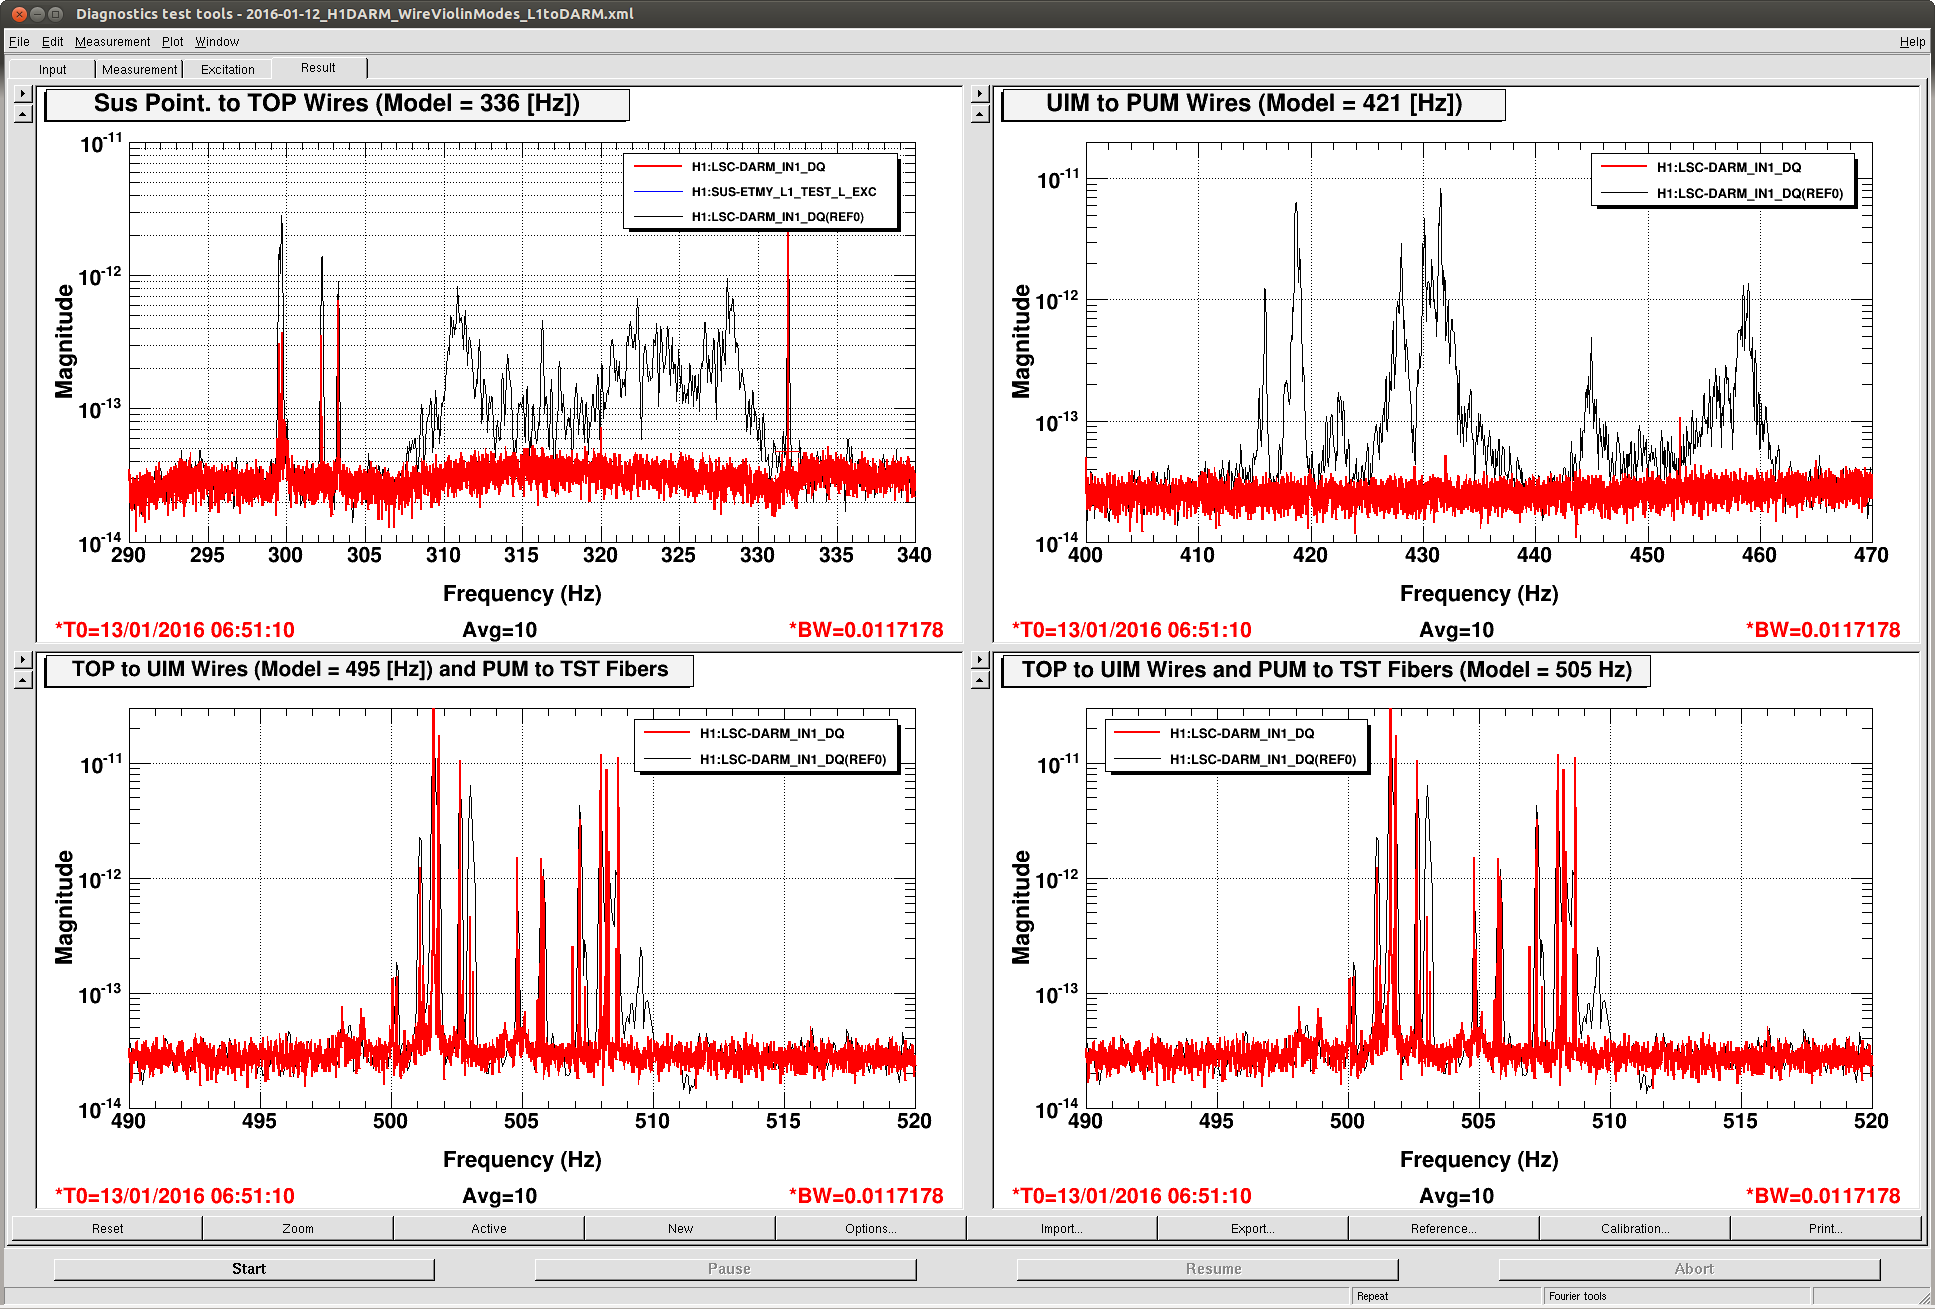
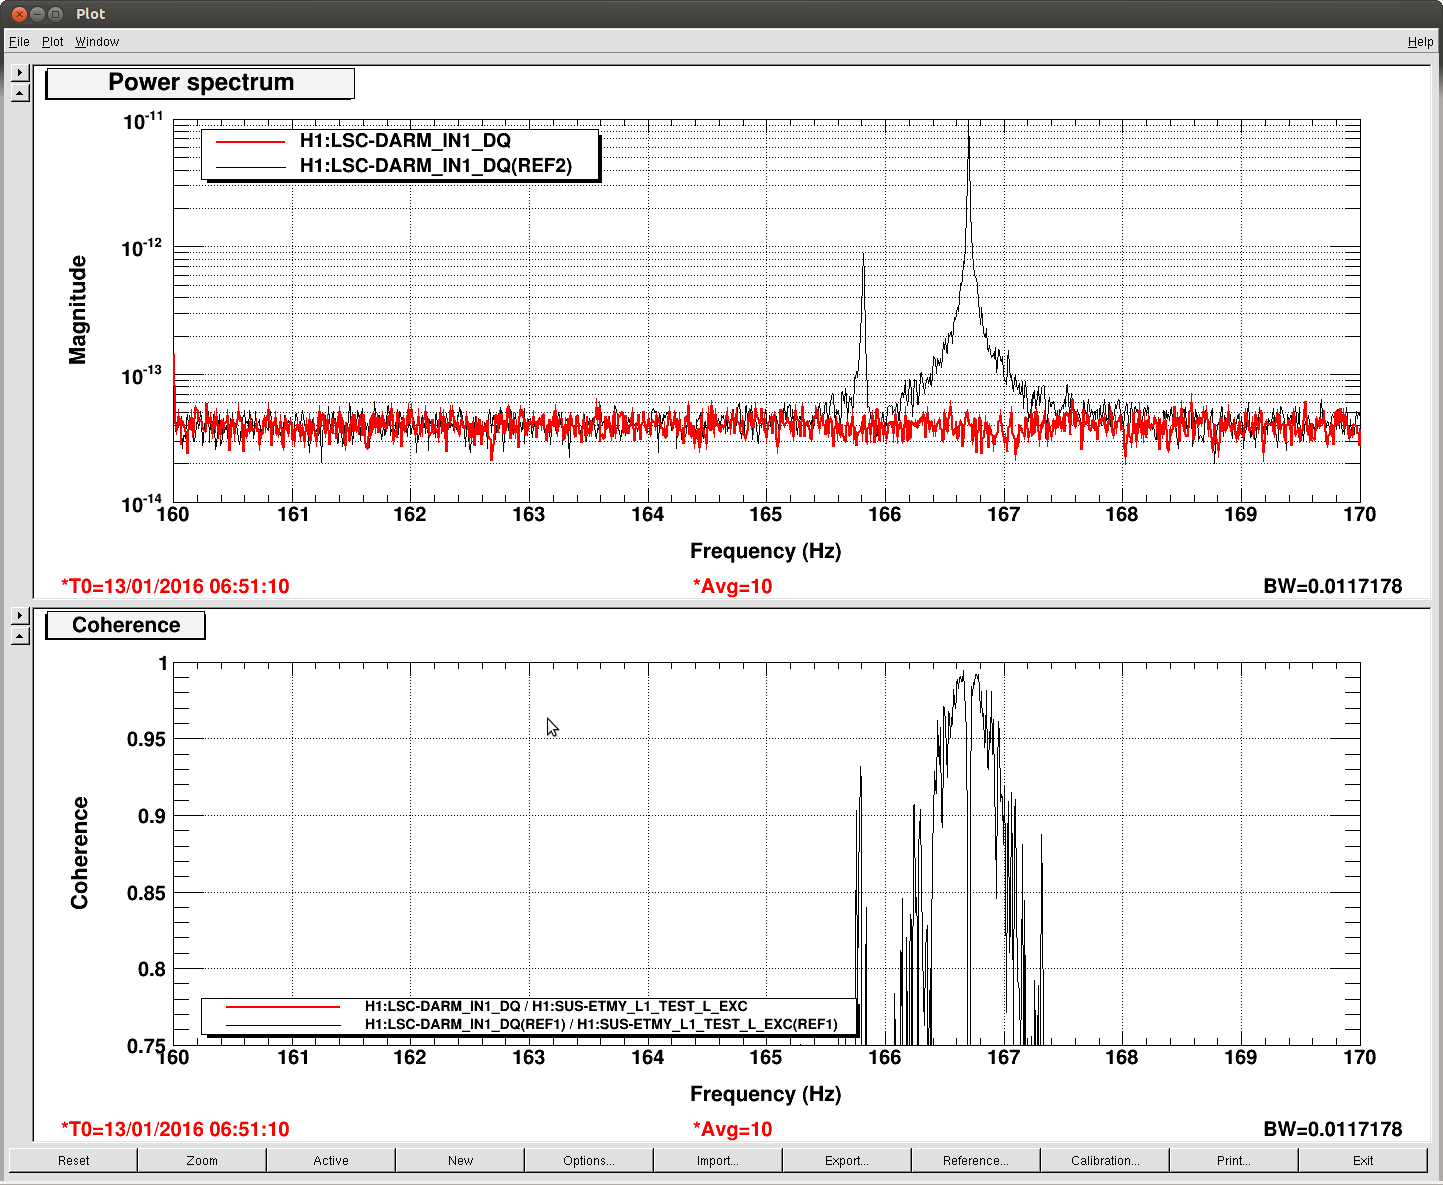
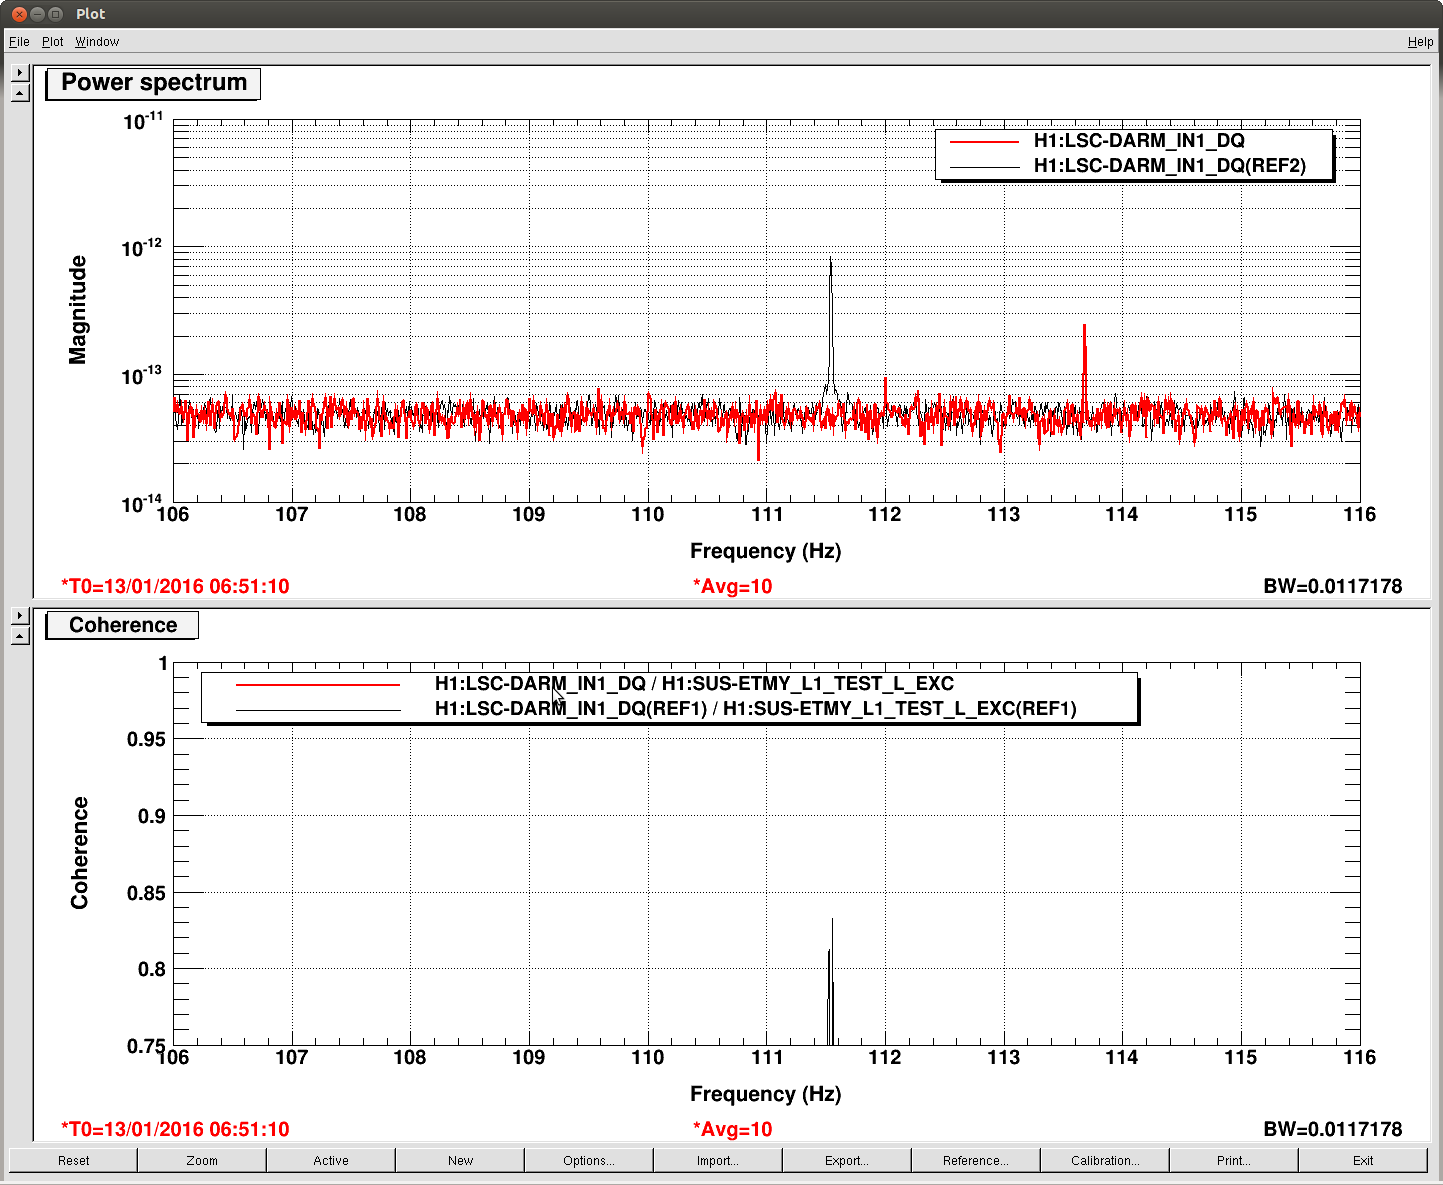
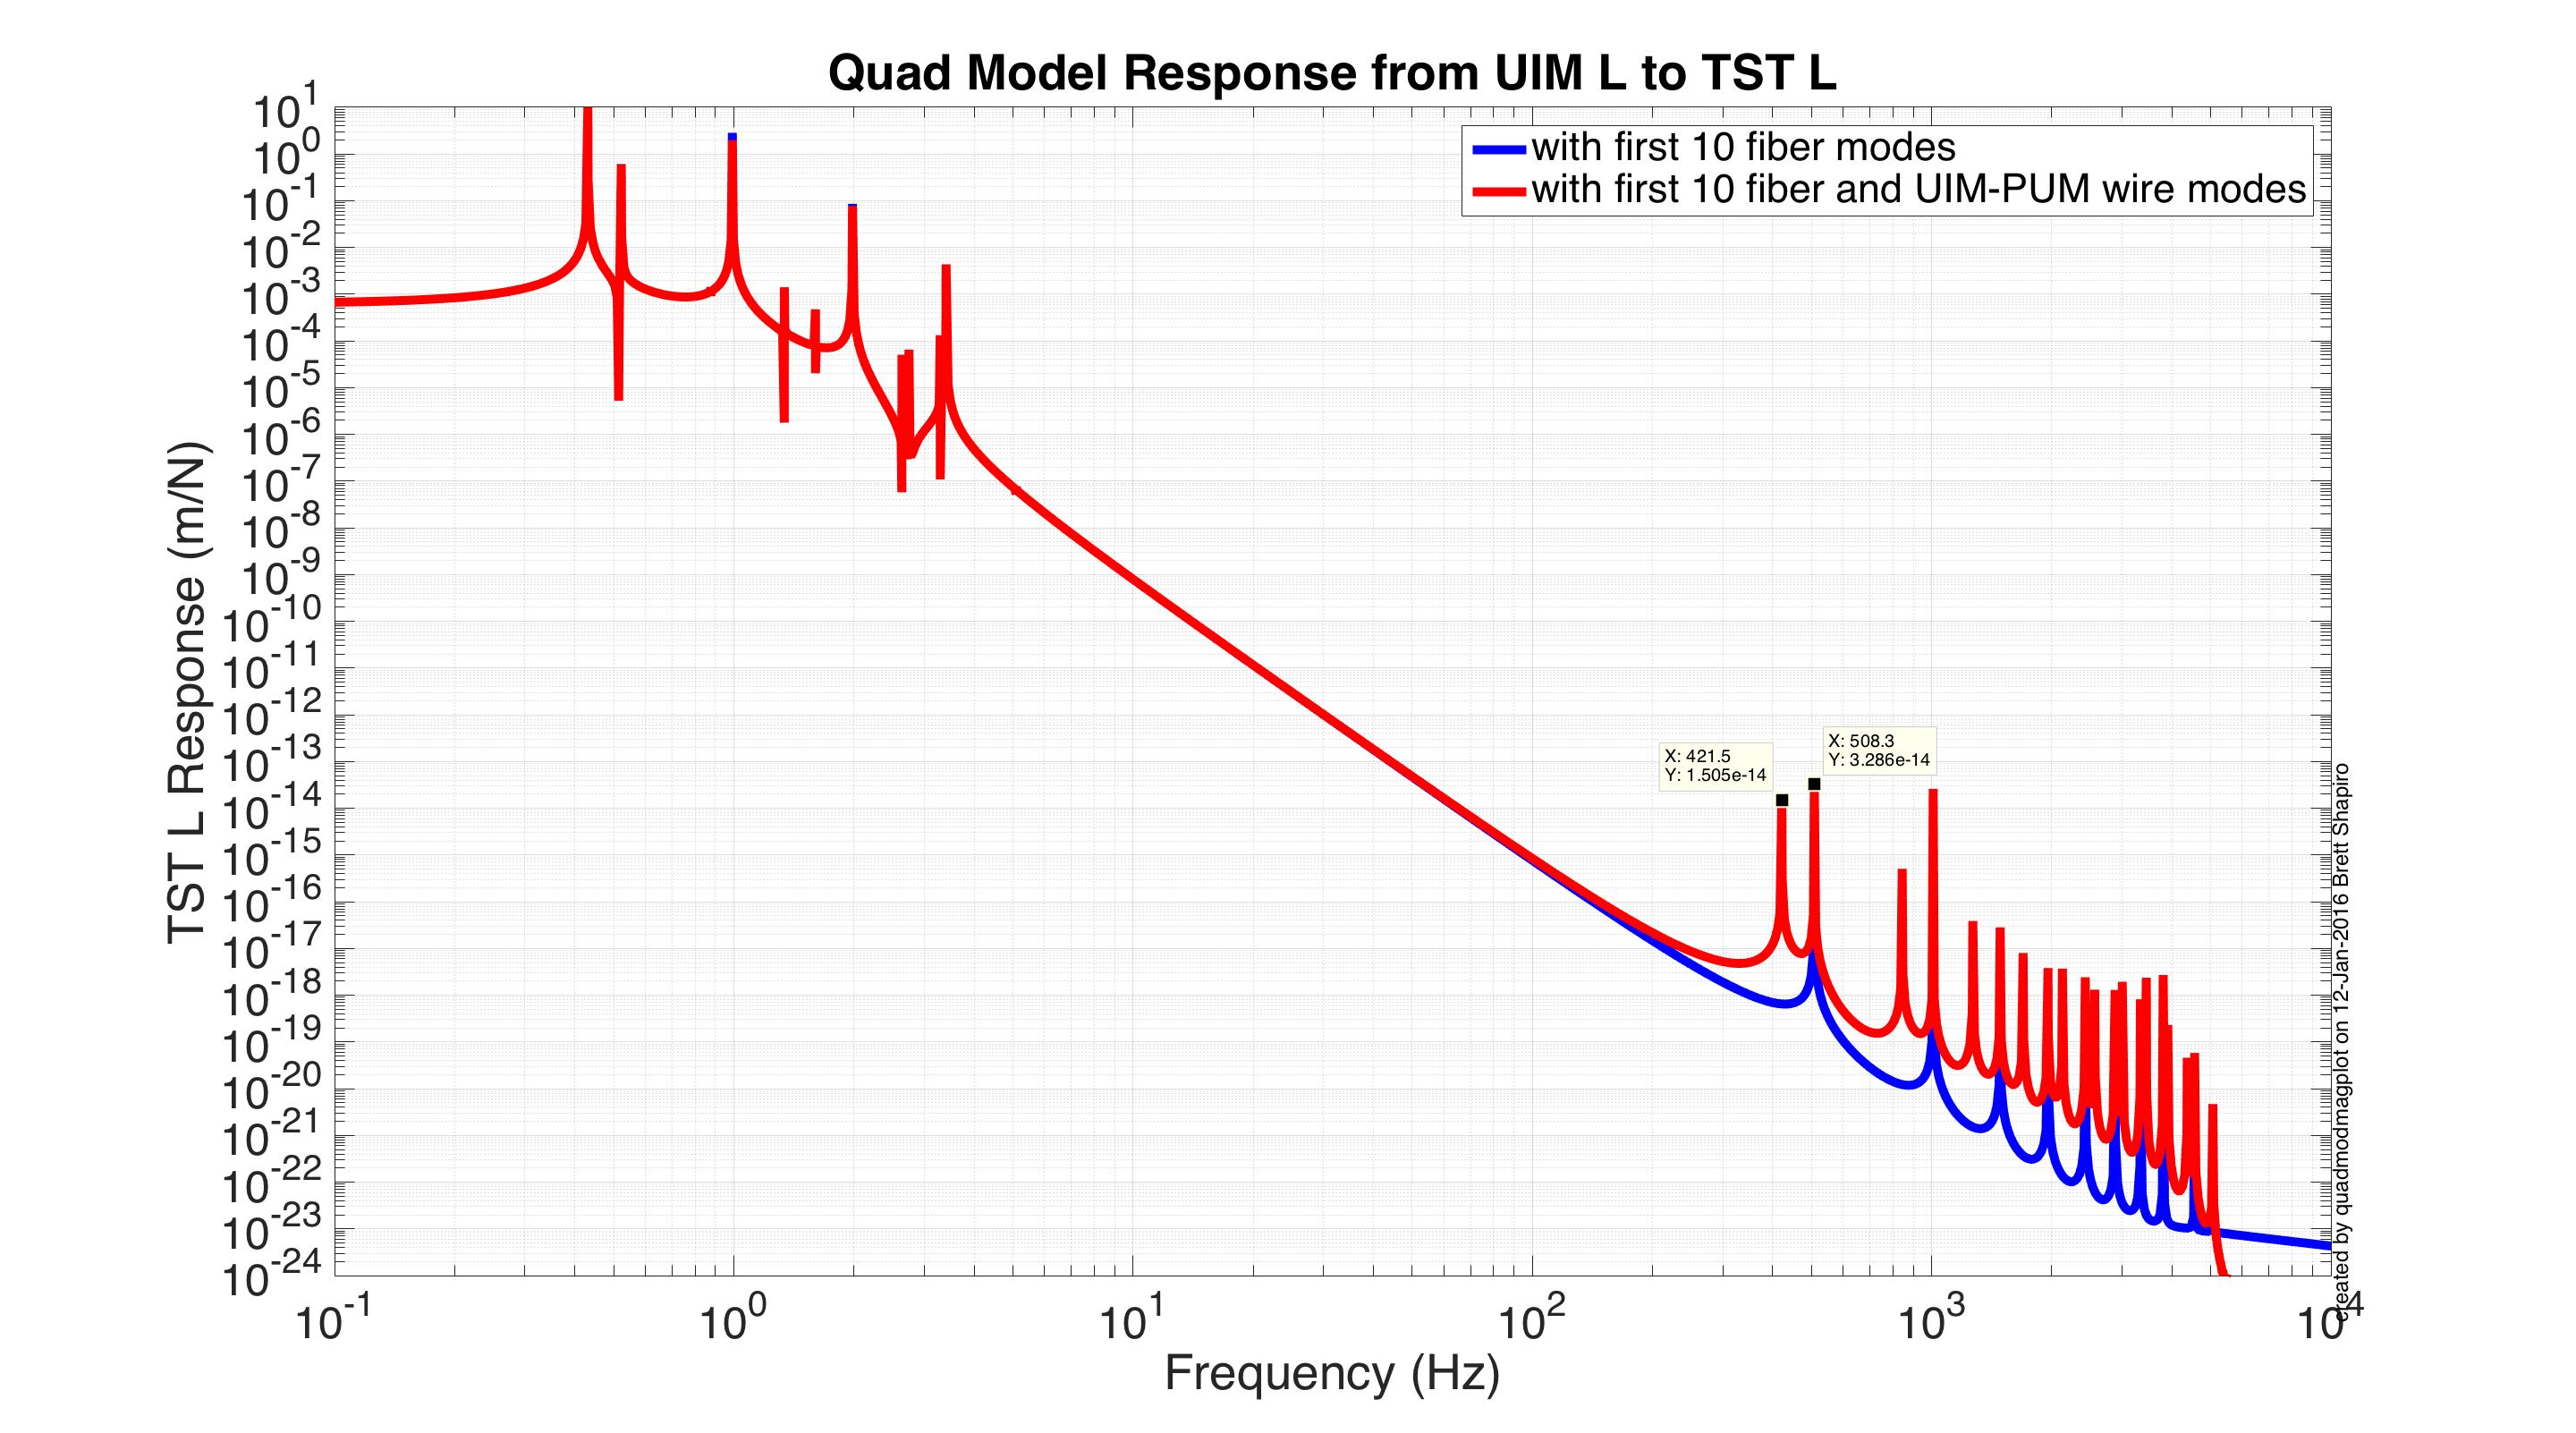
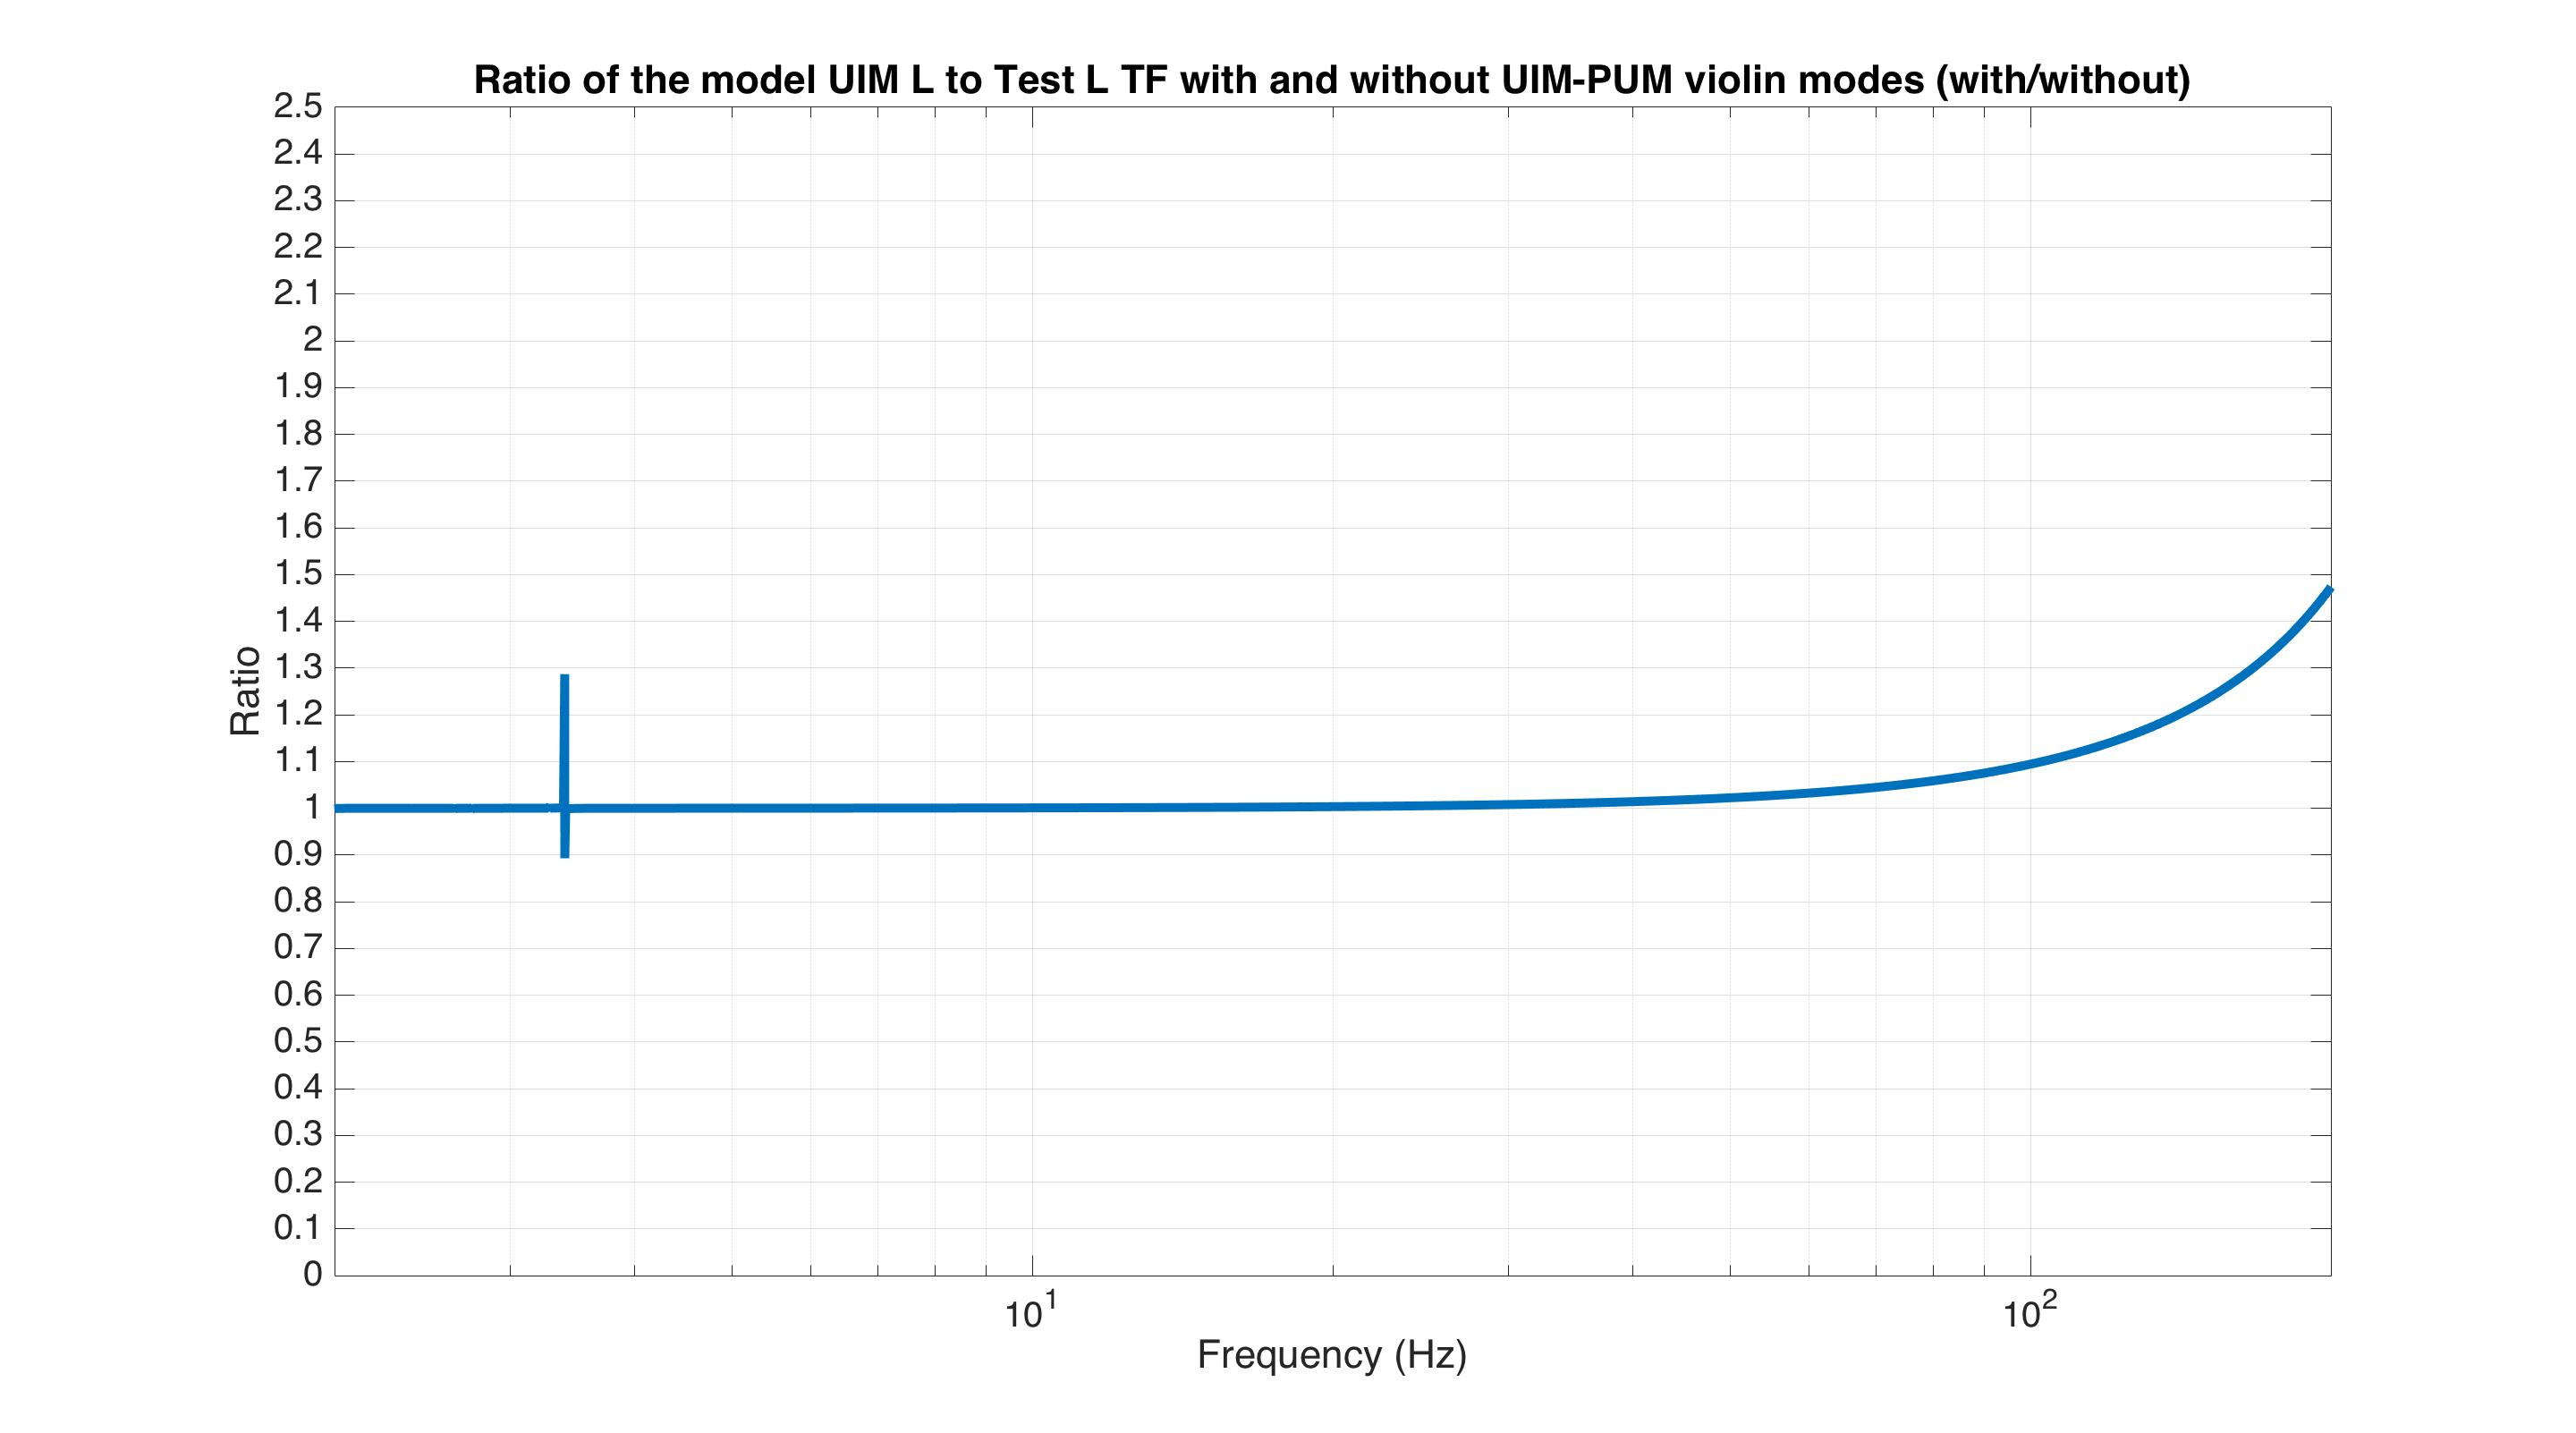
Having a few new breakthrough ideas on the UIM actuation system (see LHO aLOG 24914), we explored whether we are modeling the [m/N] L1/UIM force to L3/TST displacement transfer function incorrectly. This was done by driving the UIM out to 600 [Hz] and measuring the response in DARM. Not only did we find the expected-but-not-yet-modeled wire violin modes at ~330 [Hz], 420 [Hz], and some at ~500 [Hz], but we found several bending-mode resonances at 111 [Hz] and 166 [Hz]. Indeed, upon first glance, we think the 111 [Hz] resonance is the remaining missing frequency dependence that explains the turn-up seen at 100 [Hz] in all previous measurements of the UIM to TST transfer function.
We'll process in more detail some time in the future, but check out the attached screen shots and be amazed at how not 1/f^6 the L1 to L3 transfer function is.
--------
We'd started by exciting the L1 stage via awggui in a broad-band fashion such that we could catch all of the wire violin mode frequencies watching DARM. As Evan mentions, we had suspected that these wire resonances -- documented in T1300876 -- were the source of the deviation from 1/f^6, and they'd just not been included in the SUS dynamical model -- [[EDIT -- Brett has now included them in the model, and they are a non-negligible effect; see LHO aLOG 24915]]. This broadband TF is shown in the first attachment. Black is the with excitation ON, and red is ambient (to distinguish the ~505 [Hz] fiber violin modes from the ~495 [Hz] TOP to UIM wire violin modes, and the Beam Splitter violin modes & 331.7 [Hz] calibration line from the Sus. Point to TOP wire violin modes). Only the peaks of the wire violin mode resonances are visible above the DARM noise; driving them any higher breaks the IFO's lock.
Just in case, we drove down to the same ~80 [Hz] region, and BINGO! We also found new, unexpected resonances at 166 [Hz] and even as low as 111 [Hz]! (see second and third attachments) Our best guess for the source of these resonances are imperfect actuators. Perhaps the bending of the L-bracket that mounts the OSEM coil to the reaction chain's UIM (see D060375, see page 1 for the total assembly, lock at pg 14 for the L-bracket). Though, if it were these L brackets, I'd suspect there would be 4 independent resonances... also it doesn't look like enough moving mass to have resonance frequencies as low as ~100 [Hz]... dunno, will think more.
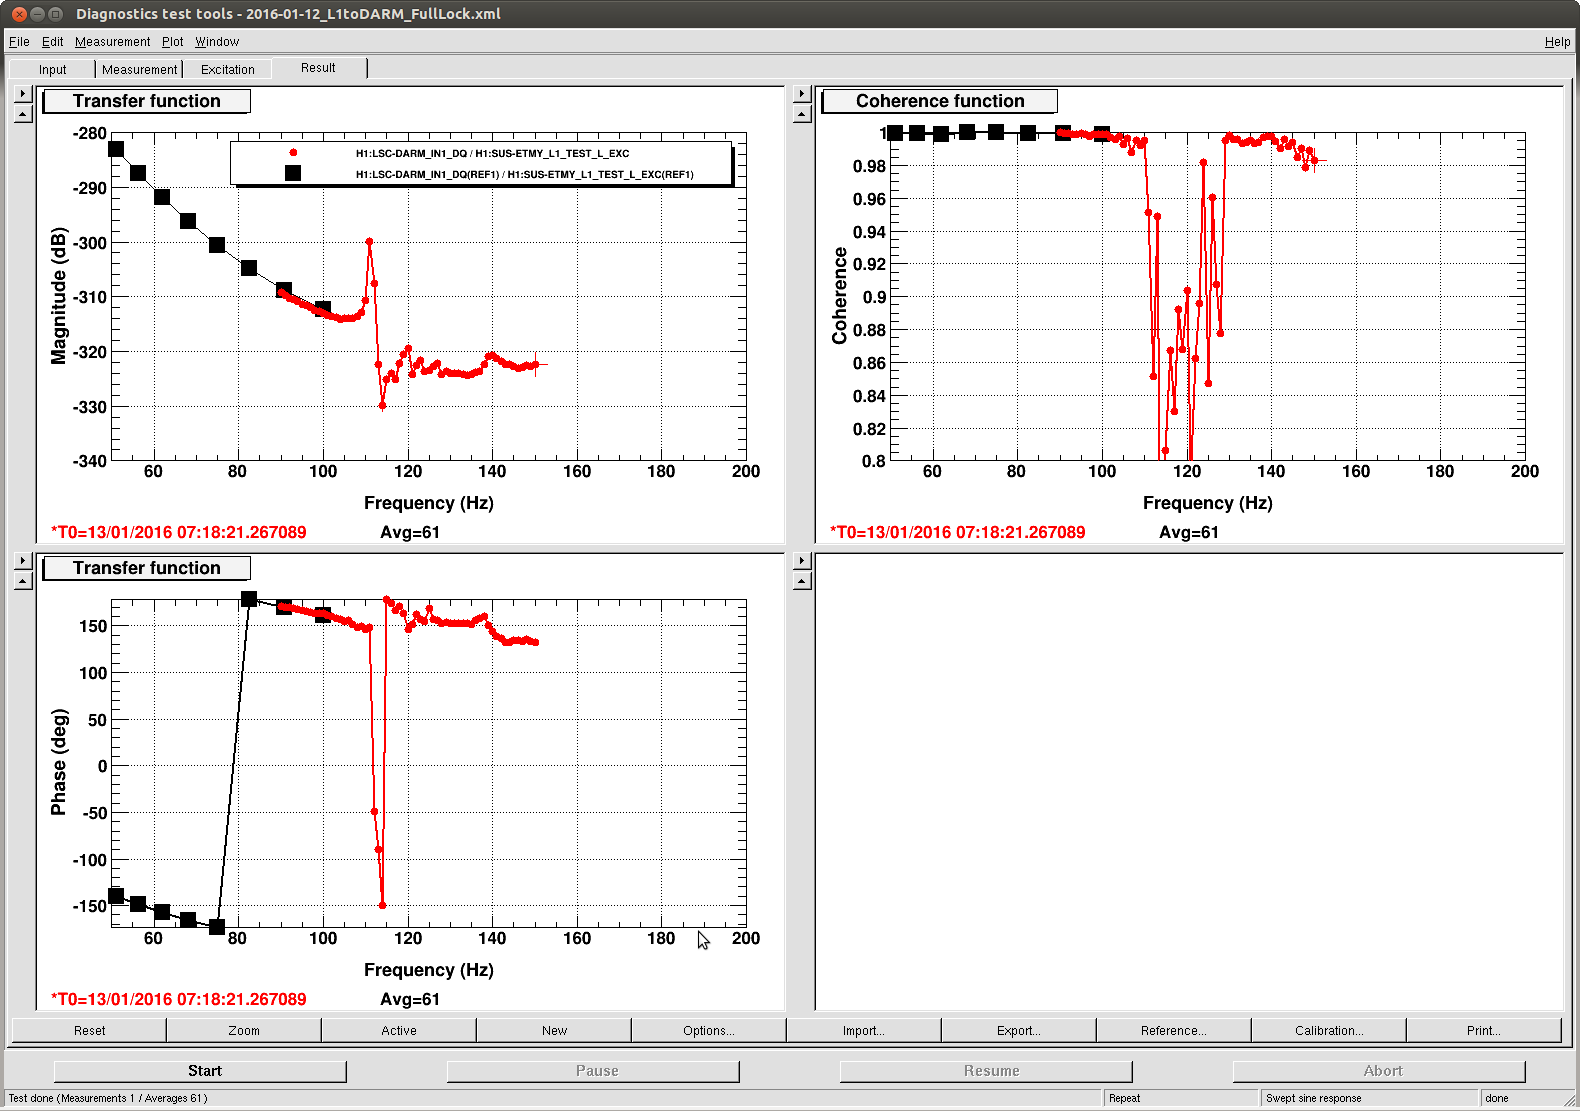
Finding something at 111 [Hz], we then took a careful swept sign measurement covering it, and indeed, it looks strikingly like another piece of the UIM puzzle. (see 4th attachment). We also grabbed a PCAL to DARM transfer function over this frequency vector, so we can turn the TF into an absolute calibration later.
For future reference, the templates for the swpet sine TFs are here:
/ligo/svncommon/CalSVN/aligocalibration/trunk/Runs/PostO1/H1/Measurements/FullIFOActuatorTFs/
2016-01-12_L1toDARM_FullLock.xml
2016-01-12_PCALYtoDARM_FullLock.xml
and I attach screenshots of the awggui sessions used to excite L1 and PCAL in a broad-band fashion (DARM_IN1 ASDs during the broad-band excitations were taken using the standard wall FOM for DARM).