I talk about a "new" filter in this alog. Before I get yelled at, I only tested it, I asked first, we are not running it anywhere, no changes have been made to the ISI configuration, the foton files in the SVN are all still current. Thank you.
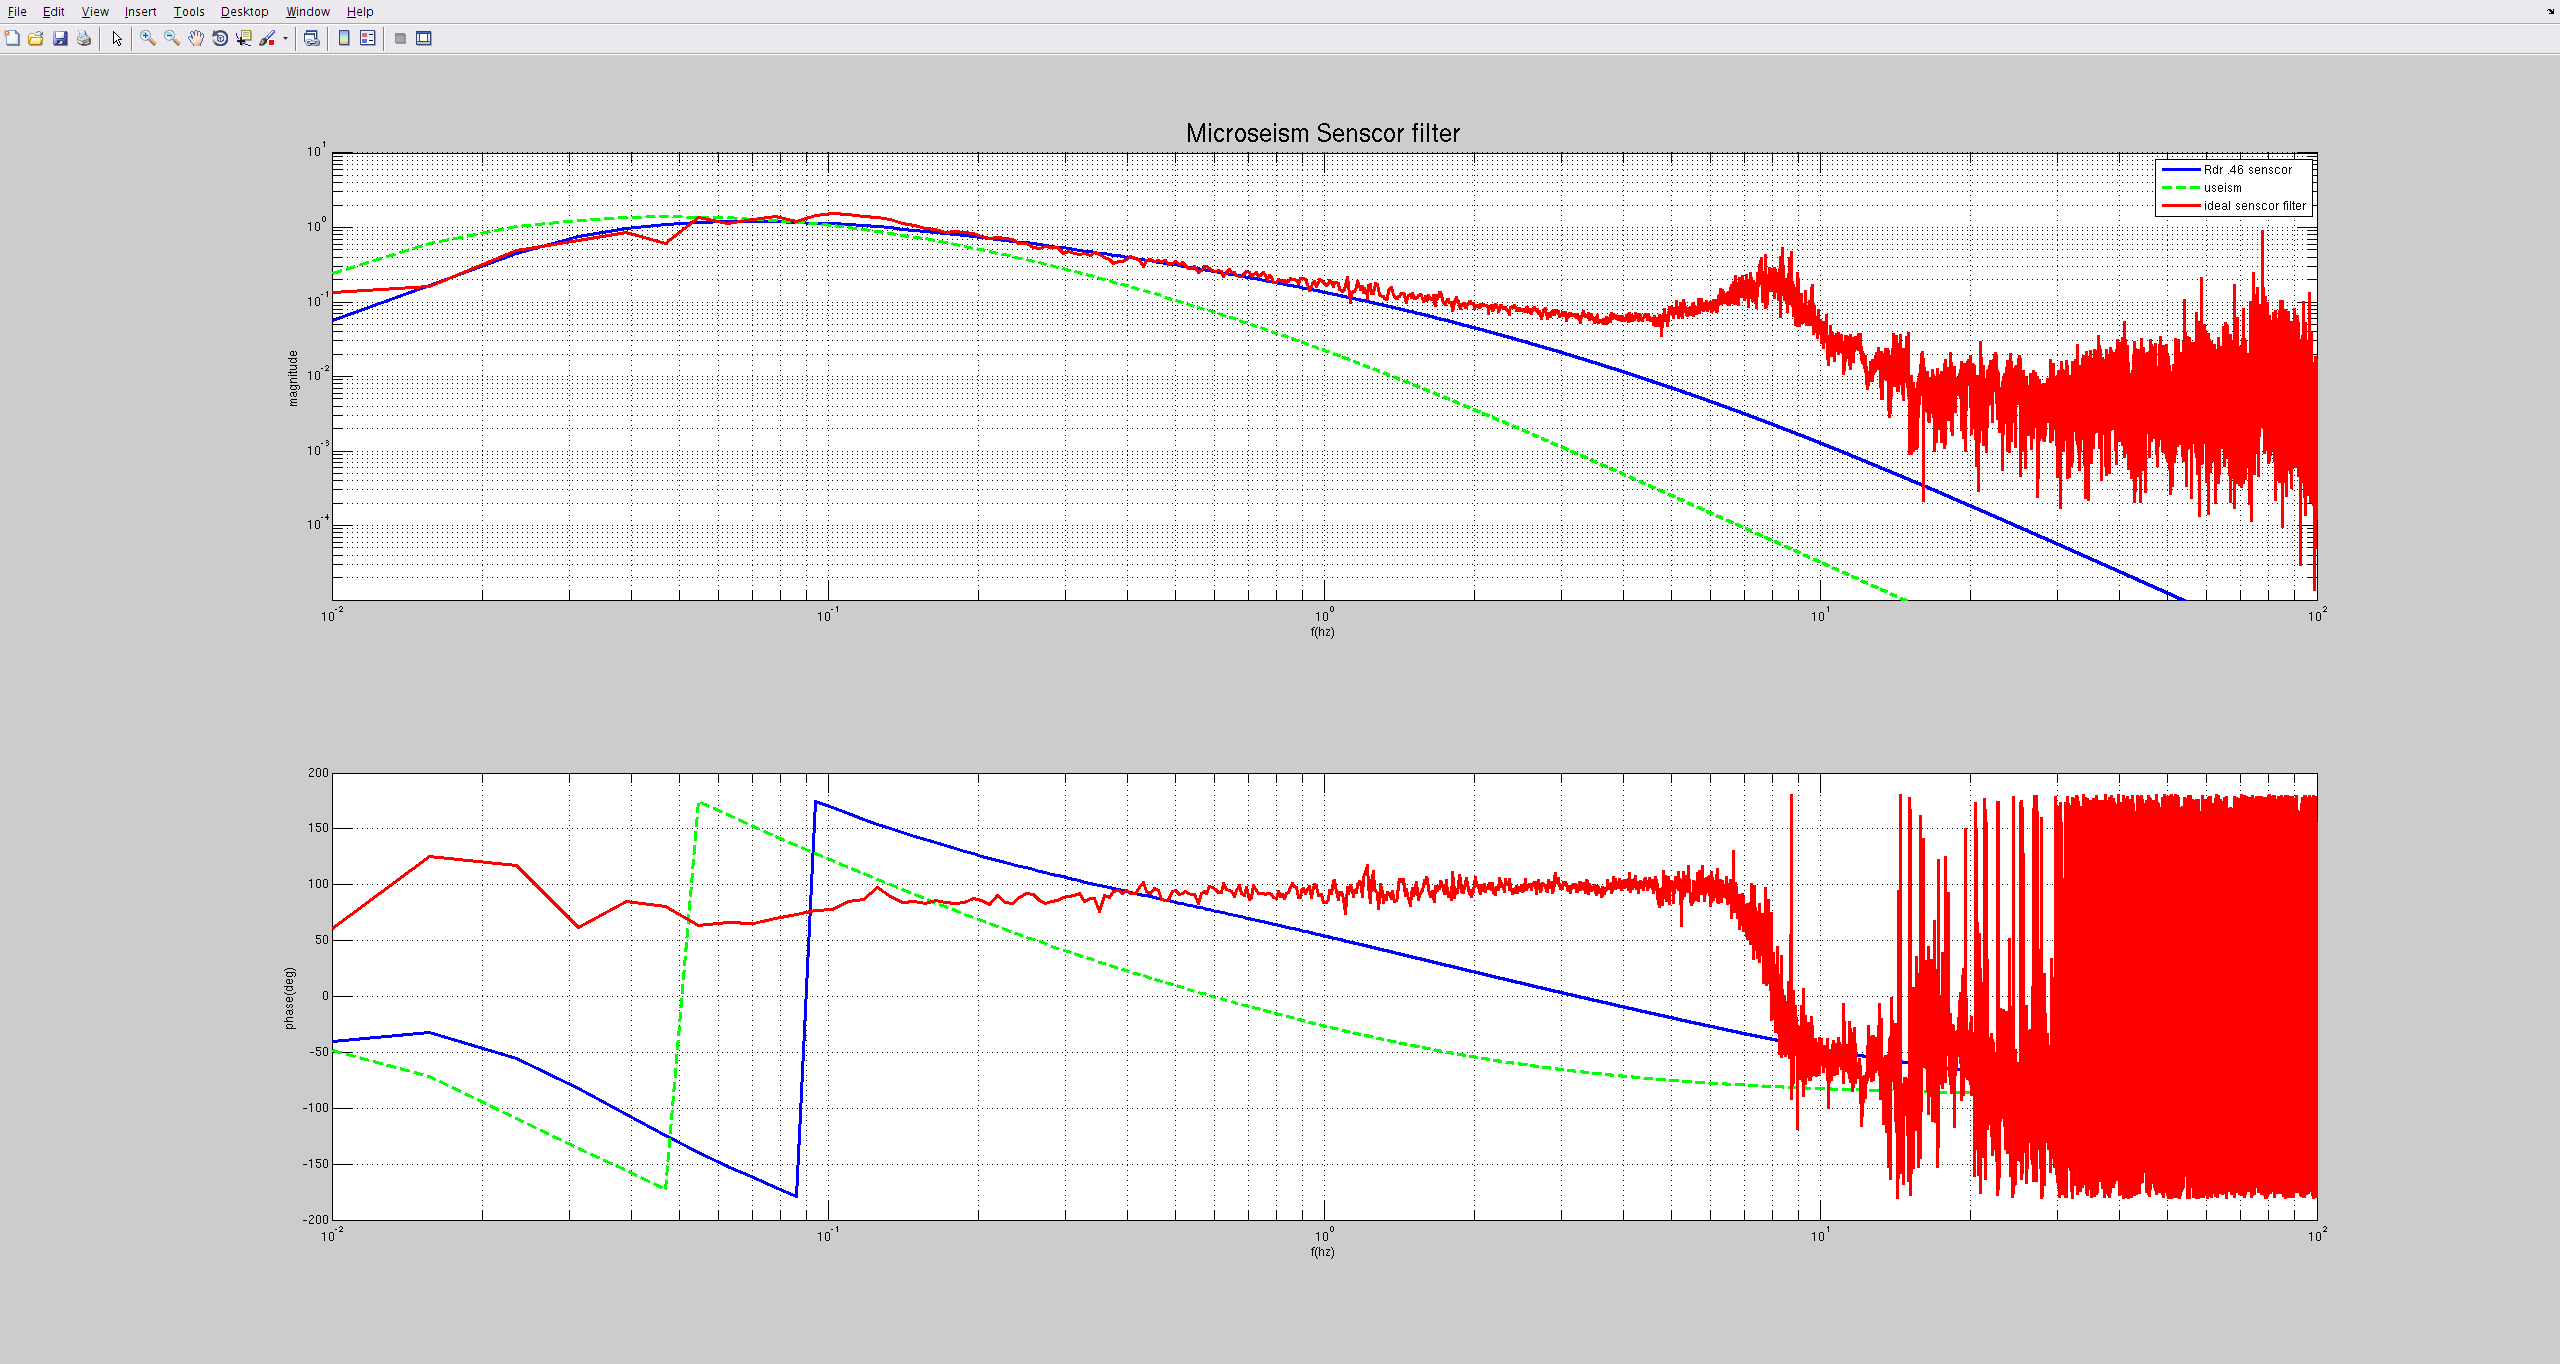
On Friday, high winds and high microseism were making locking impossible, so I took the time to mess around with sensor correction. The current X/Y rdr sensor correction was designed to give very minimal gain peaking, while providing extra isolation around the .46 hz quad resonance. This helps LHO out, because it is difficult to roll off a 90mhz CPS blend off quickly enough to get good isolation at half a hz. At LHO we typically use a 90mhz blend because our useism is low enough that we can tolerate being locked to the ground in the .1-.3 hz band, and the 90 mhz blends have less gain peaking at frequencies ( < .1hz ) that cause problems for the ASC loops. When useism is high, however, we have to use a 45mhz blends, but these blends couple in more platform tilt at bad frequencies, a problem that gets amplified when winds are high. I wanted to see if it was possible to change the sensor correction to provide some isolation at the microseism, while giving up the gains at half a hz. I based my design on the current one, I just pushed the region where the phases matched up to lay on top of the microseism peak. The fifth picture is a quick and dirty plot I used to design the filter in Matlab. Blue is the current filter, green is my new filter, red is a ratio of transfer functions that indicate the "ideal" filter.
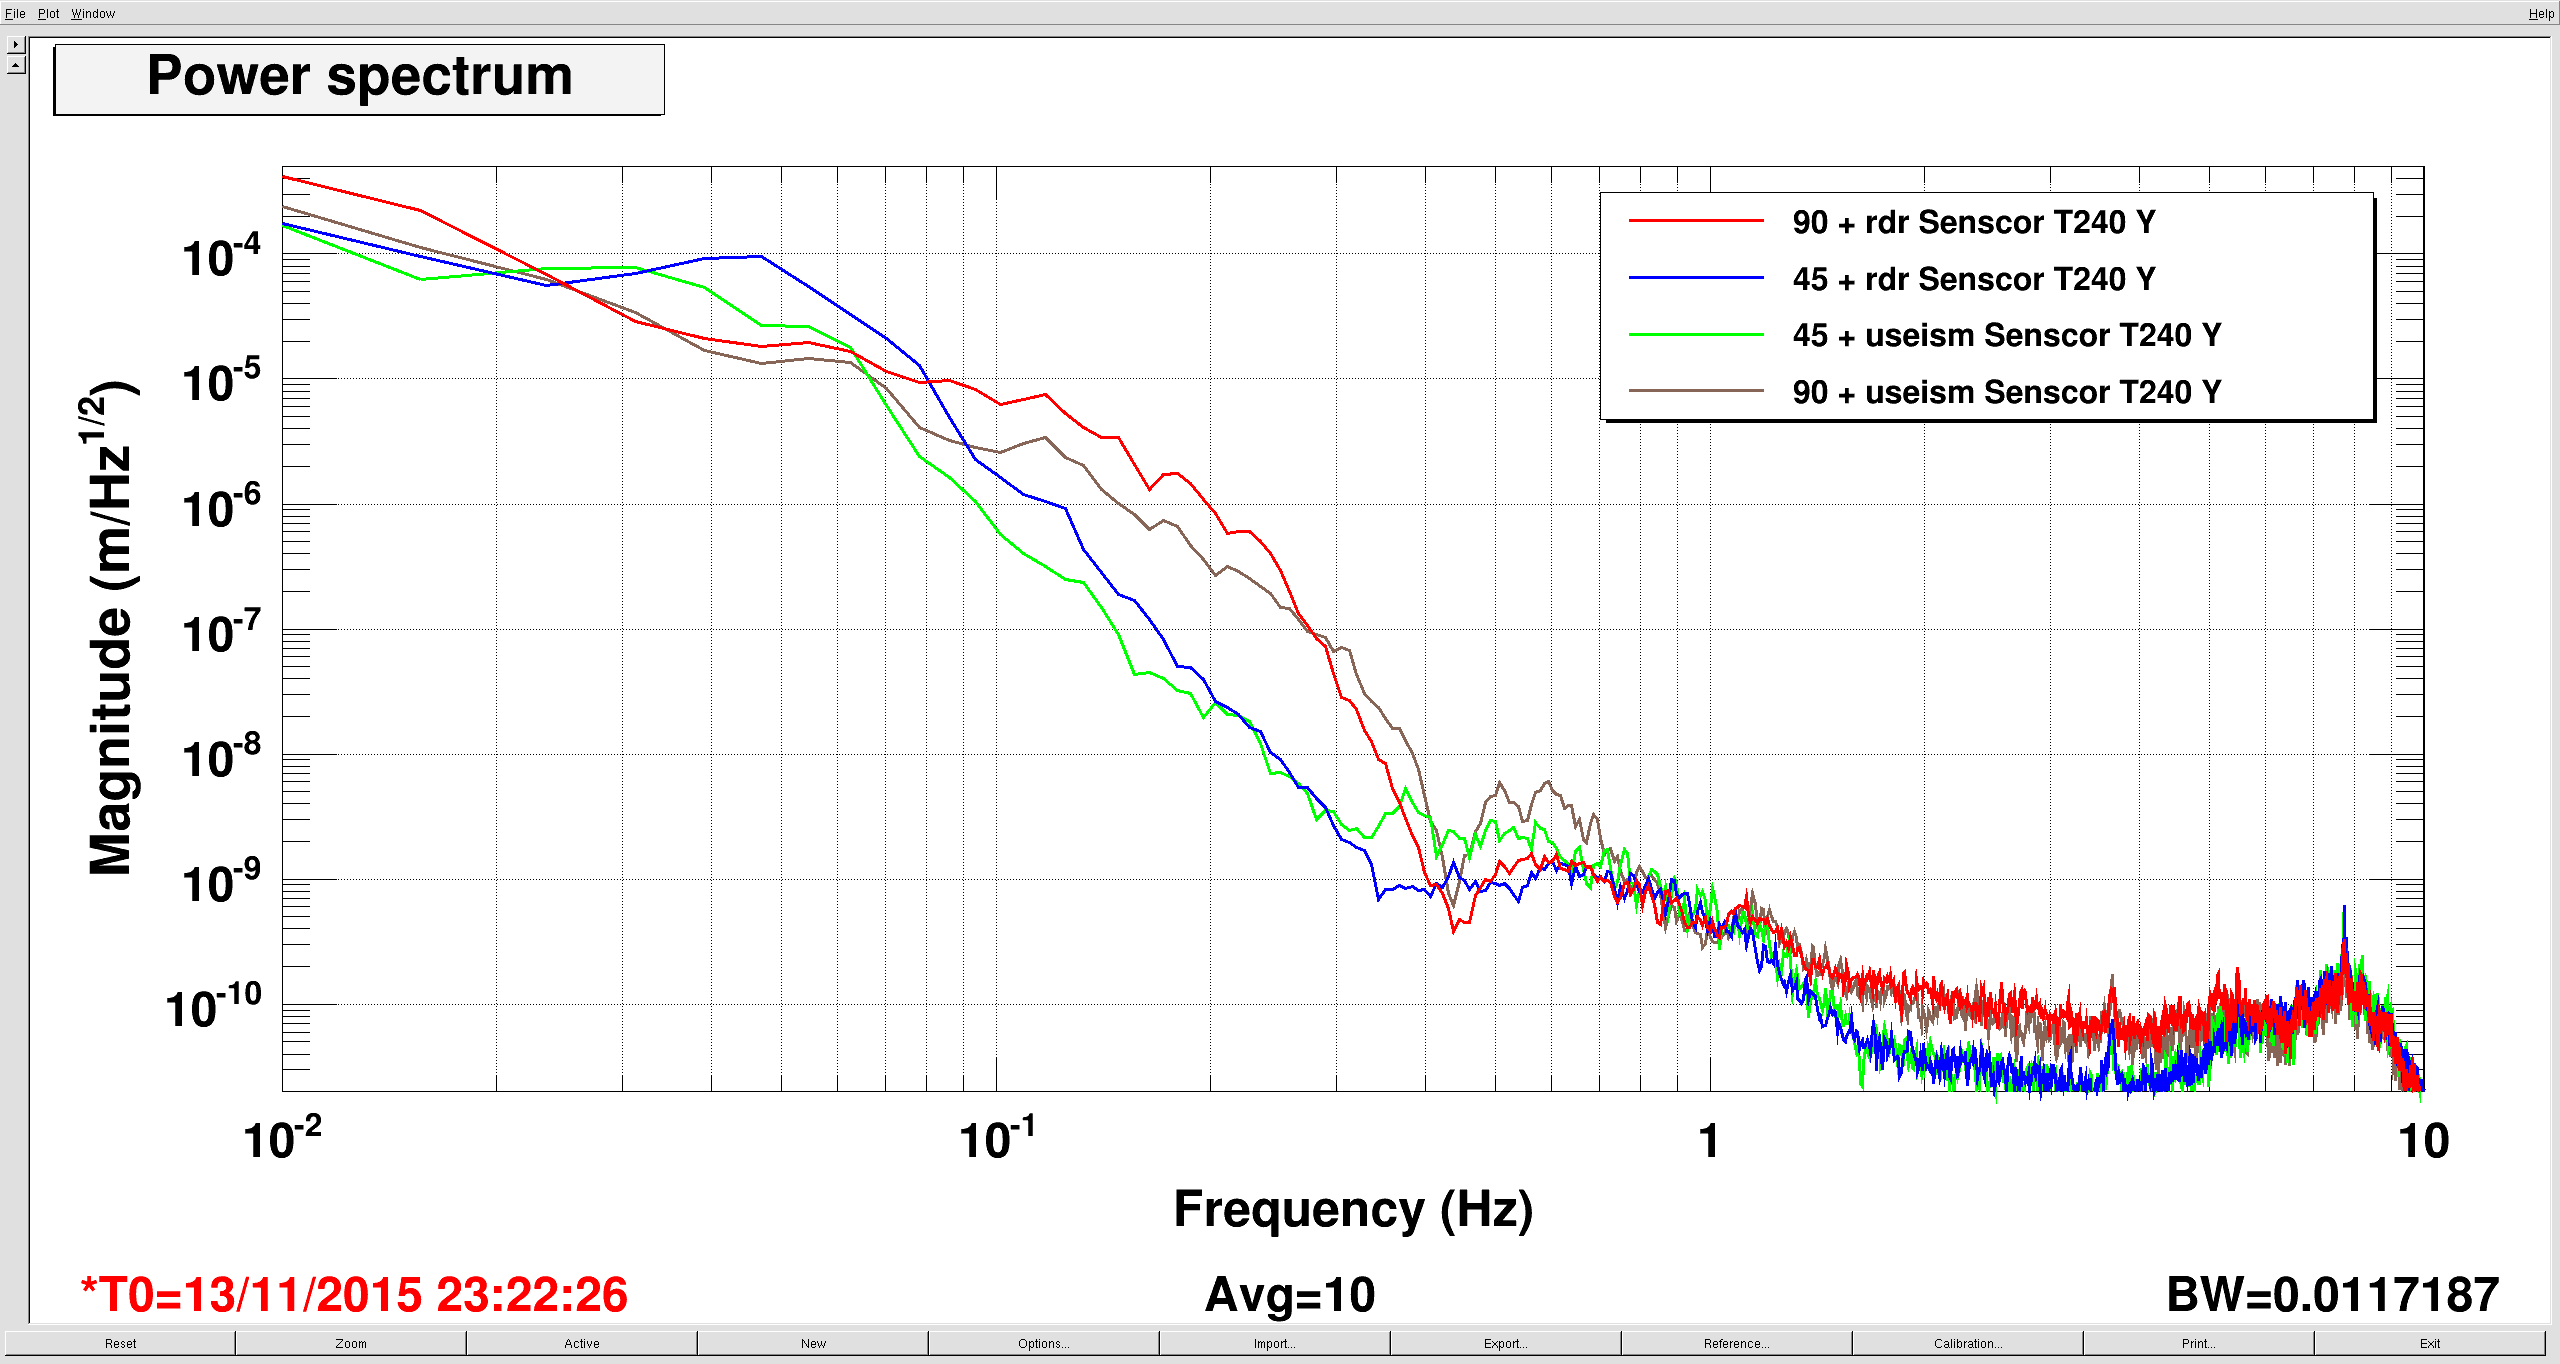
First plot is the T240s for the different configurations I tried. Red is the nominal configuration, 90mhz blends .46hz sc notch, blue is the high microseism configuration, 45 mhz blends .46hz sc notch. Green is the 45 mhz blend with useism sc, brown is the 90mhz with useism sc. This color key holds for all my other plots.
---Blue is pretty good, until you get down to .1 hz, then ISI tilt (RY to X coupling on the T240s) and gain peaking in the blends make ASC /LSC difficult. This is why 45 mhz blends don't work with high winds. The ground was a little worse for this measurement below .1 hz, but I think it only explains half the difference here, at most.
----Red is okay until .1-.3 hz, where we know the microseism was moving the mirrors too much.
---Green should be compared to blue, as it indicates the differences in the performance of the two sc filters. The performace is indeed worse at ~.5 hz, but better between .04 -.2 hz. I really expected this to be much worse below ~.1 hz, instead of only a little worse over .02-.03 hz.
---Brown should be compared to Red, again showing the difference in sc performance. Story is the same as green, better at .04-.2 and worse at ~.5 hz.
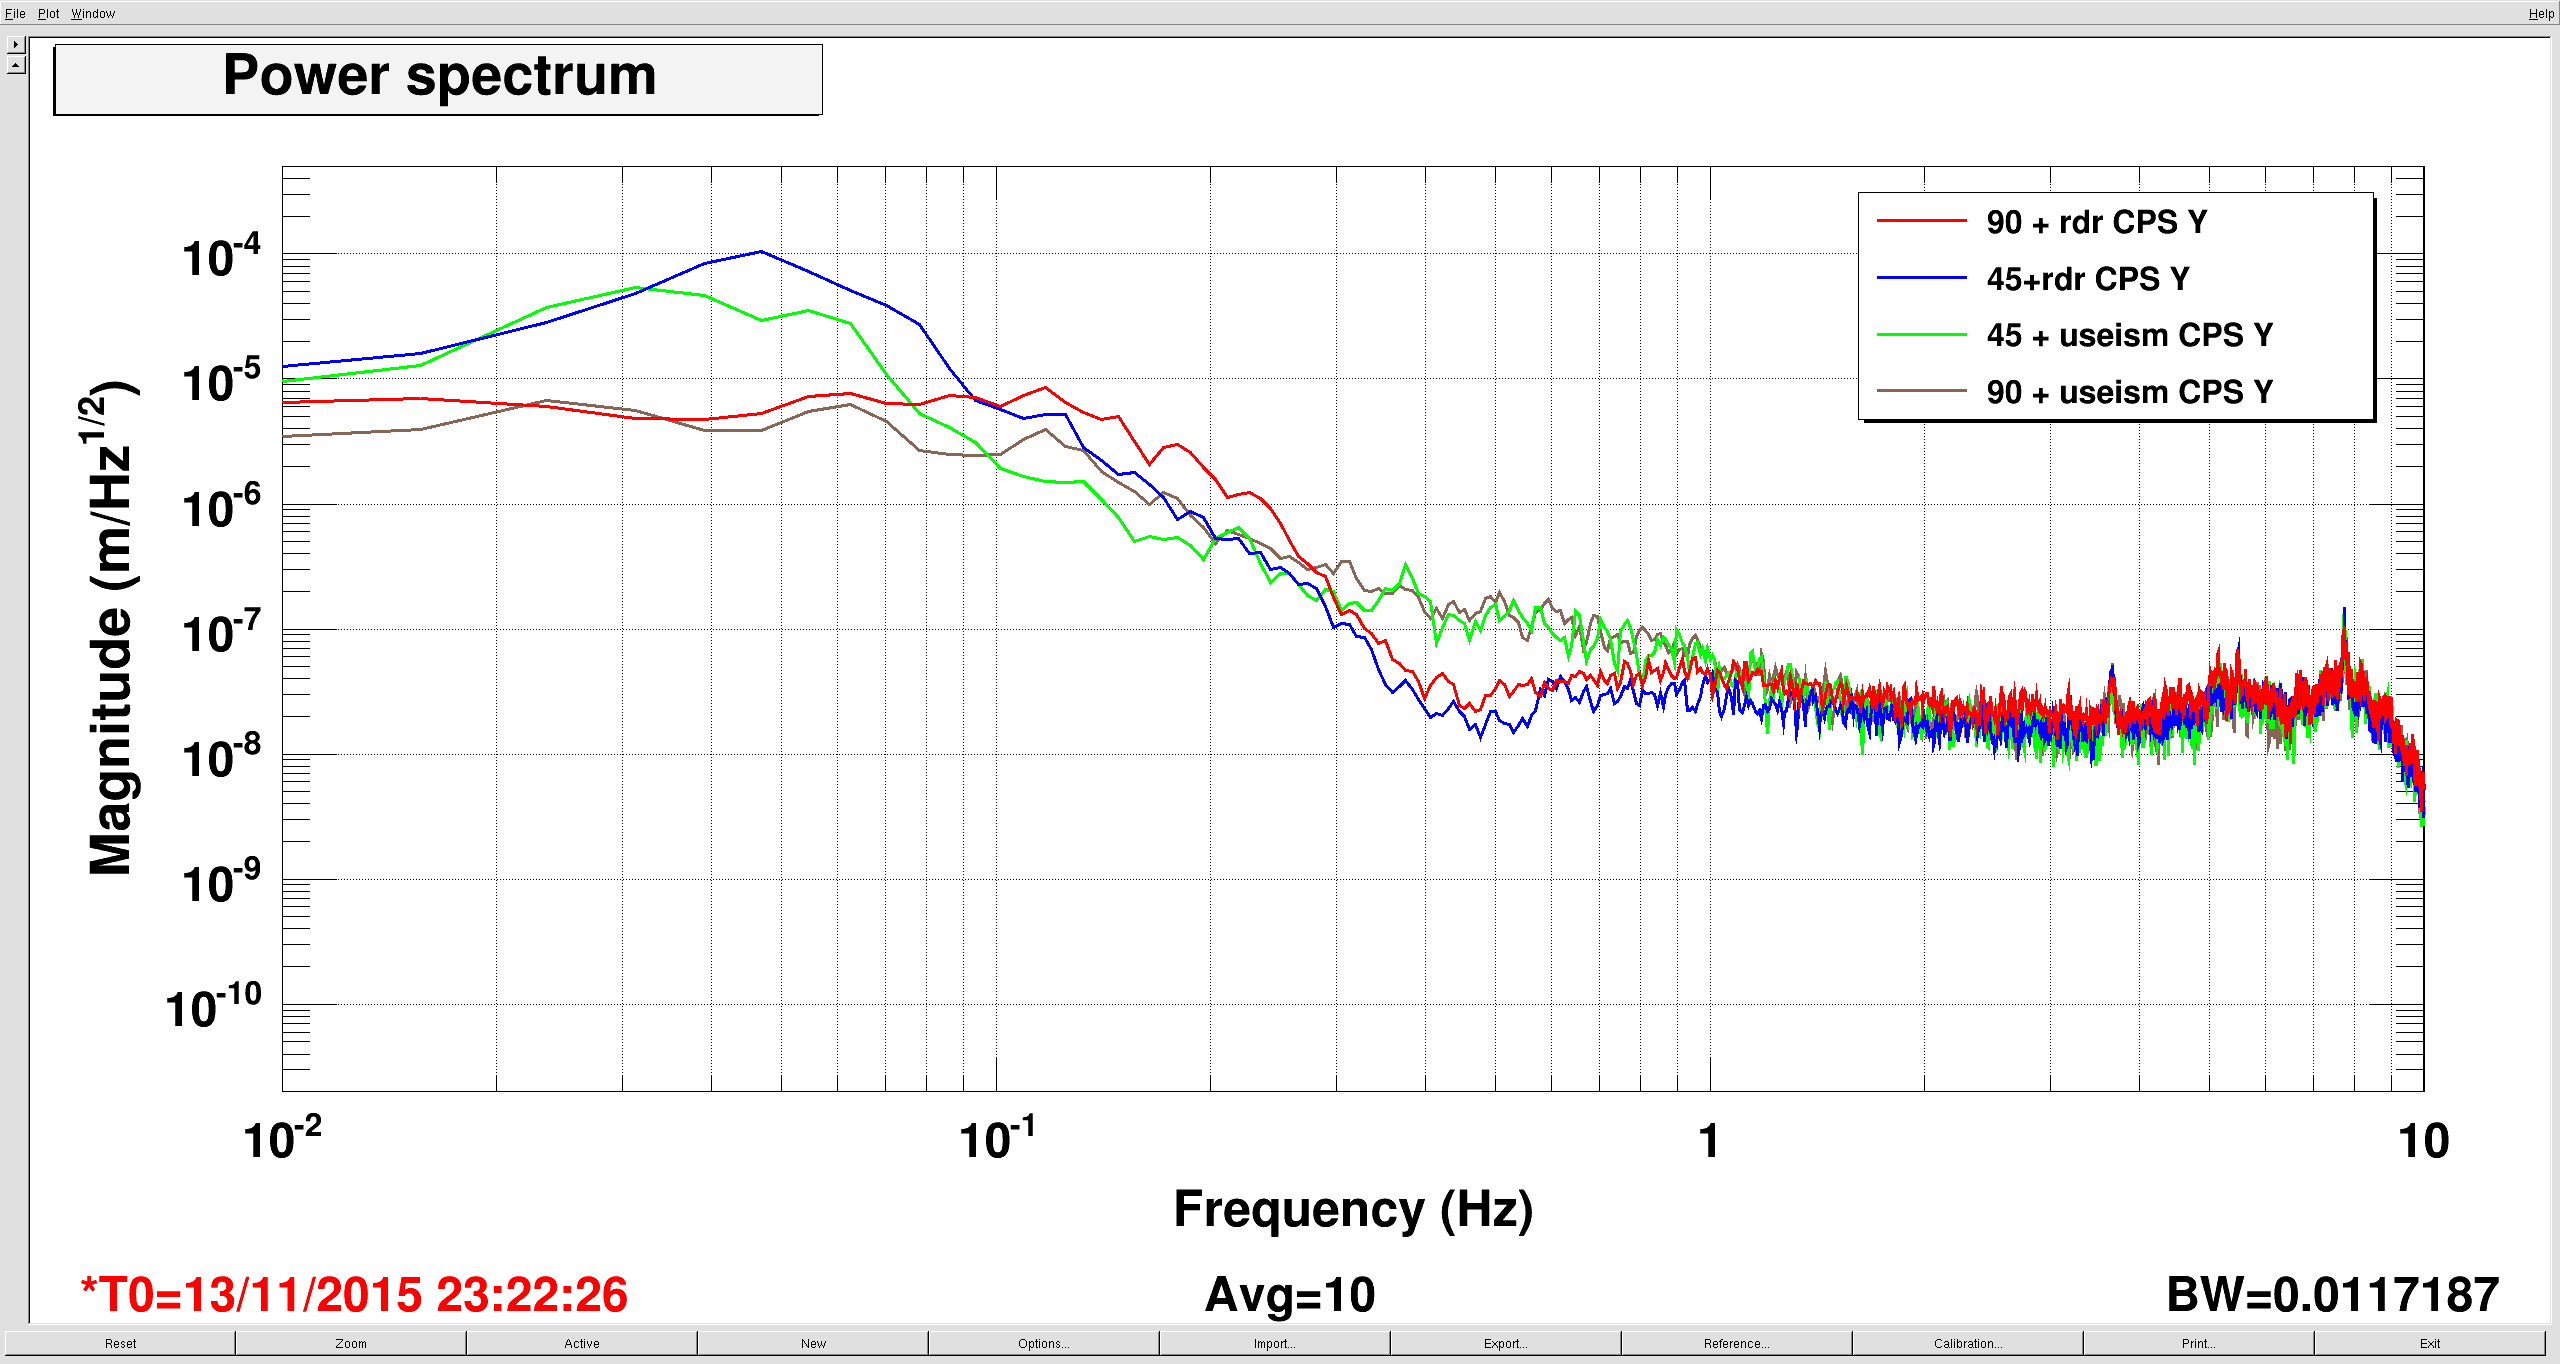
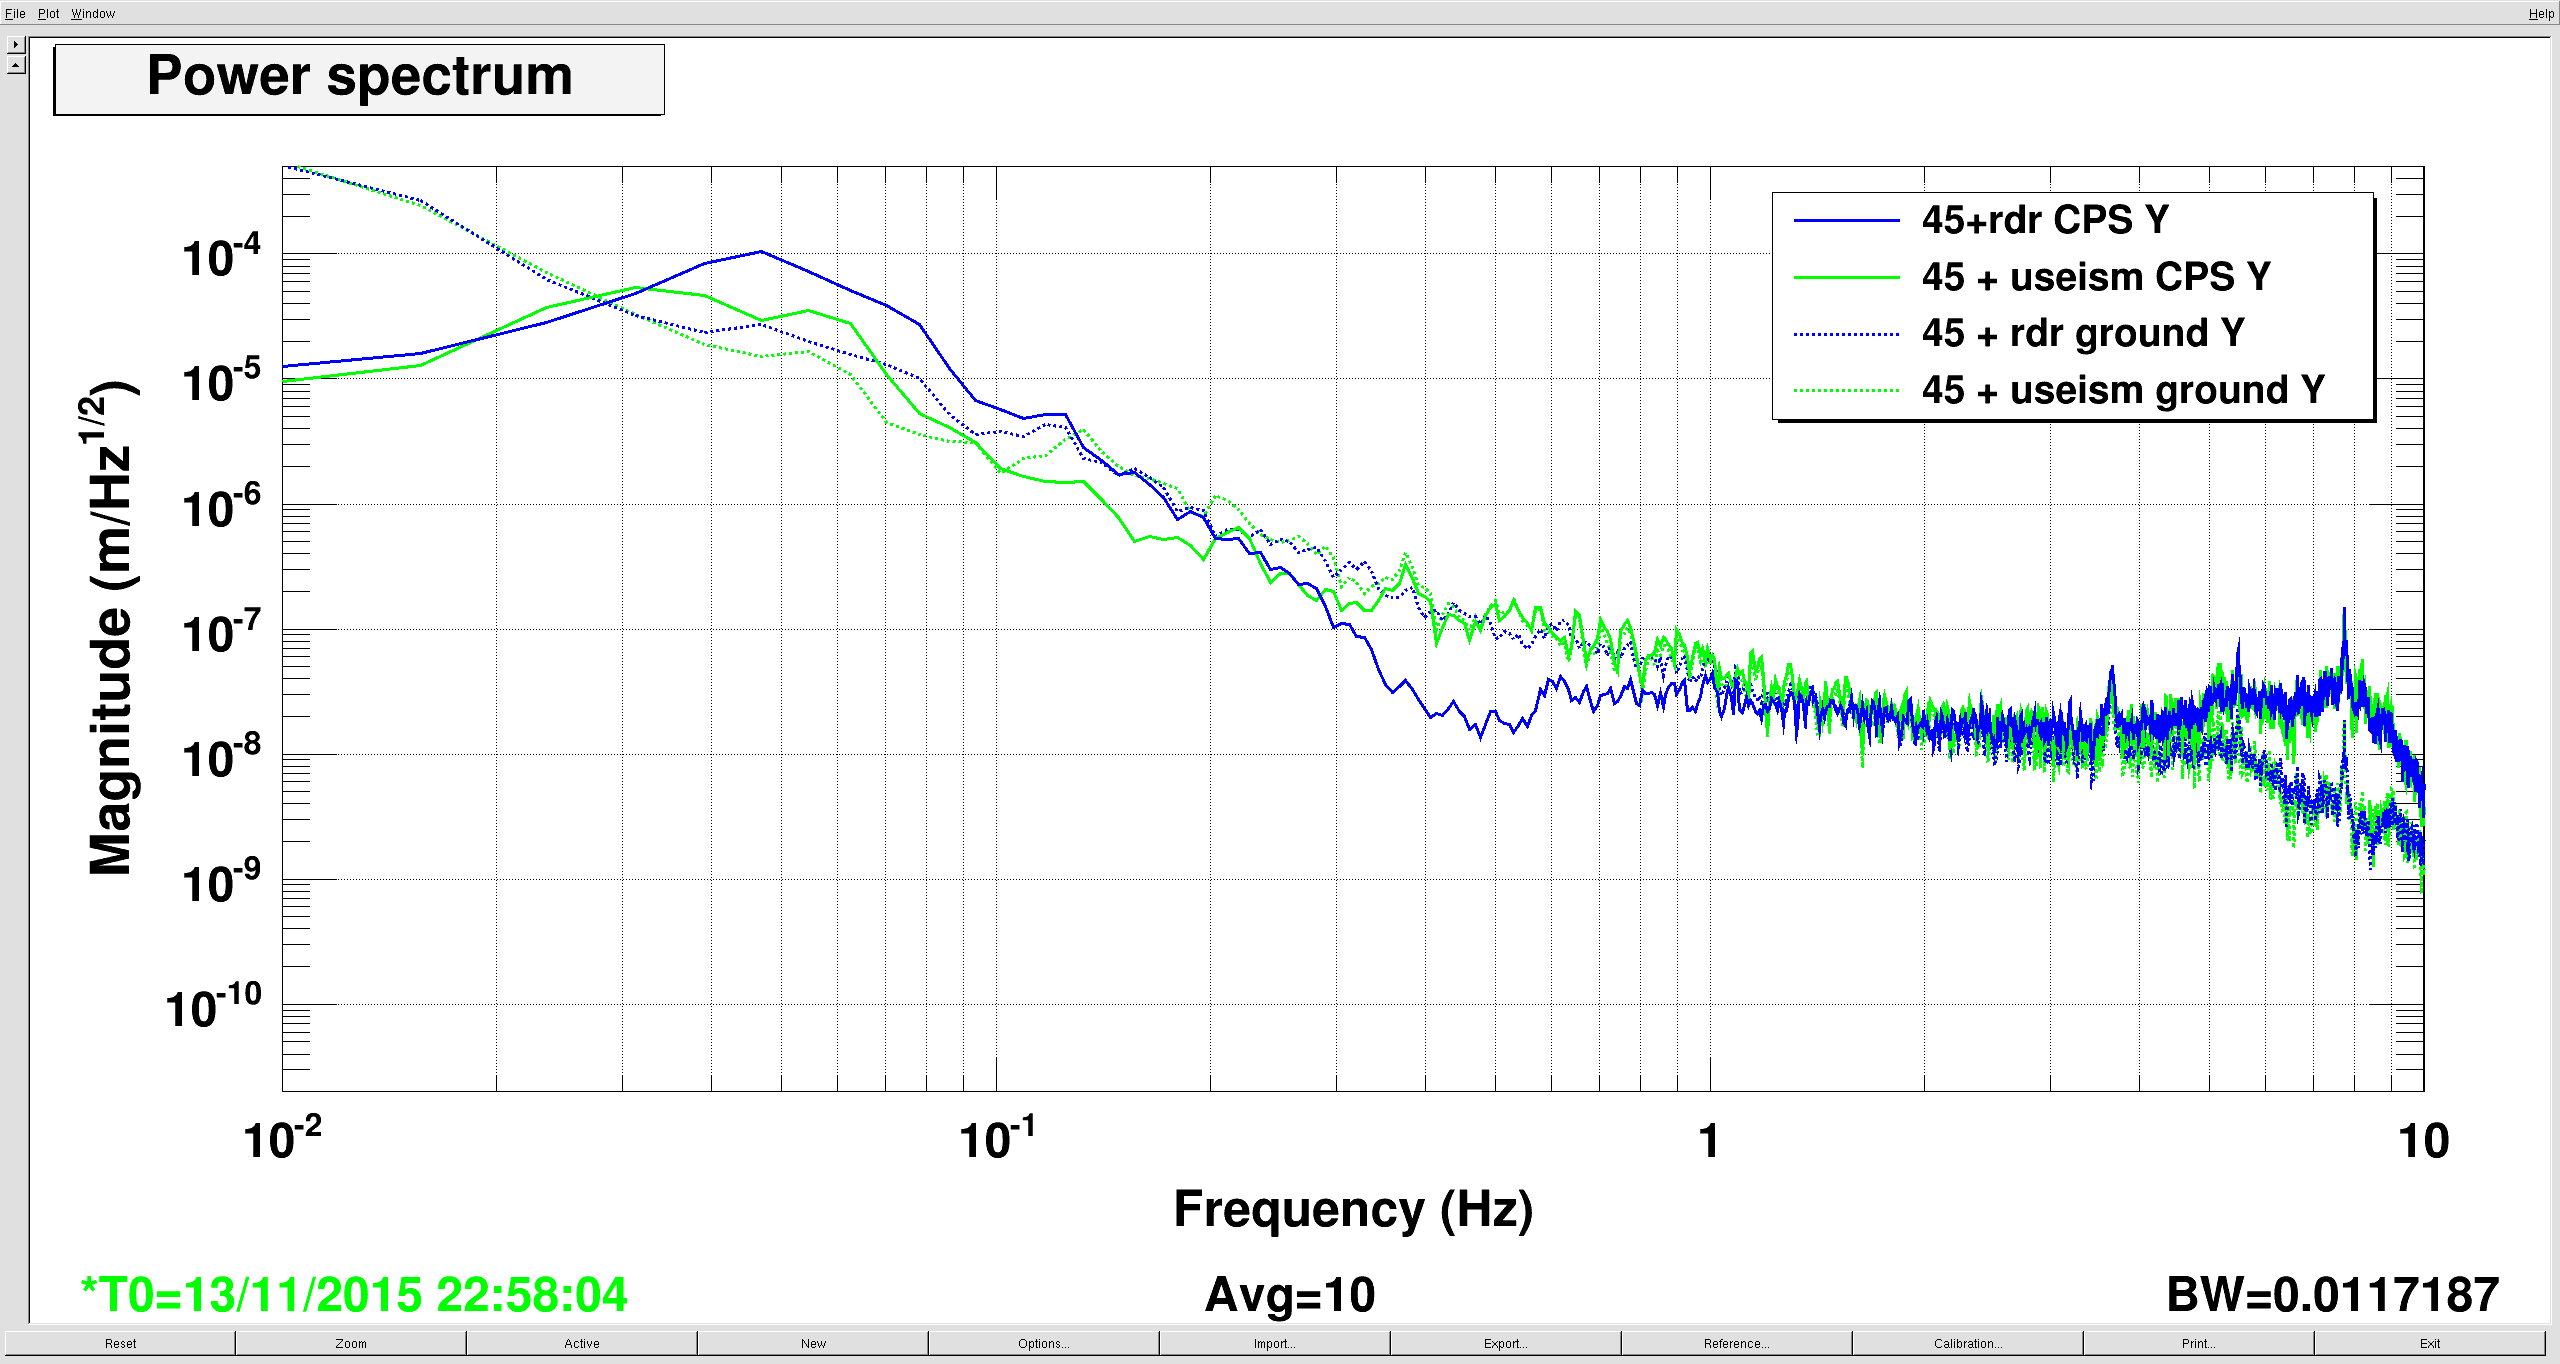
The second plot is the CPSes, the color key the same, blue & green compare the two sc filters with 45mhz blends, while red & brown compare the two sc filters with the 90 mhz blends. I think the conclusions are the same, but the CPSes show the low frequency story better.
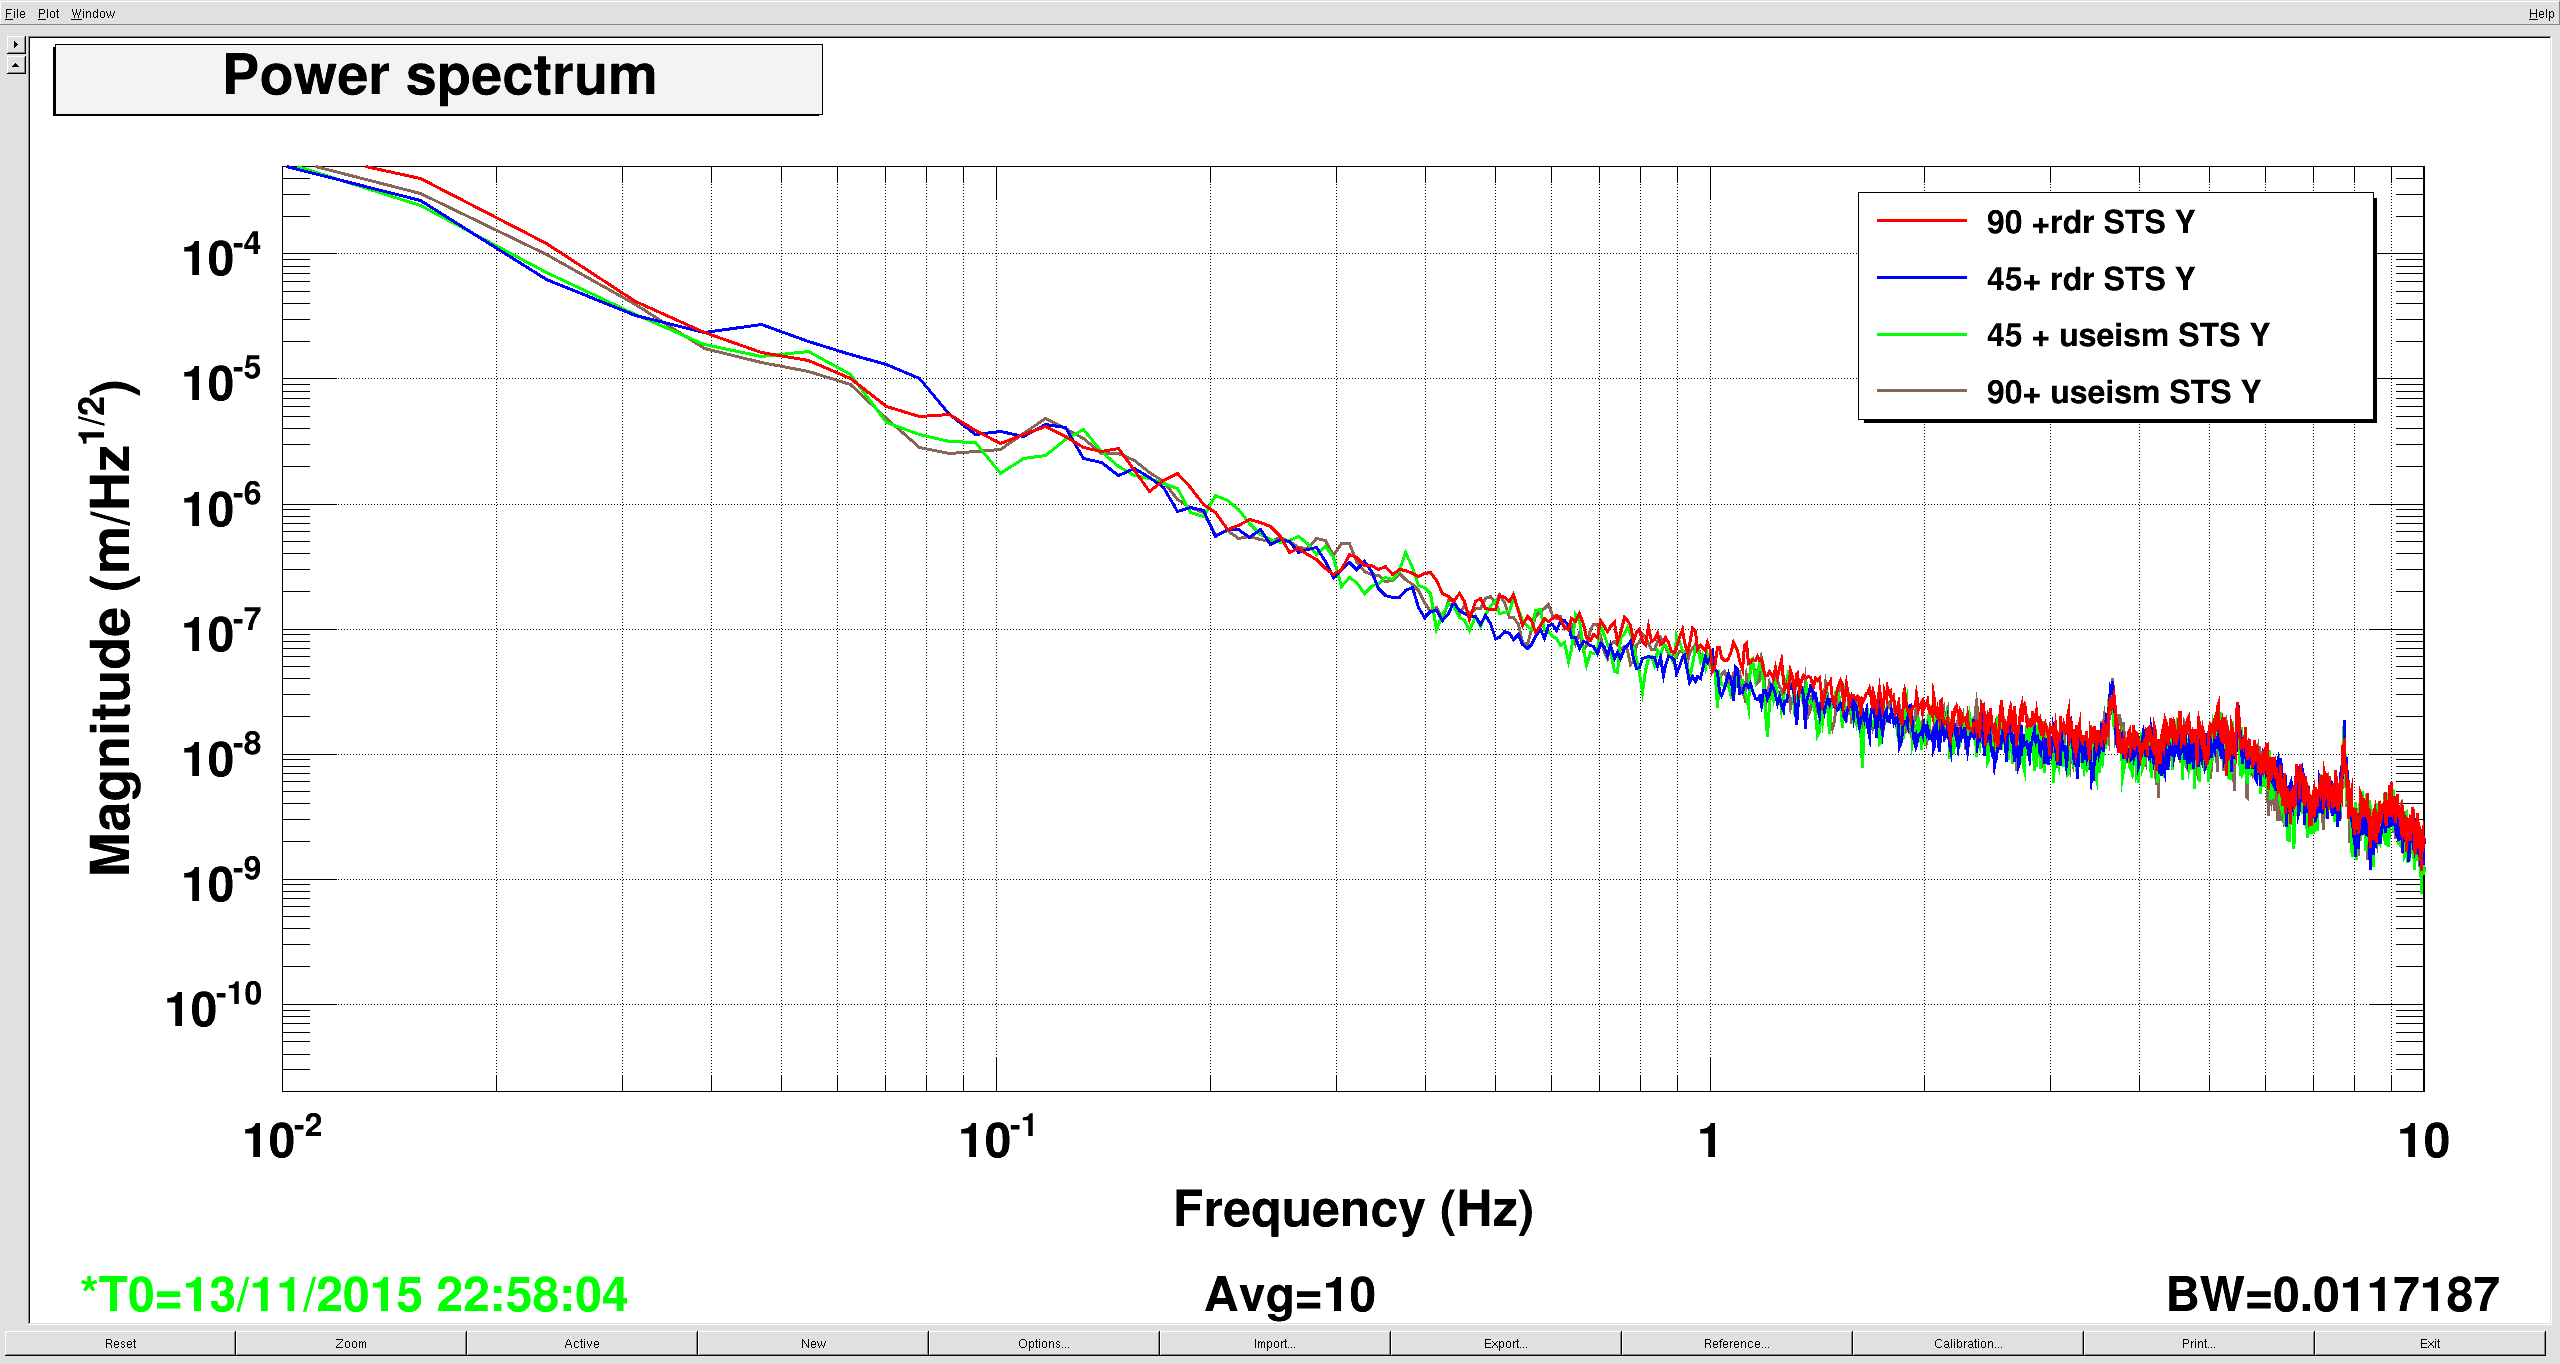
Third plot shows the ground at EY at the times I was taking each measurement. Clearly the ground at .05 to .09 hz was a little worse than the other times, but I think it accounts for at most half the difference. The fourth plot shows the CPS and the ground motion for the two sc measurements with 45 mhz blends, which were the two extremes of ground motion. Maybe it's not clear, but I think solid blue is higher above dashed blue, than solid green is above dashed green around .1 hz. I should have gotten the ground to CPS tfs....
I don't know if the losses at .5 hz are too much (as much as a factor of 10), I didn't look at oplevs, there were no cavities when I did this. Frankly I'm surprised it worked at all. But maybe this is something worth exploring. I would like to try this again when the ground environment is making locking impossible.