TITLE: Oct 6 DAY Shift 15:00-23:00UTC (08:00-04:00 PDT), all times posted in UTC
STATE Of H1: Aligning/Locking
LOCK DURATION: N/A
SUPPORT: Sheila, Jenne, TJ
INCOMING OPERATOR: Nutsinee
Activity log:
14:55 Safety Kleen is on site
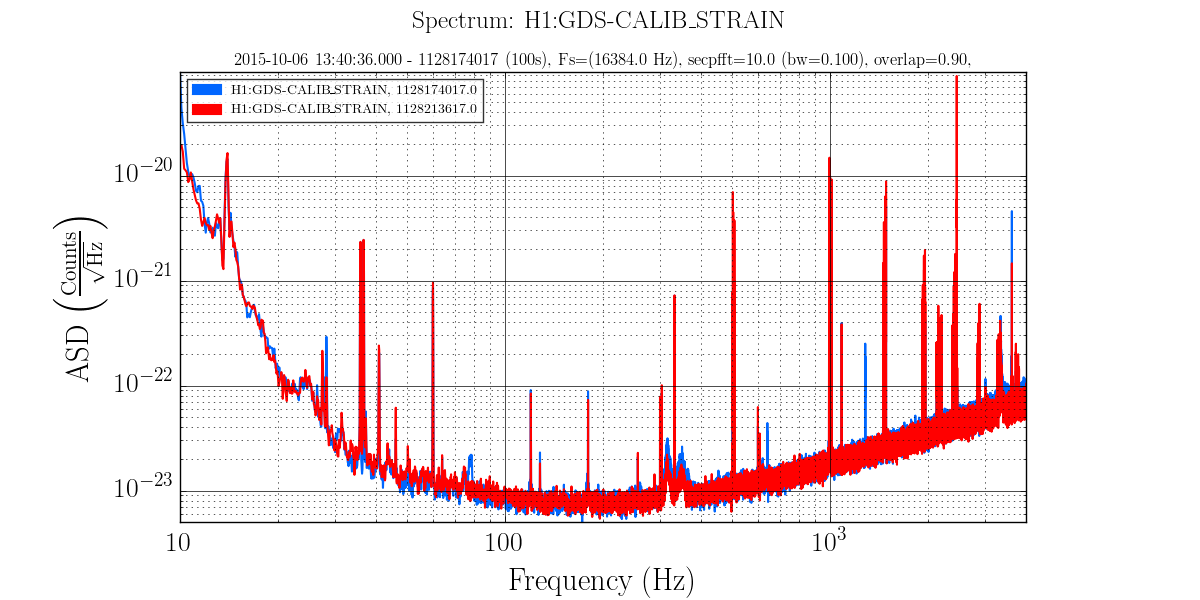
14:57 Sheila performing scattered light noise hunting testing on EX WP#5528
14:58 Richard starting his temperature Beckhoff system room temperature sensor work. WP#5534
15:00 Jeff B running forklift WP#5506
15:08 Lockloss
15:12 Jody to begin executing WP#5537 upon completion of Jeff B’s work (#5506)
15:13 Ken out to EY for Solar Panel work WP#5493
15:15 Jim batch informed of DMT maintenance. EQ blrms, range, IR integrand. etc
15:19 Joe out to LVEA to check water, batteries. etc
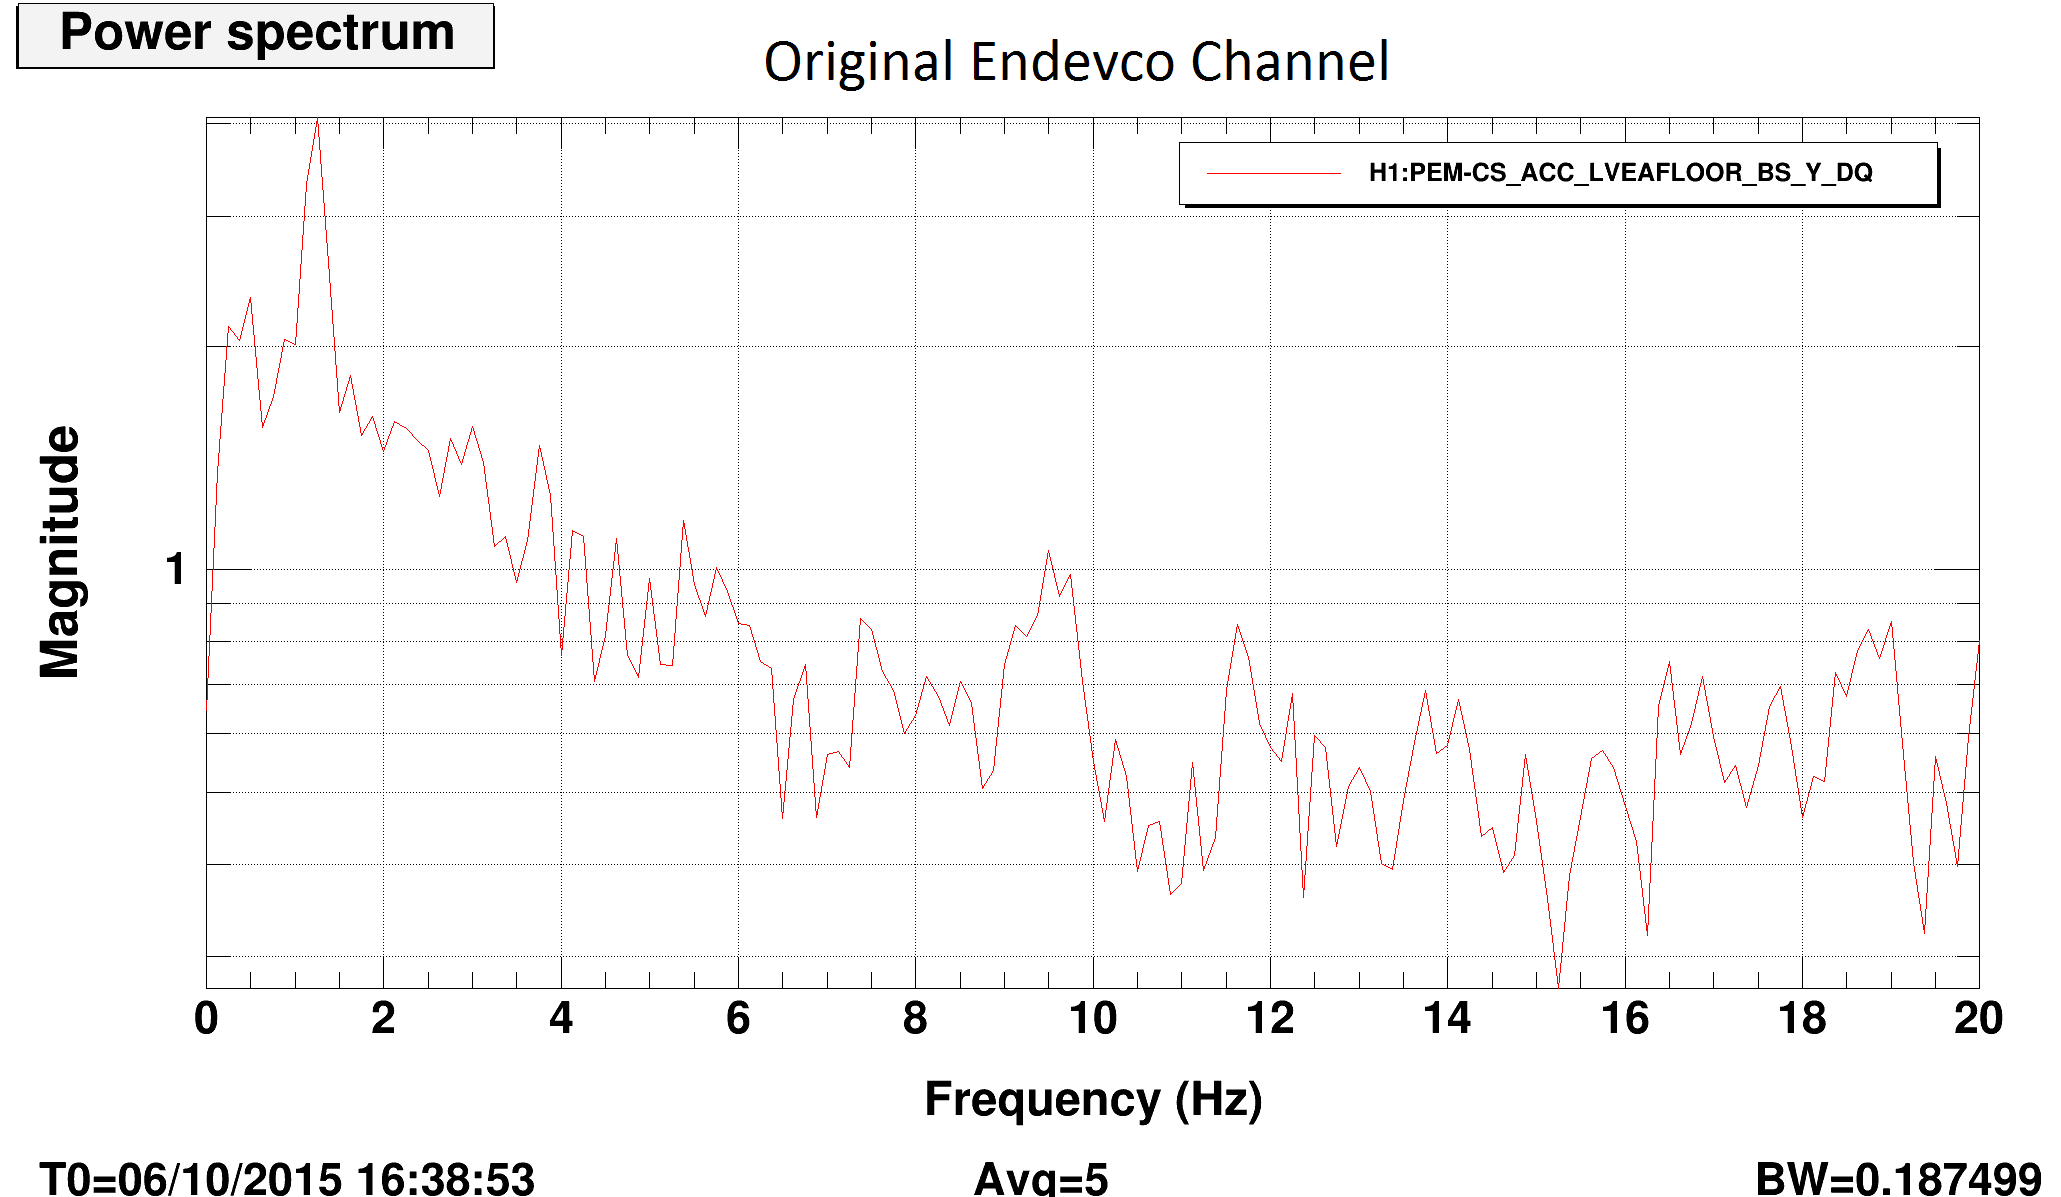
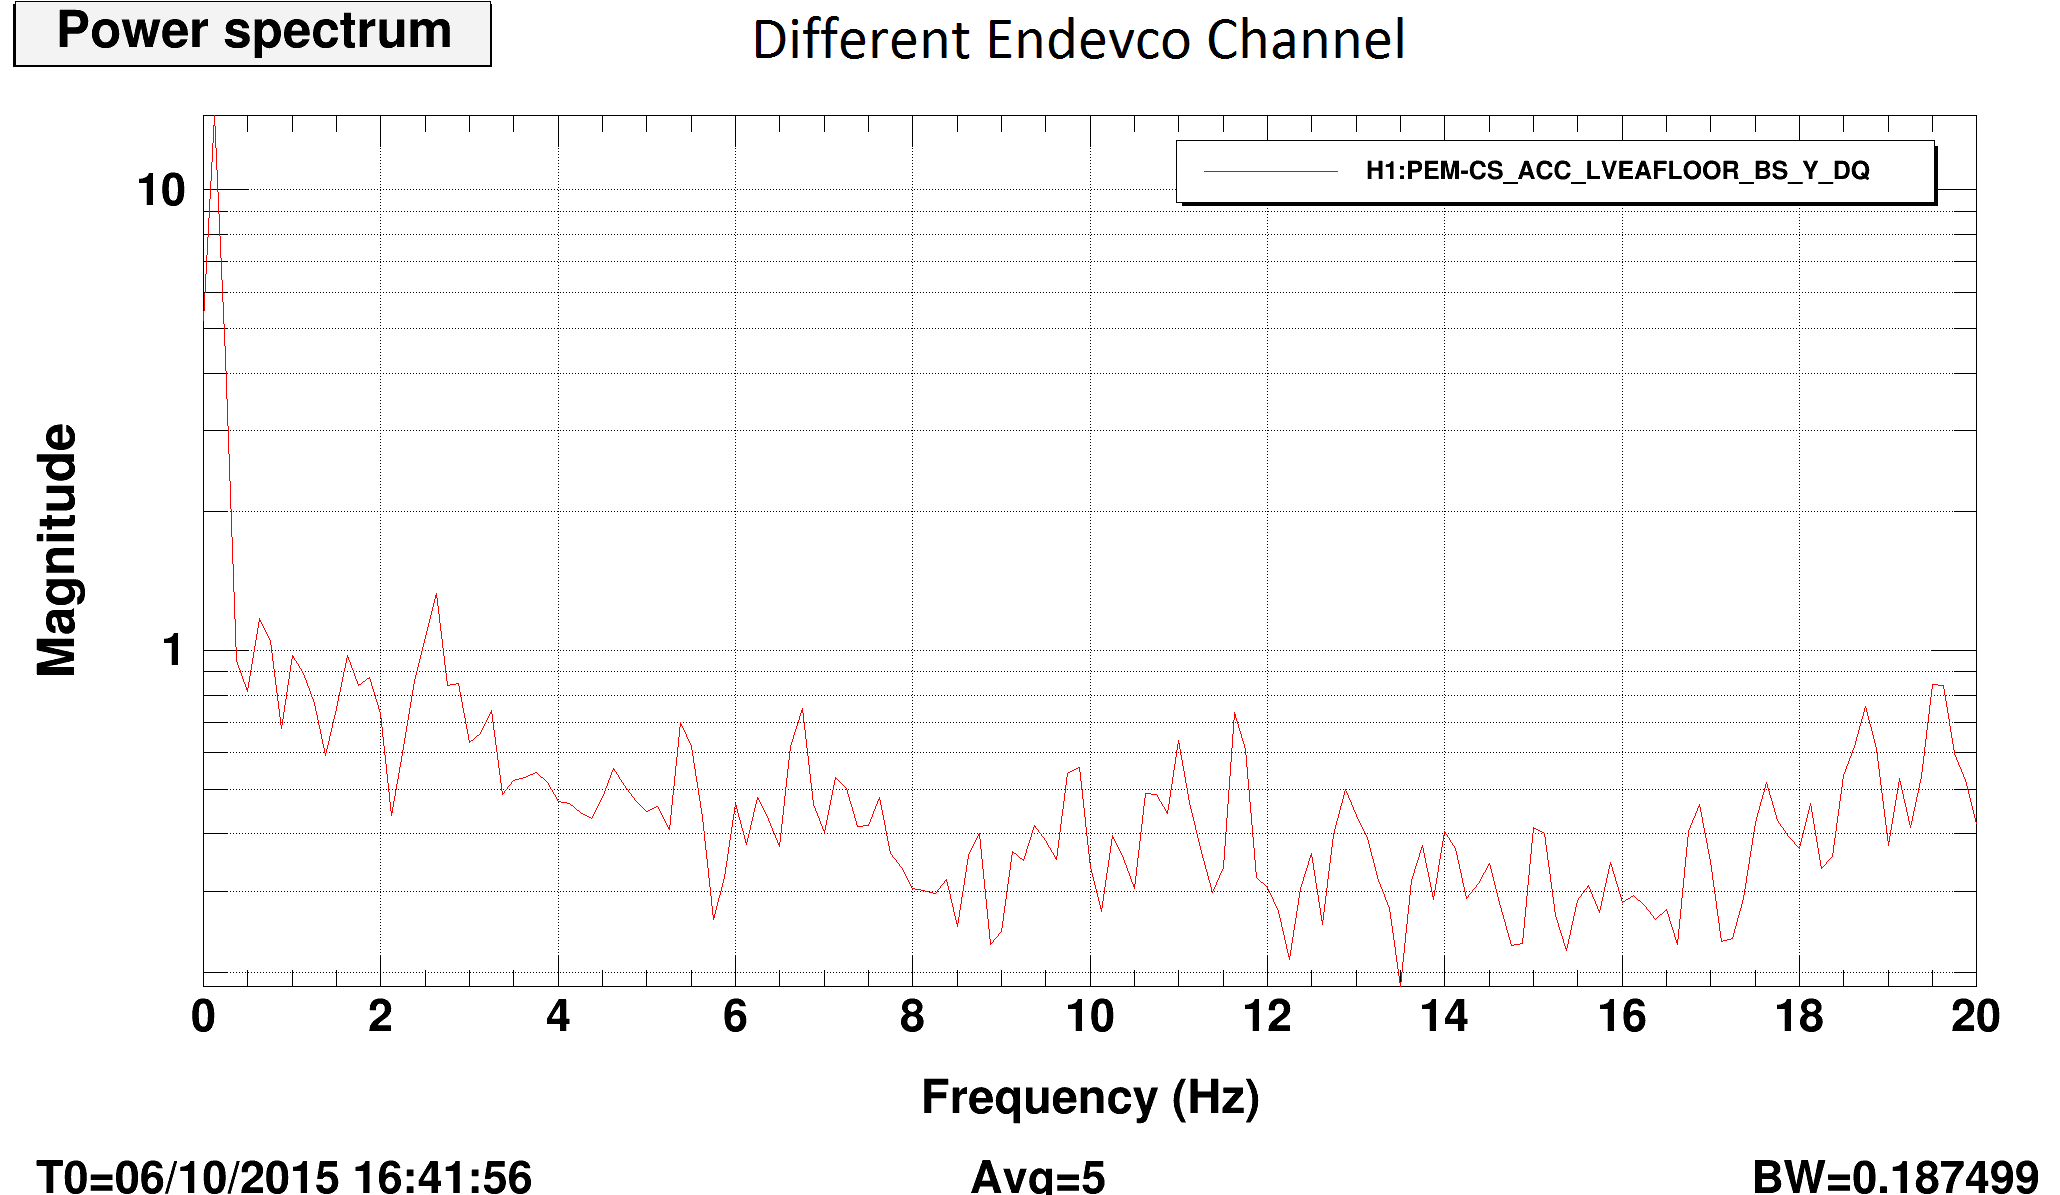
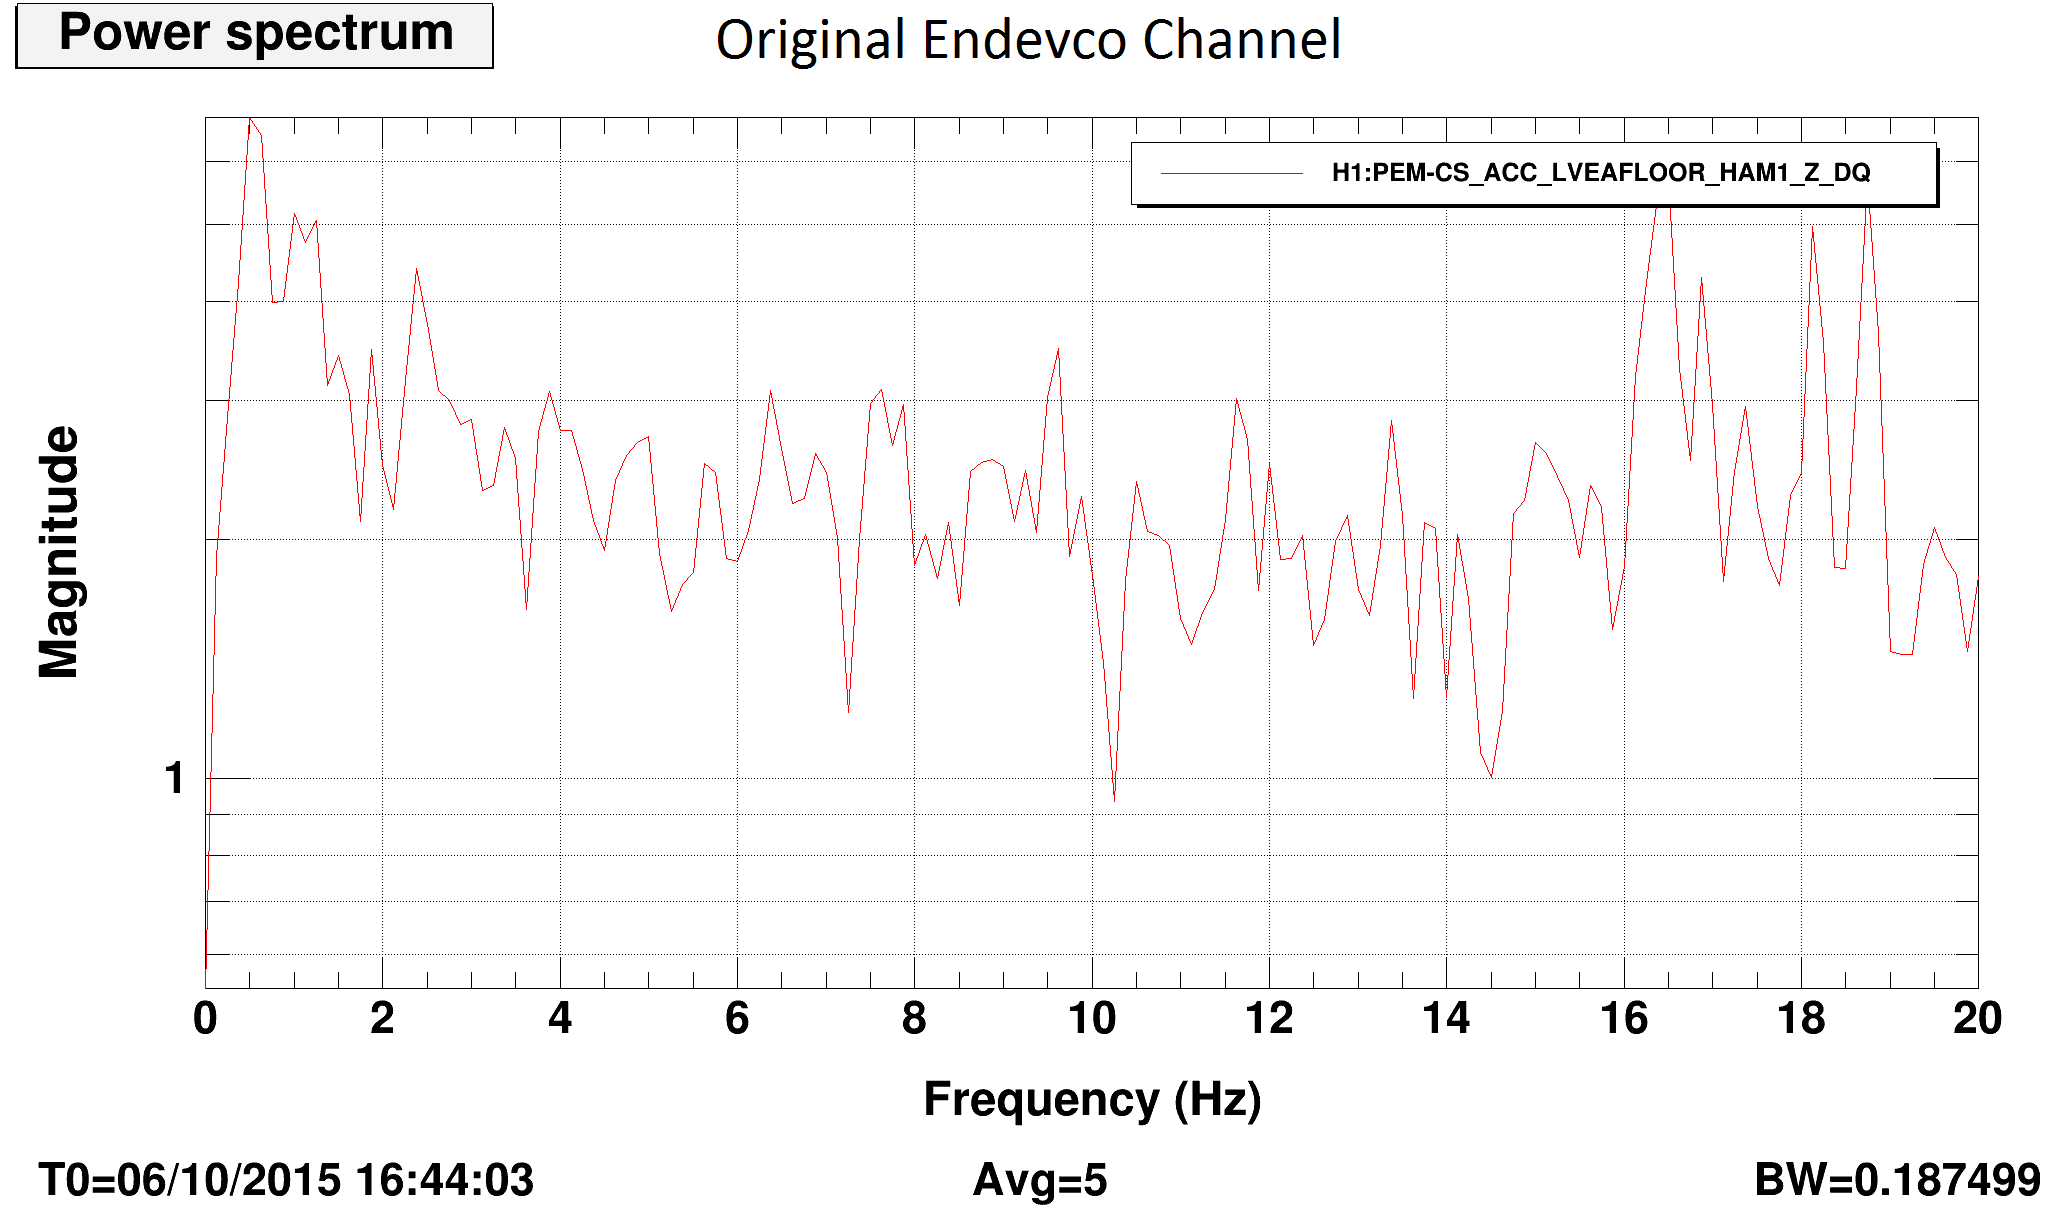
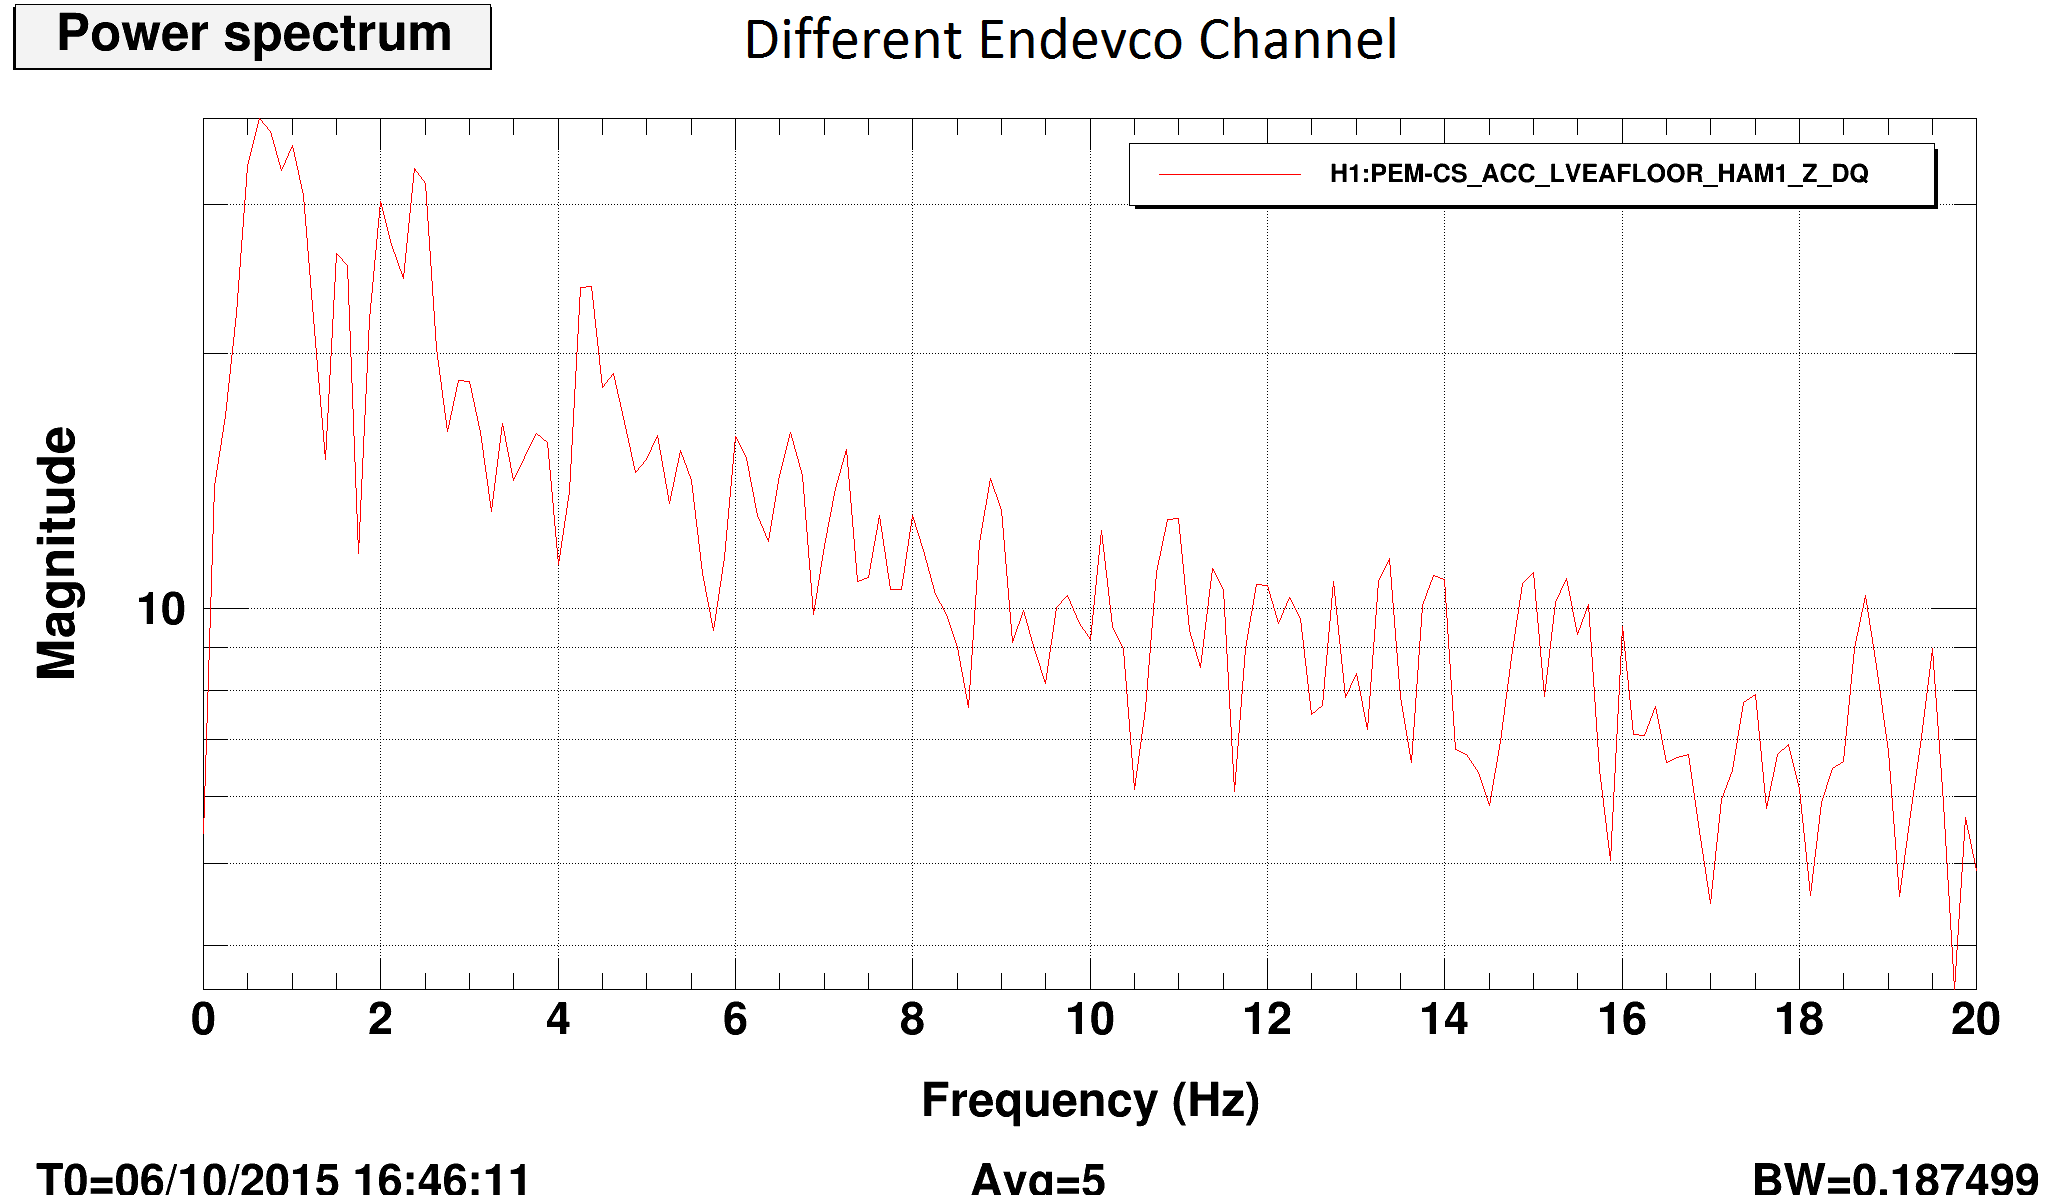
15:22 Robert’s equipment is unloaded and he will begin PEM injections
15:24 Greg Mendell informed me of the start of the DMT update WP#5522
15:26 Joe turning on lights in LVEA
15:27 Kyle and Gerardo out to execute WP#5532. Informed me that new LN2 vendor will be arriving on site today.
15:30 Richard is turning on wireless in LVEA. WE NEED TO REMIND THE SWEEP TEAM TO TURN IT OFF.
15:35 Switched observatory mode to Corrective Maintenance
15:40 NORCO on site for LN2 delivery Y end
15:42 Vinnie into the electronics room to investigate two accelerometers.
15:46 Jody called to inform that forklift was loaded and they’re headed down X arm. WP#5537
15:49 Richard finished temp sensors in corner. He’s headed to EX
15:51 Sheila will be breaking the current lock. Betsy will do some charge measurements.
15:53 Hugh out to do weekly HEPI fluid checks at all out buildings and corner.
16:02 Christina called. Leaving EY headed to EX.
16:06 John W driving down to EY to meet LN2 driver.
16:08 Jason in to LDR to do regular weekly Watchdog reset .
16:15 Septic truck on site
16:19 Richard called to confirm operation of sensors at EY
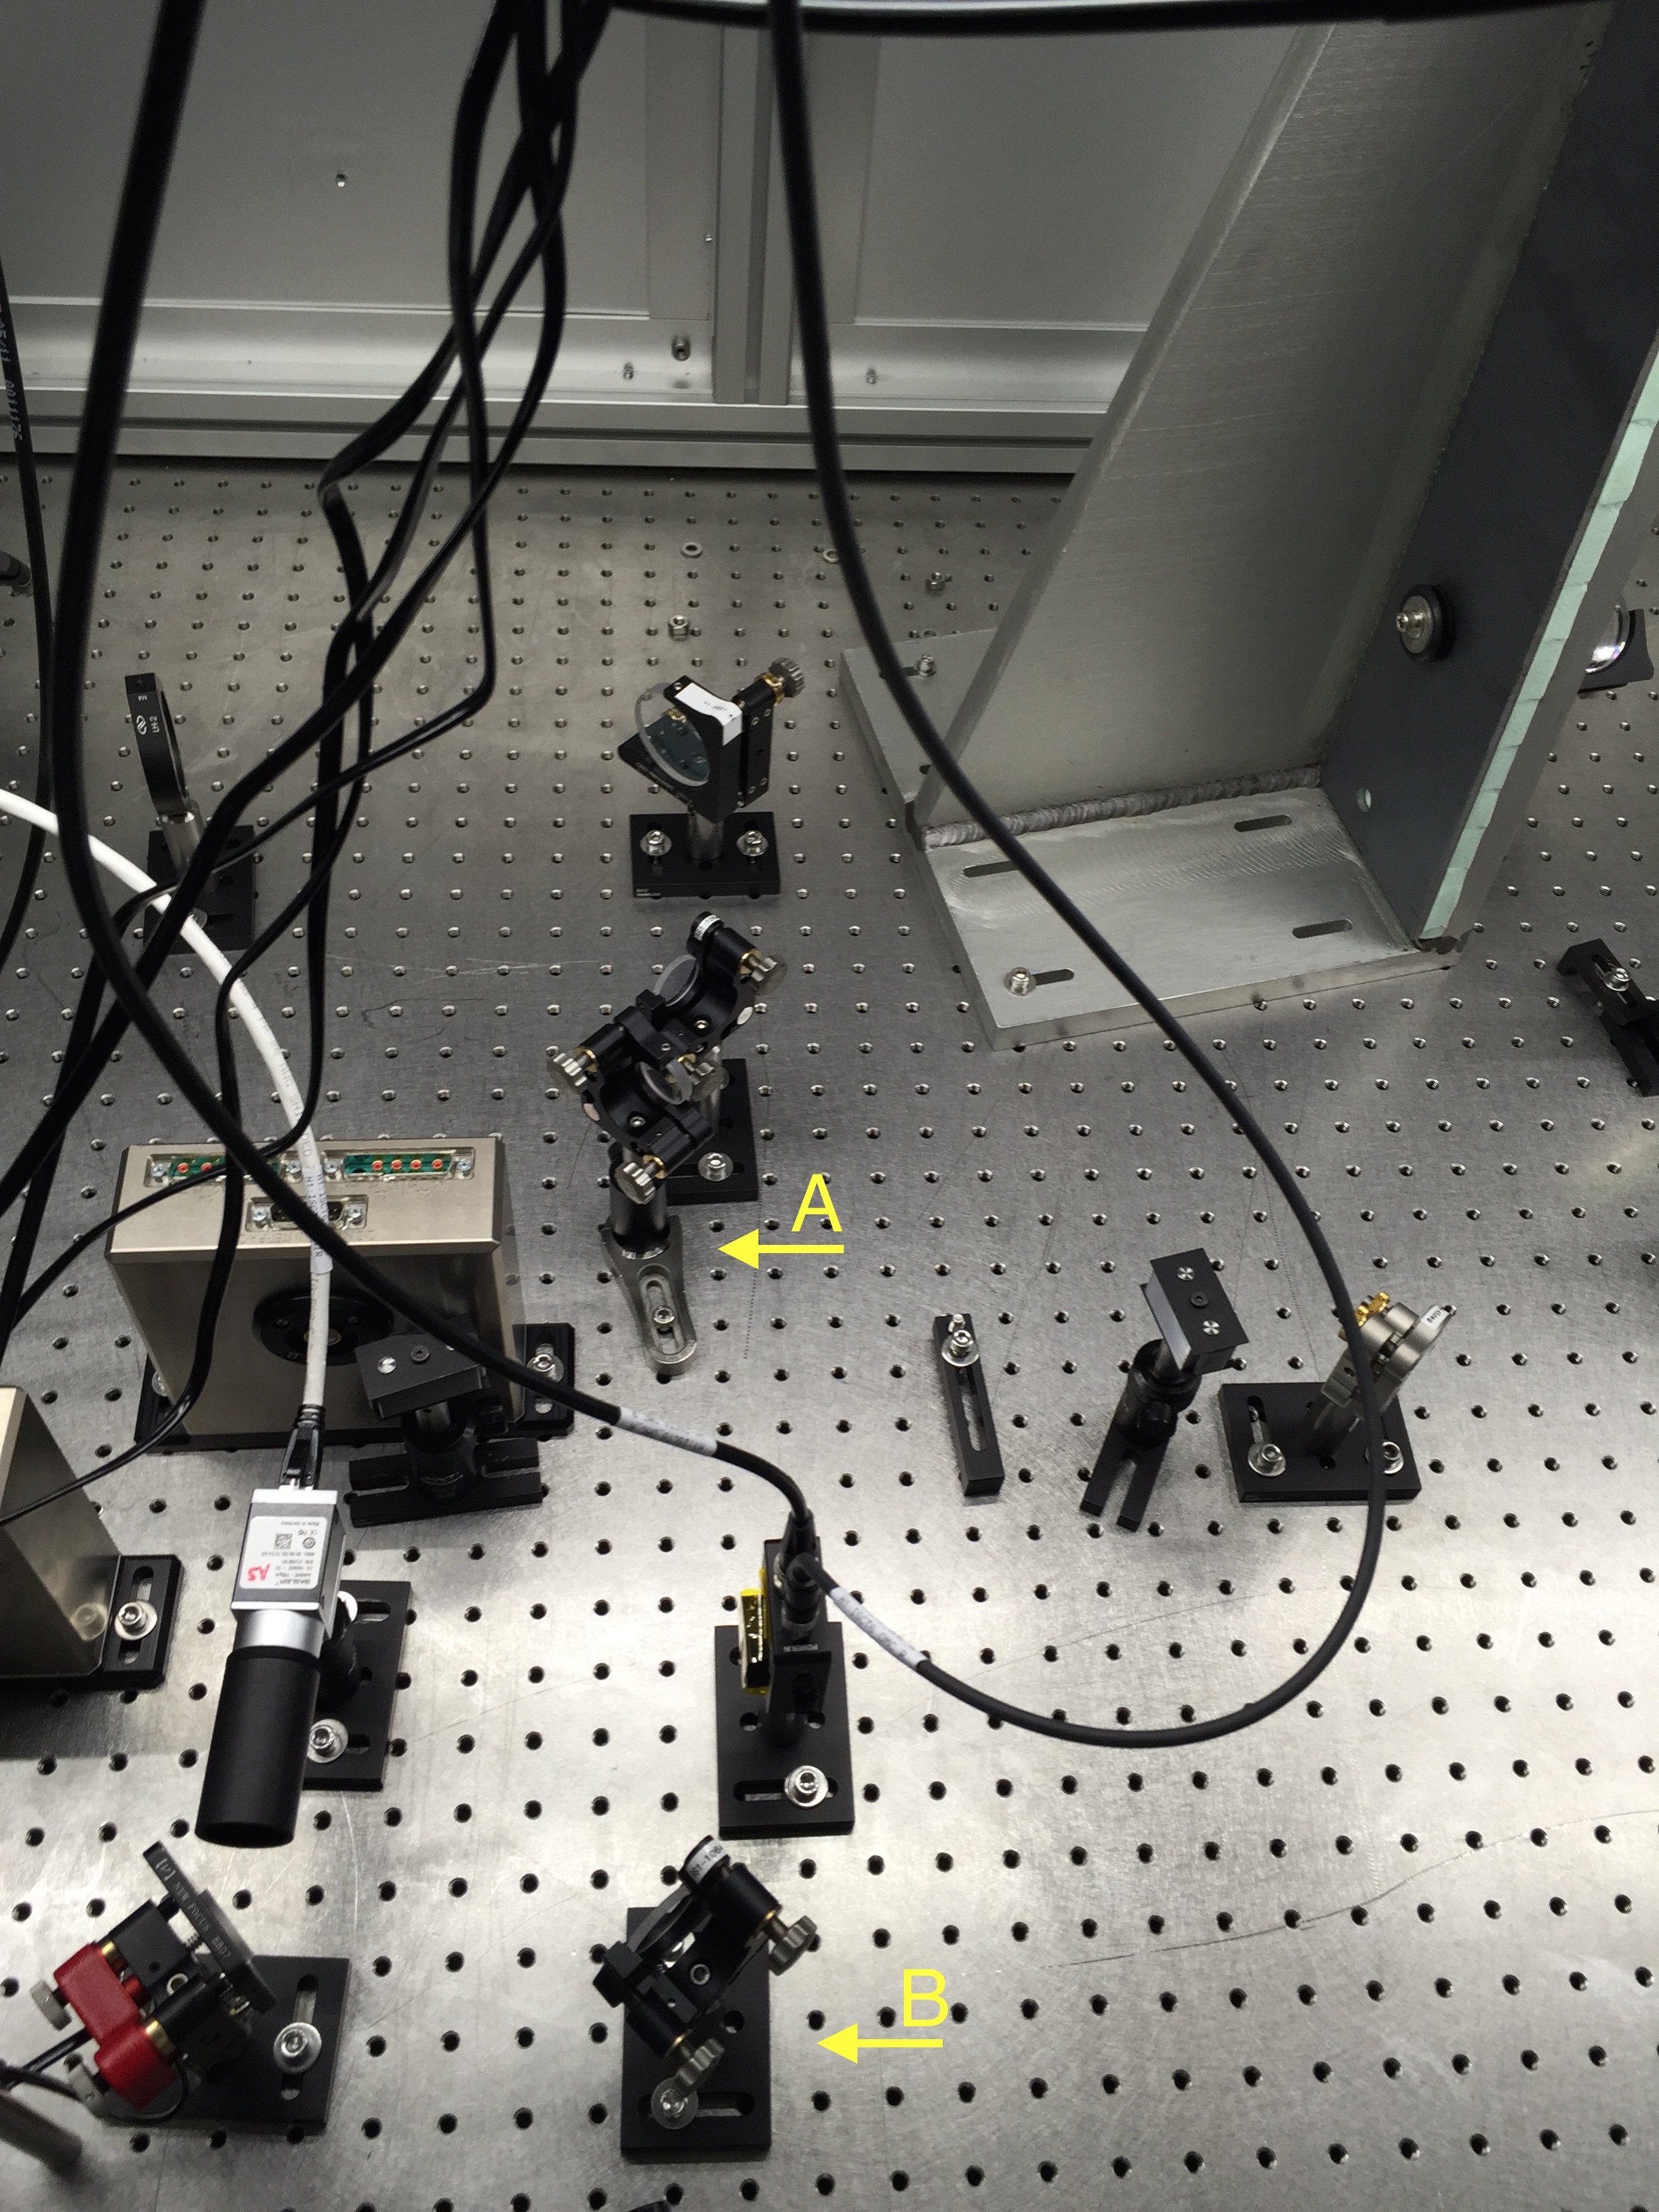
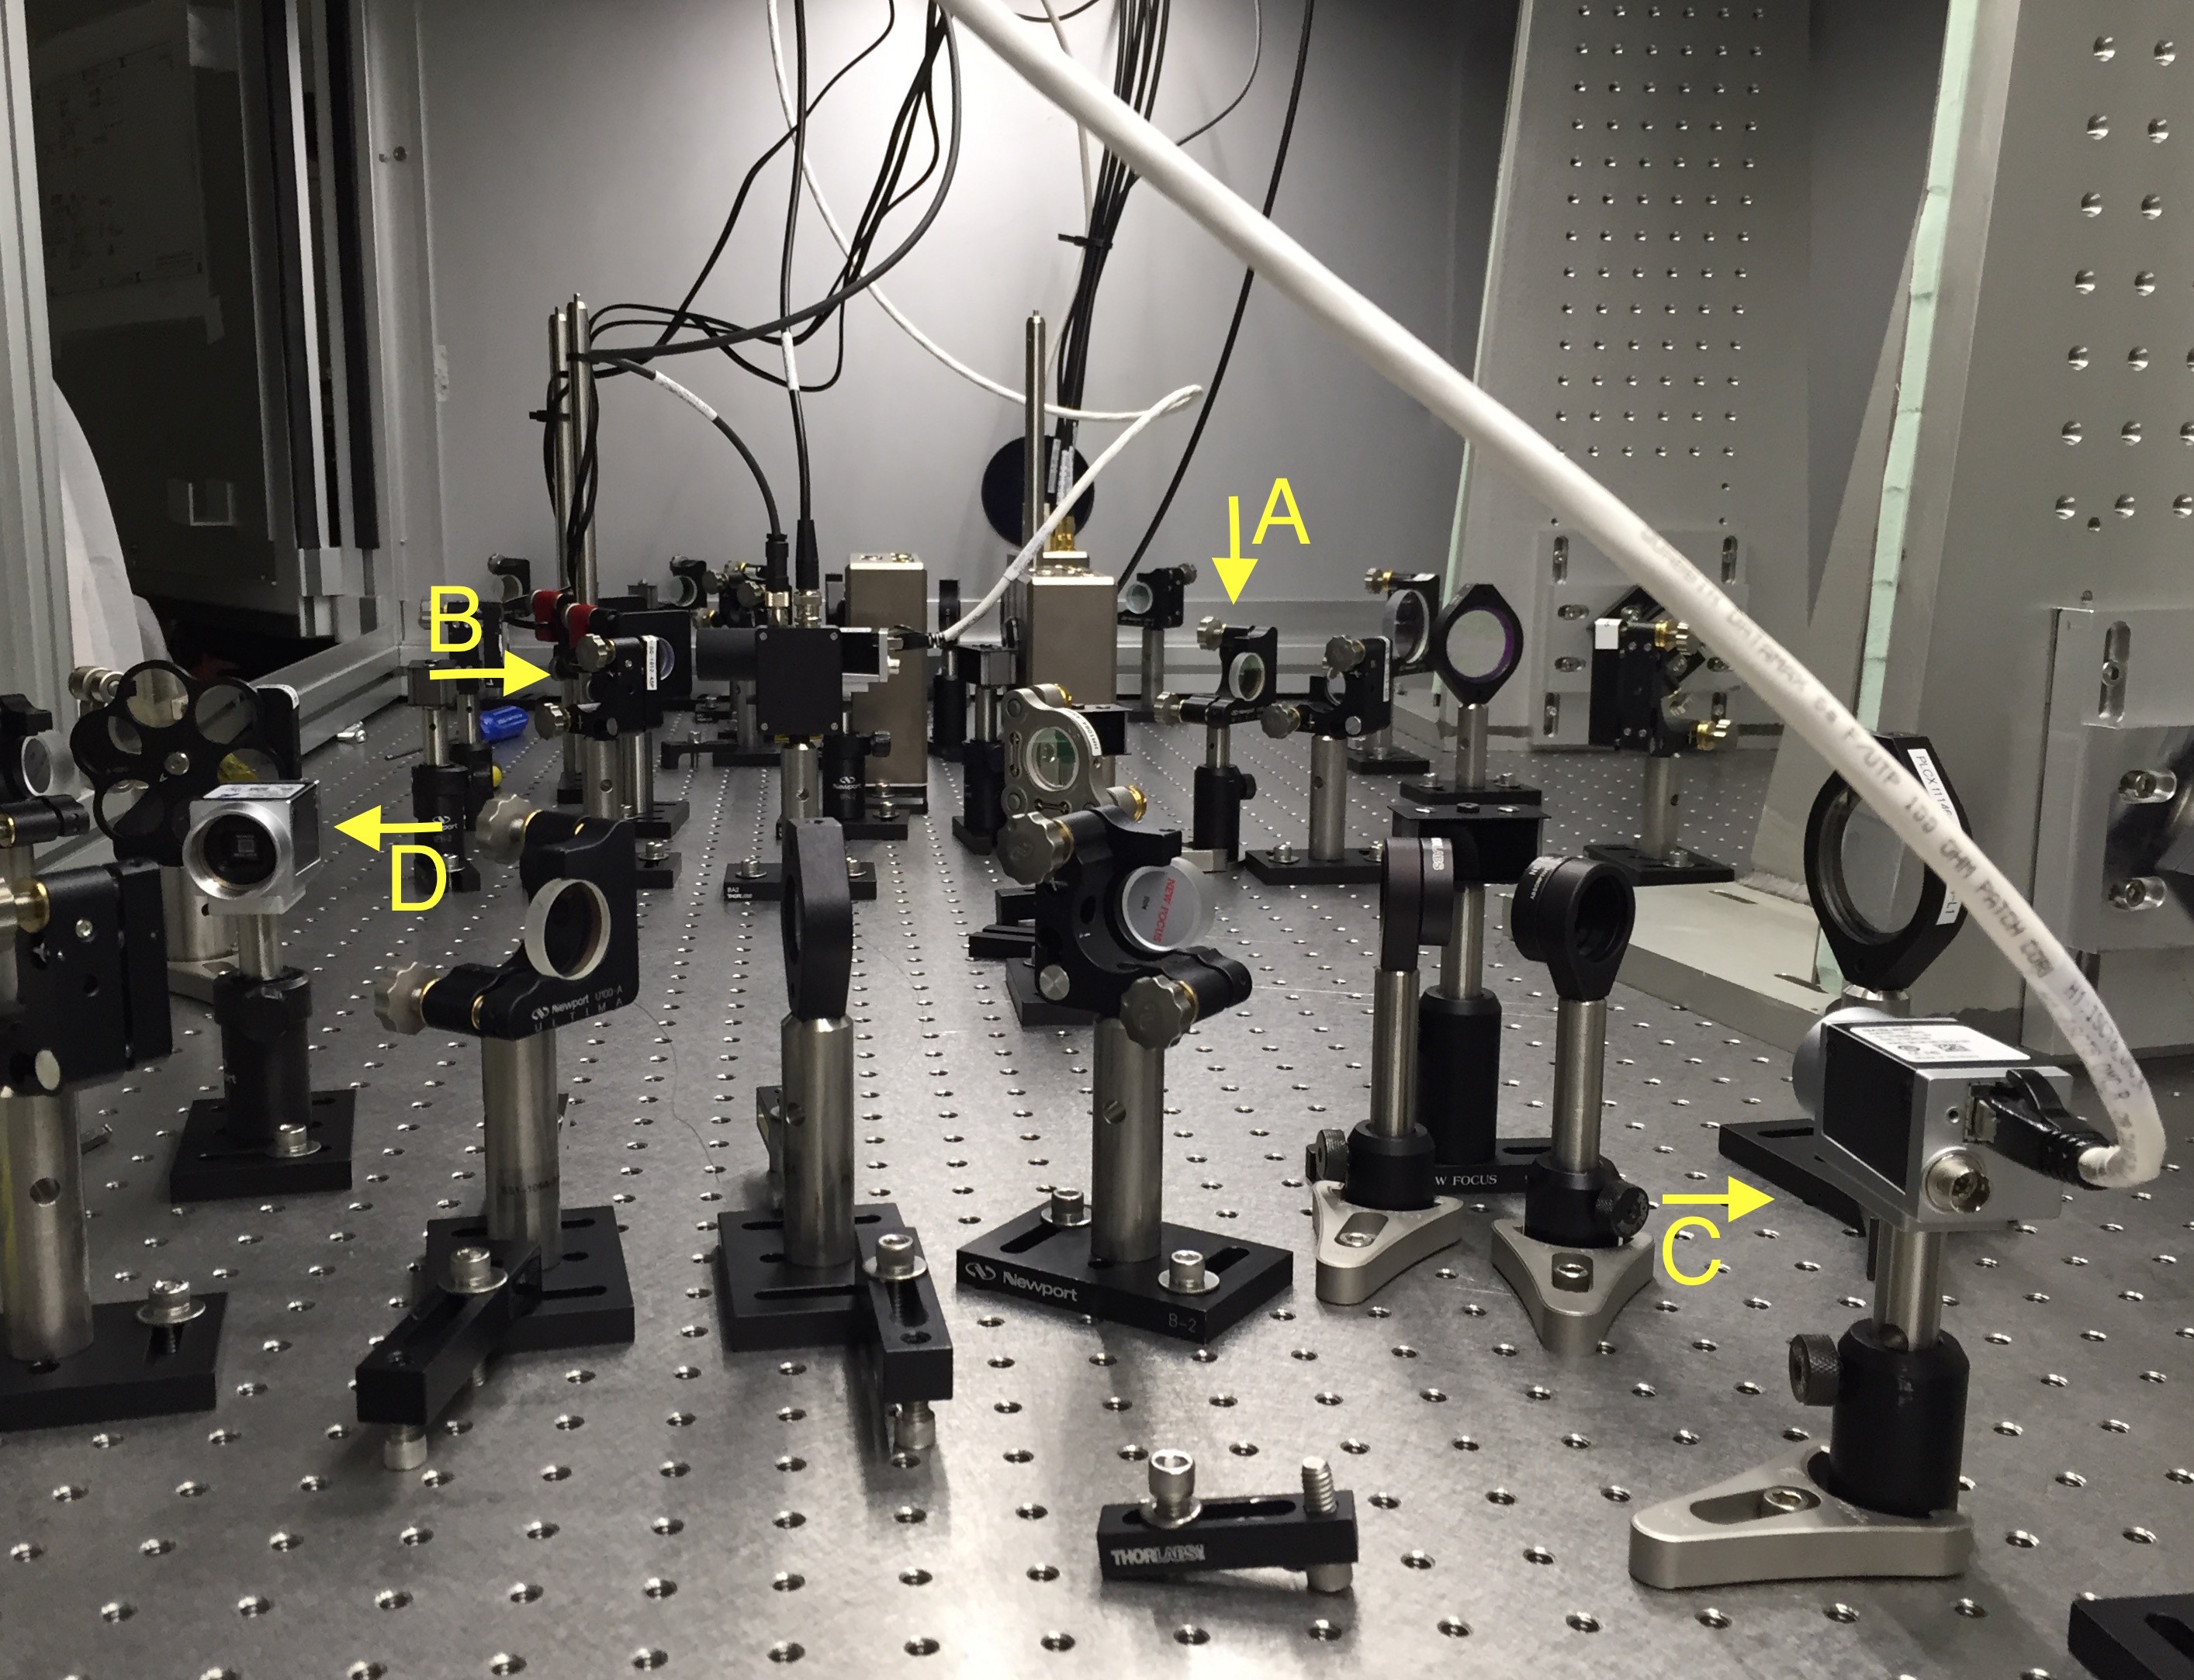
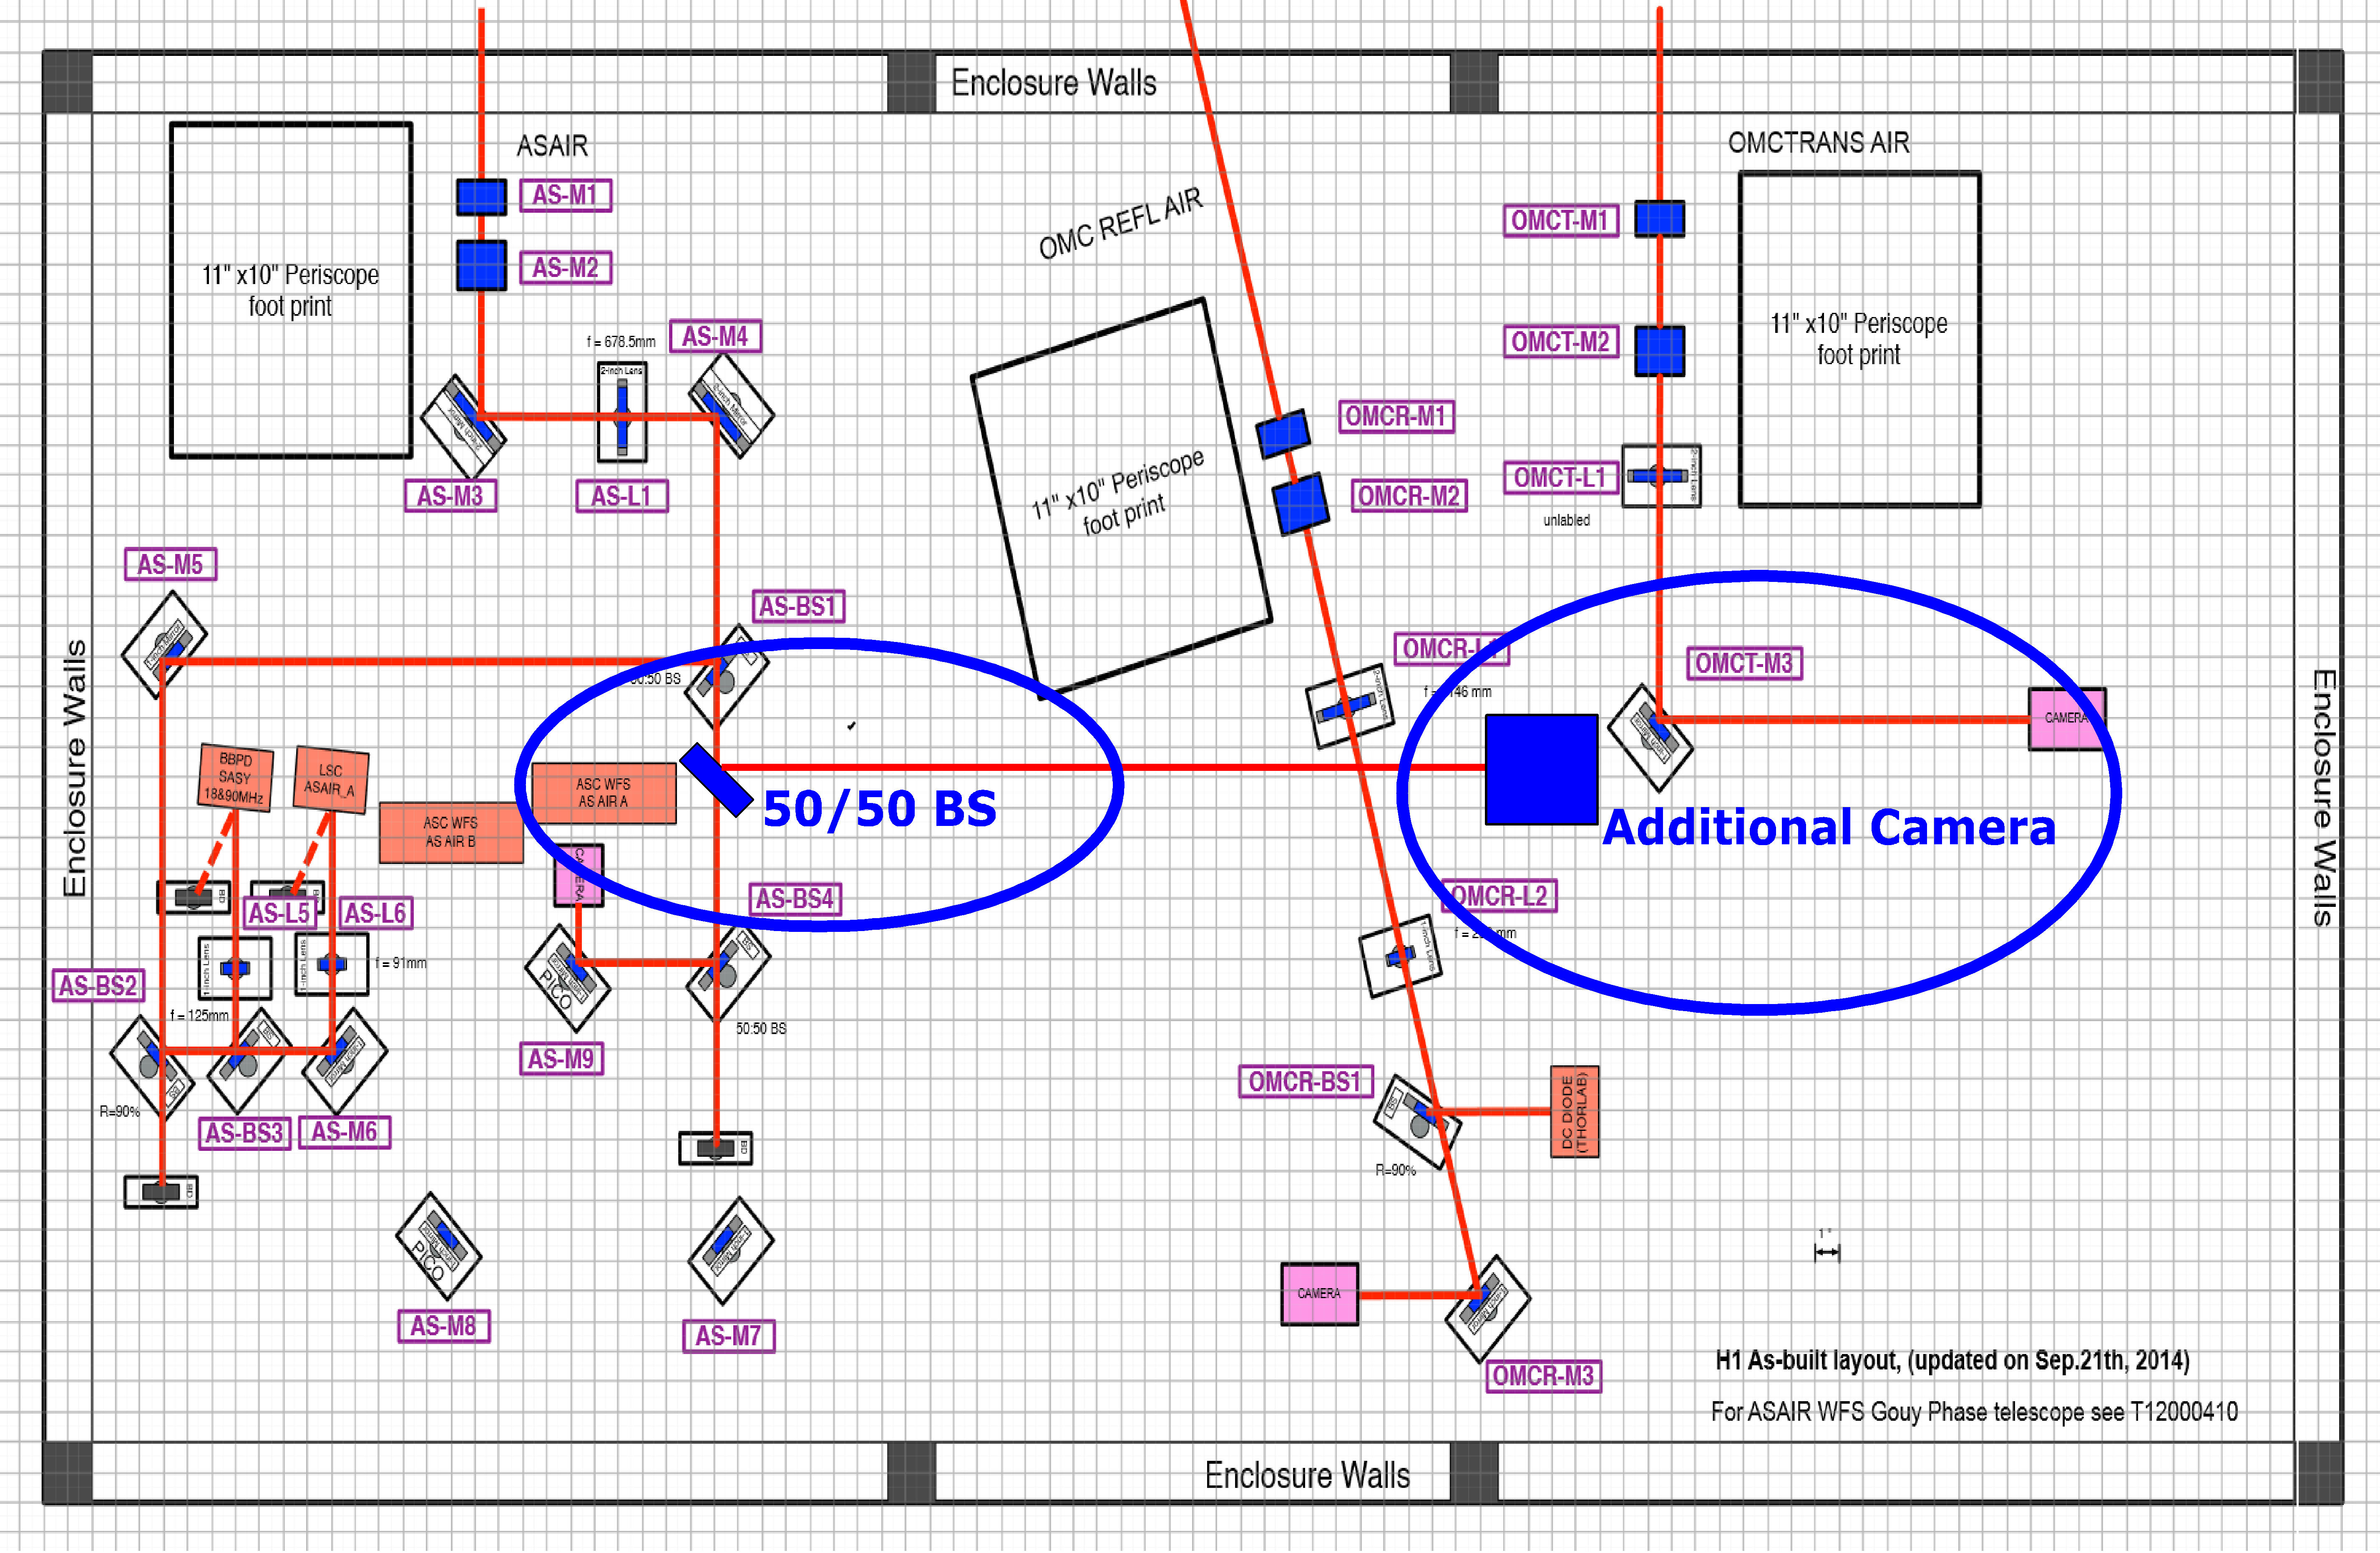
16:23 Ellie and Miguel headed out to ISCT6 to execute WP#5540. (camera)
16:26 Gerardo back from EX to remove some vac equipment to take back to EX
16:30 Richard and Fil at EX for Ecat Temp sensor install/test
16:40 Second Norco truck on site to service CP2
16:42 Christina leaving EX. Returning to get mid station key.
17:01 Sheila is going to start the A2L script testing.
17:05 Vinnie to EX
17:06 Jodie and Jeff done at MX and headed to MY.
17:07 Kyle back from EX
17:07 Safety Kleen leaving site
17:08 John Back from EY
17:15 Richard and Fil are done.
17:28 Eliie and Miguel out of the LVEA for the moment. They plan to return.
17:30 Fil out to Biergarten to label TCS racks.
17:37 Christina leaving MX and heading to MY
17:48 Ellie and Miguel back out to ISCT6. Misaligned SRM, PRM and ITMX for single beam
17:55 Jody called. They’re done at the Mid stations. They’re going to park the forklift by the LSB.
17:57 Richard down to EY to join Ken.
18:03 Ace finished on Y arm and heading down X arm
18:04 Bubba moving something with a forklift from LSB to OSB.
18:05 Vinnie called to let me know that he’s at EY.
18:14 Jody and Jeff out to LVEA to pull temperature data from 3IFO containers
18:19 Hugh to end stations for photos
18:20 Christina and Karen into LVEA for cleaning
18:23 EY LN2 truck leaving
18:26 Evan out to LVEA to look at ISC racks by the PSL
18:29 Evan back
18:44 Ellie and Miguel out of LVEA
18:46 Ellie back out to put in a beam dump
18:47 Jody and Jeff are out of the LVEA
18:48 Carlos done for the day
18:52 Ellie out
18:54 Landry into LVEA for photos
19:06 Richard out to LVEA to turn wireless router off and turn off power distribution cart by output arm.
19:15 Gerardo called from EX (phone showed MY). Pumpe replaced but auc cart neds to stay running for another hour to hour/half
19:30 Kyle leaving Xarm and travelling to EY to check something
19:31 Vinnie back from EY
19:38 Robert and Vinnie ou to EY to position a magnetometer
19:57 LVEA sweep team headed out to the LVEA
20:01 Science mode (after locking) will be hindered by an aux pump still running at EX, Dave and Jonathan doing computer work and an SDF change that’s going to happen due to PEM work at EY to investigate glitching. THe latter will require a work permit that will remain open as the present work will be a temporary fix.
20:18 Ellie is still in the LVEA for Fine Aligning of ISCT6 LVEA sweep will be final upon her exit. Wireless Router was turned back on for her use.
20:35 Dither align script has been renamed from what the wiki page says “ ./dither_align.py” to “./ditherAlign.py”
20:35 Begin initial alignment
22:25 Jeff B into the optics lab
22:33 Jeff B out of the optics lab
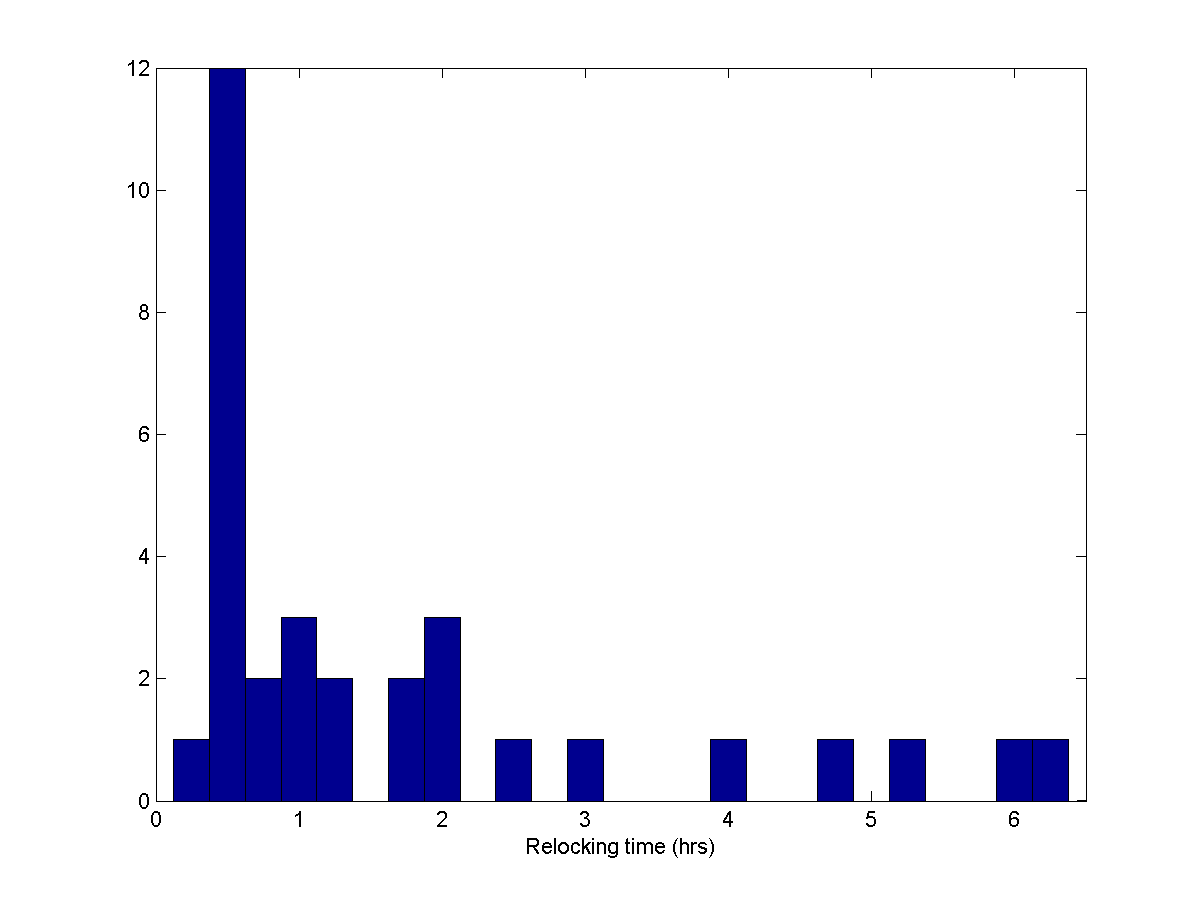
23:00 Still struggling to re-lock. Handing off to Nutsinee
Shift Summary: See Activity Log