Timing Upgrades [WP5370]
Richard, Filiberto, Andres, Jim, Dave:
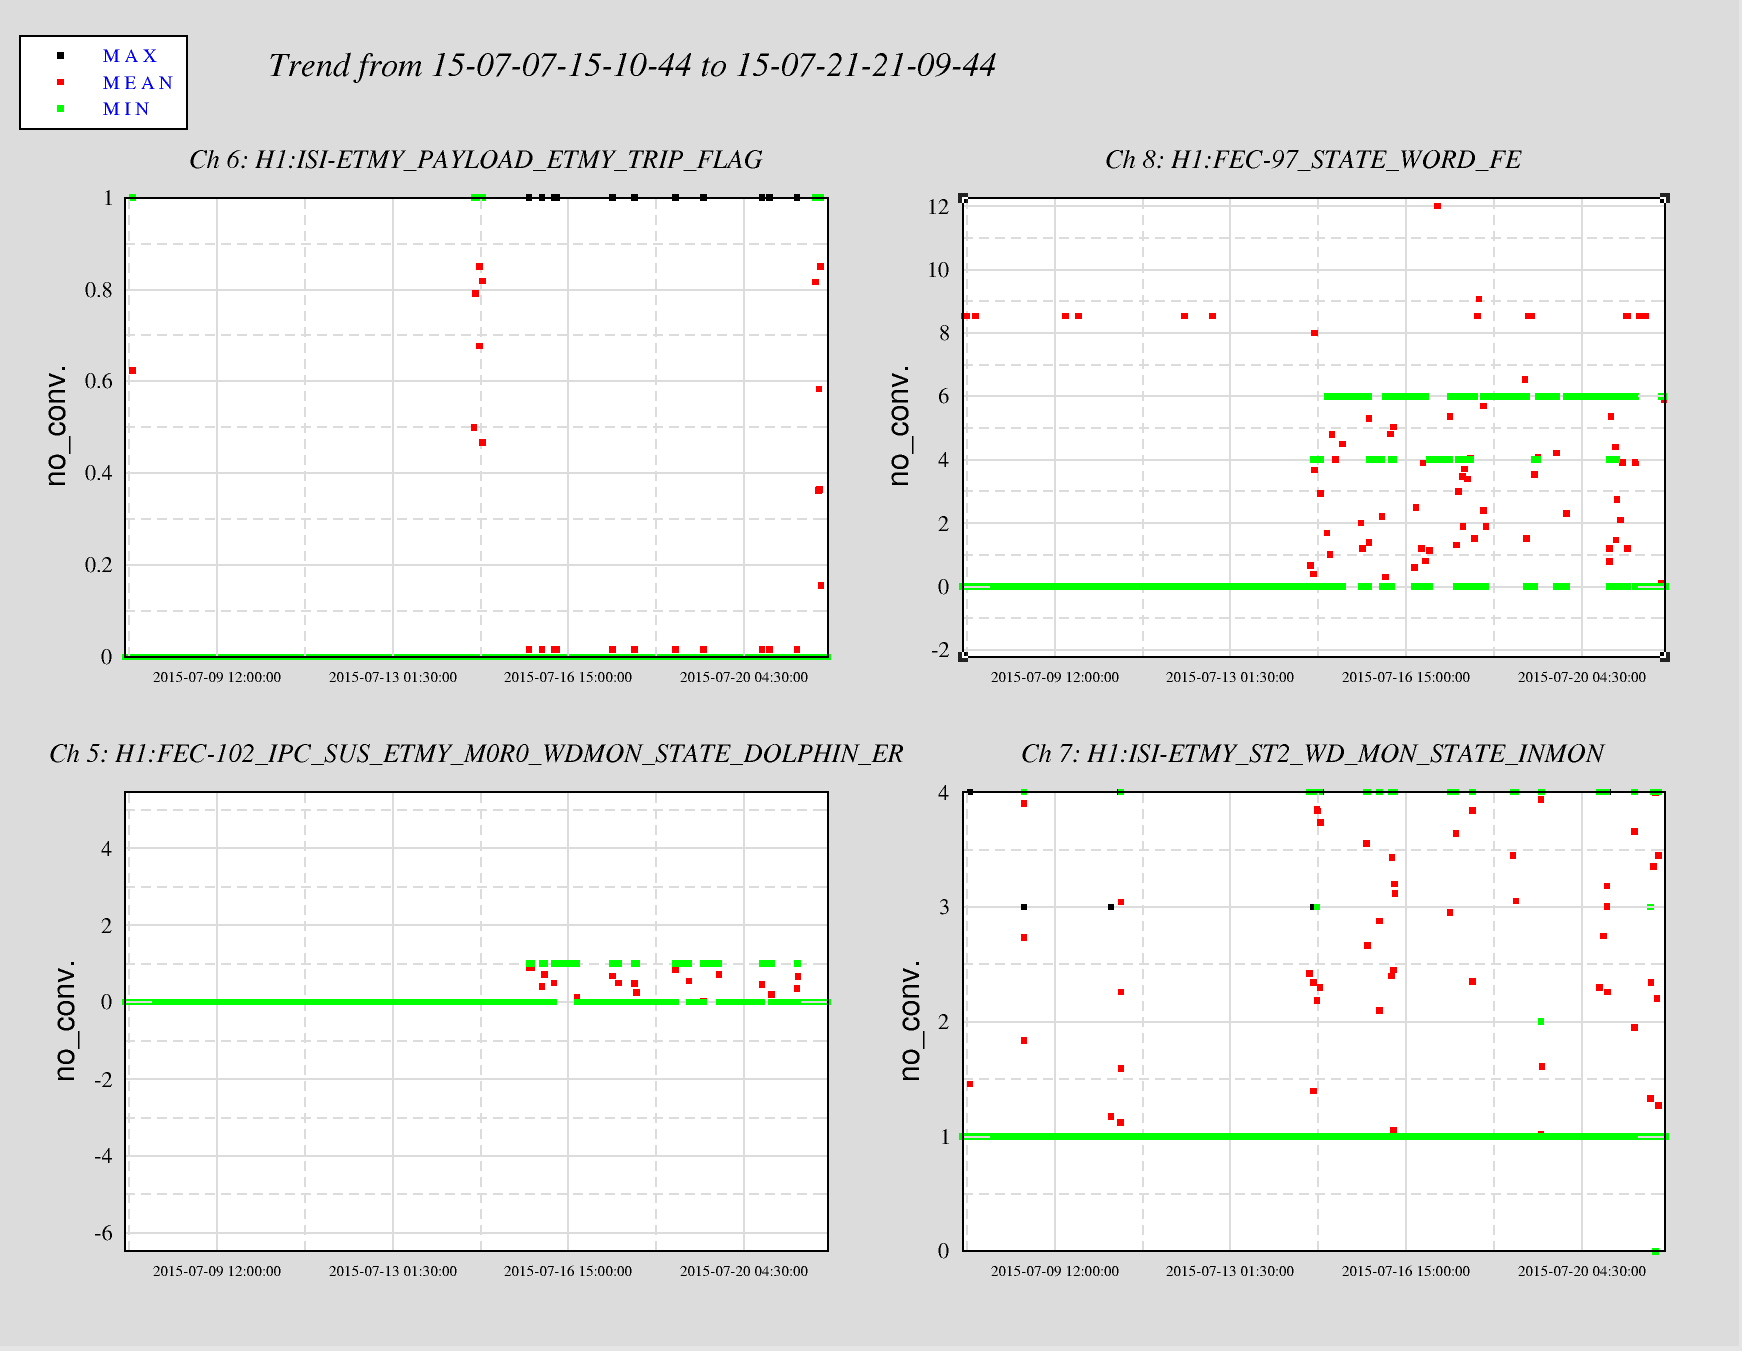
The timing source for the MSR timing master was transitioned from internal GPS receiver to external 1PPS. The transition went smoothly. The broken timing fanout at EY was replaced with a spare. The timing MEDM screen is now GREEN with no errors.
BIOS changes of end station SUS front end computers [WP5374]
Jim:
The BIOS settings for h1susex and h1susey were modified to be identical to the LLO computers. This was an attempt to clear the IOP glitching seen since the faster computers were installed last Tuesday, it did not clear the glitching.
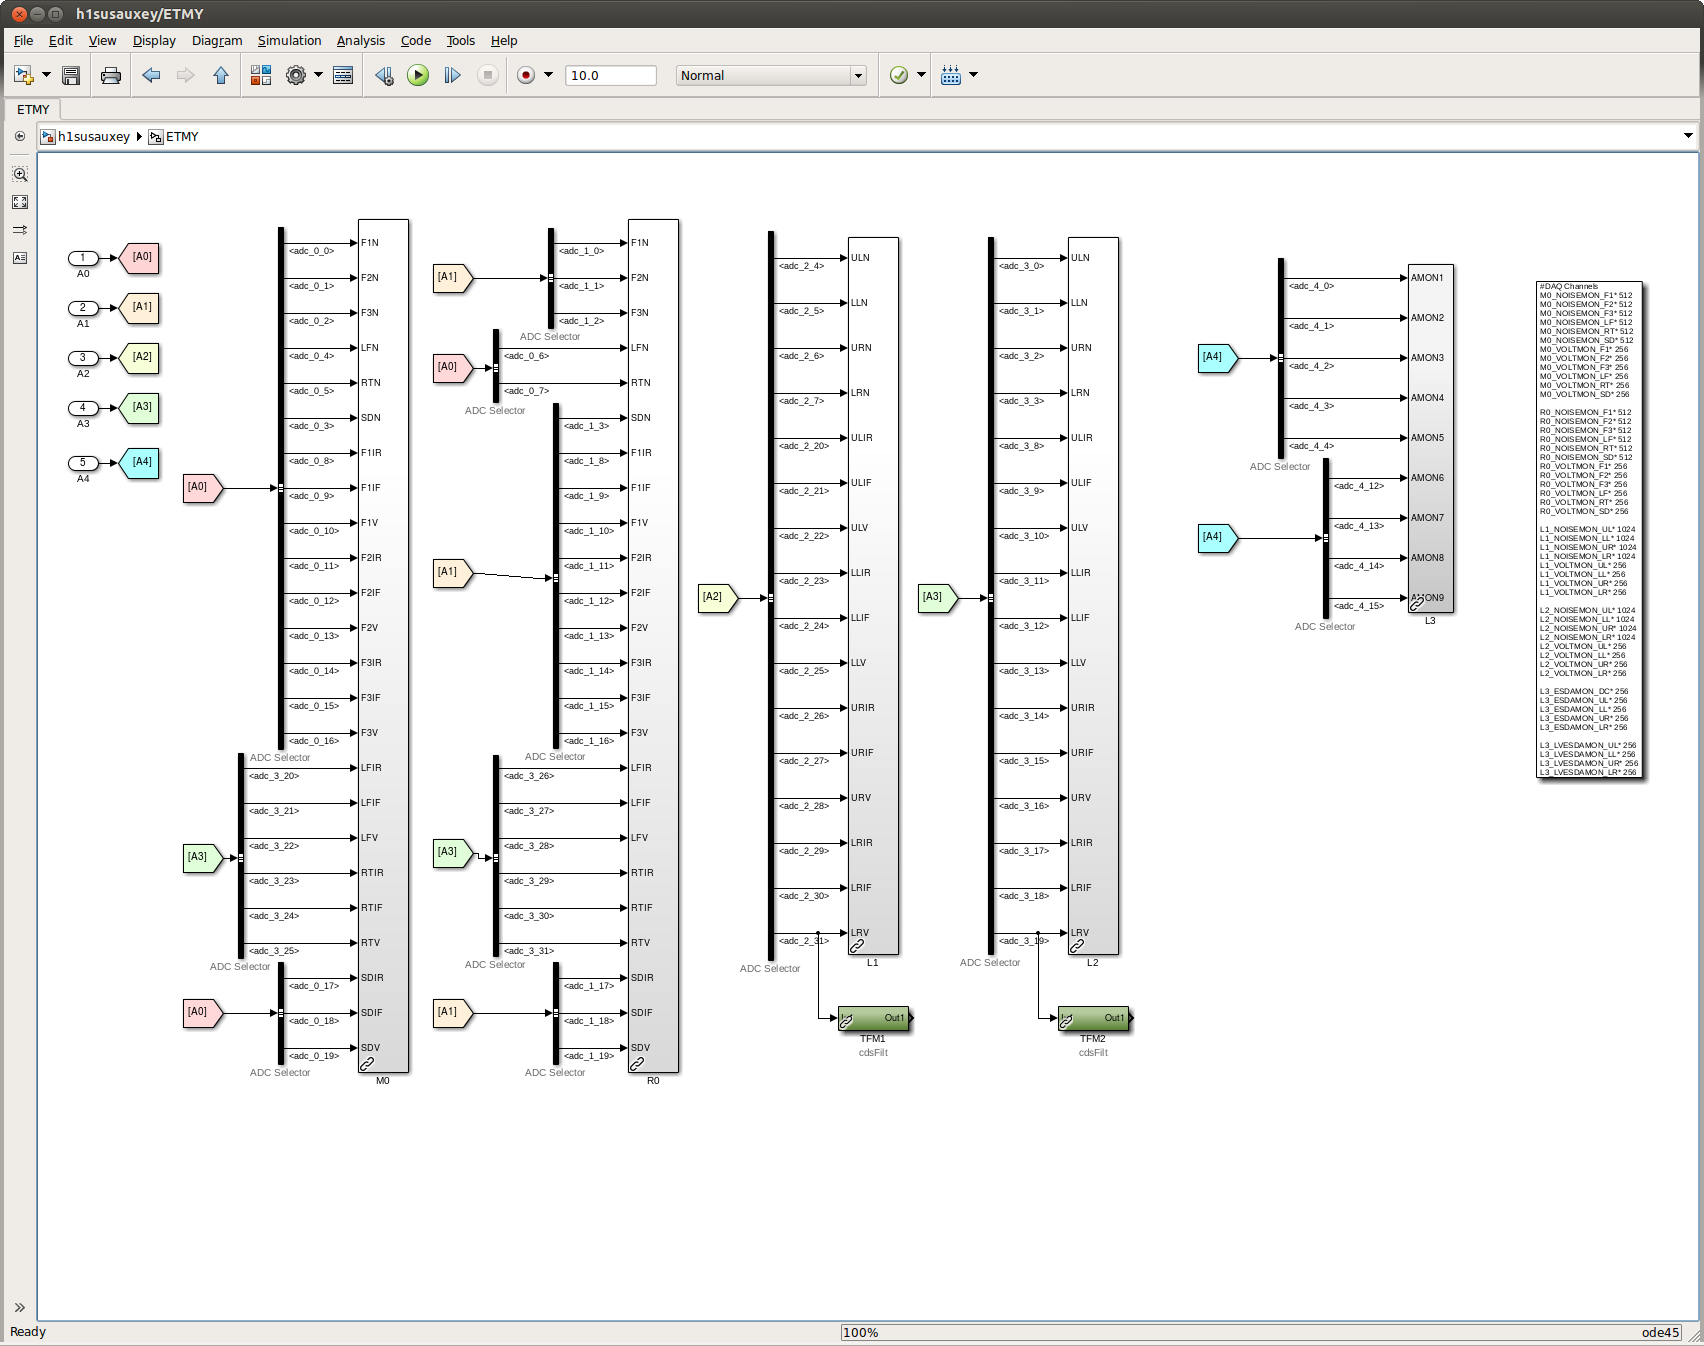
RCG upgrade of end station SUS and OAF [WP5372]
Jeff, Betsy, Jim, Dave:
the h1susetmy and h1susetmypi models were built against RCG branch-2.9 to install the TrueRMS fix. We found an EPICS initialization problem and reverted the models back to RCG-2.9.5. Rolf has found the error so we can try this upgrade again.
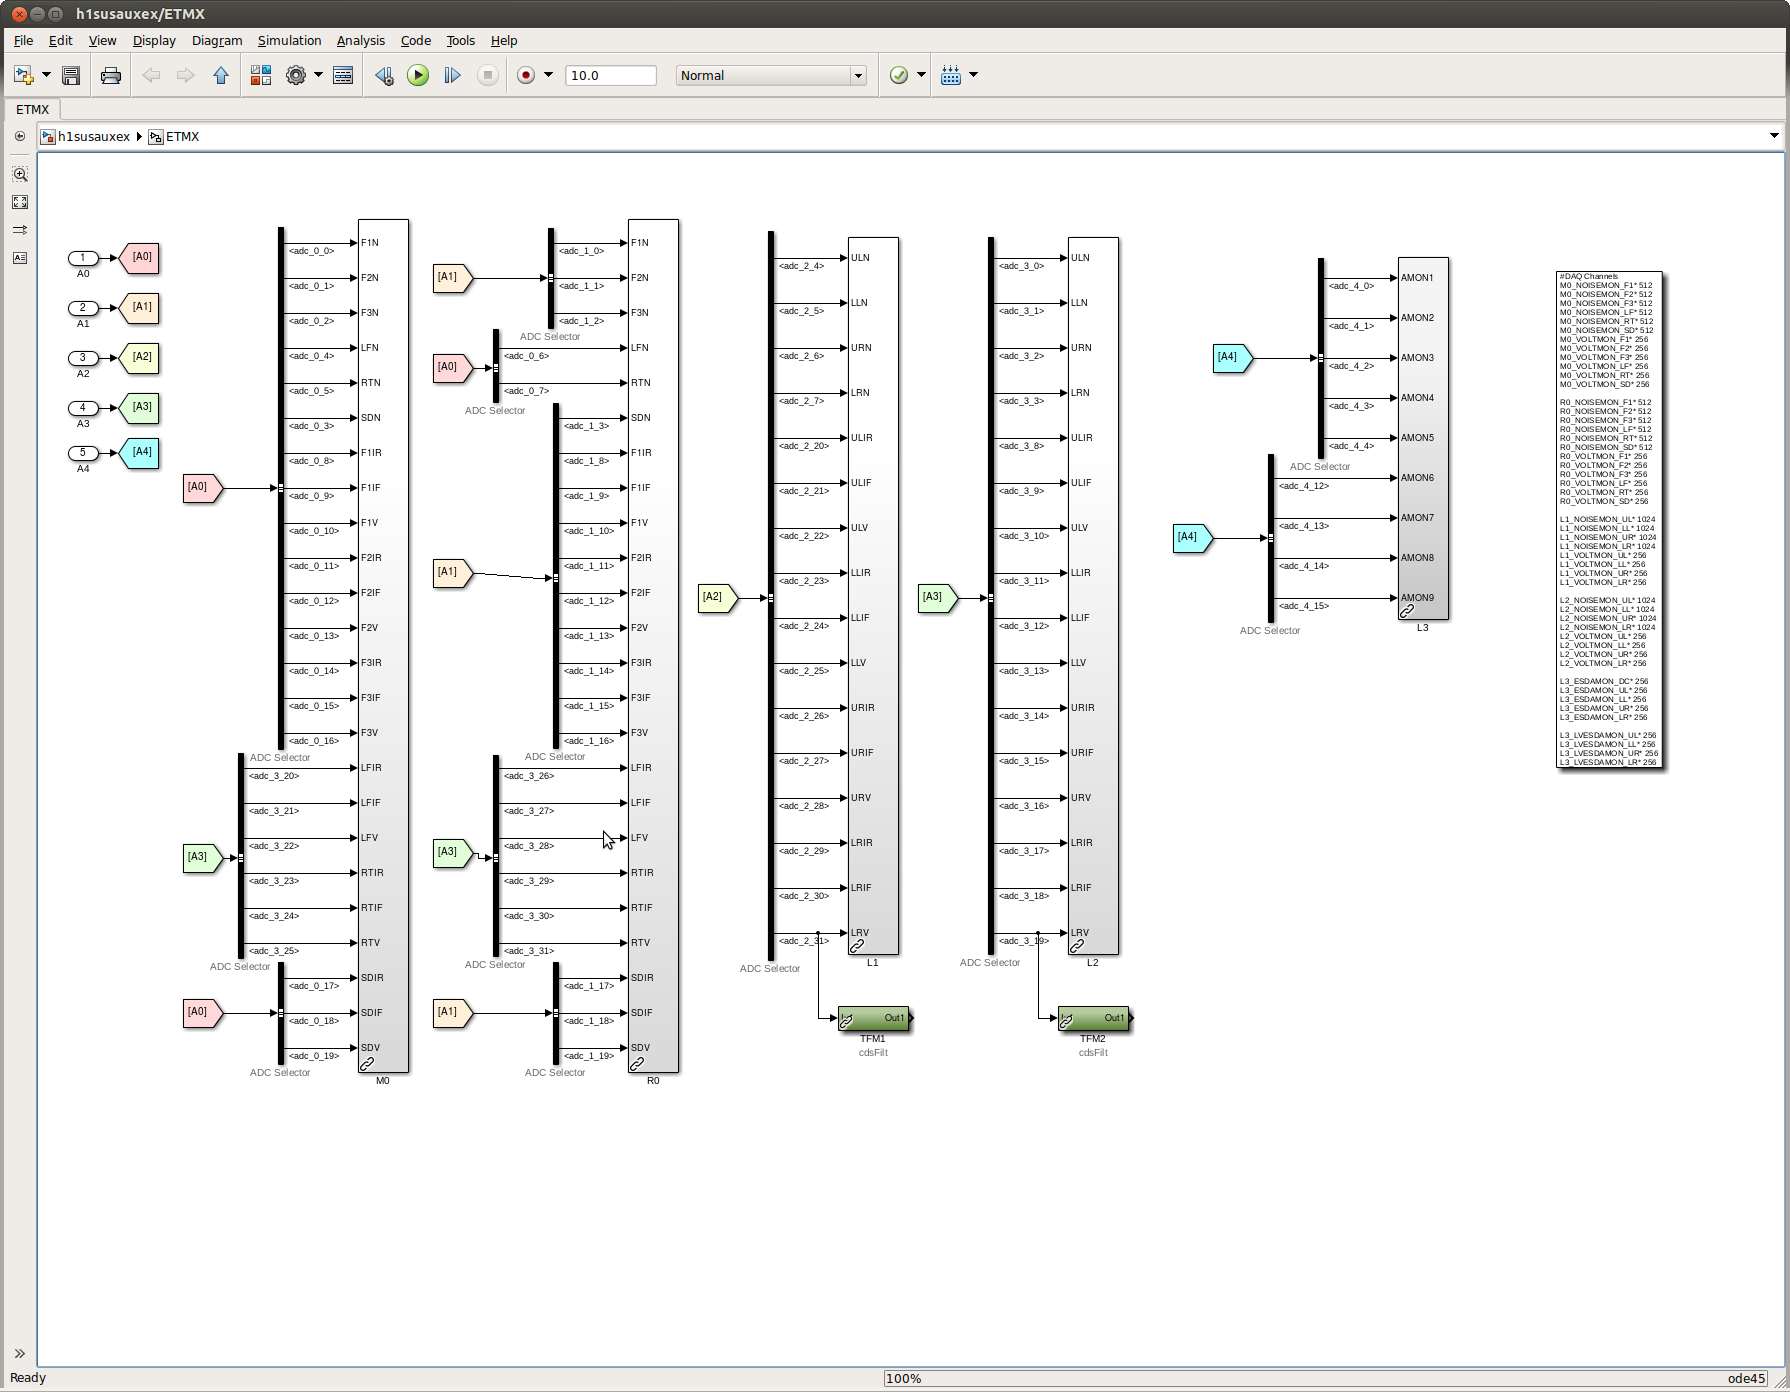
New h1susetmxpi model [WP5365]
Dave, Jim:
the first roll-out of the h1susetmxpi model was made. To remove the "DAQ too small" error and the writing of channels to the commissioning frame which were not needed, I removed all DAQ Channels definitions in PI_MASTER.mdl. At this point the RCG chose two fast channels and set them to "acquire=0" in the ini file. This solves the problem without writing data at 64kHz to the frame. I applied this change to both h1susetmypi and h1susetmxpi
Add Beam Tube Accelerometers to PEM mid stations [WP5375]
Robert, Vinny, Dave:
the models h1pemmx and h1pemmy were modified to change the 11th ADC channel from a generic input to the BEAMTUBE_CRYO acceleromter channel. They were added to the science frame at 2kHz.
MSR Front end Rack Network Switch Reboot [WP5371]
Jim:
As part of the FE channel access problem investigation, the Netgear switch which supplies the FE-VLAN to the front end computers, boot, build and guardian was rebooted. The downtime was about a minute and all systems reconnected seamlessly afterwards. It does not appear to have fixed the problem.
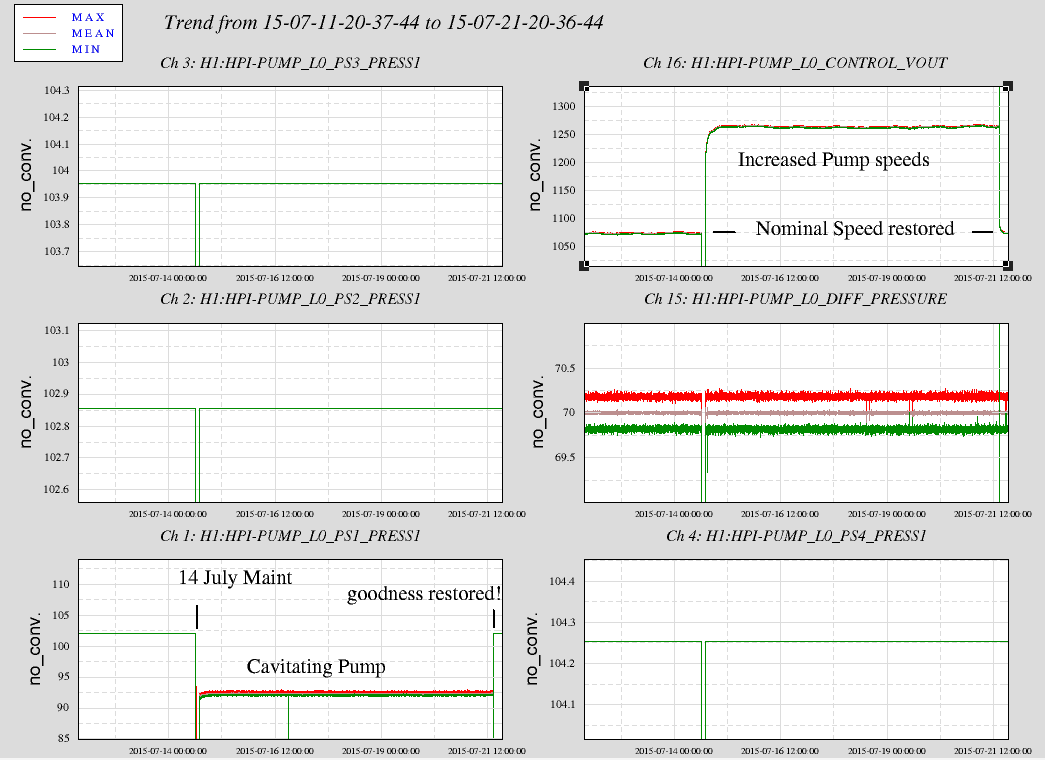
MX PEM power supply failure
Jim, Dave, Richard, Filiberto:
While restarting h1pemmx models I noticed the ADC data was zero, starting around 9pm Friday 17th July PDT. We found the -18V power supply to be off. We replaced it with a spare and the AA chassis is now operating correctly.
Server reboots
Patrick, Dave, Jim
The following servers were rebooted as part of preventative maintenance: all conlog machines, h1guardian0, cdsegwe0, h1hwinj0, h1hwinj1.
after the first reboot of h1guardian0 the guardian nodes did not auto start. After a second reboot guardian started correctly.