kyle.ryan@LIGO.ORG - posted 11:17, Monday 03 August 2015 (20161)
1050 - 1100 hrs. local -> In and out of X-end VEA (stopped RGA heating)
Matt E and I were talking about the broadband noise that is showing up coherently in the OMC DC readout, increasing the noise by 15% or something above shot noise, at frequencies above ~80 Hz. The observation is that this noise increases as the input power is increased (i.e., the watts/rtHz on the OMC DC PDs goes up with higher input power). Amplitude noise on one or more RF sidebands is a plausible source of this noise (not a new idea), and we wanted to suggest specific tests be done to look for RF sideband noise. For example:
There have been some questions about how to run the HWS code.
The HWS code runs on one of three HWS computers, we have one at each end station and one at the corner station. I have set up a tmux session to run the HWS code constantly at the corner station. If the code is running, the heartbeat will flash on the TCS HWS ITMX/Y medm screens, and the seidel aberrations will update once a second on the HWS ITMX/Y CODE screen. To take a measurement using the HWS, in addition to having thr HWS code running, you also need to turn on the RCX link framegrabber power, the Dalsa 1M60 Camera power, and the Superluminescent diode (SLED) power switched on the HWS medm screen. To increase the lifetime of the SLED and to avoid injecting 1Hz noise into the PEM channels (we are working on filters on the camera power supply to fix this one), we are leaving the HWS hardware off if we are not using it.
If you want to stop or restart the corner station code for some reason, you can ssh into the cornerstation hws computer:
>> ssh -X controls@h1hwsmsr
and attach to the tmux session
>> tmux attach
This webpage (http://www.dayid.org/os/notes/tm.html) has a list of tmux commands. We are running two sessions, one for ITMX and one for ITMY. Go to the relevant session, go to the folder ~/temp, and run the HWS code with the command
>> Run_HWS_H1ITMX (or ITMY....)
Jim and Dave have installed tmux on the end station HWS computers (thanks guys), so the code is running at these computers now too. It is intialized with the command >> Run_HWS_H1ETMX or >>Run_HWS_H1ETMY in ~/temp, after you log into controls@h1hwsey (or h1hwsex).
There was a persistent excitation in:
H1:ALS-C_REFL_DC_BIAS_EXC
on h1lsc. This was presumably from an awg process left running by Evan on operator1 workstation.
I killed ALL testpoints on h1lsc (dcuid 10):
jameson.rollins@operator1:~ 0$ diag -l -z
supported capabilities: testing testpoints awg
diag> tp clear 10 *
test point cleared
diag>
Actually, you should clear the awg, then clear the test point. As it is now, there is still an awg slot with a sine excitation, but no test point.
I took down the IFO at 717 PST for locking training. The insiral range shows that it was locked for over 12 hours. Awesome!
Based on measurements of the DARM OLTF and the EY PUM/test crossover that Jeff and I took last week, we can estimate the current value of the EY ESD actuation coefficient. It is 1.45×10⁻¹⁰ N/V2, with a 20 % uncertainty. This is an 80 % increase compared to the previous value (0.8×10⁻¹⁰ N/V2) which was measured at the end of May.
This number mostly relies on the crossover measurement, since above 10 Hz, the effect in the OLTF of changing the actuation coefficient is largely the same as changing the optical gain. Additionally, this number requires us to assume a number for the PUM actuation coefficient. Here I assume that it has not changed since the May calibration (i.e., I use 7.0×10⁻¹³ m/ct at dc).
Note that the modeled crossover doesn't really agree well with the measurement above 80 Hz. More investigation is required, particularly since during ER7 we already knew there was an issue with the DARM model around 10 Hz. (This discrepancy is why I say the uncertainty in the coefficient is no better than 20 %.)
To generate this number, I took Jeff's ER7 calibration script and made a version (H1DARMXO.m) that models the crossover. Both scripts (and the parameters file for the July 25 measurement) live in the CalSVN under Runs/PreER8/H1/Scripts/DARMOLGTFs. All parameters were left the same as their ER7 values except for the optical gain (I use 1.0×10⁶ ct/m), the DARM pole (I use 330 Hz), and the EY L3 drive strength (I use 11×10−15 m/ct at dc). By tuning the L3 drive strength to match the measured crossover, we can extract the ESD actuation coefficient, assuming the rest of the L3 signal chain has been well-characterized. This is how I get the number quoted above.
The 80 % increase is sort of consistent with the 70 % increase that we saw when retuning the L3 digital gain post-vent. Strictly speaking, that was a measurement of the relative strengths of EX and EY. However, the DARM OLTF (with the retuned EY L3 gain) stayed roughly the constant before and after the vent, indicating that this 70% increase really is a change in EY.
I would like to clarify the relationship between the above entry and Sudarshan's entry.
The above entry is making a statement about a number (in N/V2) which characterizes the force applied to the test mass given a certain amount of voltage applied to the ESD (both its bias and its quadrants).
Sudarshan's entry is making a statement about a number (in m/ct) which characterizes the test mass displament given a certan number of counts in the DARM control signal. Therefore, it includes not only the above ESD strength (in N/V2), but also the mechanical response of the test mass, the electronic driver transfer function, the DAC, and the digital control filters for EY. In particular, it includes the digital EY L3 drivealign gain, which was changed from 50 ct/ct to 30 ct/ct after the vent in order to compensate for an unknown* increase in some other part of the EY actuation chain. Therefore, we expect Sudarshan's number to be small; if the compensation had been done perfectly, we would expect 0% change.
*Although it is unknown, I hypothesize that it is due to the discharging of EY resulting in an increase in the ESD actuation coefficient (in N/V2).
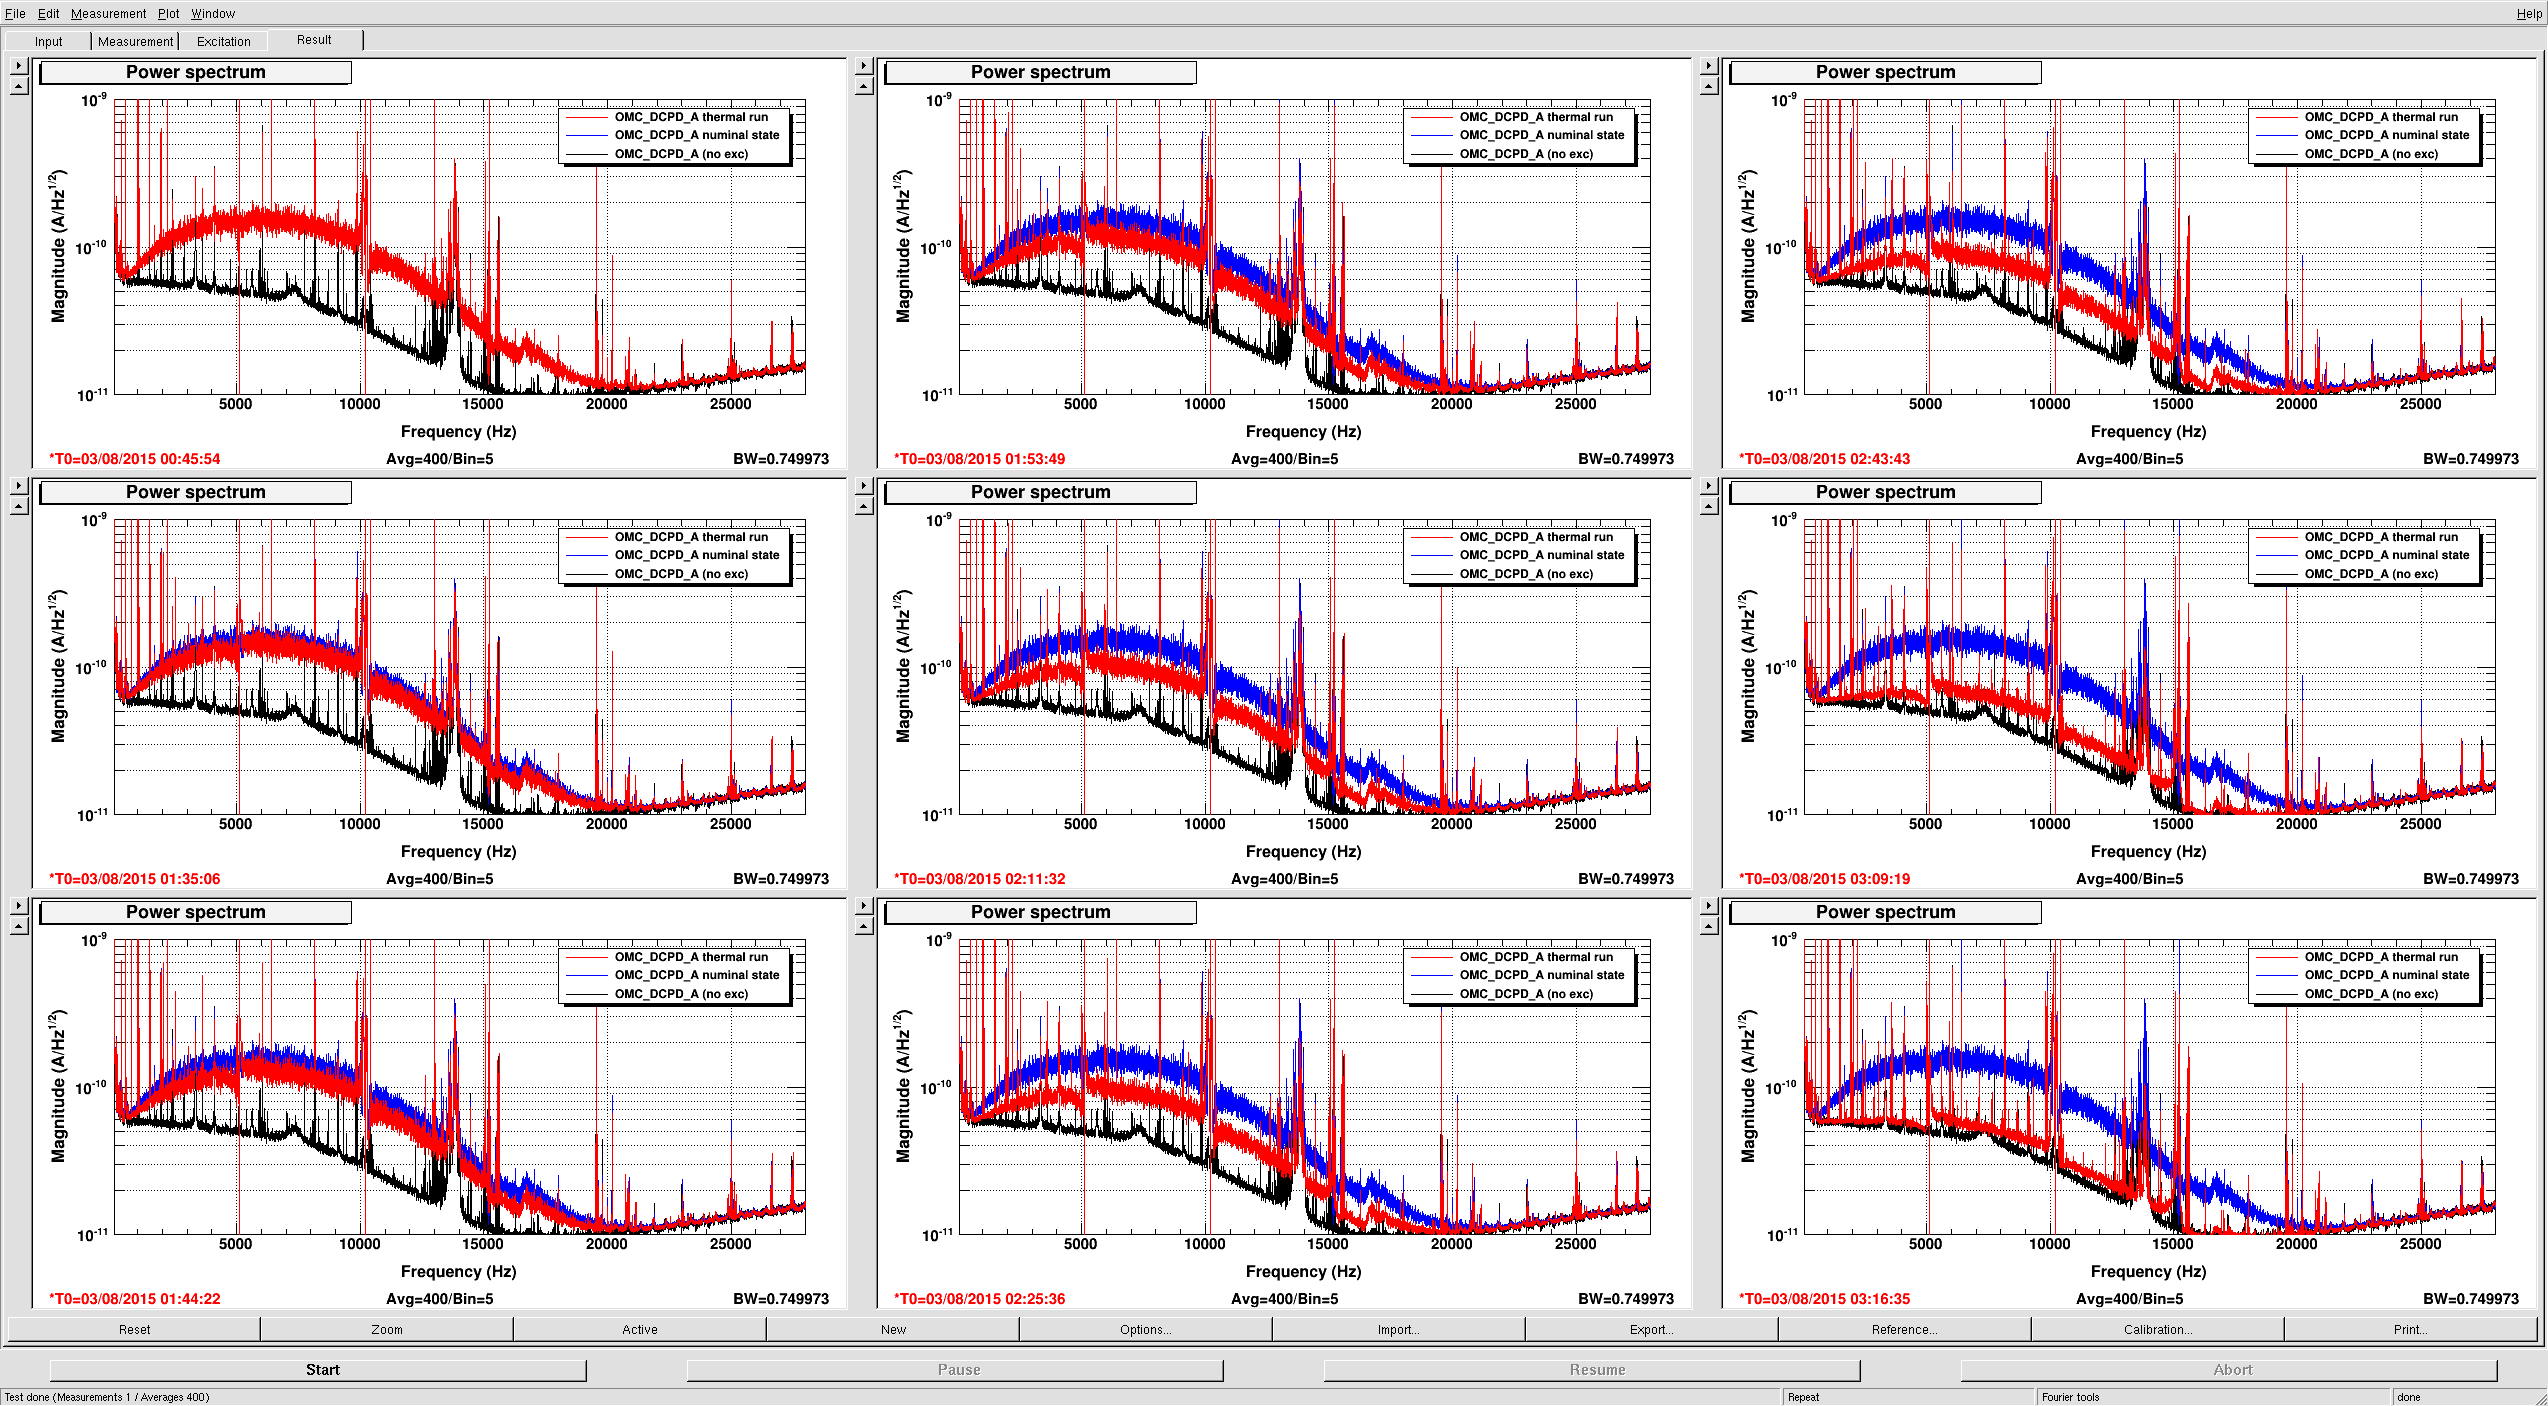
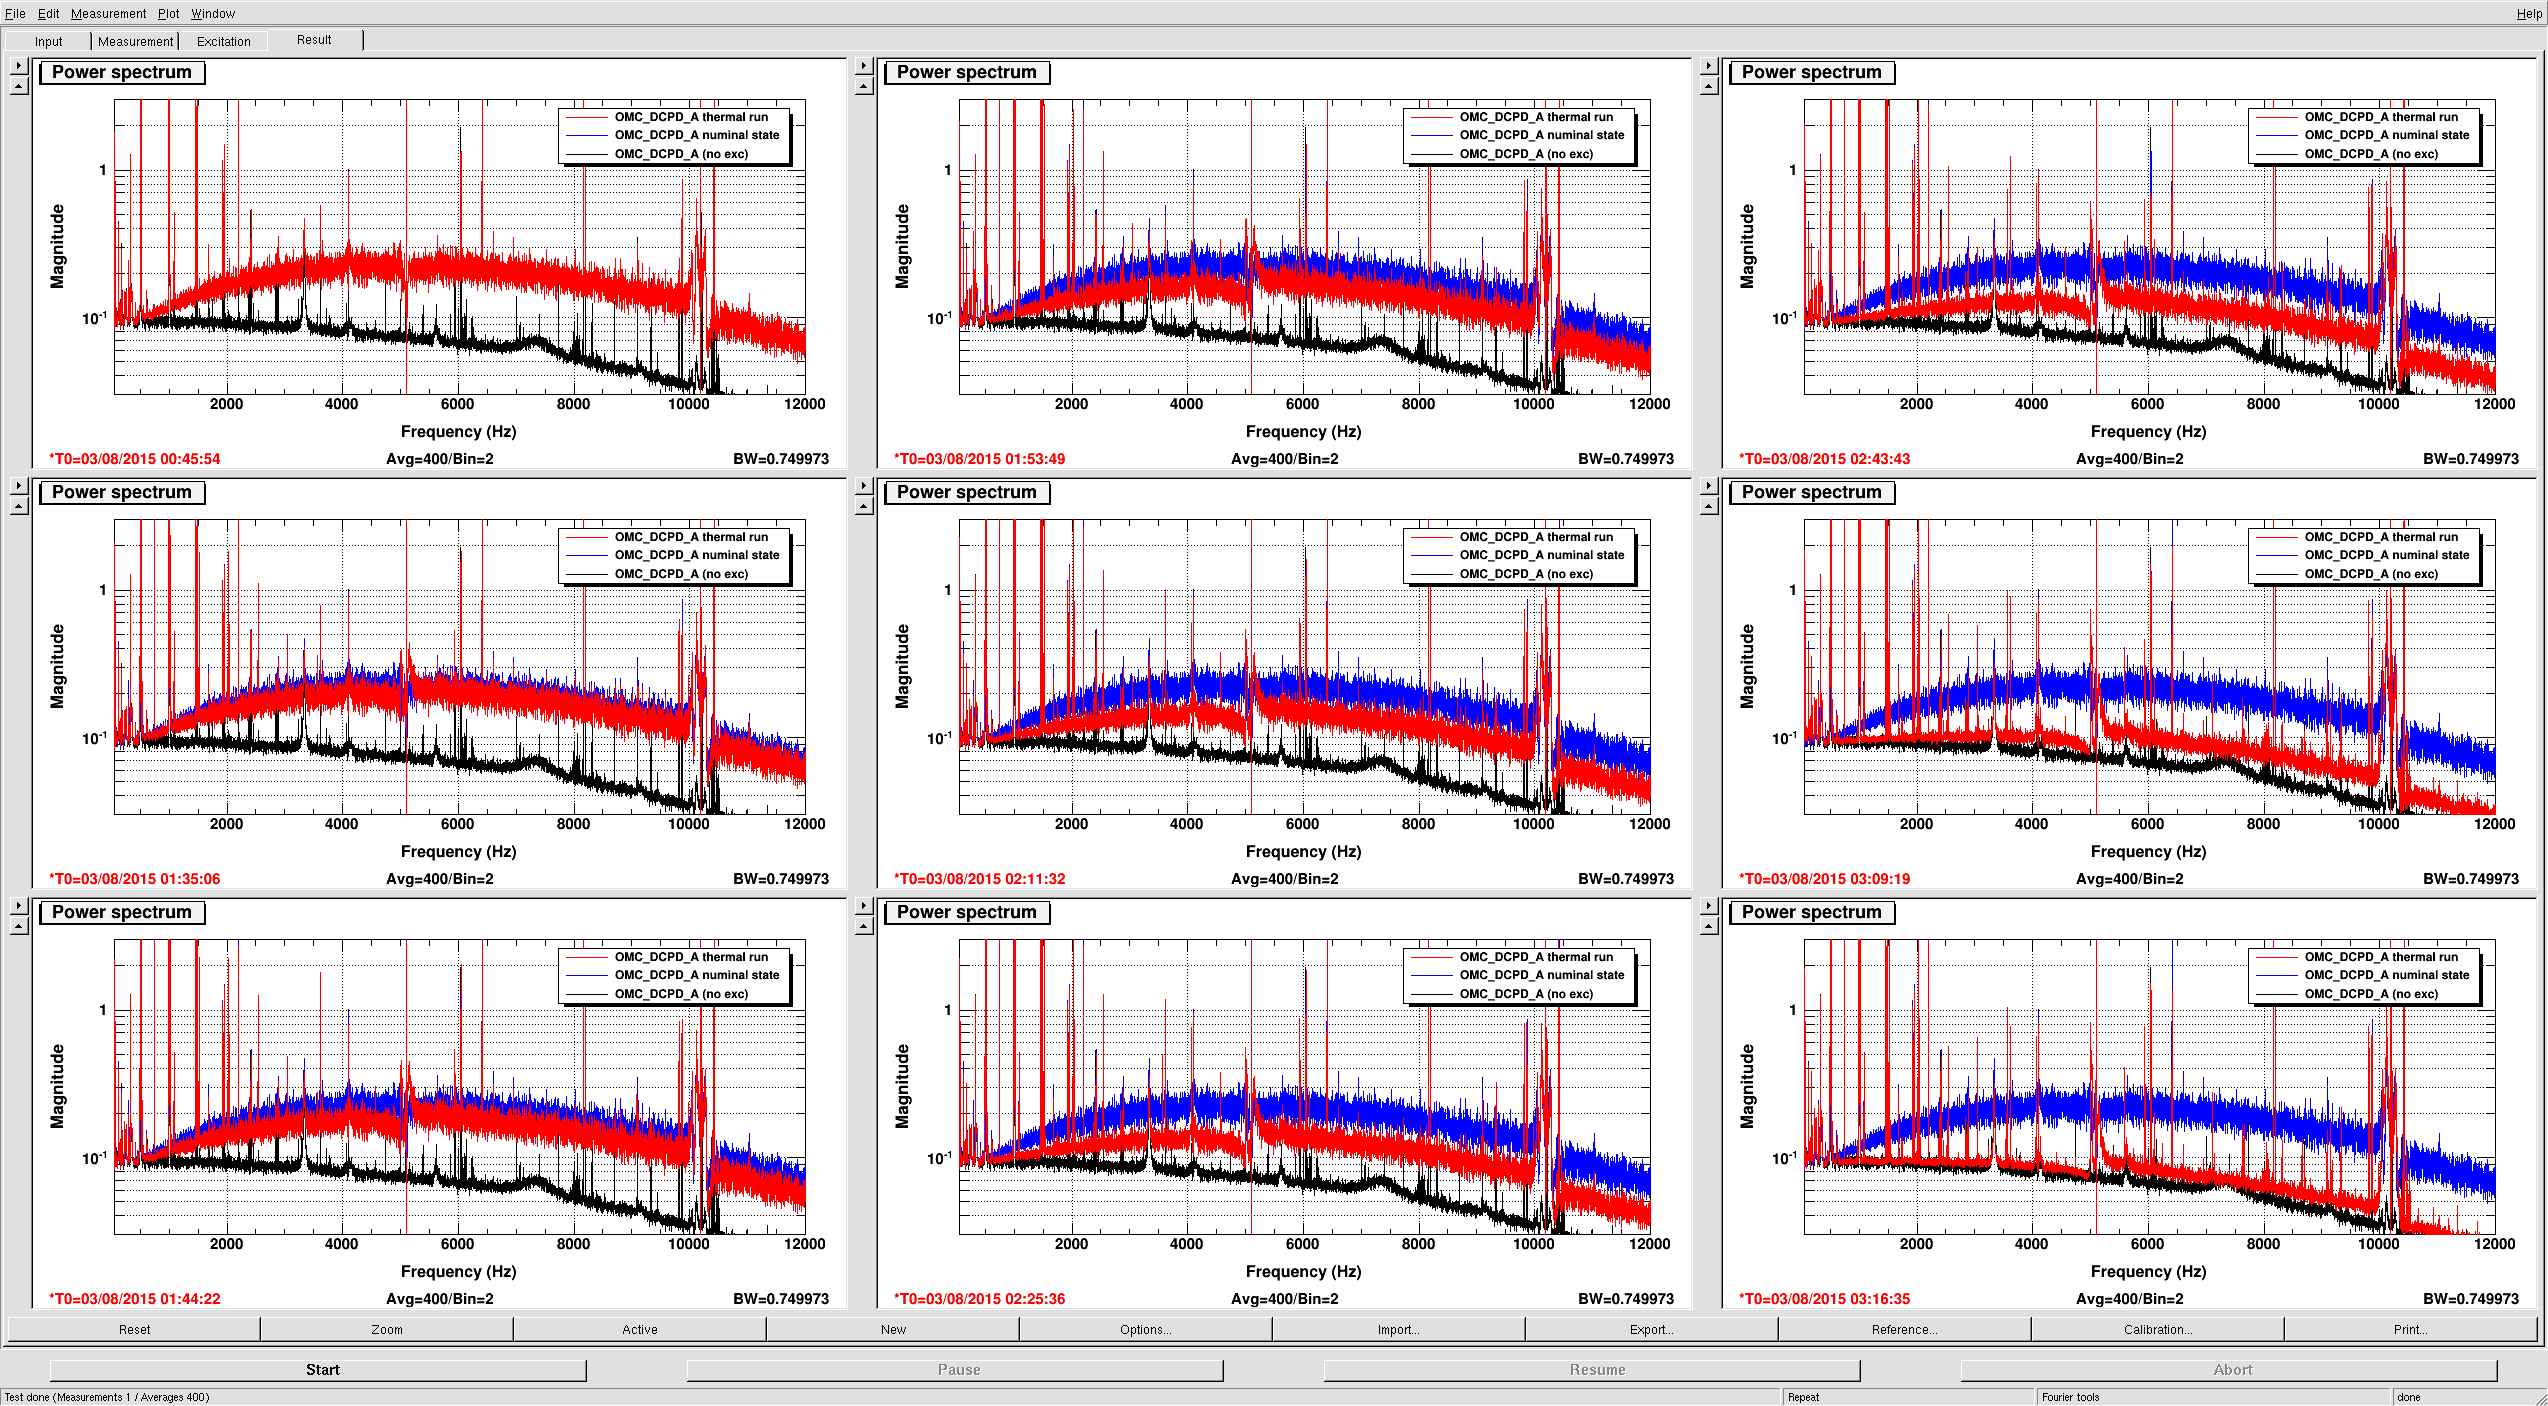
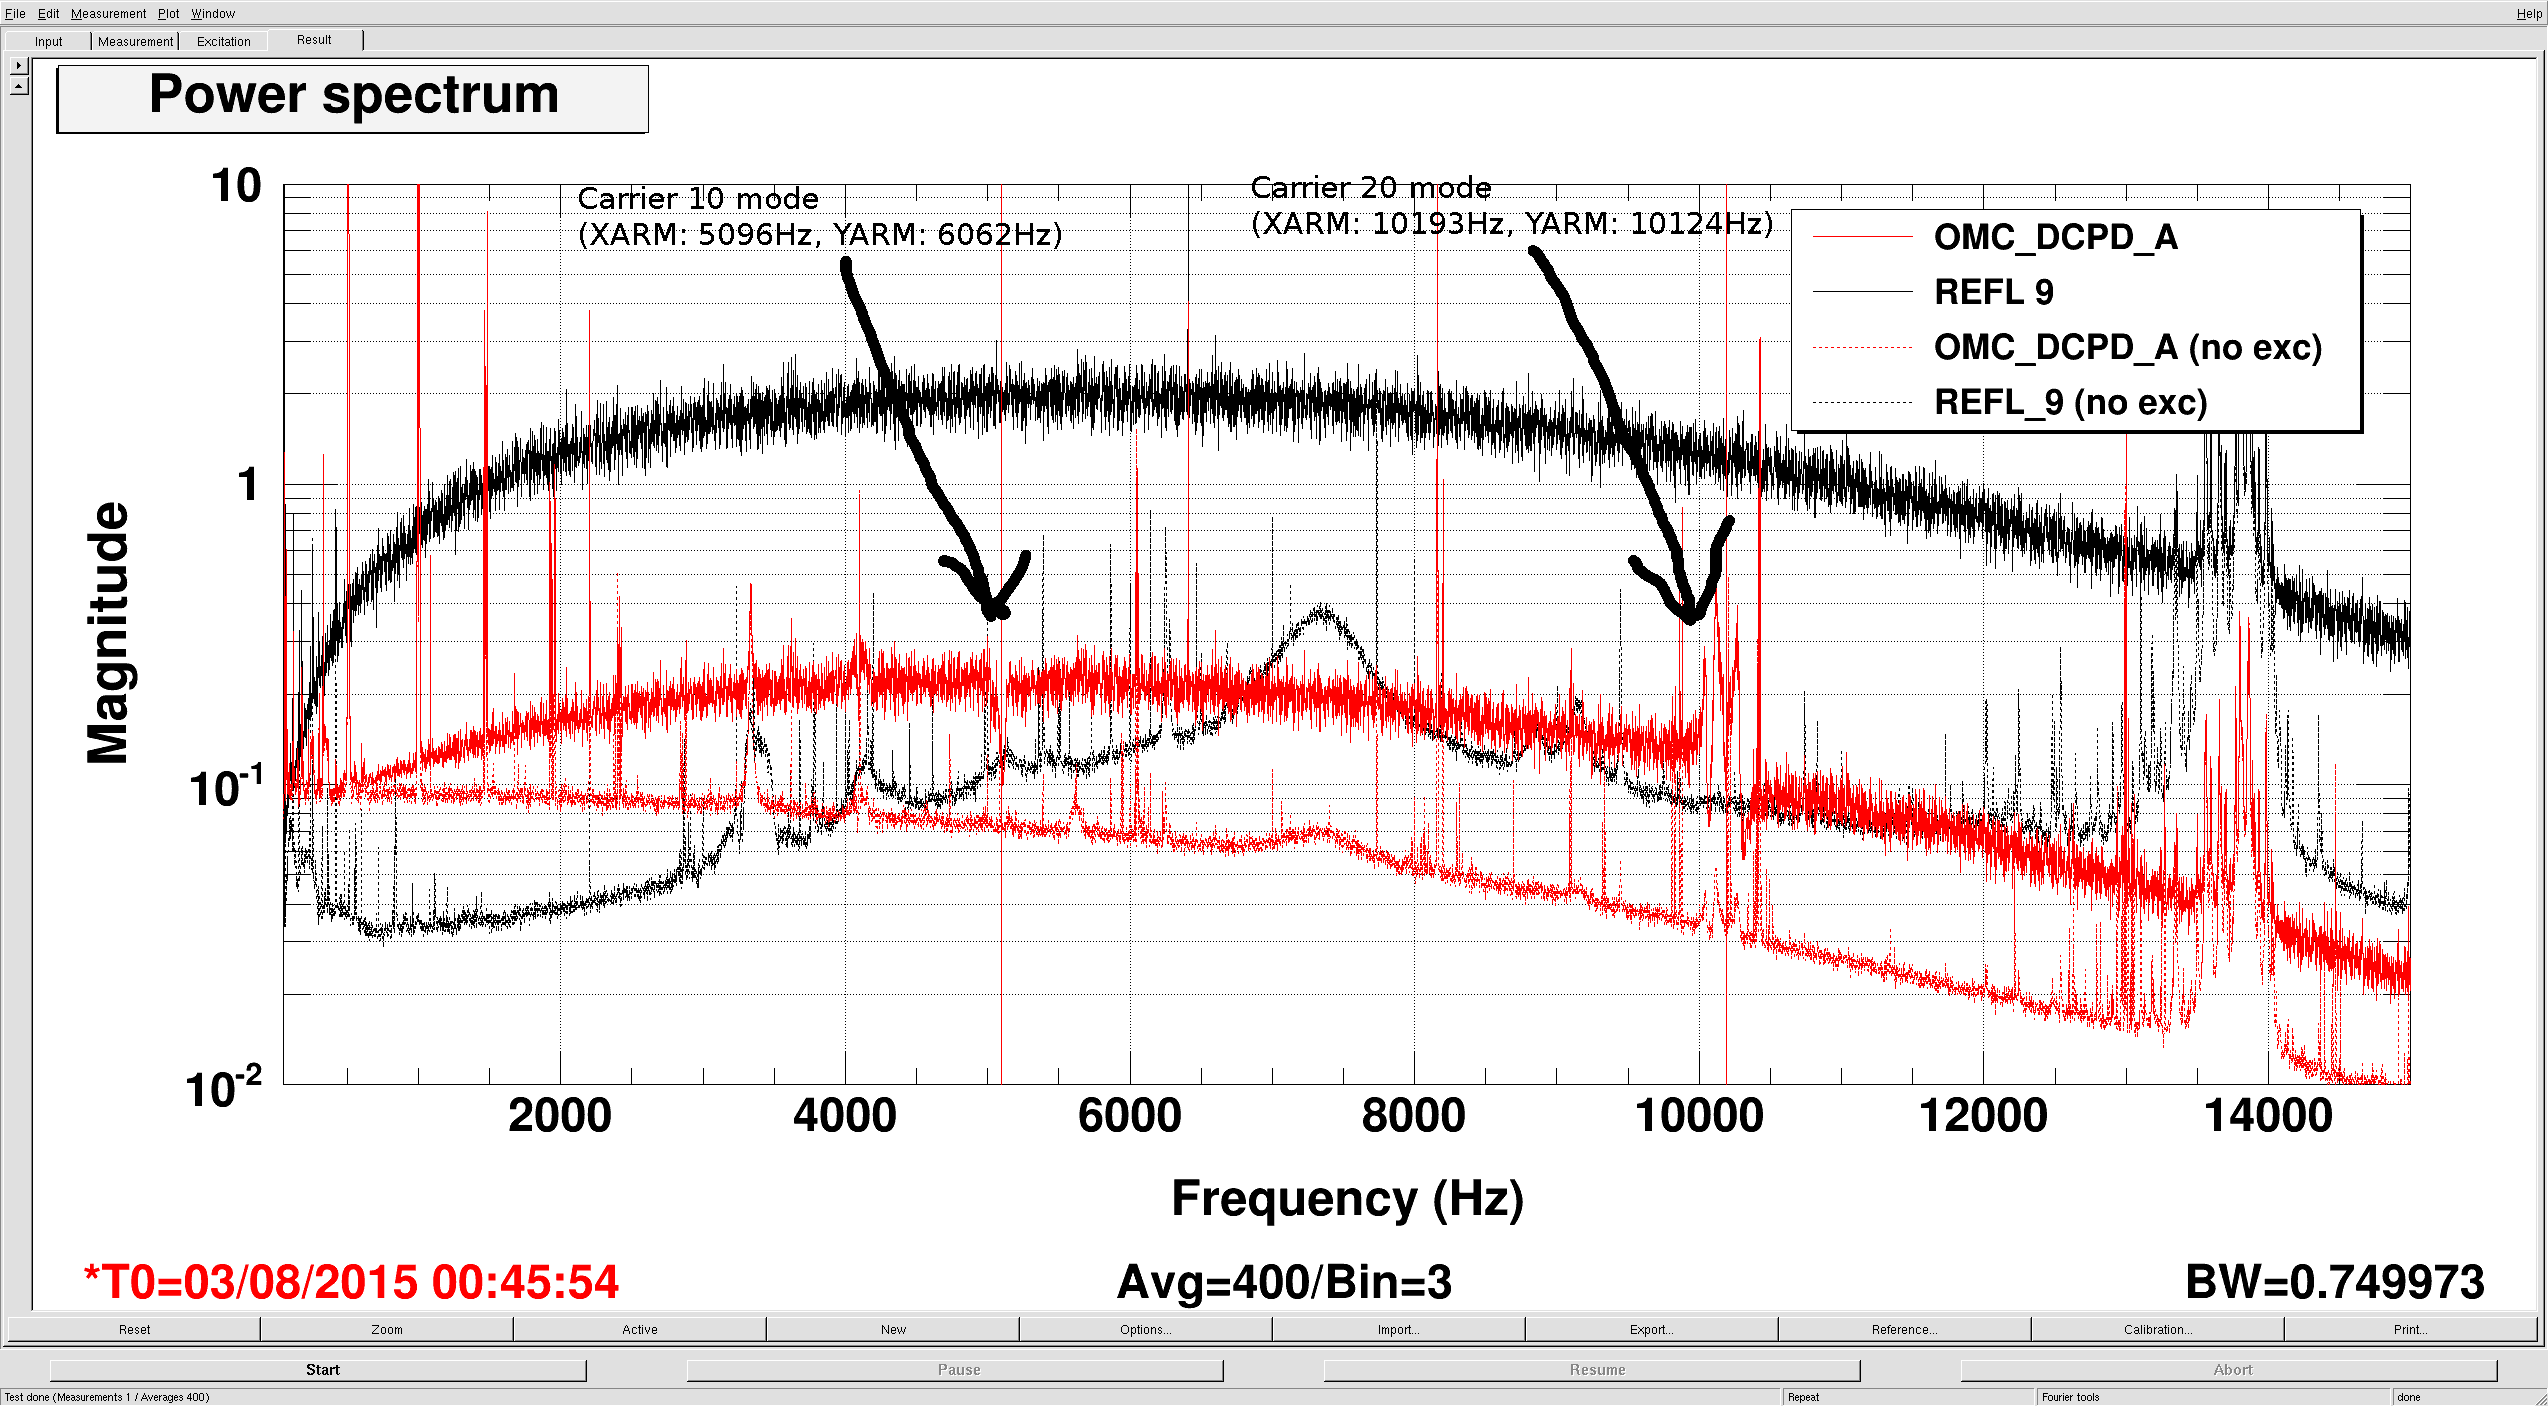
Evan, Stefan

Using a line at 6409.7Hz we found a null in the frequency noise coupling. Thus we took the REFL_9 to OMC_DCPD_A transfer function (plot 1).
This is a nice modelling challenge - thus we spend some time calibrating it in meaningful units.

Calibration:
 - OMC_DCPD_9 (H1:IOP-LSC0_MADC0_TP_CH12):
   - This is just a copy of the filters in the PDA filter module, plus the 13.7kHz 17.8kHz poles from preamp (alog 17647). We did not take into account the AA board, but it should be the same for both channels:
   - G=8.63151e-07
   - P=0.87, 7.689, 7.689
   - Z=10.07, 78.912, 90.642, 13700, 17800
 - REFL9 (H1:IOP-LSC0_MADC1_TP_CH28):
   - The gain is 2900V/WattsRF (see alog 10661) x (12dB whitening) x 1638.4cts/V, plus a z=1,p=10Hz whitening filter (again, no AA board compensation)
   - G=5.2867e-08 = 1/(2900*3.9811*1683.4)
   - P=1
   - Z=10

Plot 2 shows the 9 OMC_DCPD traces during heating, calibrated in A/rtHz

The xml template is in LIGO-T1500414
https://dcc.ligo.org/T1500414
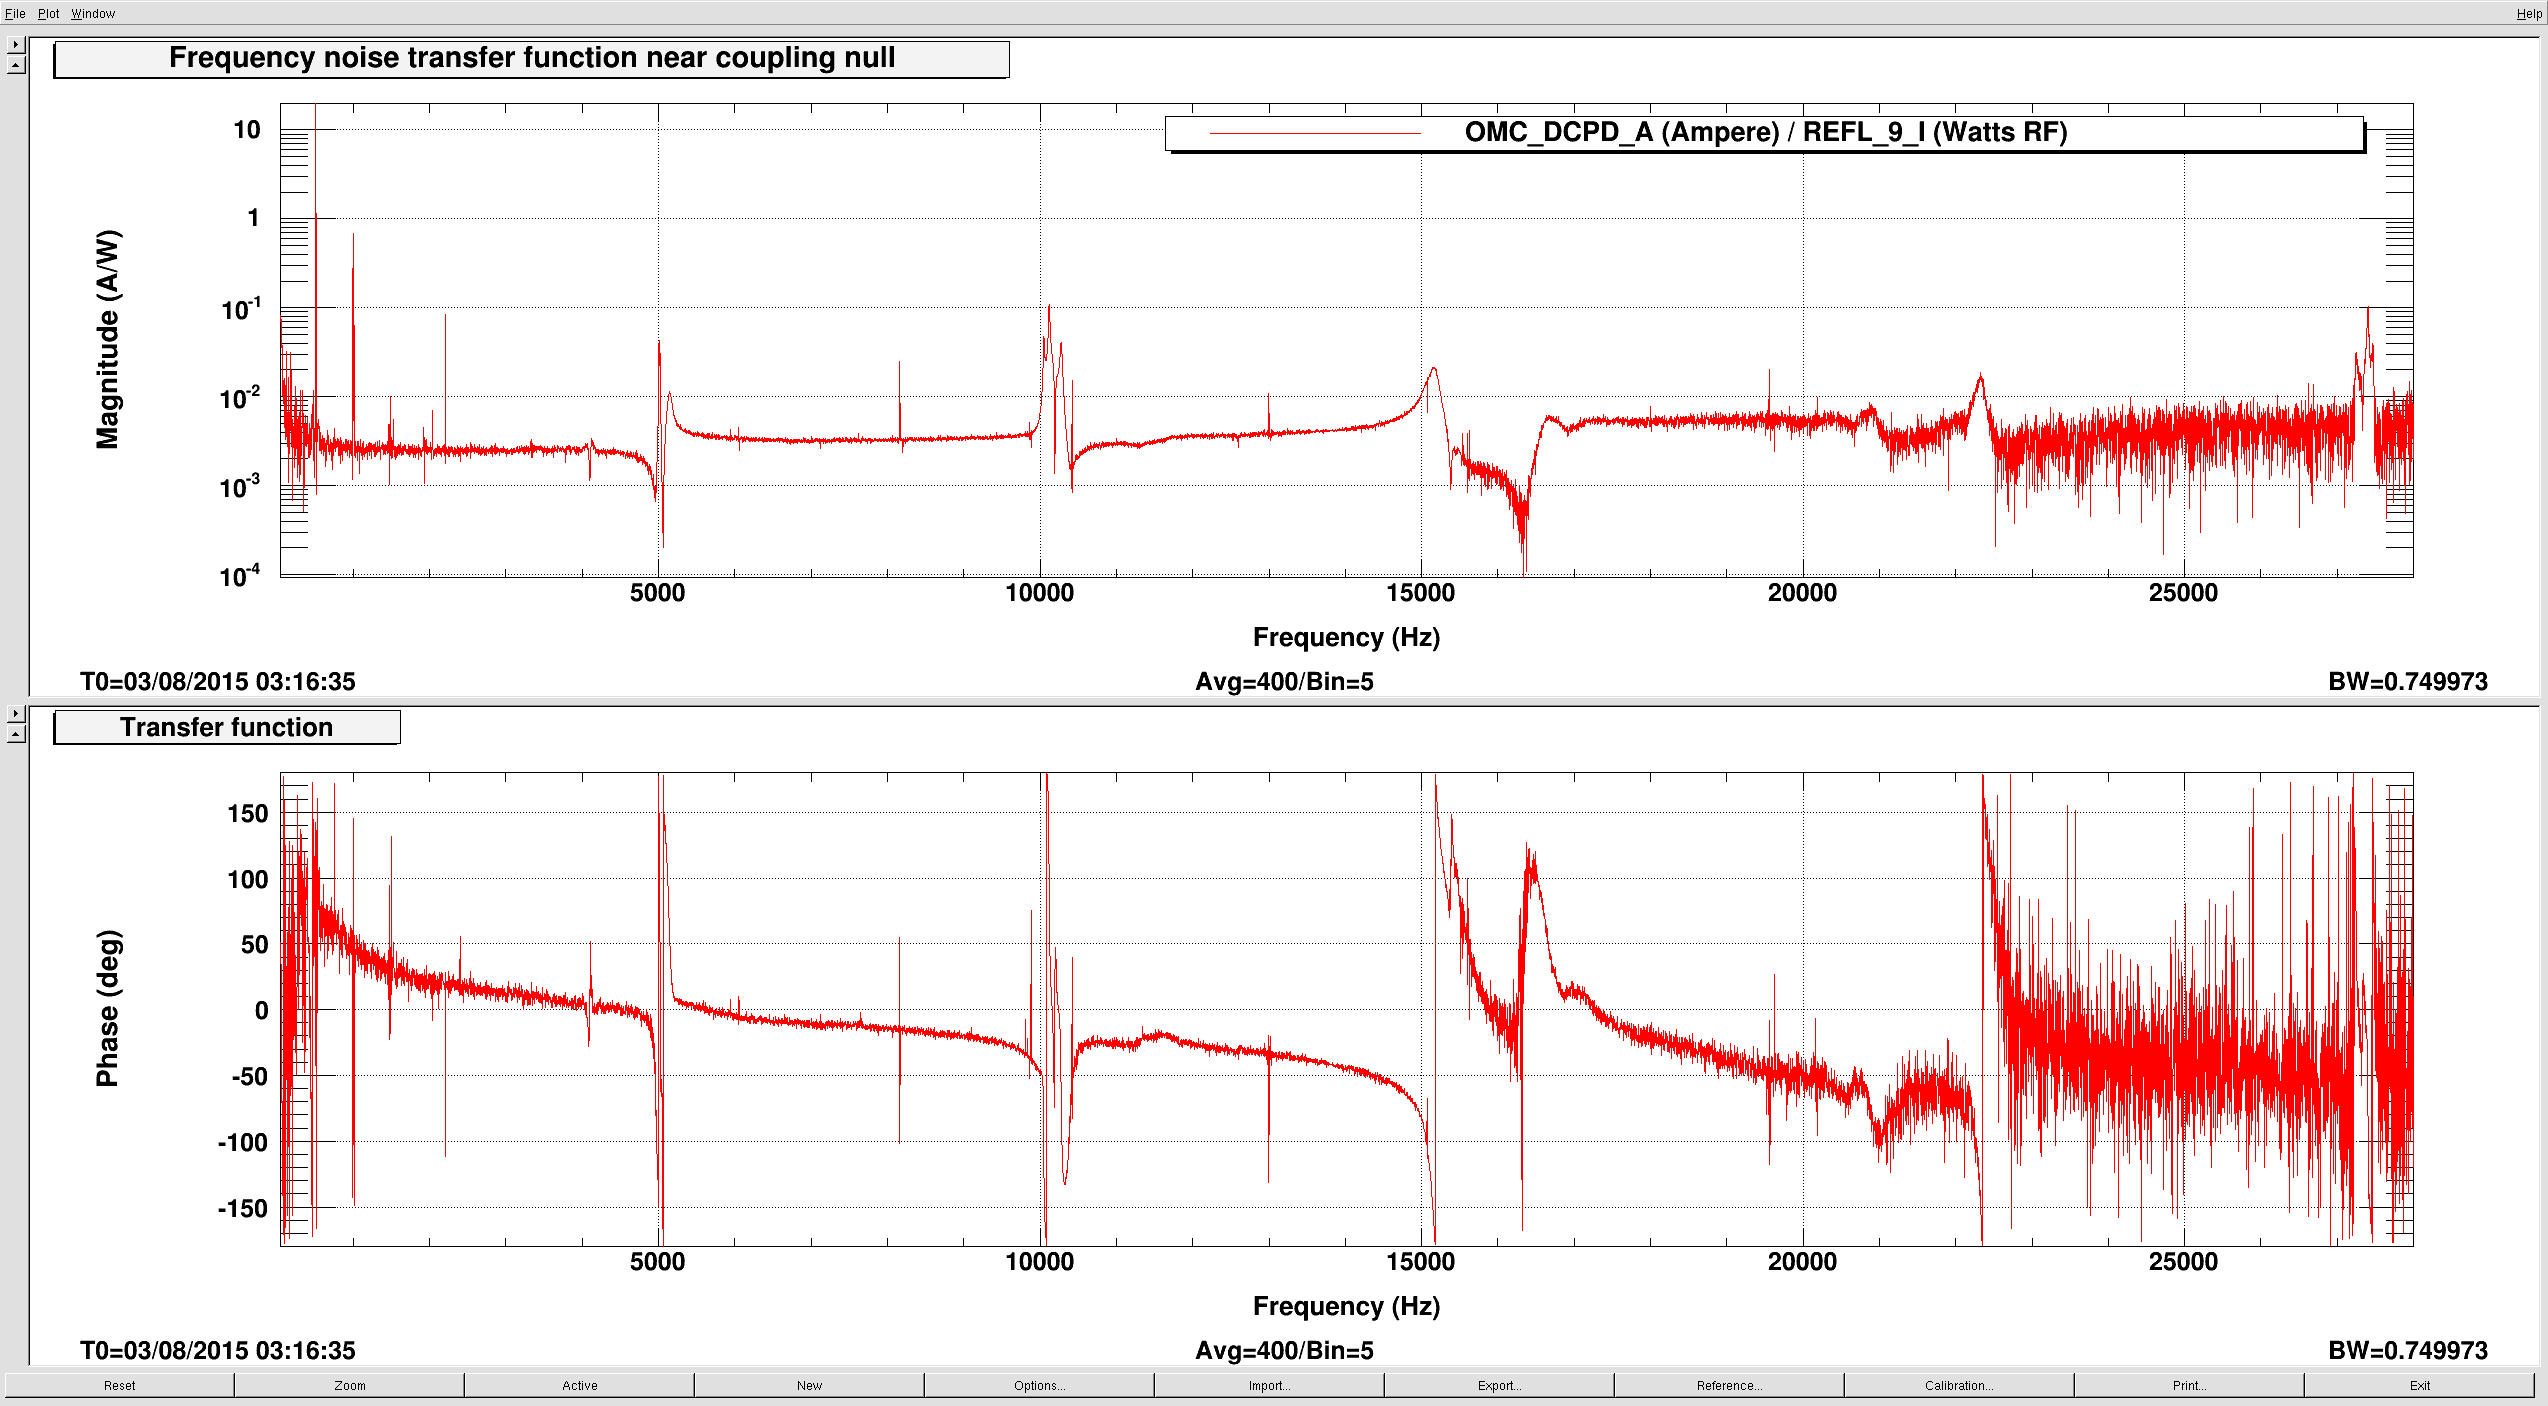
The broadband level below 8kHz didn't change, but the structure around 15kHz disappeared... (Compare to alog 19856)
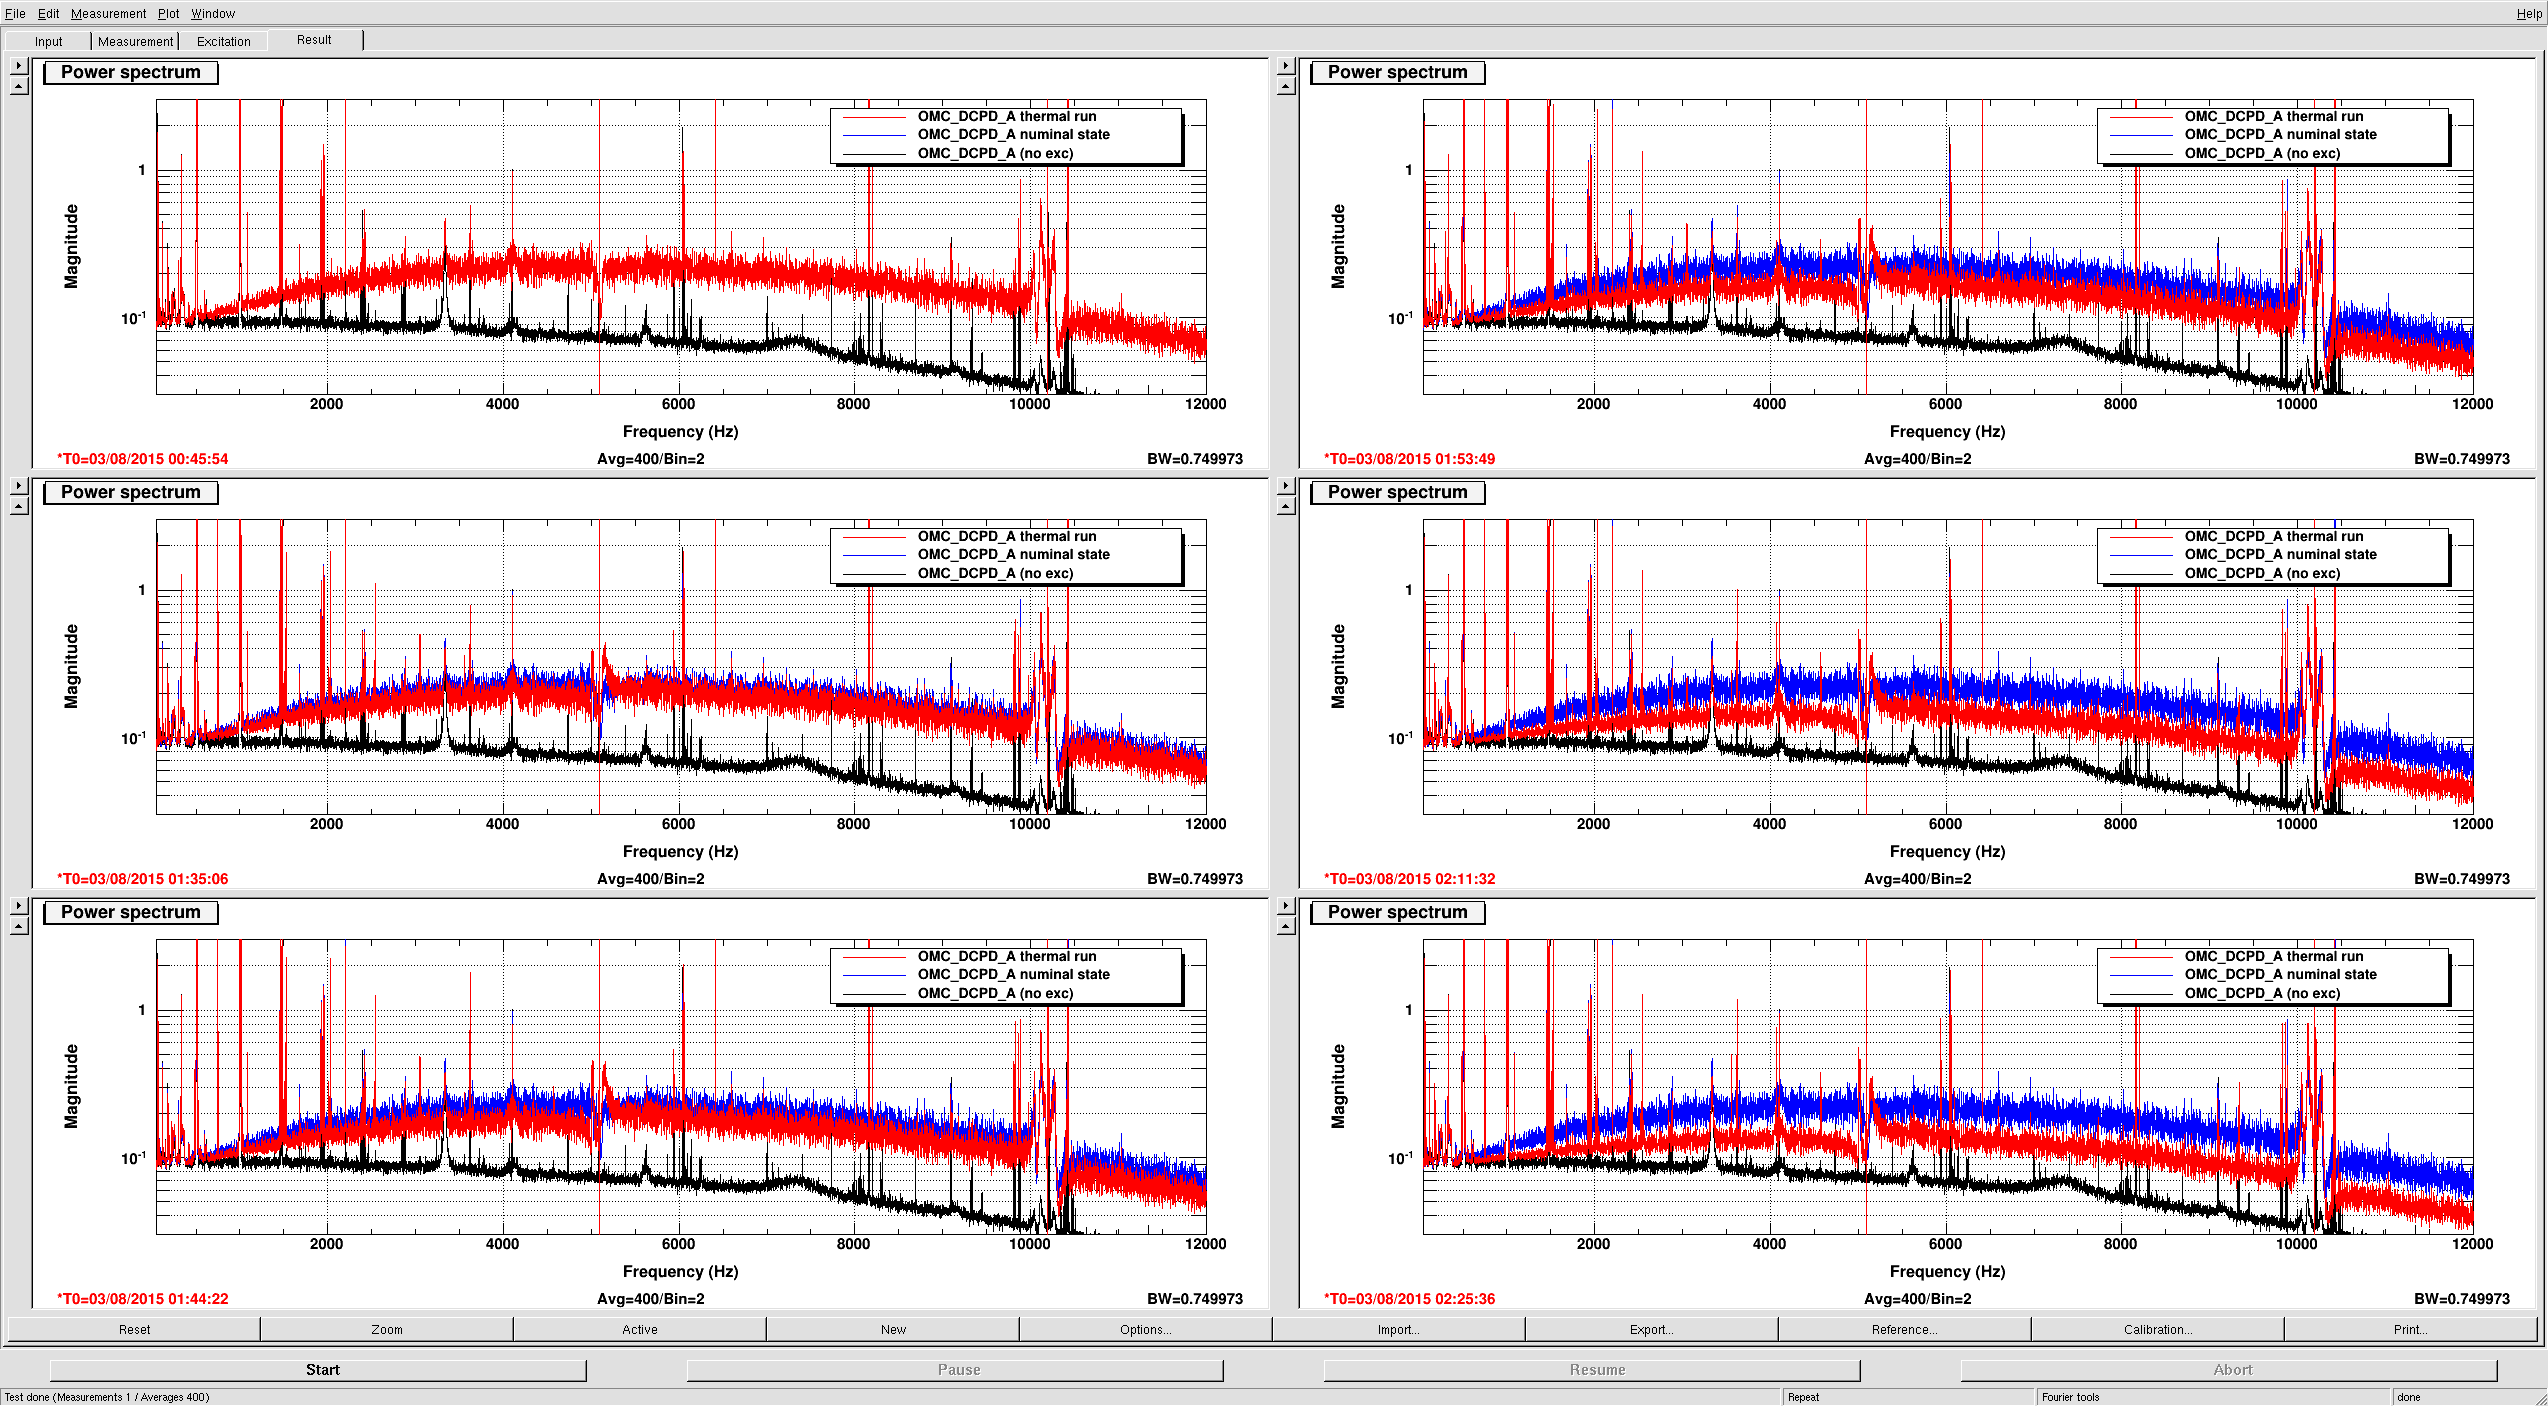
Attached is a plot of the frequency noise in OMC_PDC_A at six different times during the thermal tuning. There is a significant drop in frequency noise coupling. However the feature that changes most drastically is the carrier 10-mode resonance at 5.1kHz. Thus some of this might be alignment induced effects.

Plot 2 has three more traces with even more heating.
This is a brief update of the current situation of the ISS 2nd loop.
[Contribution to DARM]
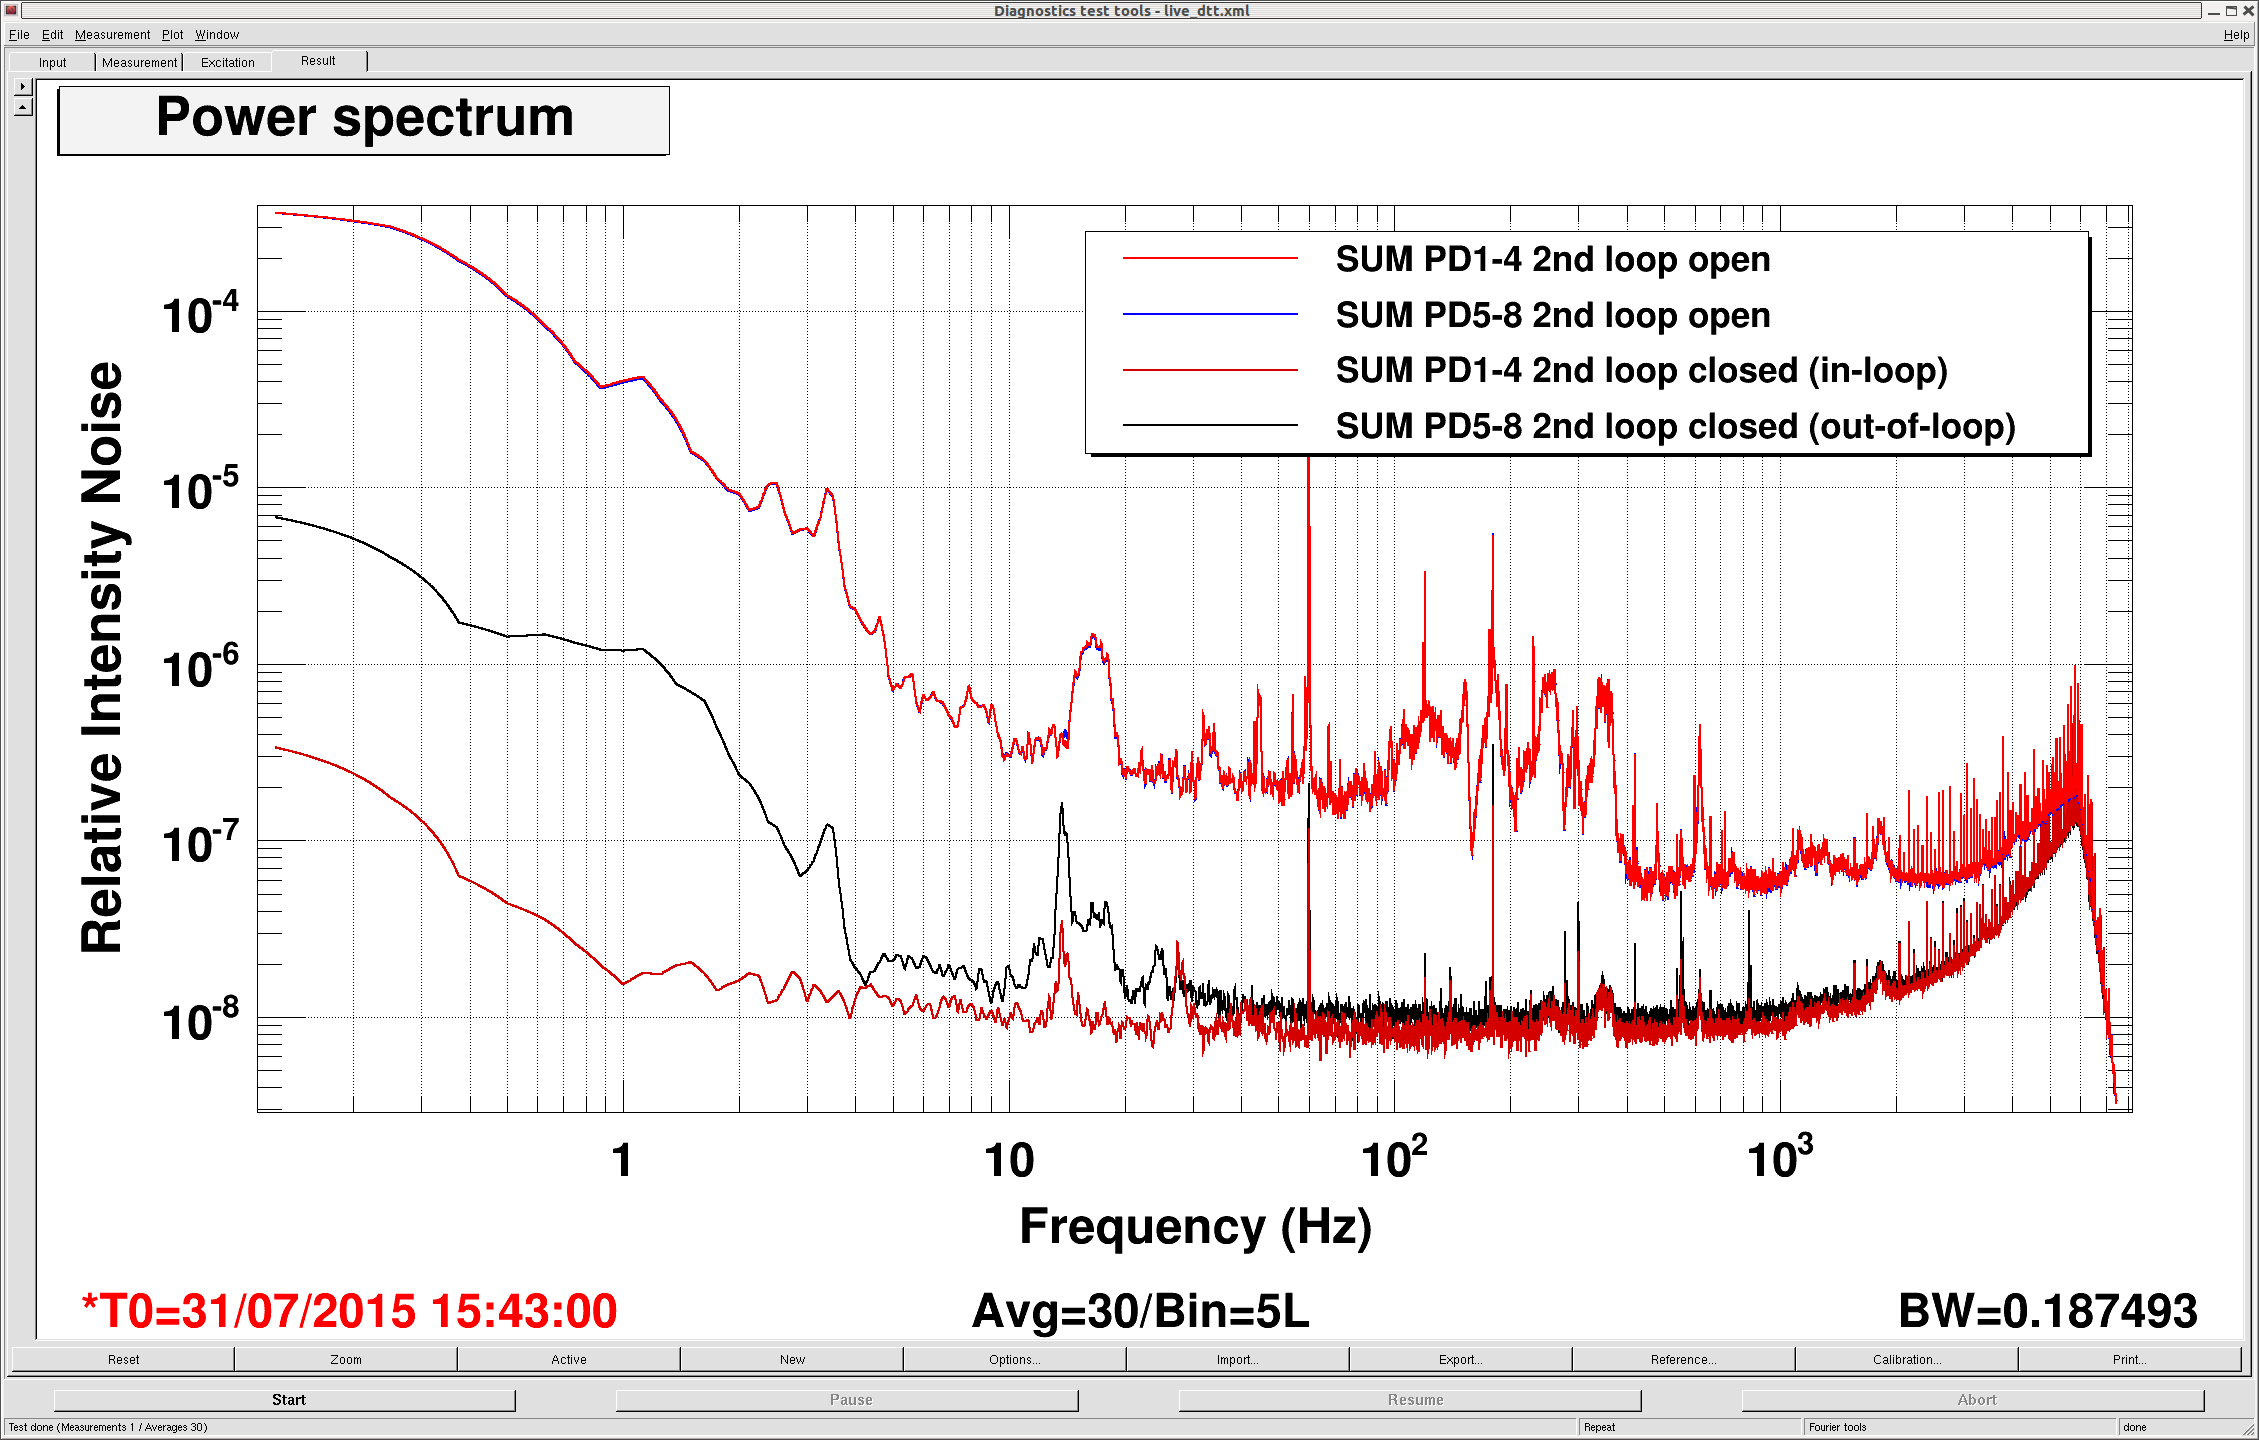
Here are estimation of the contribution of intensity noise to DARM with and without closing the 2nd loop:
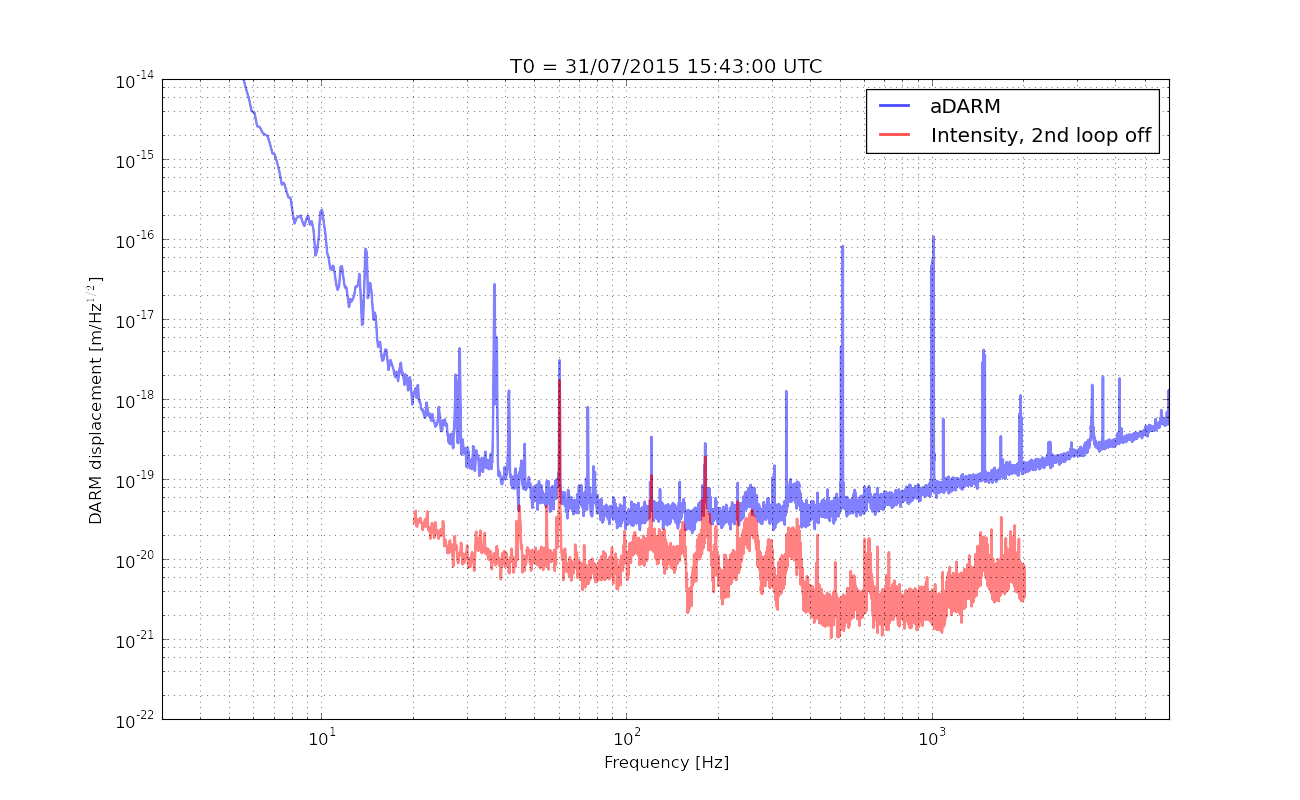
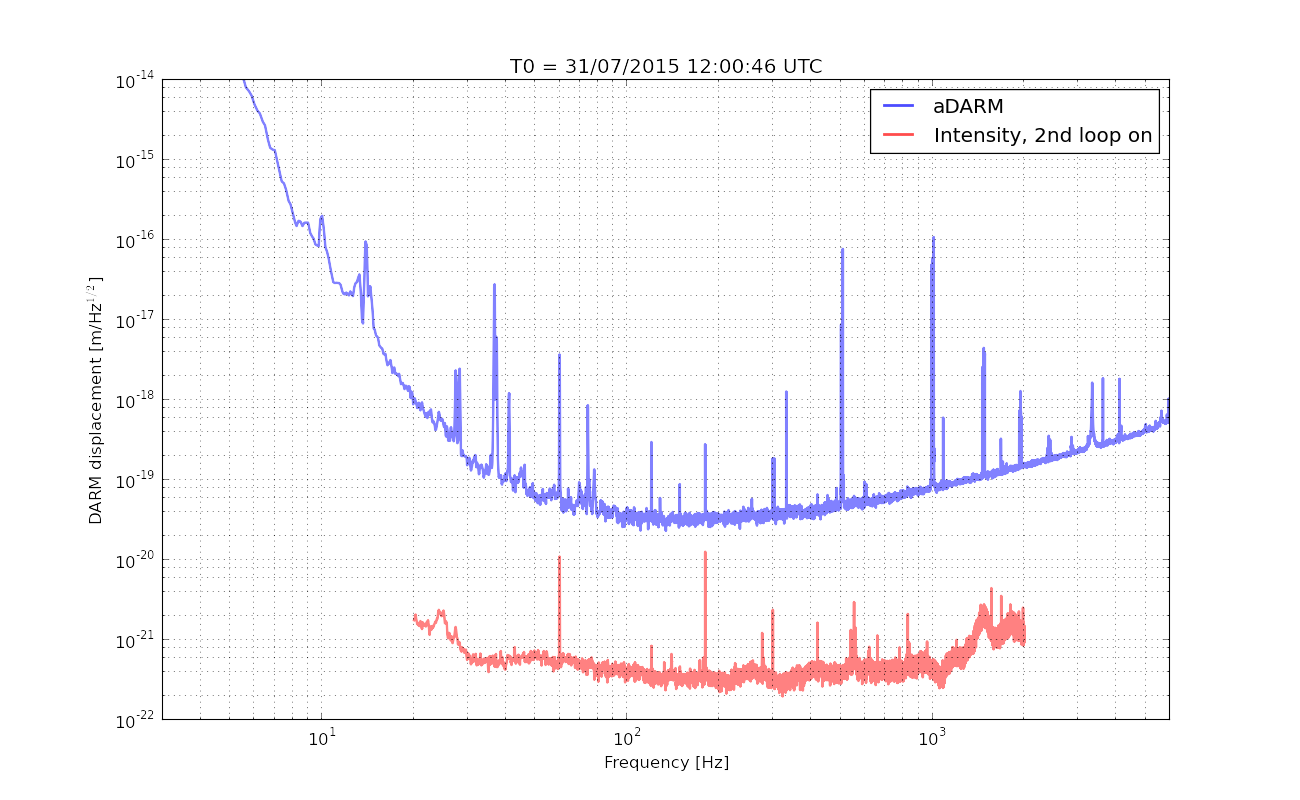
The left plot is an estimation without the 2nd loop closed, and the right plot with the 2nd loop closed. The estimation was done by measuring the coupling transfer function from the ISS 2nd loop PD array to the DARM error point and propagating the measured spectra of the ISS array via the measured transfer function to DARM displacement. As you can see, when the 2nd loop is open, it pollutes the DARM spectrum in 100- 400 Hz. Though it looks like I am missing a factor of two or so for some reason in order for the intensity noise to be dominant in the DARM spectrum as observed.
As shown in the right plot, the loop suppresses intensity noise and pushes it to a point more than a factor of 10 apart from the DARM noise floor. This is good. One thing I noticed is that the spectral shape of intensity noise changed depending on whether the 2nd loop was closed or not. For example, the left plot clearly shows structure in 100 - 400 Hz band in the estimated contribution of intensity noise while the right plot does not show the structure. I am still studying what is going on, but it seems like it is from some kind of readout noise of the PD array which covered the real spectral shape.
Also, I attach a measured coupling from the PD arrays to DARM displacement [meters/RIN].
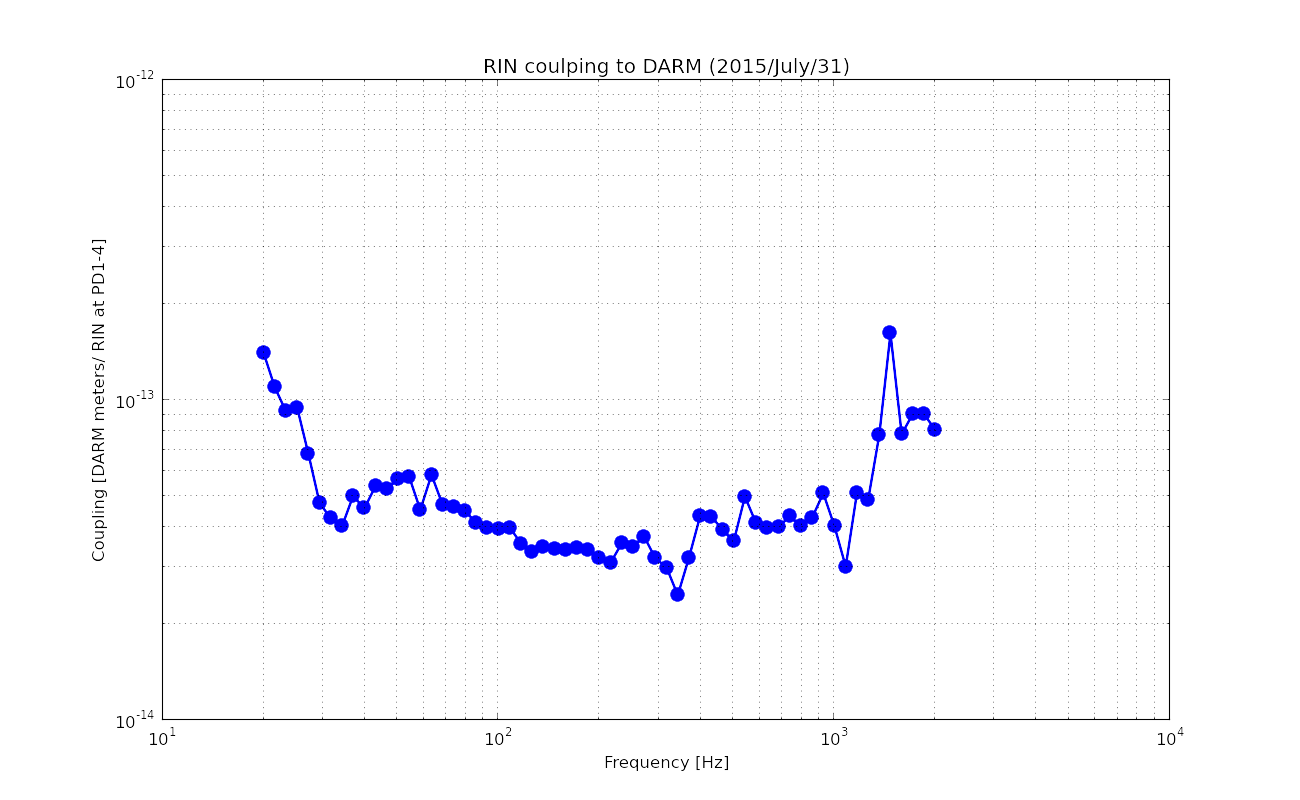
As shown, it is on the order of 3-4 x 10-14 [meters/cnts]. By the way, meters, I refer here is unsuppressed DARM displacement. The measurement was done by injecting swept sine at H1:PSL-ISS_TRANSFER1_INJ with the 2nd loop intentionally disabled in order to get high coherence. The interferometer was locked fully in low noise and a PSL power was at 24 W at around 8:40 PT of July 31st.
[Suppression]
As mentioned above, the suppressed noise does not make sense. They look as if they are covered by some kind of readout noise. Nevertheless, it is evident that the suppression at 300 Hz is approxiamtely a factor of 60 as expected. Good. Later, Stefan and I undid the anti-whitening in the measured spectra in order to check whether the signals were above ADC noise or not -- they were above ADC noise by a factor of 10 or so. Also, I believe that the structure in 10-20 Hz is some scattering induced noise which Gabriele reported before (for example, alog 15198).
[Next to do]
* Modeling of the measured intensity noise coupling.
* Figure out the read out noise.
Evan, Stefan,

We set up a function generator to get a 3kHz-30kHz broadband frequency noise injection. Details:

 - Function generator, set on 'noise'
 - Followed by an SR560 (AC, band-passed between 3kHz and 30kHz, gain 1)
 - This drives drive a noise floor of about 22uVrms/rtHz at 10kHz.
 - We hooked this up the the CM board input 2 (note to self - need to reconnect SUM_B for the IFO to re-lock).

 - Next we turned on the CM board input 2 with -20dB gain: this should add about 2.2uVrms/rtHz at 10kHz.

Attached is a plot of REFL_9 and OMC_DCPD_A, with annotated features at the carrier 10 and carrier 20 modes.

We left this excitation on for the thermal run tonight.
Here are updated numbers for higher order arm resonances:

f1=9100230Hz (verified)
f2=5*f1
Arm length: L=3994.47 (same used for x and y)
RoC:
ETMX: 2241.54m
ITMX: 1939.3m
ETMY: 2238.9m
ITMY: 1939.39m

XARM:
Resonance condition: fres = FSR * (q  + (l+m+1)*fTM/FSR)
Free Spectral Range (FSR)    : 37.5259 kHz
Transverse Mode Spacing (fTM): 32.4296 kHz
f1 sideband:
q=243	l+m=0	 Freq. diff. = 18.5727 kHz
q=242	l+m=0				 Freq. from antiresonant = 0.190312 kHz
q=242	l+m=1	 Freq. diff. = 13.4763 kHz
q=241	l+m=1				 Freq. from antiresonant = 5.28668 kHz
q=241	l+m=2	 Freq. diff. = 8.37992 kHz
q=-243	l+m=0	 Freq. diff. = 18.5727 kHz
q=-243	l+m=0				 Freq. from antiresonant = 0.190312 kHz
q=-243	l+m=1	 Freq. diff. = 13.8569 kHz
q=-244	l+m=1				 Freq. from antiresonant = 4.90605 kHz
q=-244	l+m=2	 Freq. diff. = 8.76055 kHz
f2 sideband:
q=1213	l+m=0	 Freq. diff. = 17.8114 kHz
q=1212	l+m=0				 Freq. from antiresonant = 0.95156 kHz
q=1212	l+m=1	 Freq. diff. = 12.715 kHz
q=1211	l+m=1				 Freq. from antiresonant = 6.04793 kHz
q=1211	l+m=2	 Freq. diff. = 7.61868 kHz
q=-1213	l+m=0	 Freq. diff. = 17.8114 kHz
q=-1213	l+m=0				 Freq. from antiresonant = 0.95156 kHz
q=-1213	l+m=1	 Freq. diff. = 14.6182 kHz
q=-1214	l+m=1				 Freq. from antiresonant = 4.14481 kHz
q=-1214	l+m=2	 Freq. diff. = 9.5218 kHz

Carrier:
l+m=1            Freq. diff. =  5096.3661 Hz
l+m=2            Freq. diff. = 10192.7323 Hz

YARM:
Checking accidental sideband resonances in the arm cavities:
Resonance condition: fres = FSR * (q  + (l+m+1)*fTM/FSR)
Free Spectral Range (FSR)    : 37.5259 kHz
Transverse Mode Spacing (fTM): 32.4638 kHz
f1 sideband:
q=243	l+m=0	 Freq. diff. = 18.5727 kHz
q=242	l+m=0				 Freq. from antiresonant = 0.190312 kHz
q=242	l+m=1	 Freq. diff. = 13.5105 kHz
q=241	l+m=1				 Freq. from antiresonant = 5.25248 kHz
q=241	l+m=2	 Freq. diff. = 8.44832 kHz
q=-243	l+m=0	 Freq. diff. = 18.5727 kHz
q=-243	l+m=0				 Freq. from antiresonant = 0.190312 kHz
q=-243	l+m=1	 Freq. diff. = 13.8911 kHz
q=-244	l+m=1				 Freq. from antiresonant = 4.87185 kHz
q=-244	l+m=2	 Freq. diff. = 8.82895 kHz
f2 sideband:
q=1213	l+m=0	 Freq. diff. = 17.8114 kHz
q=1212	l+m=0				 Freq. from antiresonant = 0.95156 kHz
q=1212	l+m=1	 Freq. diff. = 12.7492 kHz
q=1211	l+m=1				 Freq. from antiresonant = 6.01373 kHz
q=1211	l+m=2	 Freq. diff. = 7.68708 kHz
q=-1213	l+m=0	 Freq. diff. = 17.8114 kHz
q=-1213	l+m=0				 Freq. from antiresonant = 0.95156 kHz
q=-1213	l+m=1	 Freq. diff. = 14.6524 kHz
q=-1214	l+m=1				 Freq. from antiresonant = 4.11061 kHz
q=-1214	l+m=2	 Freq. diff. = 9.5902 kHz

Carrier:
l+m=1            Freq. diff. =  5062.1663Hz
l+m=2            Freq. diff. = 10124.3327Hz
Kiwamu, Stefan, Evan
We are trying to minimize the coupling of frequency and intensity noise into DARM by tuning the central heating on the IX CP.
The following excitations have been set up:
The amplitudes were chosen so that each line has an SNR of 50 or so in OMC DCPD sum with a 10 s FFT. Each demodulator demodulates OMC DCPD sum at the appropriate frequency, and then lowpasses I and Q with a 100 mHz, 4th-order butterworth.
At 2015-08-03 01:19:45 Z we changed the IX CP heating power from 0.23 W to 0.36 W.
At 2015-08-03 02:57:25 Z we changed the IX CP heating power from 0.36 W to 0.53 W.
At 2015-08-03 04:26:20 Z we changed the IX CP heating power from 0.53 W to 0.41 W.
Additionally:
Stefan has reverted the rewiring on the CARM board.
We are leaving the injected frequency line on so we can watch it as the interferometer settles into its new thermal state.
Also, we further increased the ISS gains: the first loop went up by 10dB, the second loop by 6dB. No immediate noise improvement was visible in DARM.
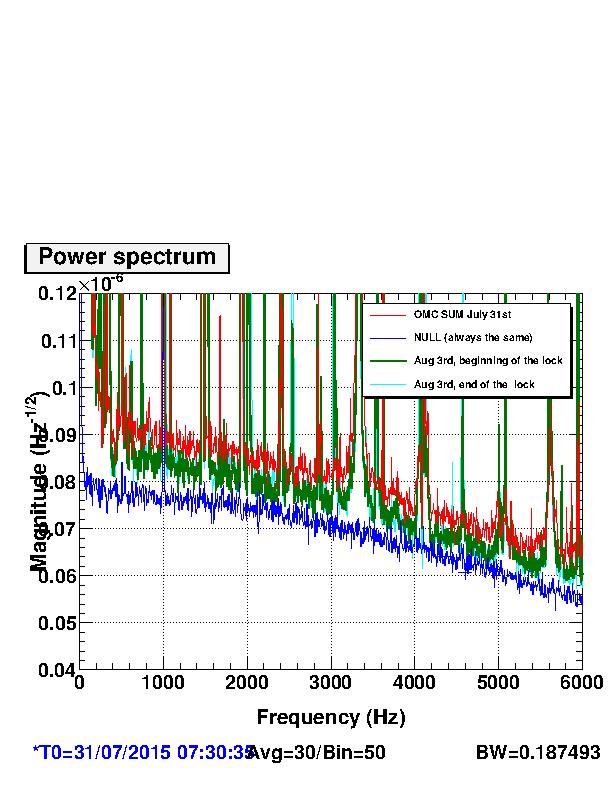
I looked at OMC SUM/NULL during the long lock last night, after the frequency noise injection was turned off.
There is no significant difference between the beginning and the end of the lock. The excess of noise was of the order of 10% shot noise level, similarly to the night before. The highest excess of noise I have seen is ~15%, corresponding to  a few days ago , July 31st.
Jamie, Sheila, everyone,
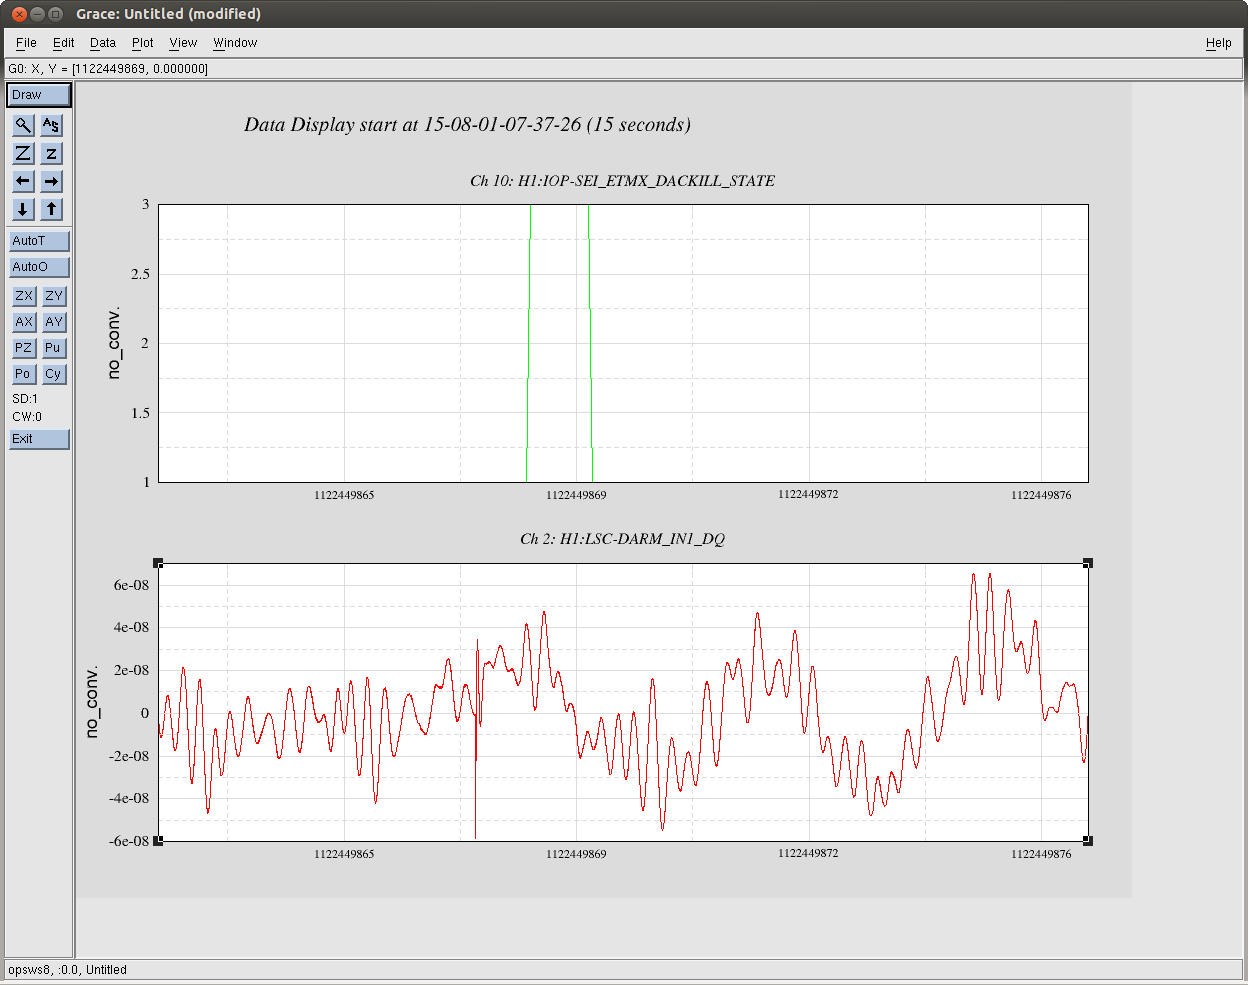
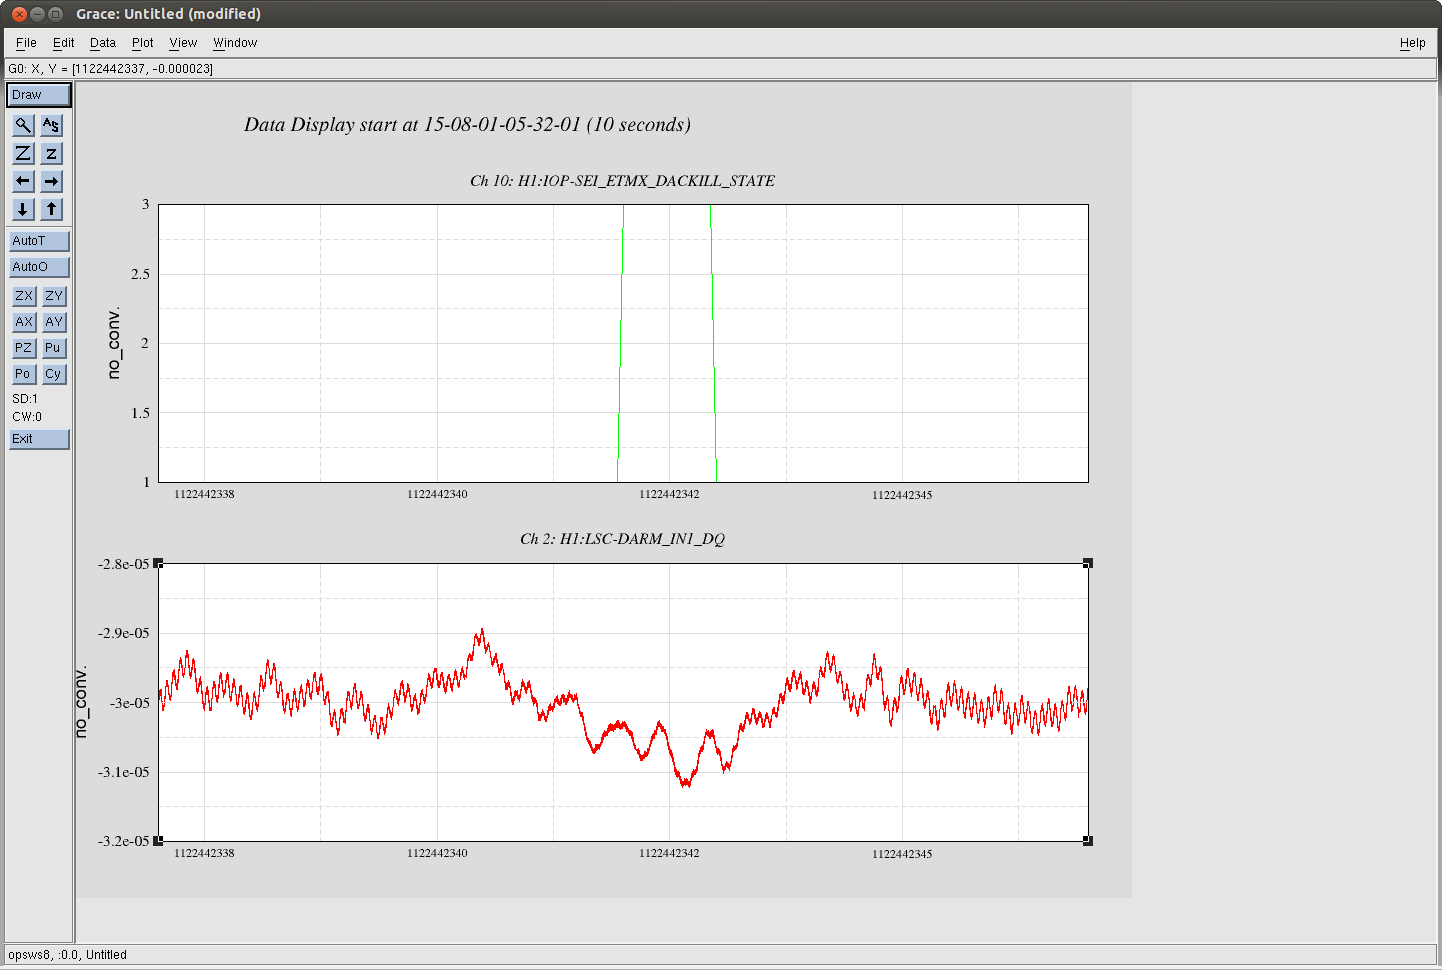
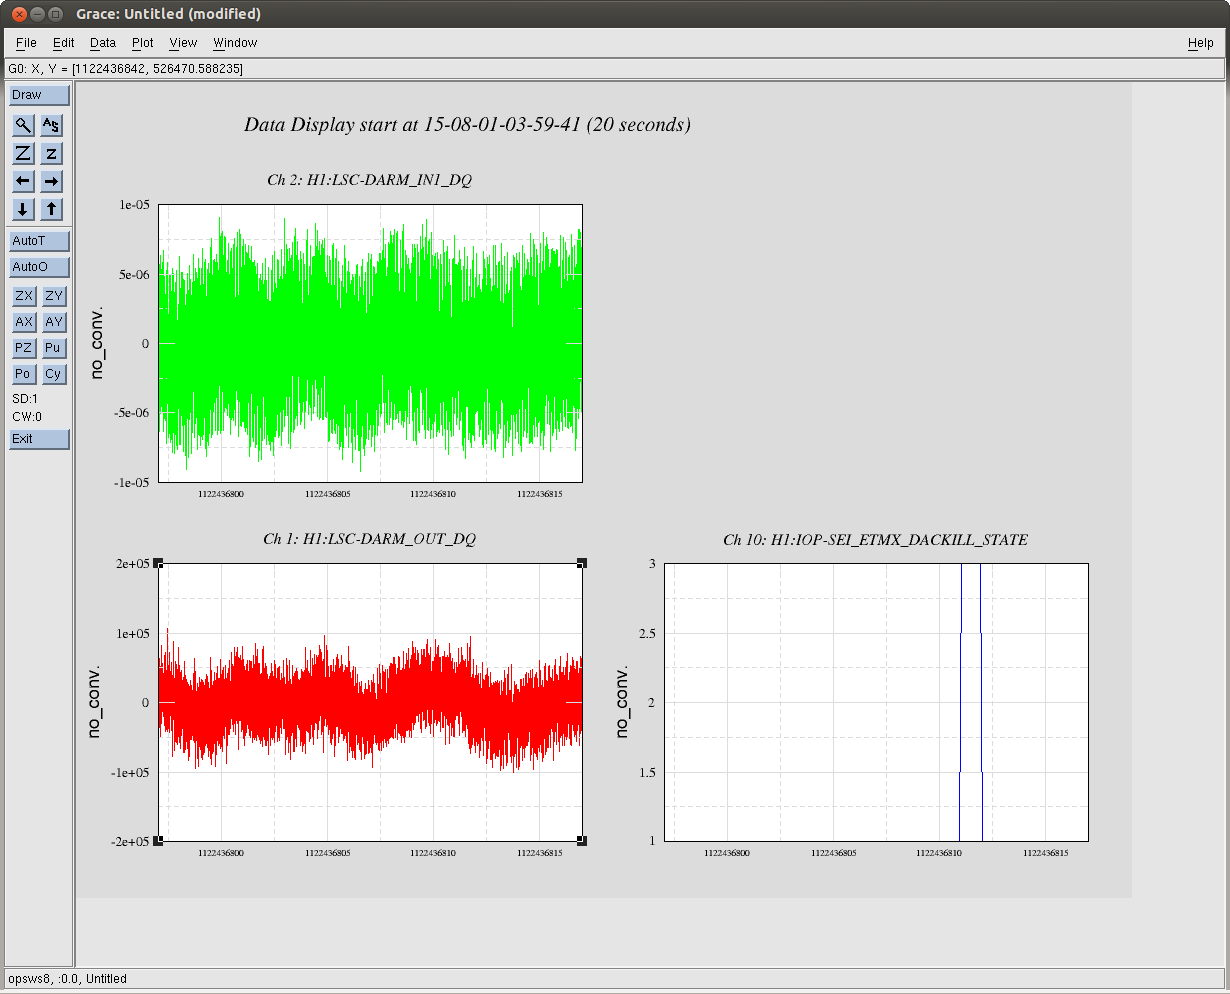
Over the past several days, TJ's verbal alarams have been warning us about ETMX software watchdog trips which aren't really happeneing. This is interseting though, since we've noticed that sometimes this seems coincident with a huge glitch in DARM that can be seen in the spectrum. The verbal alarm script is checking the channel H1:IOP-SEI_ETMX_DACKILL_STATE. It sometimes jumps to a value of 3 for about a second and comes back to 0.
Three incidents from Friday night happened in the 10 to 20 seconds proceeding these times (UTC):
8/1/2015 7:37:40, 5:32:10, 4:00:00
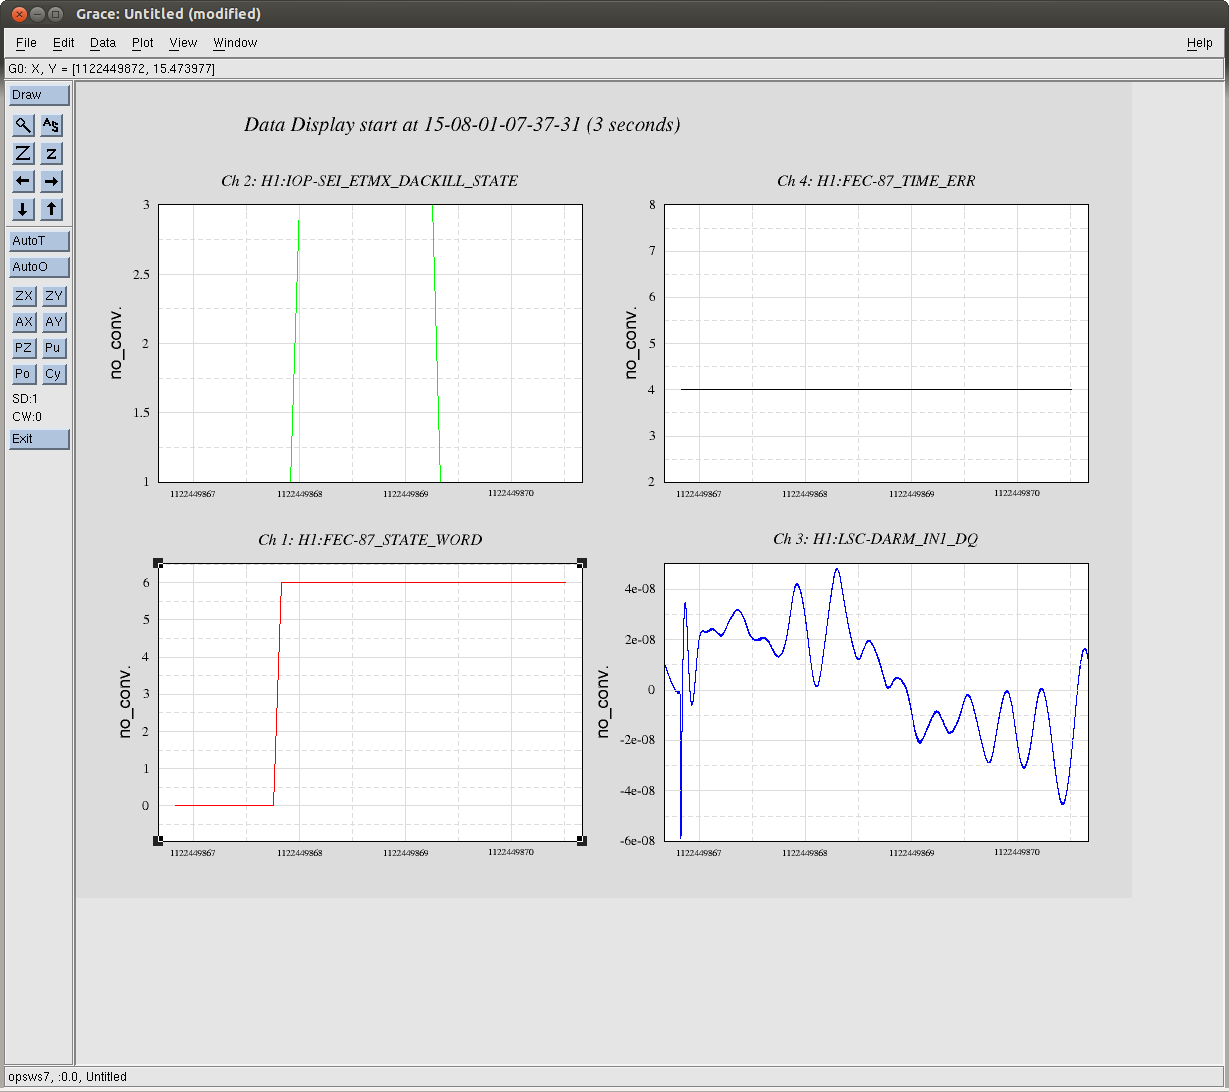
One of these incidents a huge glitch is visible in the DARM time series before the DACKILL state changed.
Two questions probably need further investigation, is DACKILL behaving the way we want it to, and are the glitches in DARM cauing the DACKILL state to change or is something else causing both DARM glitches and the change in DACKILL state?
Dave and Jim suggested 2 more channels to look at for this time when there was an obvious glitch in DARM, and the SEI_ETMX_DACKILL state changed a second or so later. Indeed, the sus IOP state word changed at the same time as the DACKILL changed, although there is no timing error. Like the DACKILL state, this seems to happen after the glitch.
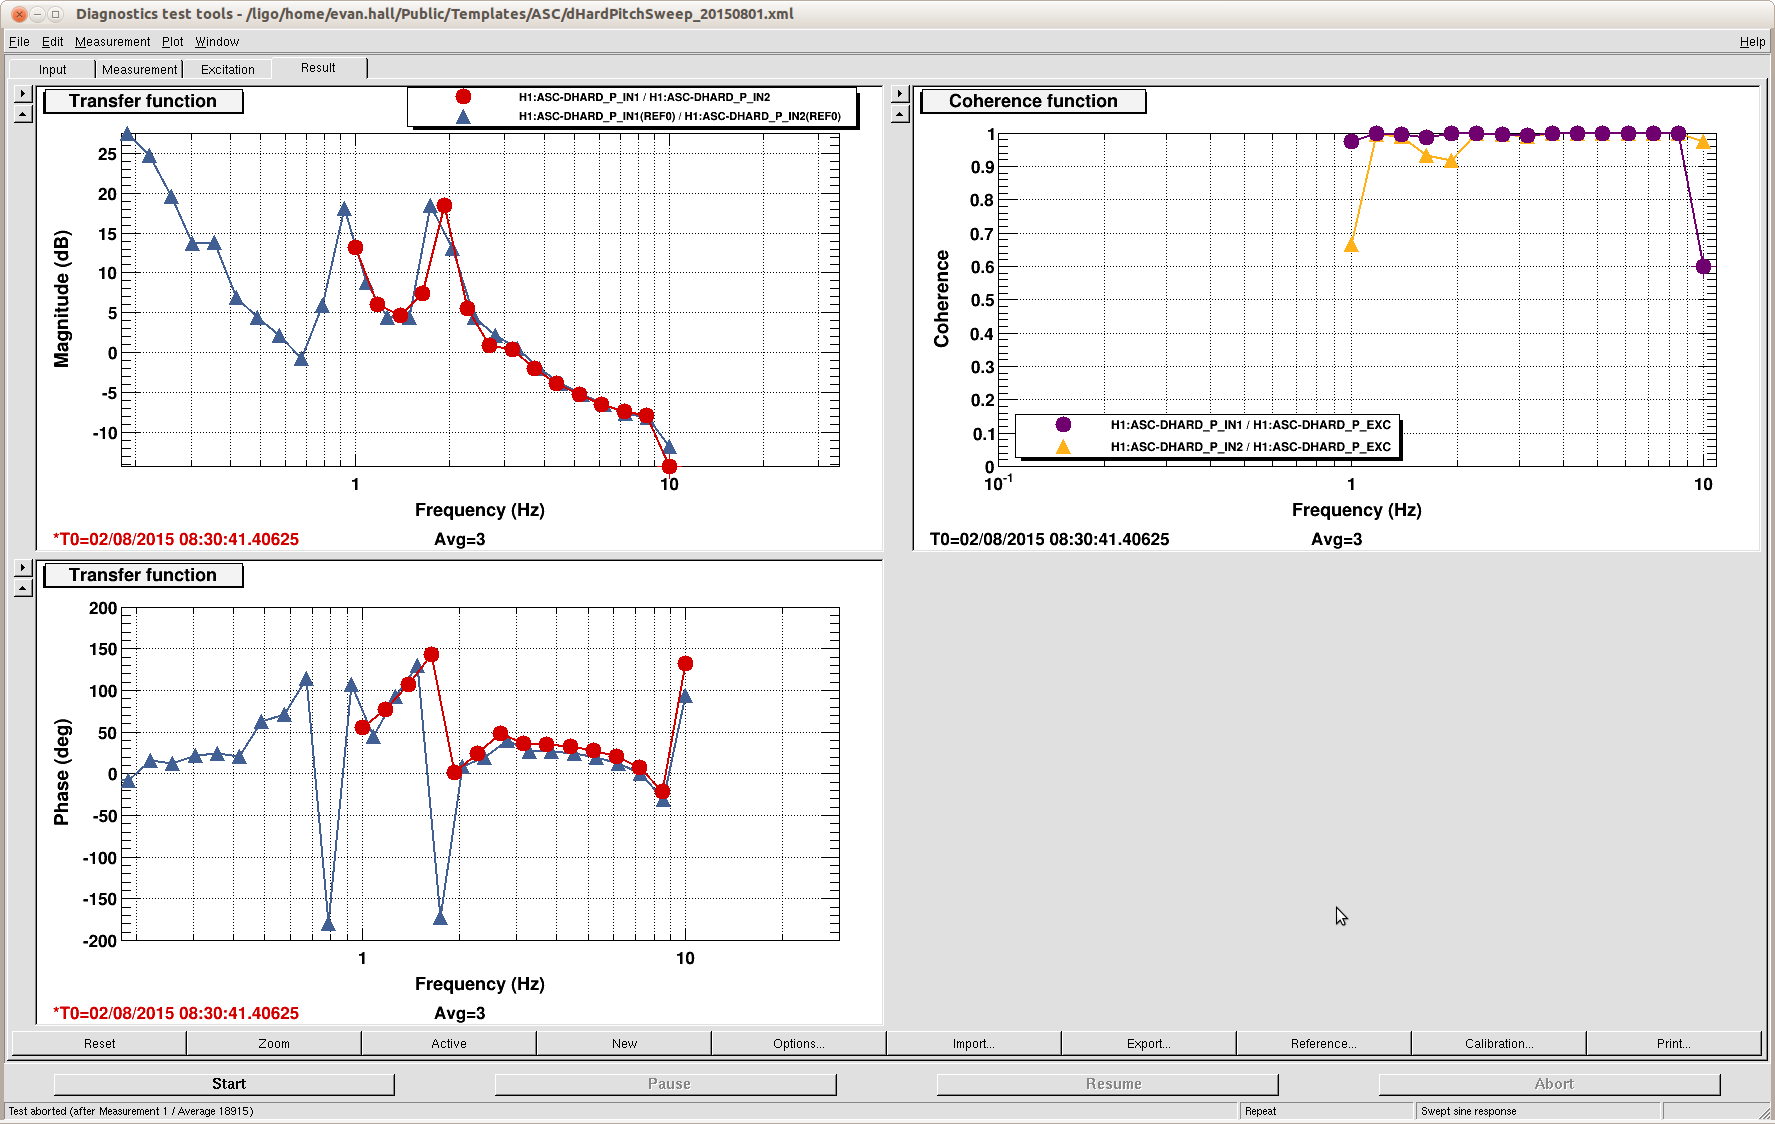
Matt, Lisa, Hang, Evan
Tonight we went to full power, turned on the new boost and cutoff in dHard (along with a small lead filter around 3 Hz), and turned off the oplev damping on the ITMs. Then we took an OLTF. Blue shows the new loop with the lead off, and red is the loop with the lead on. So far we've been at full power for more than 3 hours without any sign of instability.
There is some new, untested code sitting in the ISC_LOCK guardian:
However, this new, untested code is commented out (search ISC_LOCK.py for 'guardbomb' to find it). We can uncomment it the next time there is someone in the control room to supervise the lock acquisition.
Additionally, I got impatient with damping the roll modes during the acquisition sequence, and so I have set the quad coil drivers to be high range until the COIL_DRIVERS state, at which point they are switched to low noise. This seems to work fine (i.e., I didn't notice any glitching on the cameras).
It seems like the rate of epics freezes has increased today, I have seen more than 5 in the last 2 hours.
A quick look at my monitors is not showing anything unusual for Saturday. The dolphin manager reports 5 connection errors spread evenly throughout saturday (list show below), my LSC, ASC, SUSAUXB123 CA-monitors only caught the 22:19 event. I'll do some more detailed analysis tomorrow using the EDCU DAQ channels.
08 01 01:29
08 01 12:39
08 01 16:17
08 01 17:27
08 01 22:19
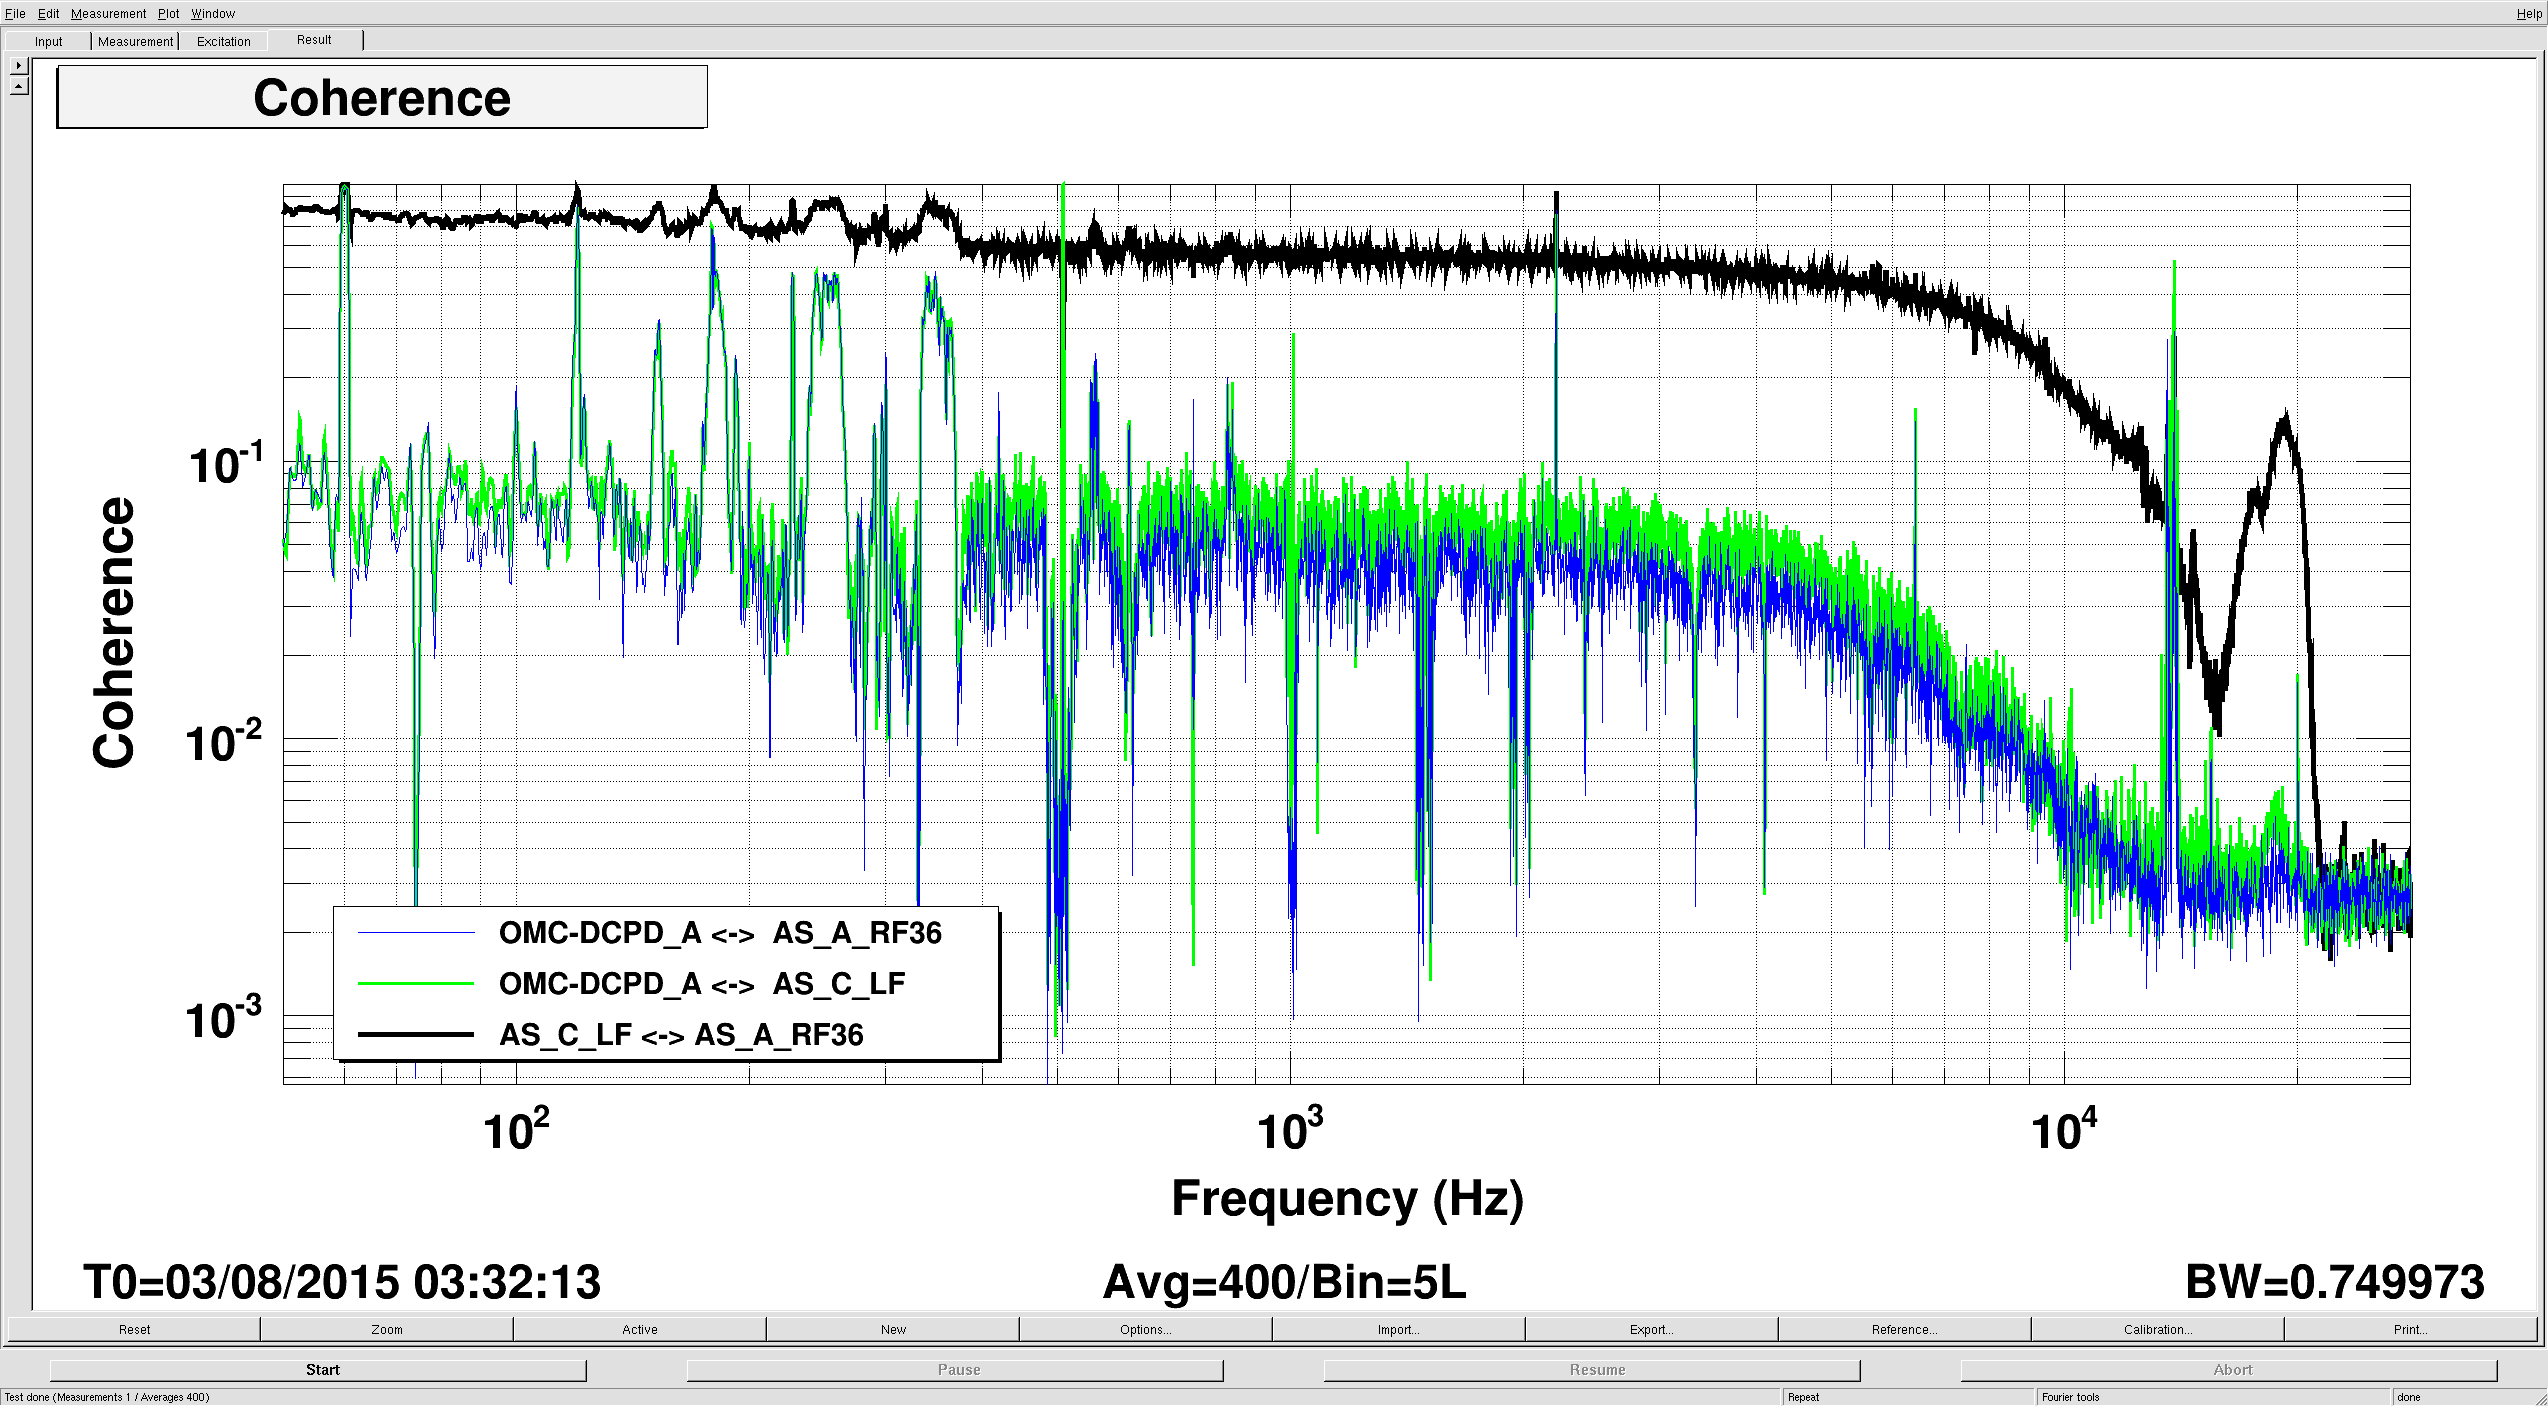
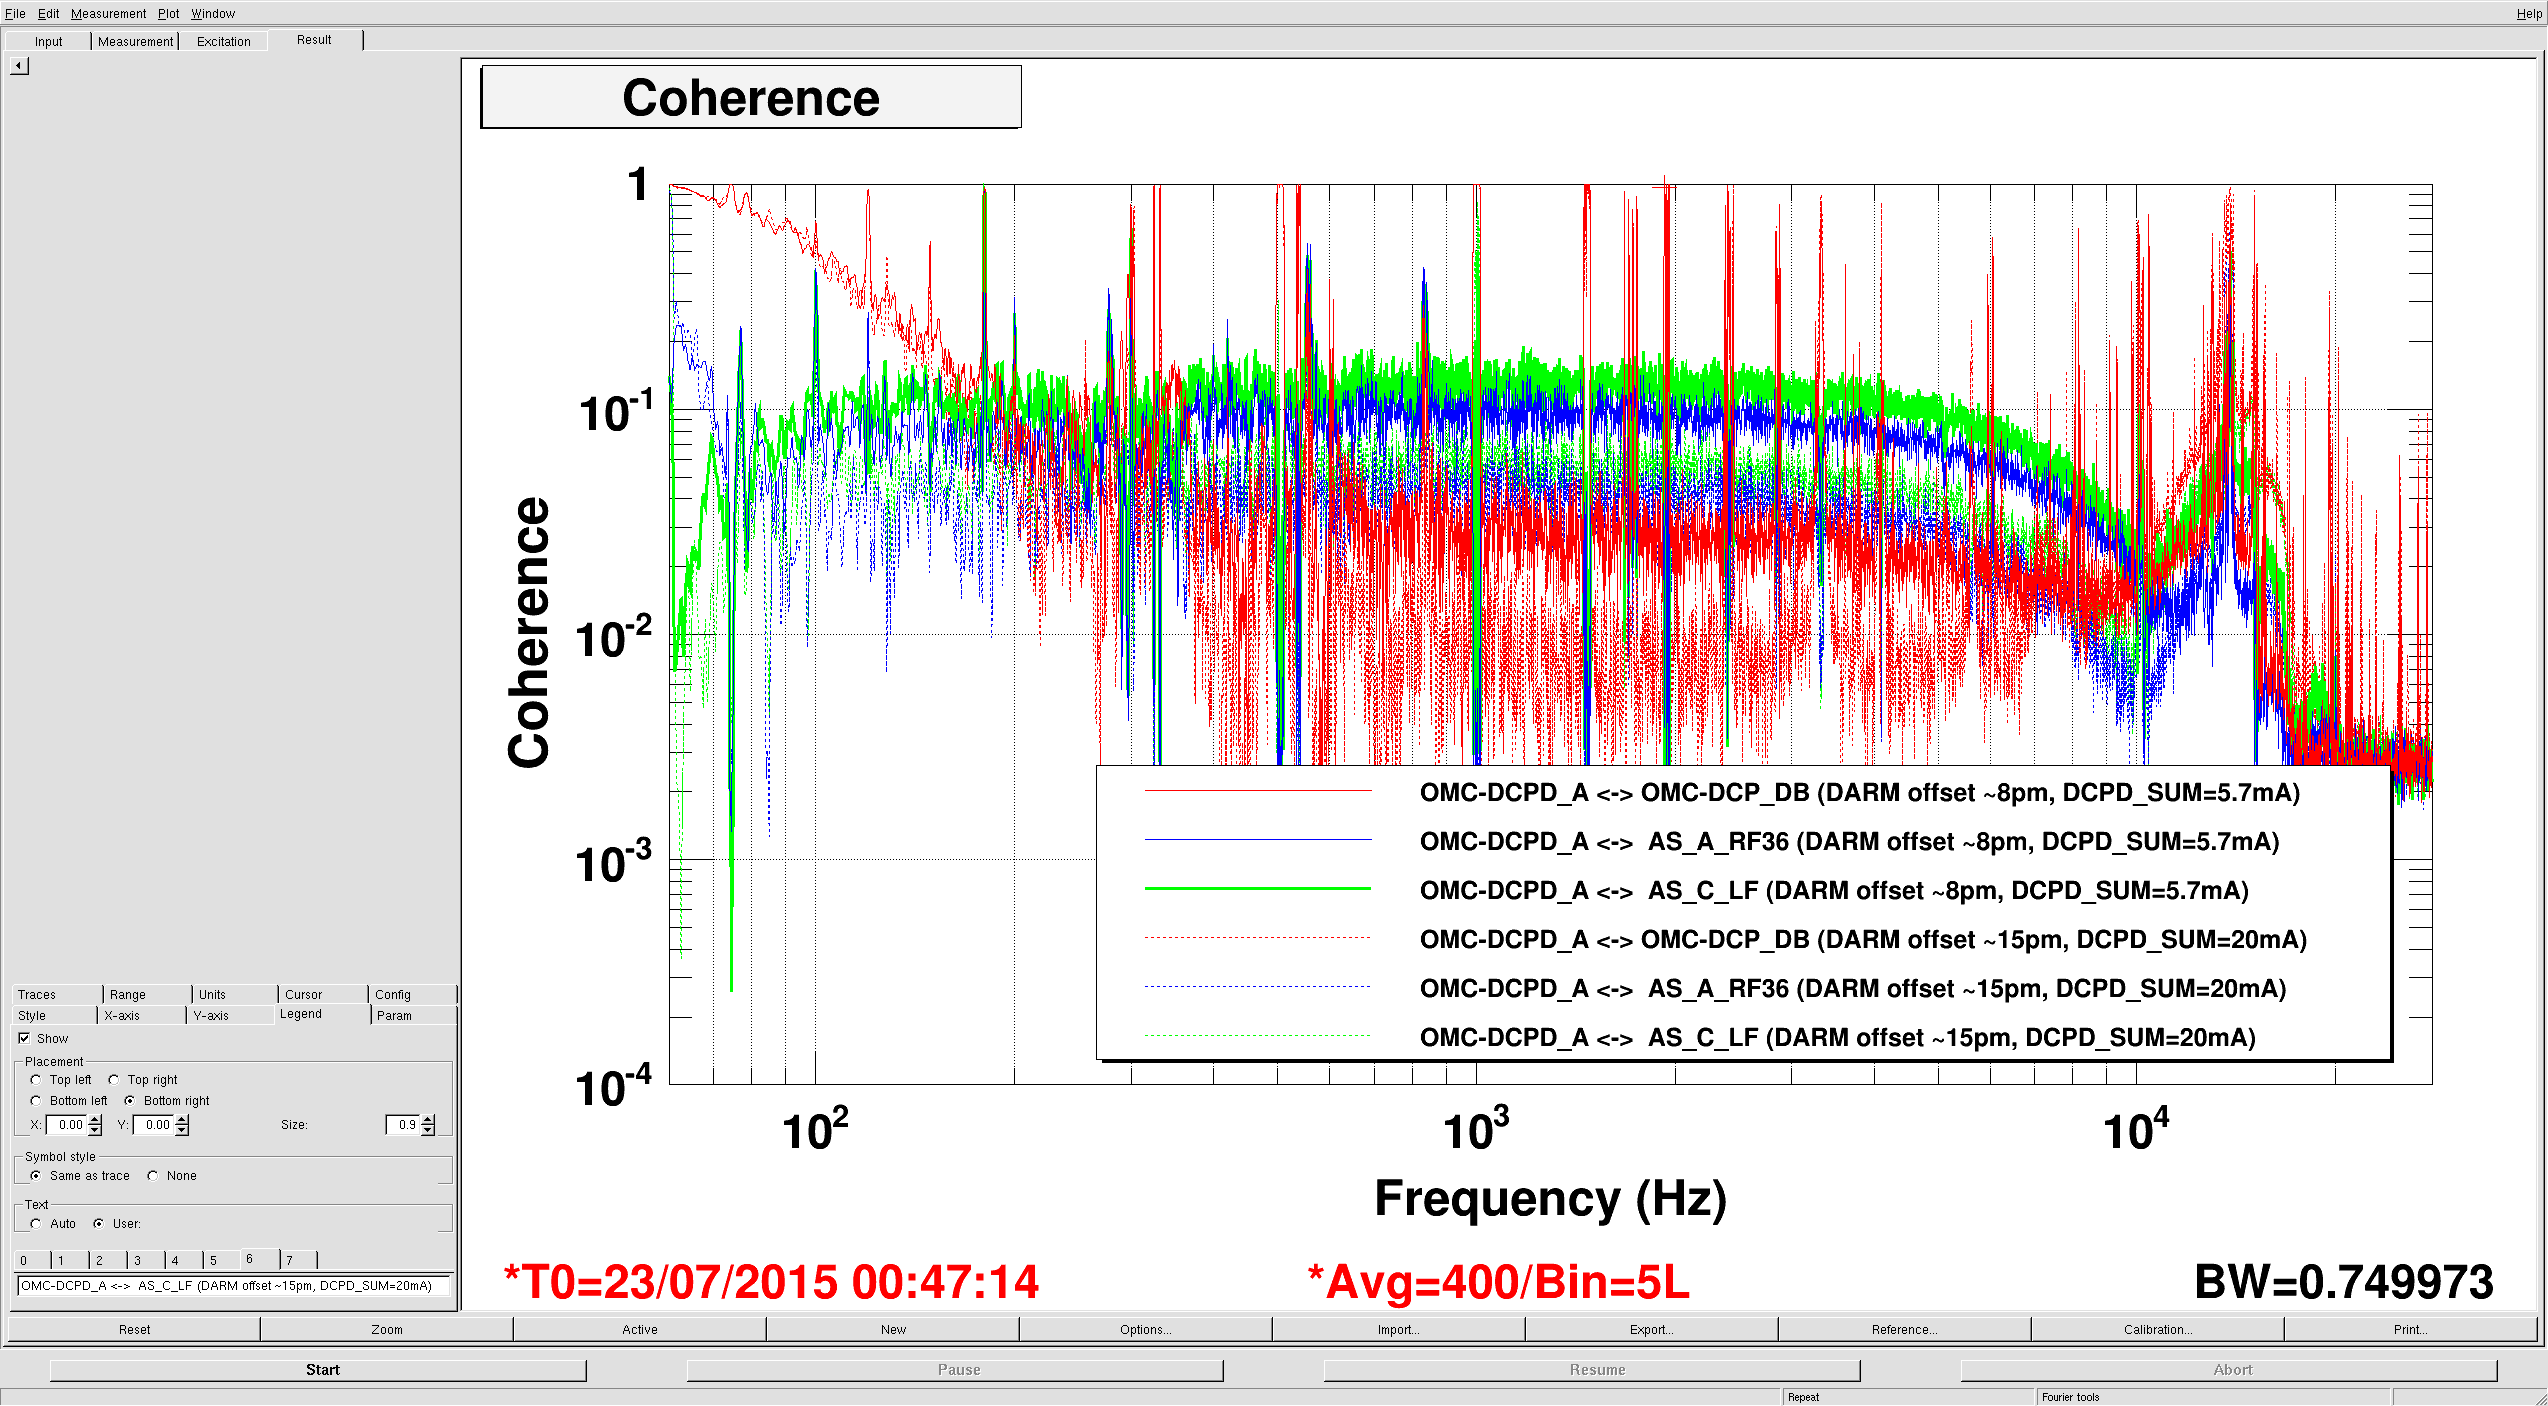
We observed broadband coherence of OMC_DC_SUM with ASC_AS_C_LF_SUM and ASC_A_RF36_PIT. We made some numbers and plots, using the 64kHz version of the channels.
First the measurements we made on OCXO oscillator:
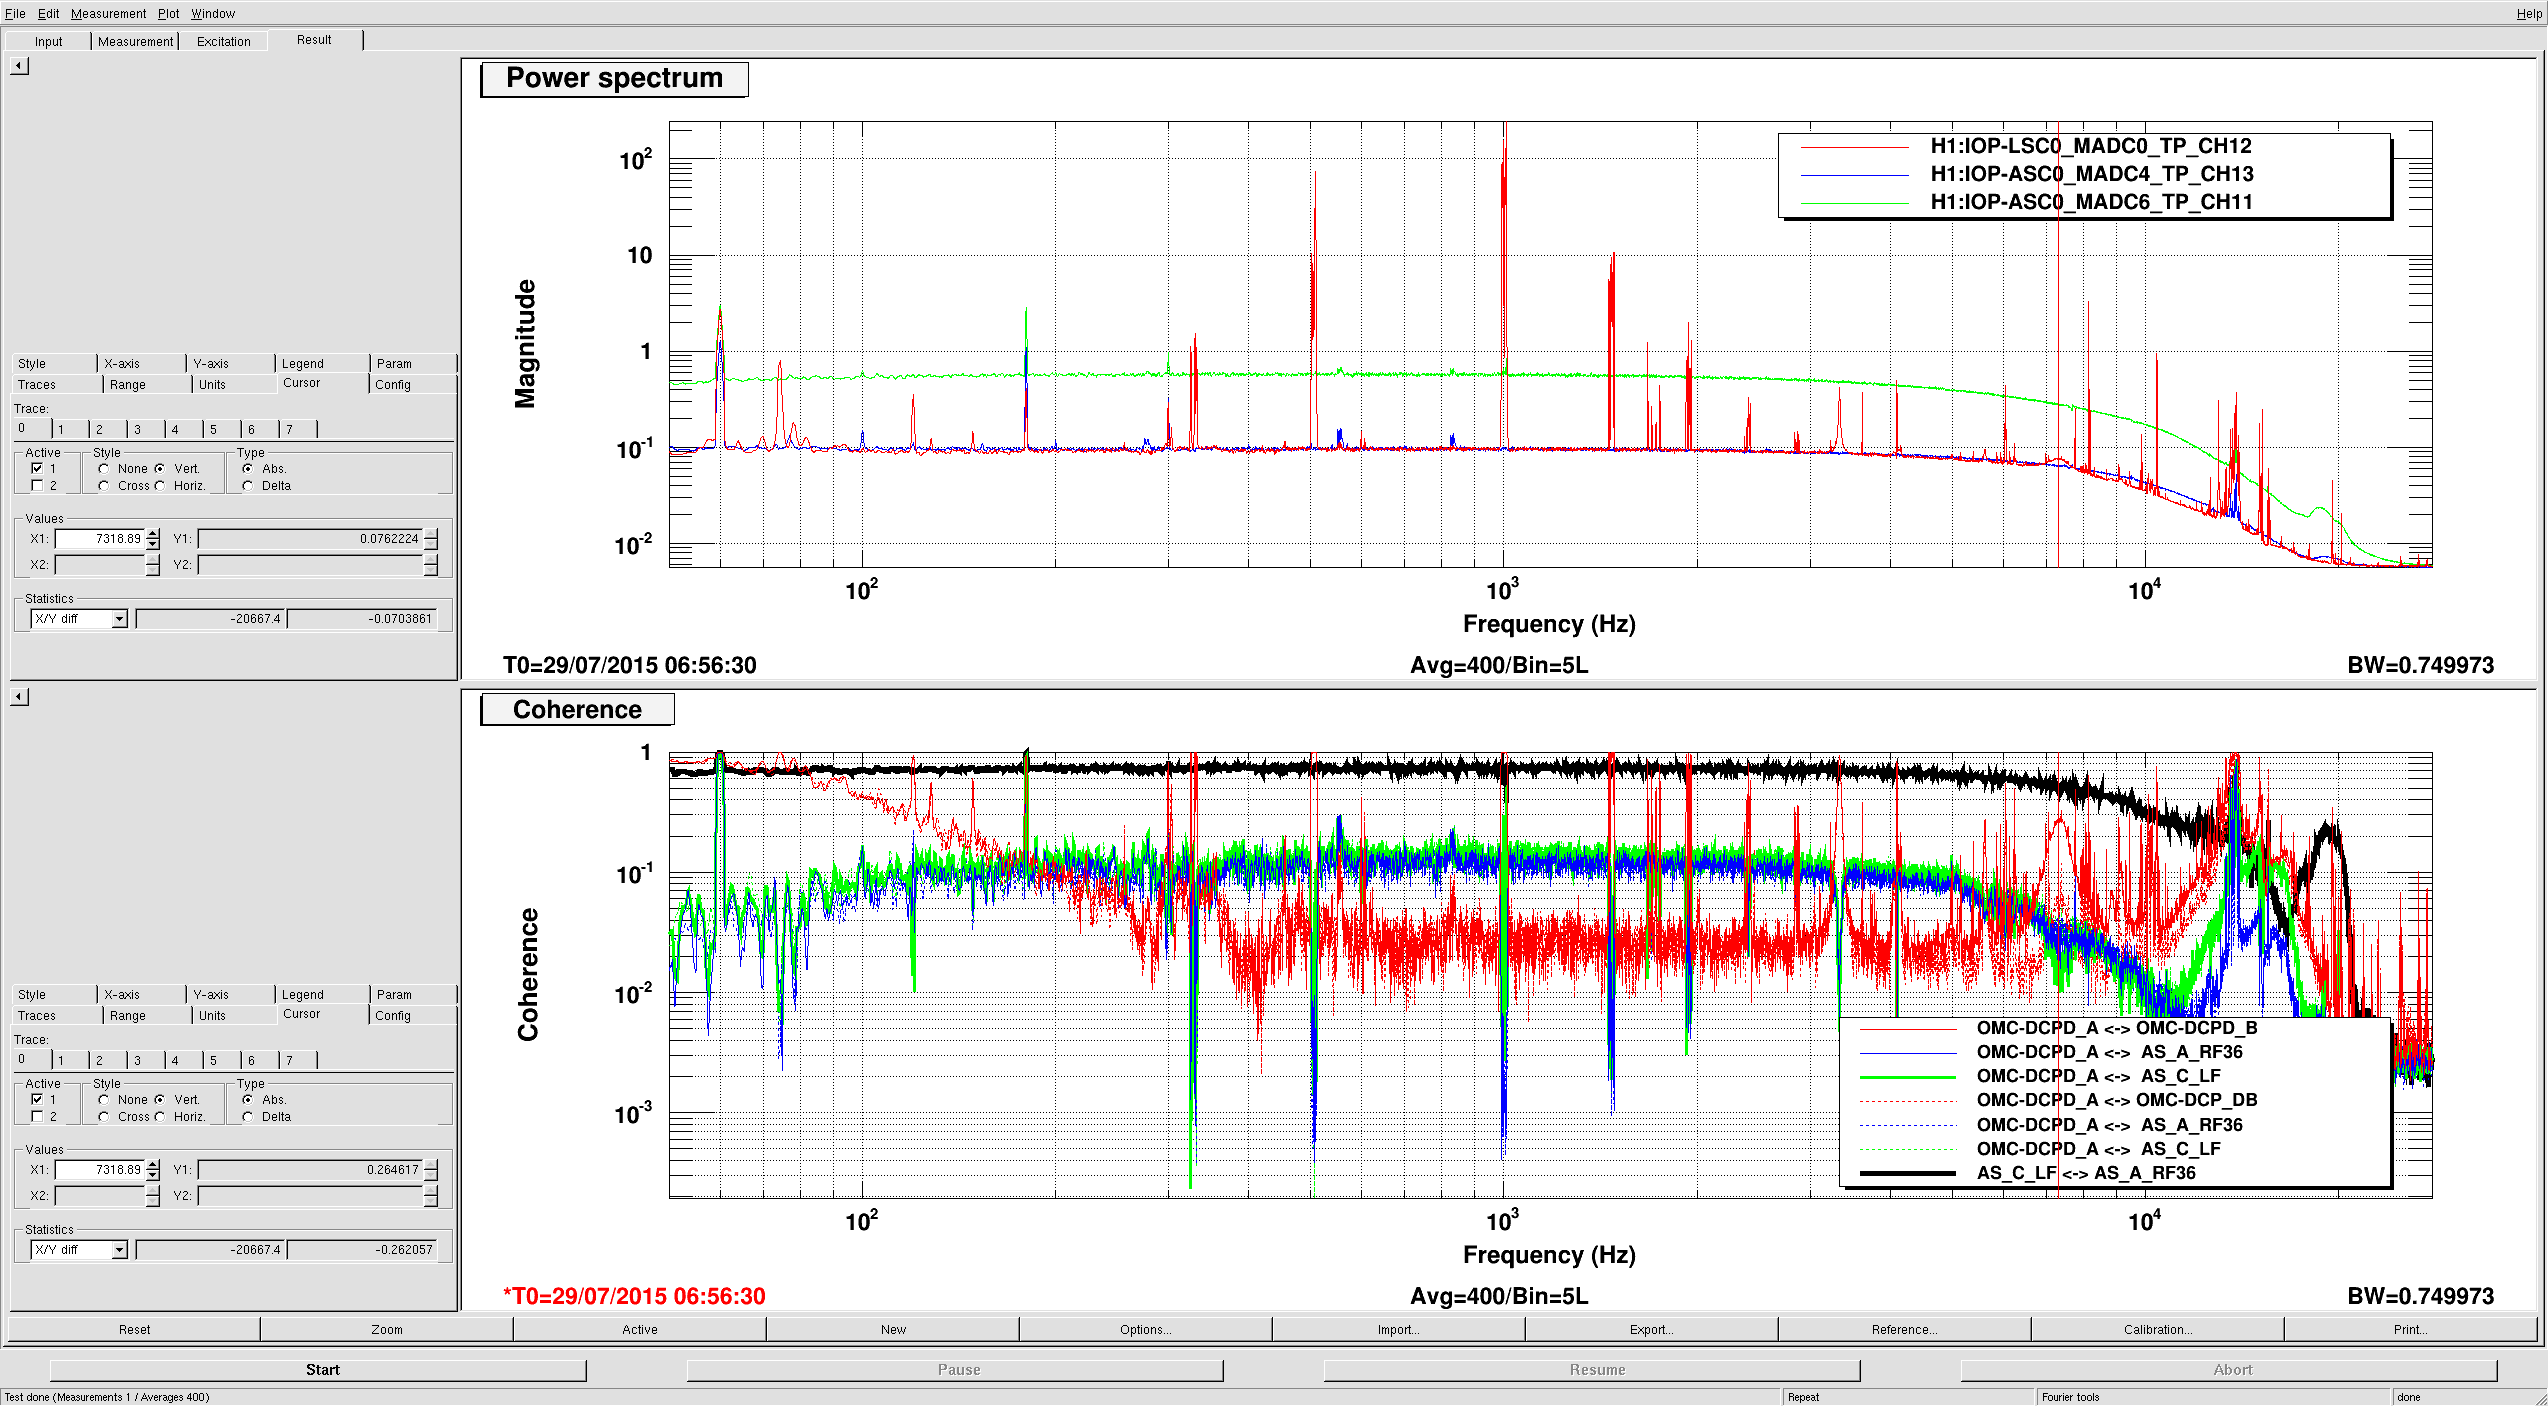
- ASC_AS_C sees a RIN of about 5e-7/rtHz above 100Hz (either from H1:ASC-AS_C_SUM_OUT_DQ or from H1:IOP-ASC0_MADC6_TP_CH11). The same is true for its segment 1.
- The calculated shot noise RIN at 20mA (quantum efficiency 0.87) detected is 4.0e-9/rtHz.
- The 4.0e-9/rtHz agrees with DCPD_NULL_OUT_DQ's prediction (8.0e-8 mA/rtHz/20mA).
- DCPD_SUM_OUT_DQ sees a slightly elevated RIN of 4.6e-9/rtHz (9.2e-8 mA/rtHz/20mA).
- The RIN in DCPDA (H1:IOP-LSC0_MADC0_TP_CH12, corrected for the whitening) is about 5.9e-8 mA/rtHz, or RIN = 5.9e-9/rtHz at 20mA/2diodes (~15pm DARM offset)...
- ...or about 3.3e-8 mA/rtHz or 1.2e-8/rtHz at 5.7mA/2diodes (~8pm DARM offset).
- ASC-AS_C_SEG1 (H1:IOP-ASC0_MADC6_TP_CH11) and OMC-DCPD_A (H1:IOP-LSC0_MADC0_TP_CH12) shows a coherence of 0.053 at 20mA, suggesting a white noise floor a factor of 0.23 below shot noise.
- At 5.7mA the same coherence is about 0.13, i.e. the white noise floor is a factor of 0.39 below shot noise.
- These two measurements are in plot 1.
- Taking the last two statements together, we predict a coherent noise of
- 5.9e-8 mA/rtHz *0.23 = 1.4e-8 mA/rtHz at 20mA/2diodes (~15pm DARM offset) (RIN of coherent noise = 1.4e-9/rtHz) - The pure shot noise part is thus 5.7e-8 mA/rtHz
- 3.3e-8 mA/rtHz *0.39 = 1.3e-8 mA/rtHz at 5.7mA/2diodes (~8pm DARM offset) (RIN of coherent noise = 4.5e-9/rtHz) - The pure shot noise part is thus 3.0e-8 mA/rtHz.
- AS_C calibration:
- 200V/W (see alog 15431)
- quantum efficiency 0.8 (see alog 15431)
- 0.25% of the HAM 6 light (see alog 15431)
- We have 39200cts in the AS_C_SUM. Thus we have
- 39200cts / (1638.4cts/V) * 10^(-36/40) (whitening) / (200V/W) = 1.89mW and AS_C. (shot noi
- 1.89mW/0.025 = 76mW entering HAM6. I.e. we have slightly more sideband power than carrier power (Carrier: 27mW in OMC transmission).
- Shot noise level on AS_C_SUM is at 2.0e-8 mA/rtHz, corresponding to a RIN of 1.6e-8/rtHz. I.e. the coherent noise seen at 5e-7/rtHz is high above the shot noise. Dark noise TBD.
- The light entering HAM 6 has a white noise of 5e-7/rtHz*76mW = 3.8e-5 mW/rtHz
Bottom line:
-We have ~1.4e-8mA/rtHz, or 1.9e-8mW/rtHz of coherent white noise on each DCPD.
-It corresponds to 3.8e-5mW/rtHz before the OMC, i.e. the the OMC seems to attenuate this component by 2000.
-This noise stays at the same level (in mW/rtHz) for different DCPD offsets.
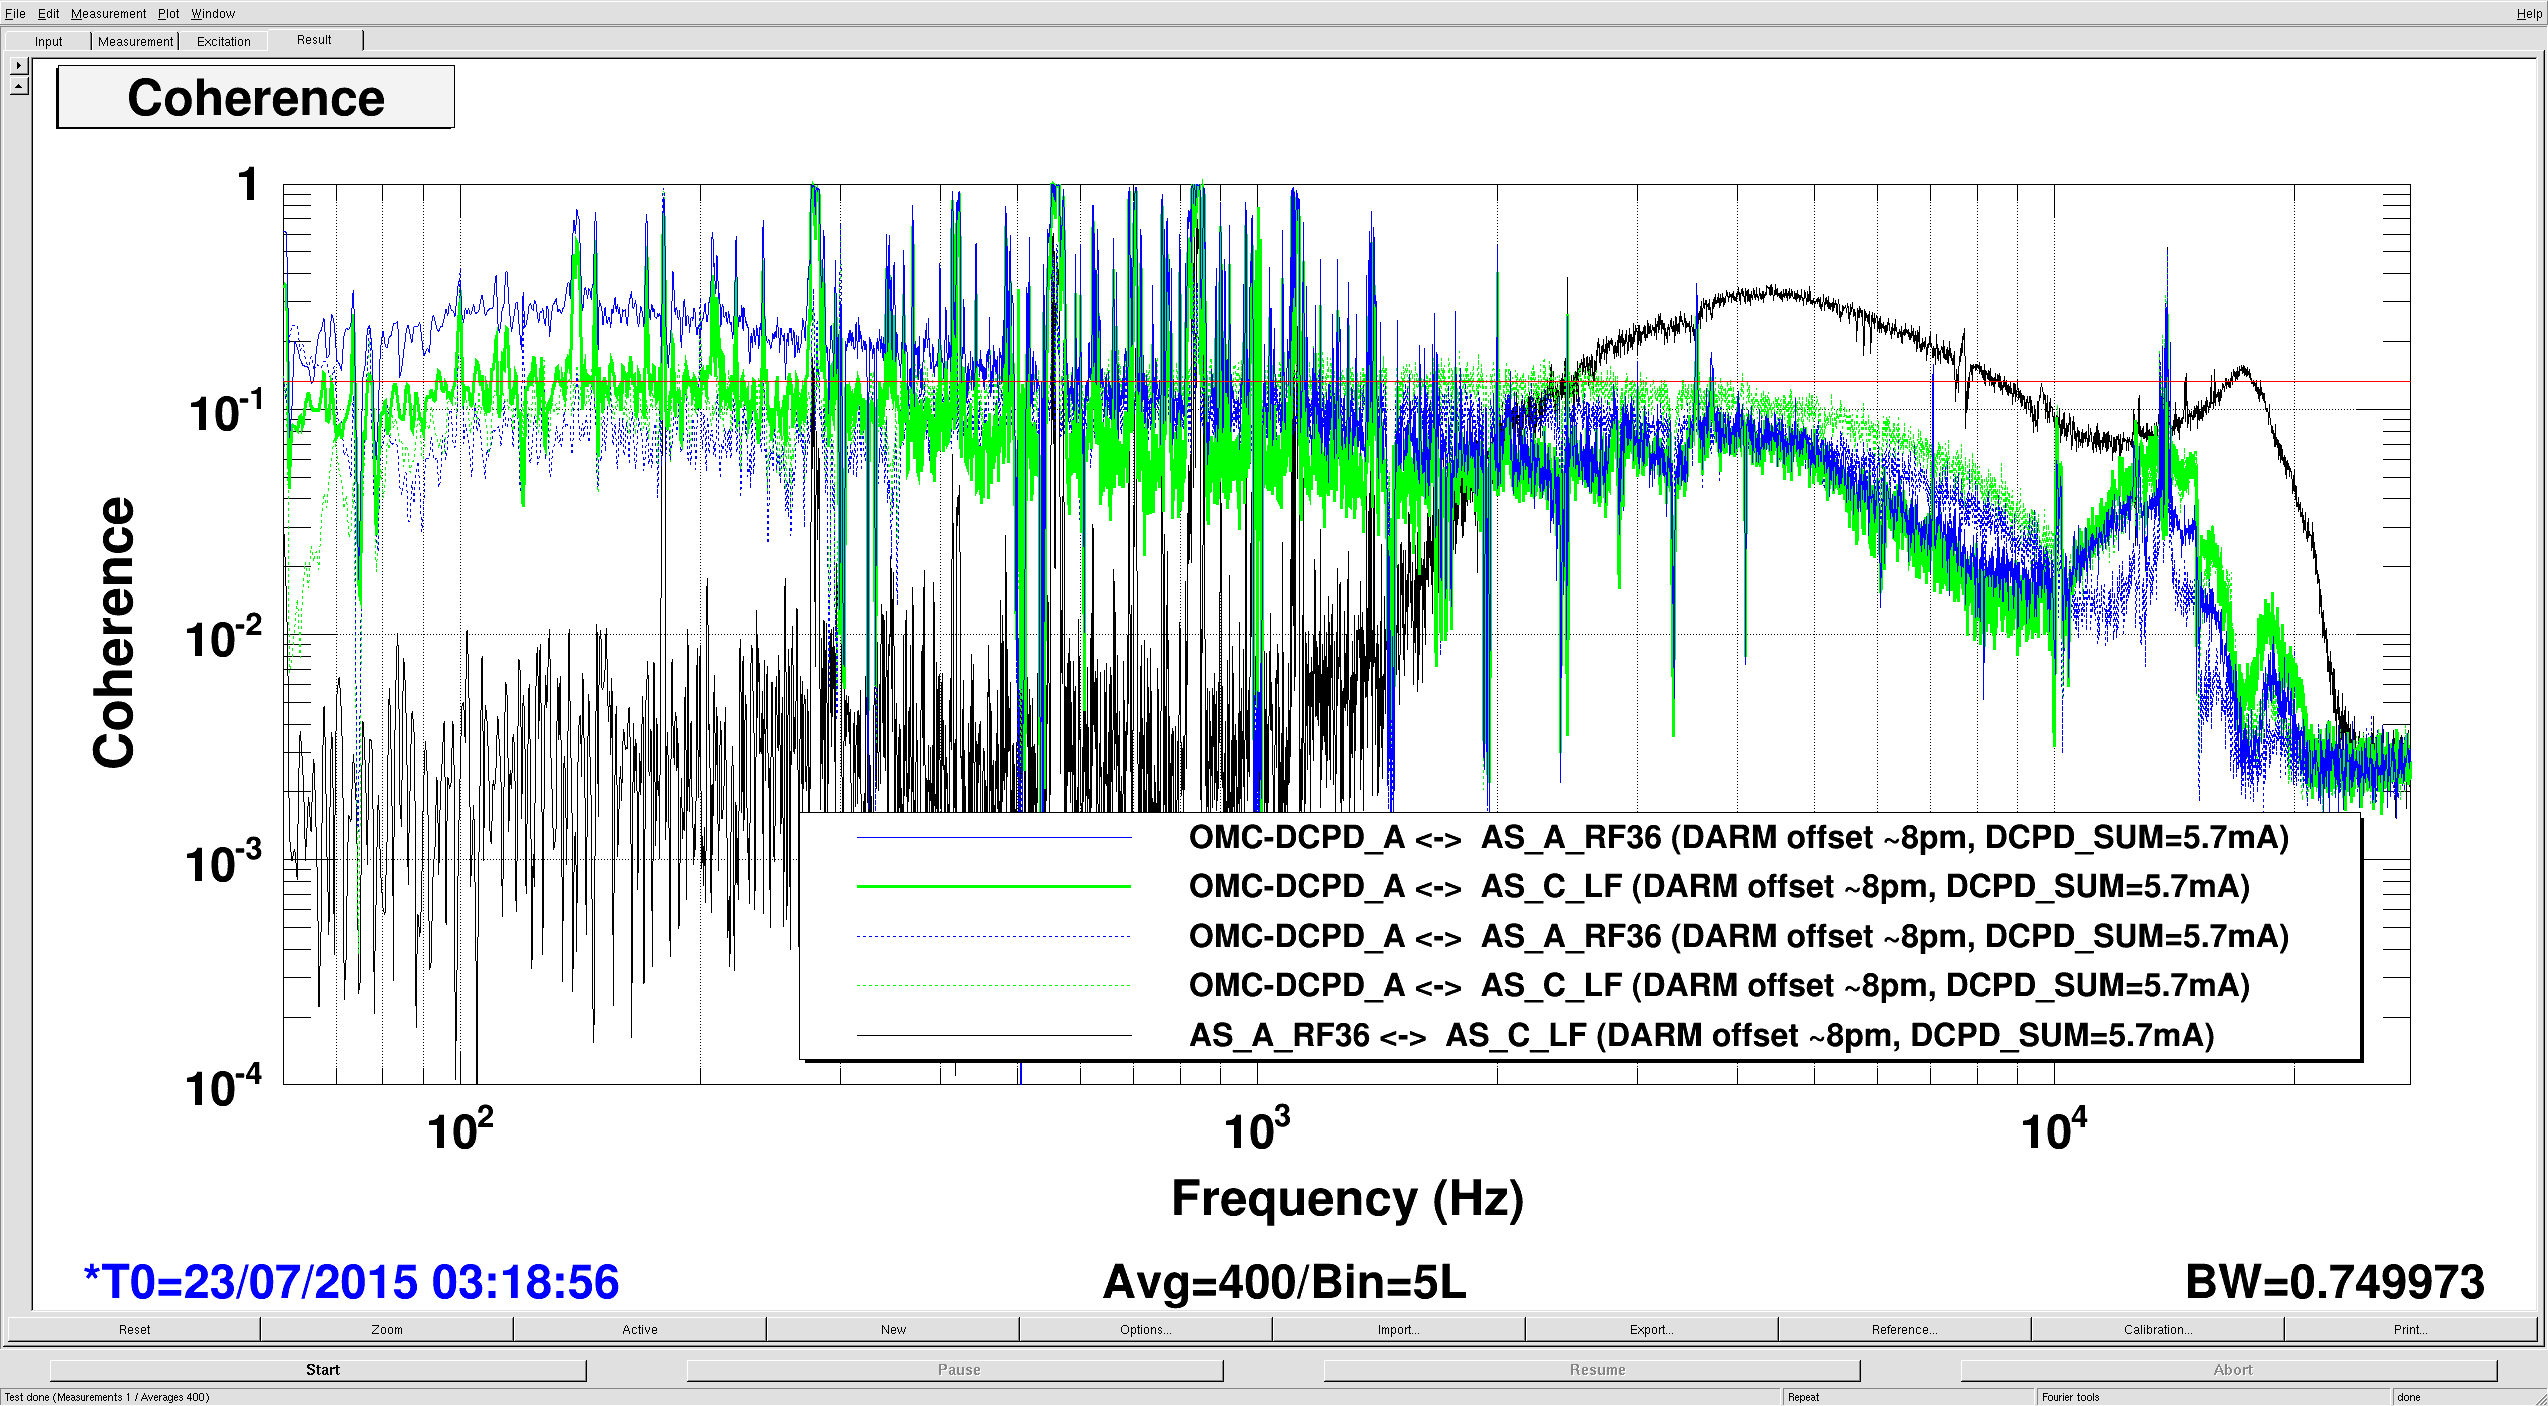
Next, we switched back to the IFR for testing. plot 2 shows the same coherences (all at 5.7mA / 8pm DARM offset), but on the IFR. Interestingly now AS_C and AS_A_RF36 start seeing different noise below 2kHz. We convinced our selfs that the higher excess noise seen in AS_A_RF36 is indeed oscillator phase noise from the IFR - so that is clearly out of the picture once of the OCXO. (Evan will shortly log the oscillator phase noise predictions.)
64k Channel list:
H1:IOP-LSC0_MADC0_TP_CH12: OMC-DCPD_A (used in plot)
H1:IOP-LSC0_MADC0_TP_CH13: OMC-DCPD_B
H1:IOP-LSC0_MADC1_TP_CH20: REFLAIR_A_RF9_Q
H1:IOP-LSC0_MADC1_TP_CH21: REFLAIR_A_RF9_I
H1:IOP-LSC0_MADC1_TP_CH22: REFLAIR_A_RF45_Q
H1:IOP-LSC0_MADC1_TP_CH23: REFLAIR_A_RF45_I
H1:IOP-LSC0_MADC1_TP_CH28: REFL_A_RF9_Q
H1:IOP-LSC0_MADC1_TP_CH29: REFL_A_RF9_I
H1:IOP-LSC0_MADC1_TP_CH30: REFL_A_RF45_Q
H1:IOP-LSC0_MADC1_TP_CH31: REFL_A_RF45_I
H1:IOP-ASC0_MADC4_TP_CH8: ASC-AS_A_RF36_I1
H1:IOP-ASC0_MADC4_TP_CH9: ASC-AS_A_RF36_Q1
H1:IOP-ASC0_MADC4_TP_CH10: ASC-AS_A_RF36_I2
H1:IOP-ASC0_MADC4_TP_CH11: ASC-AS_A_RF36_Q2
H1:IOP-ASC0_MADC4_TP_CH12: ASC-AS_A_RF36_I3
H1:IOP-ASC0_MADC4_TP_CH13: ASC-AS_A_RF36_Q3 (used in plot)
H1:IOP-ASC0_MADC4_TP_CH14: ASC-AS_A_RF36_I4
H1:IOP-ASC0_MADC4_TP_CH15: ASC-AS_A_RF36_Q4
H1:IOP-ASC0_MADC6_TP_CH11: ASC-AS_C_SEG1 (used in plot)
H1:IOP-ASC0_MADC6_TP_CH10: ASC-AS_C_SEG2
H1:IOP-ASC0_MADC6_TP_CH9: ASC-AS_C_SEG3
H1:IOP-ASC0_MADC6_TP_CH8: ASC-AS_C_SEG4
Some more estimation - this time for frequency noise:

- Shot noise on the refl diodes is given by Pshot=sqrt(2*h*nu*Pr_lock)
- The cavity sensing function is P_9_pk = 4*Gam9*P0 * dNu(f)/(f_p + i*f), where P0 would be the carrier power incident on the PD without the IFO.
- from this we can estimate a frequency (phase) noise of about 8e-11 rad/rtHz.

Gam9=0.219; %alog15874
PSL_low=2; %W
Pr_nolock_low=13.7e-3; %W
PSL_lock=24;
Pr_lock=3.5e-3; %W
IMCt=0.88;
att=Pr_nolock_low/(PSL_low*IMCt);
P0=PSL_lock*IMCt*att;
inlockdrop=Pr_lock/(P0);

Pshot=sqrt(2*h*nu*Pr_lock);
dphi=Pshot/P0/4/pi/Gam9;
For reference, I ran the numbers on where we would expect the sidebands to show a resonance feature.

I used the following values:
RITM=1939.3m
RETM=2241.54m
L=3994.485m

Checking accidental sideband resonances in the arm cavities:
Resonance condition: fres = FSR * (q  + (l+m+1)*fTM/FSR)
Free Spectral Range (FSR)    : 37.5258 kHz
Transverse Mode Spacing (fTM): 32.4297 kHz
Checking f1 sideband:
q=242	l+m=0	 Freq. diff. = 18.2284 kHz
q=242	l+m=0				 Freq. from antiresonant = 0.534516 kHz
q=242	l+m=1	 Freq. diff. = 14.2013 kHz
q=241	l+m=1				 Freq. from antiresonant = 4.56162 kHz
q=241	l+m=2	 Freq. diff. = 9.10514 kHz
q=-242	l+m=0	 Freq. diff. = 18.2284 kHz
q=-243	l+m=0				 Freq. from antiresonant = 0.534516 kHz
q=-243	l+m=1	 Freq. diff. = 13.1322 kHz
q=-244	l+m=1				 Freq. from antiresonant = 5.63065 kHz
q=-244	l+m=2	 Freq. diff. = 8.0361 kHz
Checking f2 sideband:
q=1212	l+m=0	 Freq. diff. = 16.0903 kHz
q=1212	l+m=0				 Freq. from antiresonant = 2.67258 kHz
q=1212	l+m=1	 Freq. diff. = 16.3393 kHz
q=1211	l+m=1				 Freq. from antiresonant = 2.42356 kHz
q=1211	l+m=2	 Freq. diff. = 11.2432 kHz
q=-1212	l+m=0	 Freq. diff. = 16.0903 kHz
q=-1213	l+m=0				 Freq. from antiresonant = 2.67258 kHz
q=-1213	l+m=1	 Freq. diff. = 10.9942 kHz
q=-1214	l+m=1				 Freq. from antiresonant = 7.76872 kHz
q=-1214	l+m=2	 Freq. diff. = 5.89804 kHz
Evan, Matt, Lisa

We did one more test for the broadband coherence noise: Common mode gain +3dB vs -3dB

We see no chnge in the broadband level of the noise below 10000Hz.
However, we do see an FSS gain oscillation at 7320Hz showing up in the OMC_DCPD_SUM - but not in AS_C_LF or AS_A_RF36 - in fact that coherence has adip where we get the frequency noise oscillation.
This strongly suggests that our broadband noise is NOT frequency noise.

Evan also took the frequency noise transfer function - a preliminary analysis here also confirms: the frequency noise should be significantly below the O(1e-8mA/rtHz) noise level we see.
Note that the higher order mode estimates above were made using a slightly wrong modulation frequency. Updated estimates for the correct modulation frequency are attached to alog 20147
- ASC-AS_C GETS 2.5% of the HAM 6 light (see alog 15431) (NOT 0.25%)
Actually AS_C gets 400ppm of the light entering HAM6 -- the OM1 mirror was swapped from 5% transmission to 800ppm transmission in early April. See alog:17738.


The OMC refl shutter is normally kept closed, but I have just opened it.