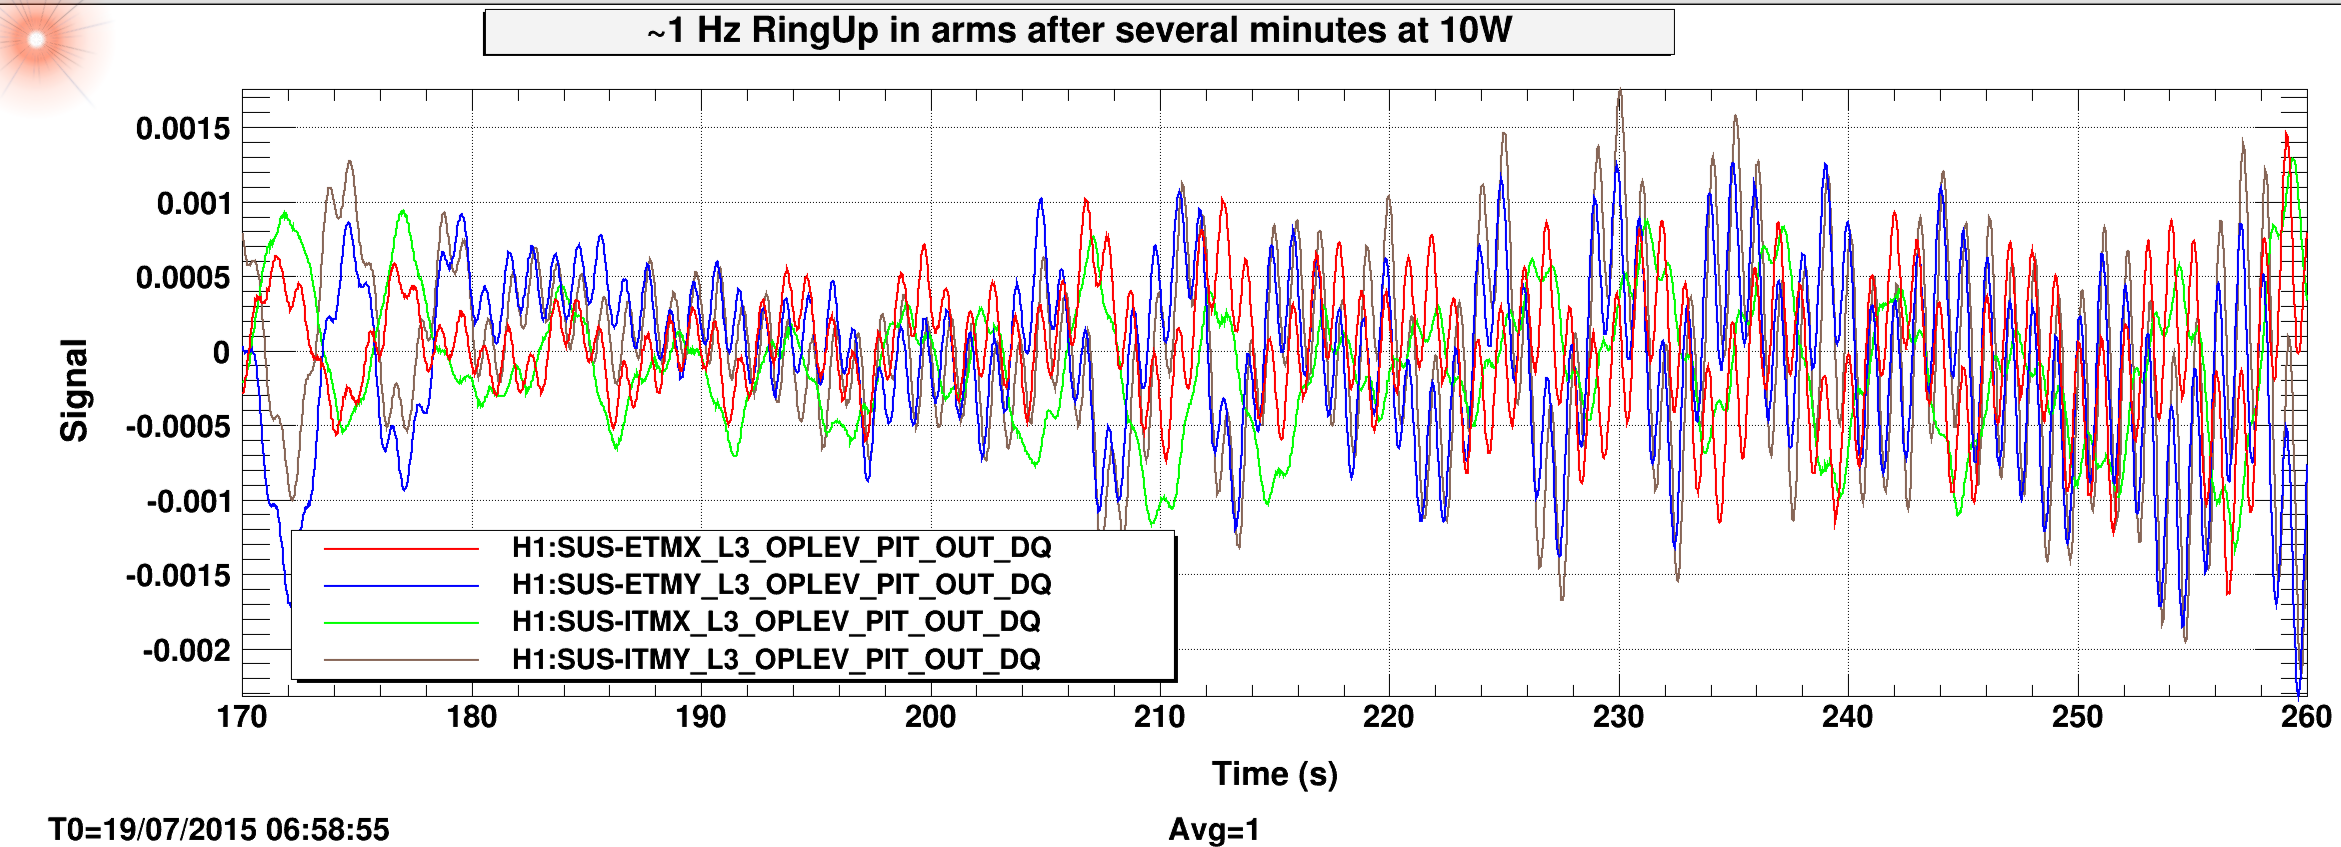
jameson.rollins@LIGO.ORG - posted 12:44, Sunday 19 July 2015 - last comment - 15:11, Sunday 19 July 2015(19742)
Guardian core upgraded again to
Guardian core upgraded again with additional patch to further address issues from last fix
Current version:
- guardian r1450
The previous upgrade to r1449 included a patch to throw errors if any other internal state inconsistencies (like that which caused the "double main()" bug) are detected. The errors encountered since Friday are from failures of these internal consistency checks, apparently from situations not fully covered in the battery of unit tests. This patch covers those situations. I'm looking into improvements to the unit tests to cover more of the user phase space.
No nodes have been restarted.


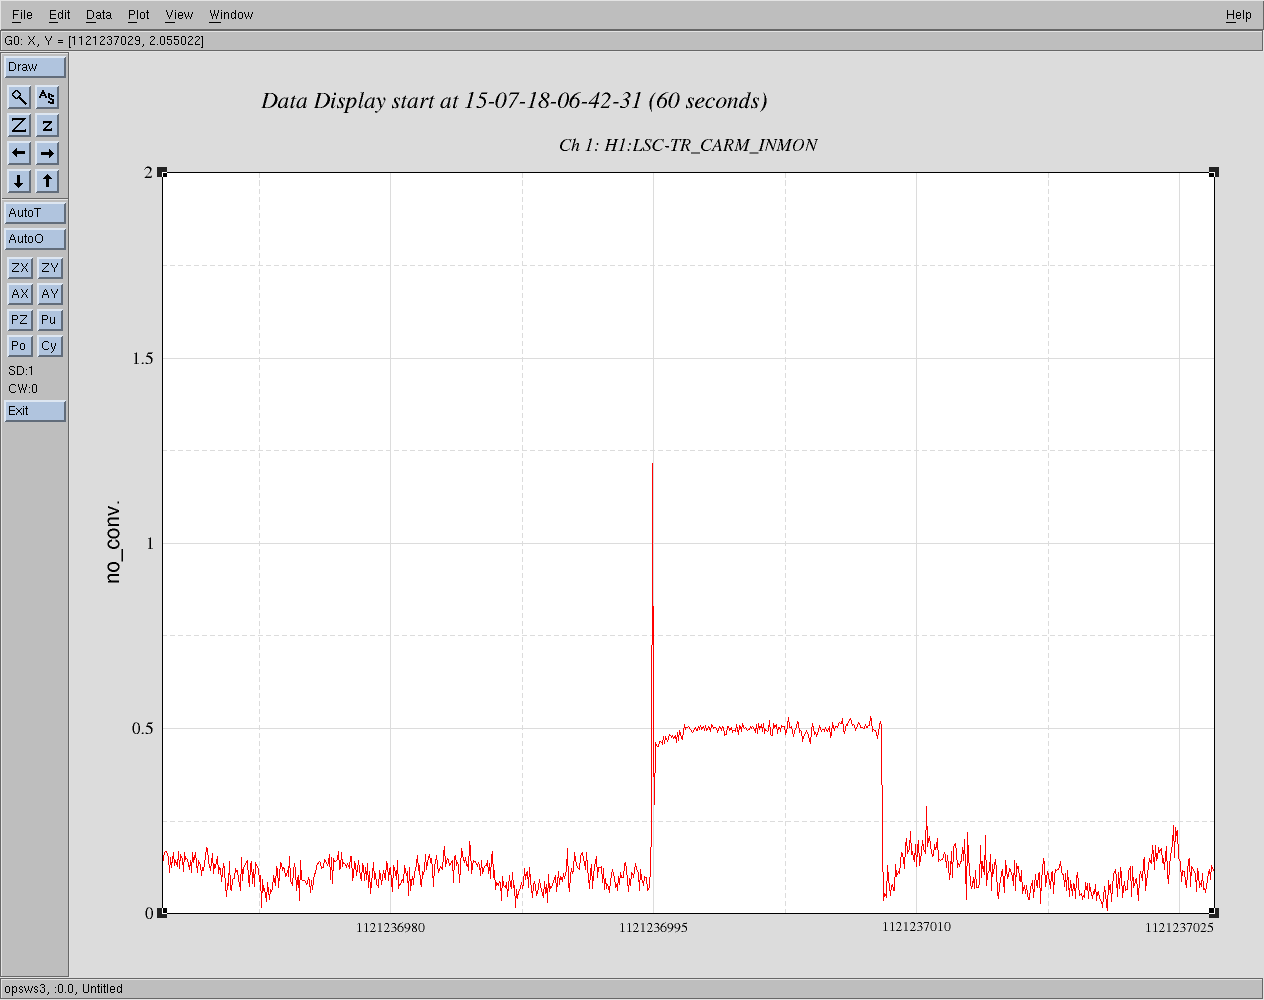

ISC_LOCK and ISC_DRMI were restarted around 2015-07-19 22:10:00 Z.