jim.warner@LIGO.ORG - posted 15:58, Friday 01 May 2015 (18155)
Shift Log
Quiet day of locking for the mini-run.
9:00 start locking IFO
11:09 DC lock achieved
11:40 intent bit set to undisturbed
11:52 JeffK starting DARM OLG measurement
12:14 JeffK done with DARM OLG measurement
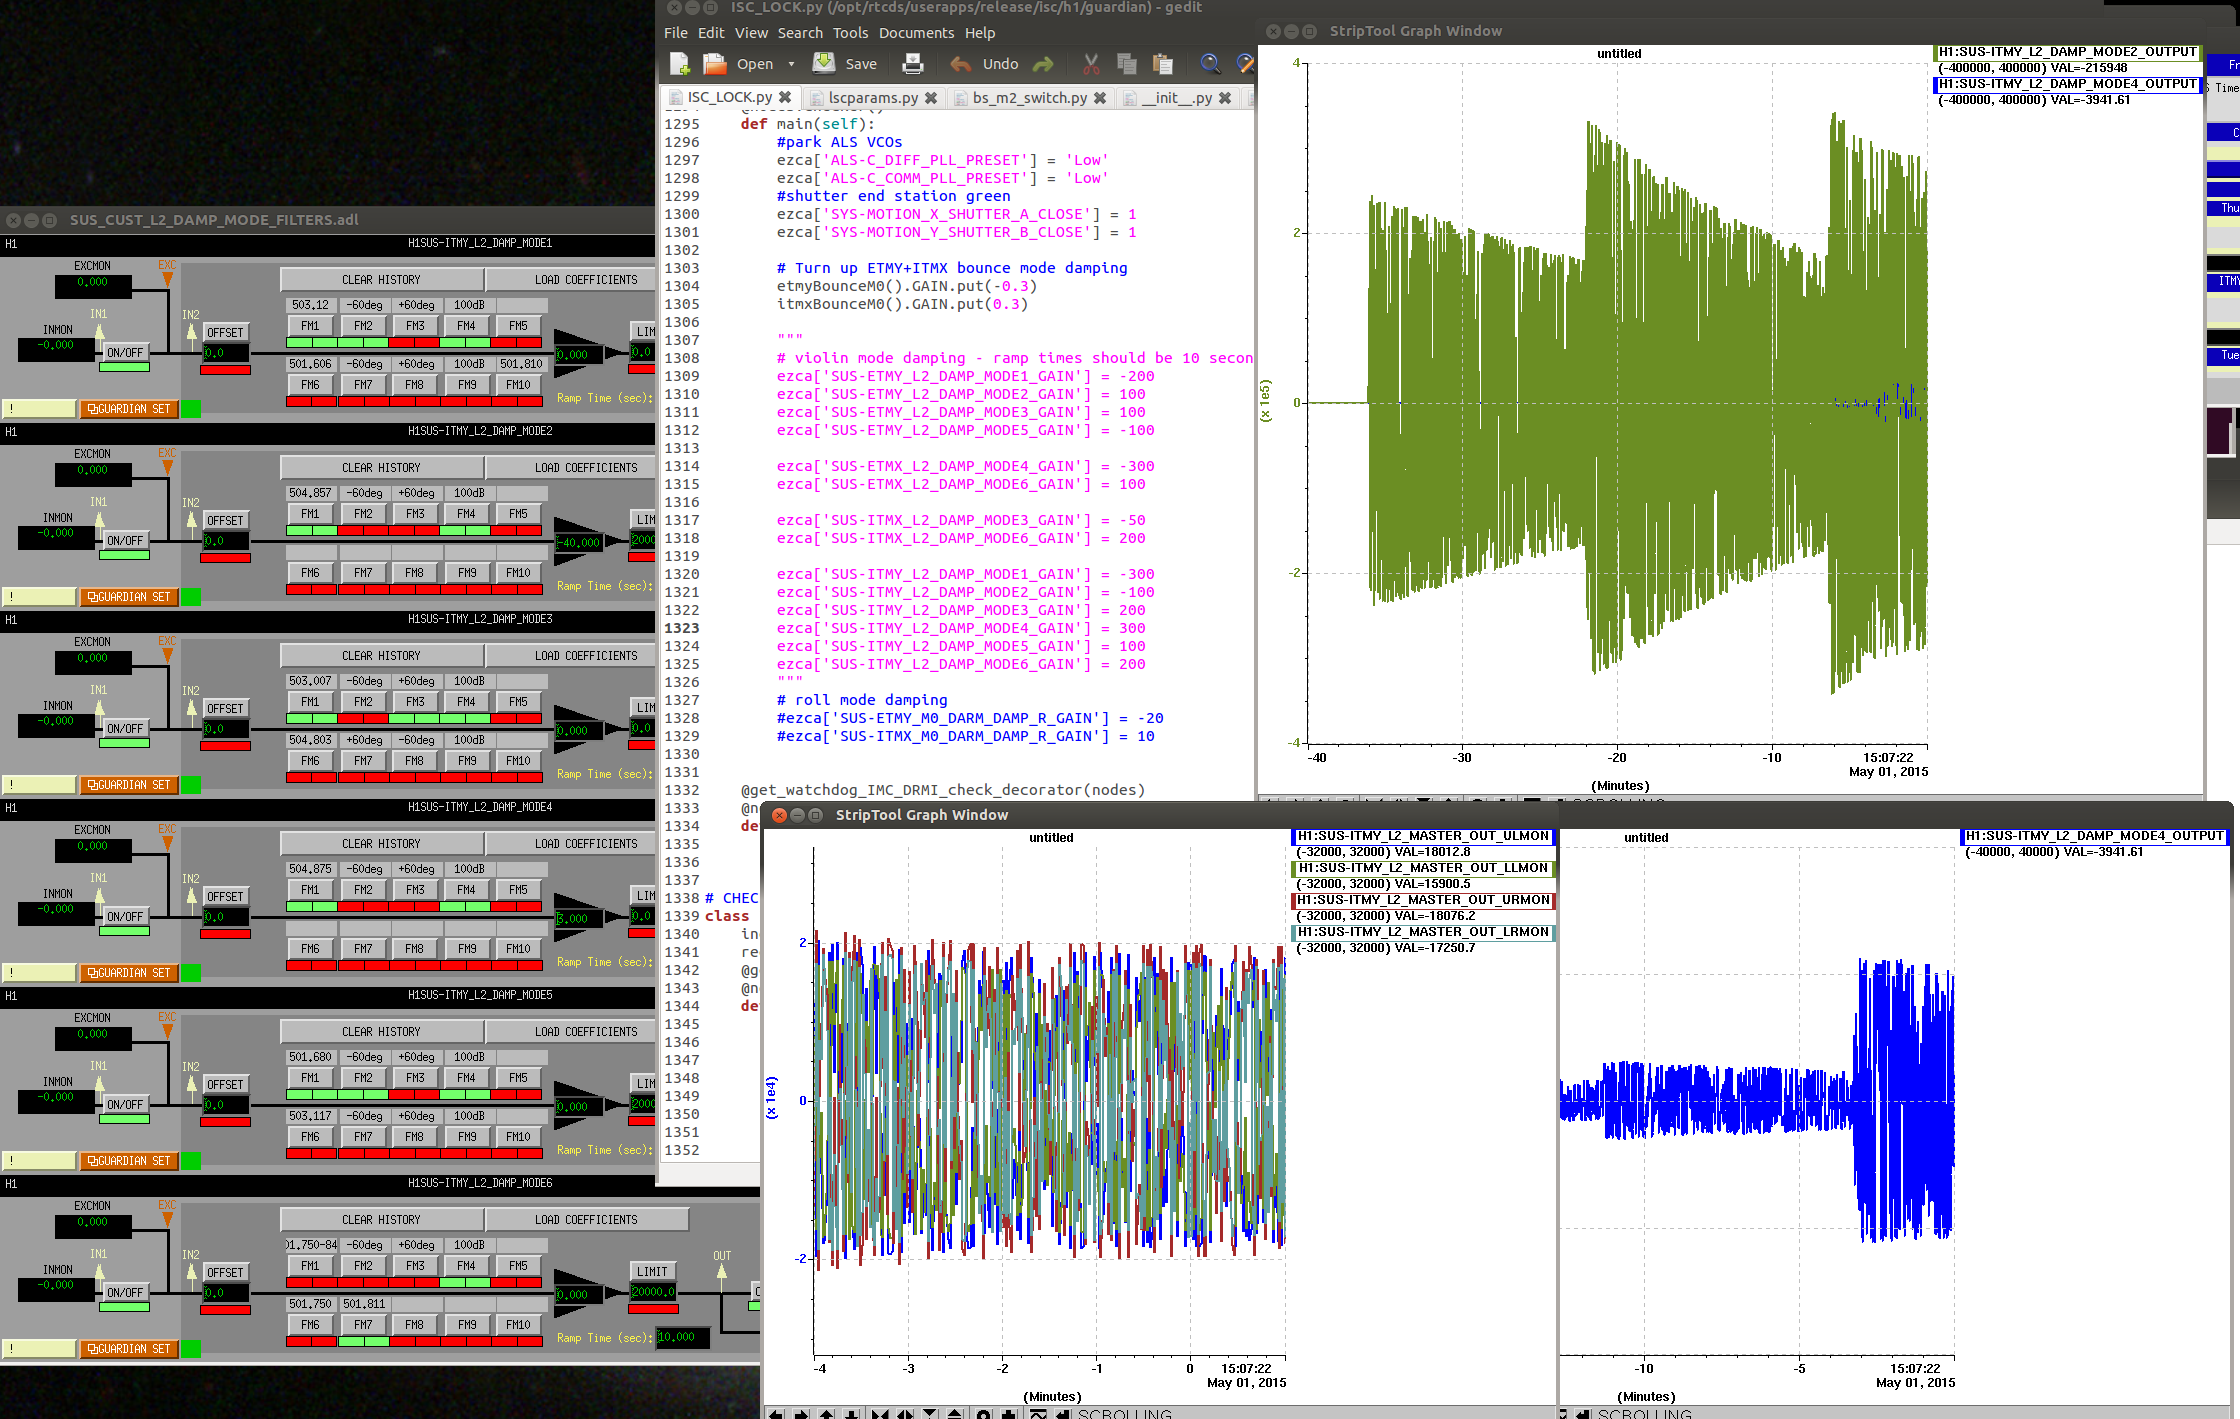
13:30 Lost lock, violin modes run up, waiting for modes to damp down before regaining lock.
16:00 Still waiting for ITMY to settle down.