Matt, Dan
After Alexa gave us a quick alignment tutorial, we started by fiddling with the dither alignment of the X-arm. The PD thresholds for dithering across the baffle PDs were set to very small values, so small that the dither would declare victory before it even started. Matt has been working on the initial alignment, I'll let him say more about it.
We noticed that the green spot on the TMS-Y mirror, visible through ETMY, is very low. There are large offsets in the EY green QPDs that steer the beam to what looks like a bad place on the mirror. Zeroing these offsets (which is where they were for most of the last six months) would have forced us to begin a painful realignment procedure, so we left them as we found them. Historically it looks like people have set these values to maximize the buildup in the arms, but it's hard to believe that the optimal beam position is so far off-center.
With the arms well-aligned for green we aligned the corner optics - IM4, PR2, PRM, BS, SRM. The scripts for this went quickly, about five minutes.
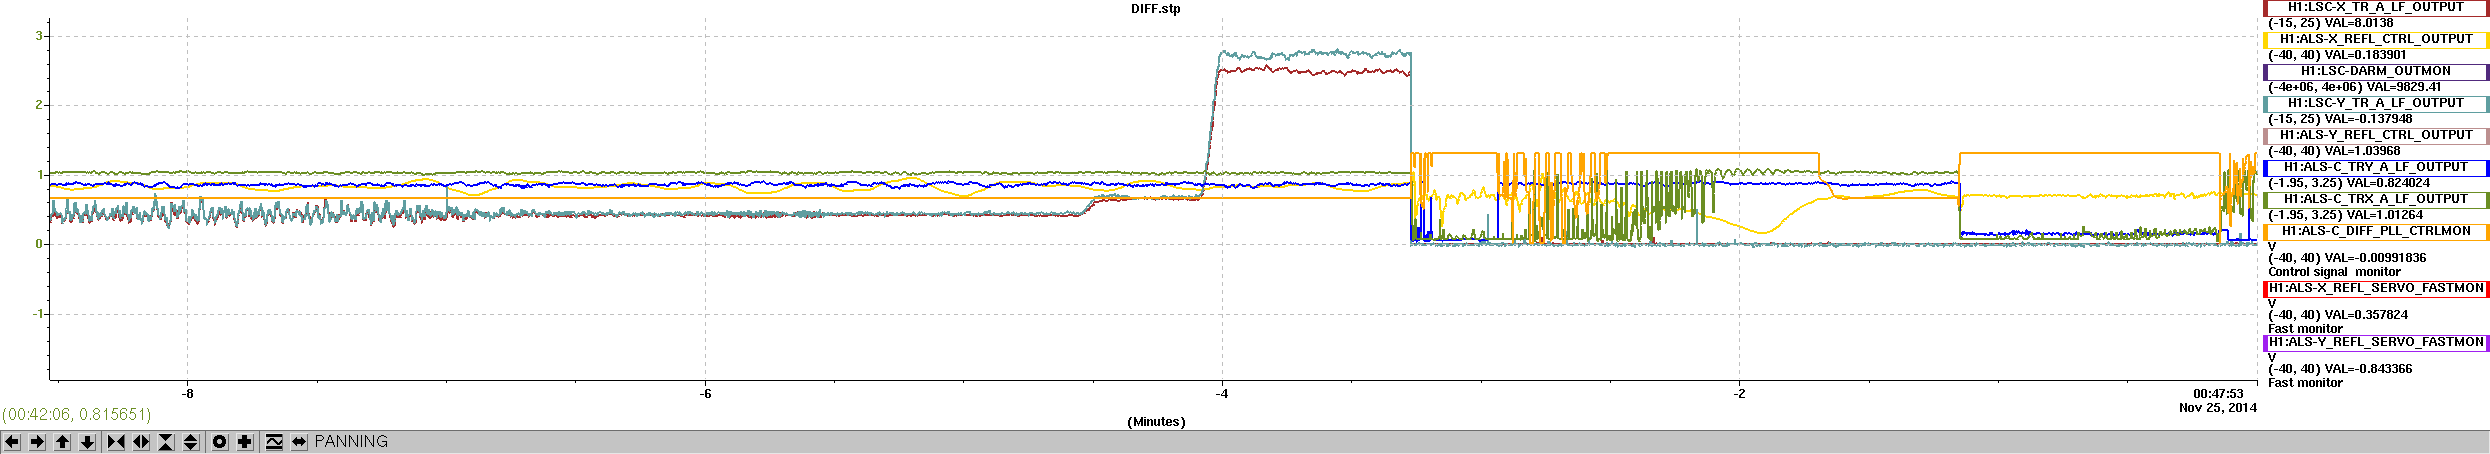
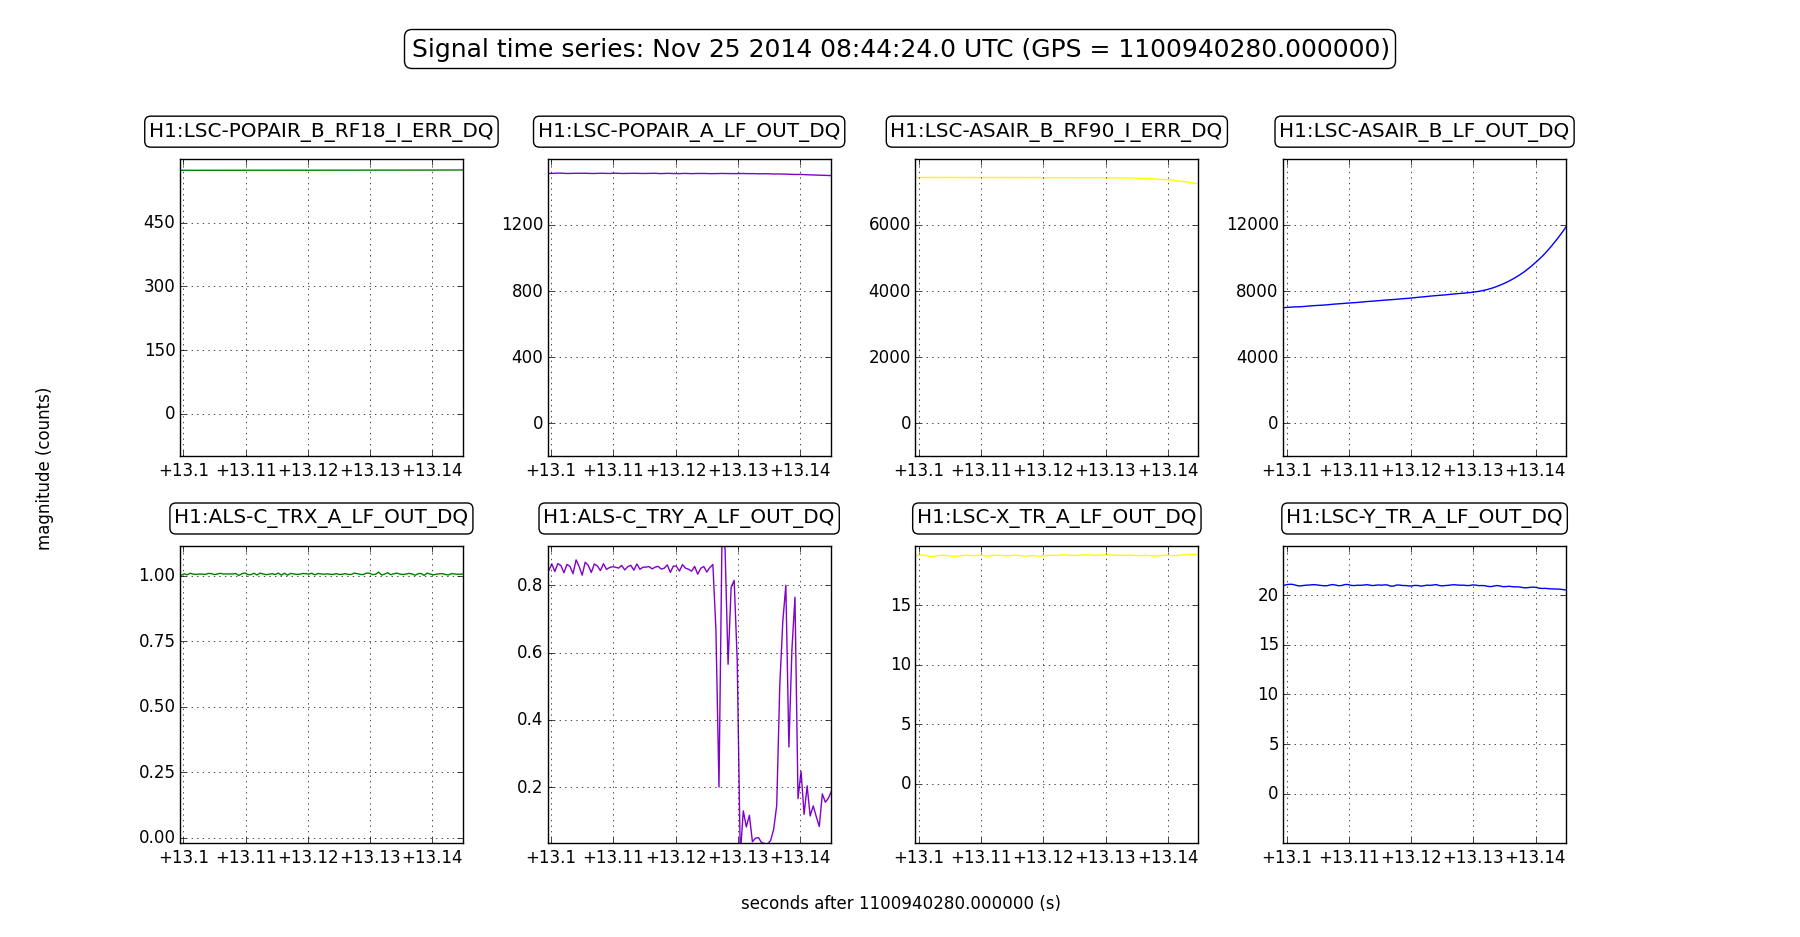
Then we locked the DRMI, with the arms misaligned. Locking tonight was fast and robust; the DRMI would lock within a few minutes (rarely more than 5 minutes), and would remain locked for tens of minutes. There were many unexplained lock losses, so things are not as stable as we'd like, but we didn't see any mode hopping and the sideband buildup was consistently good. Over three hours of DRMI locking we didn't observe a significant drift in the alignment.
We went through the DRMI guardian and commented out lots of gain/switch settings that weren't needed, mostly for the DC centering. The script is now pretty fast, it goes from lock acquisition to ASC loops on in less than 30 seconds. We did not observe any unexpected long pauses. The duration of the script is dominated by ramping the SRM and PRM M2 gains, this takes 9 seconds total (4.5sec each).
We re-enabled the PRM and SRM2 offloading to M2. We found the SRM offloading was a little flaky and sometimes broke the lock. To make this a little gentler, we reduced the initial gain ramp to 1, and ramped the rest of the way (to 4.5) after the WFS turned on.
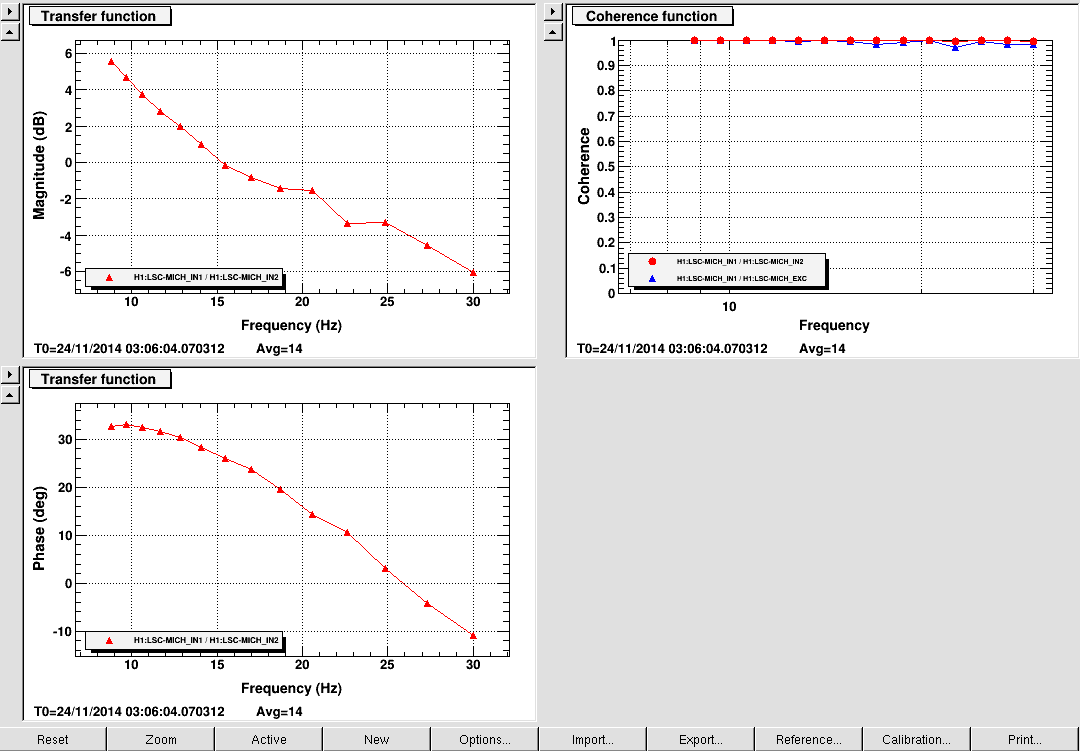
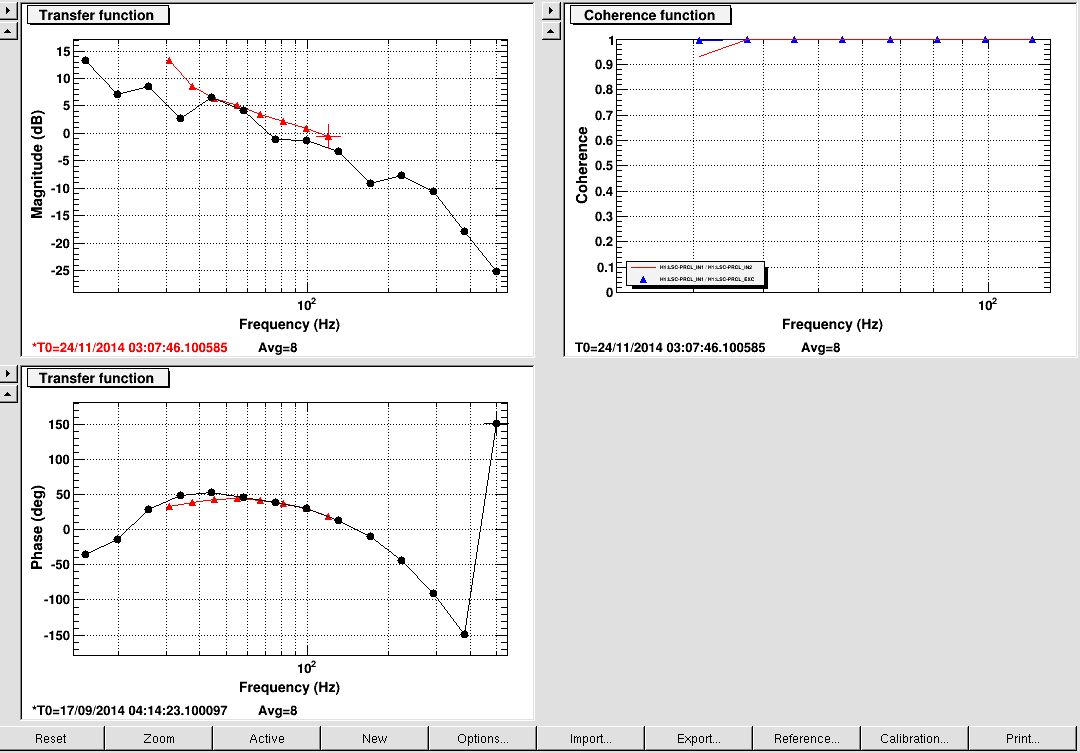
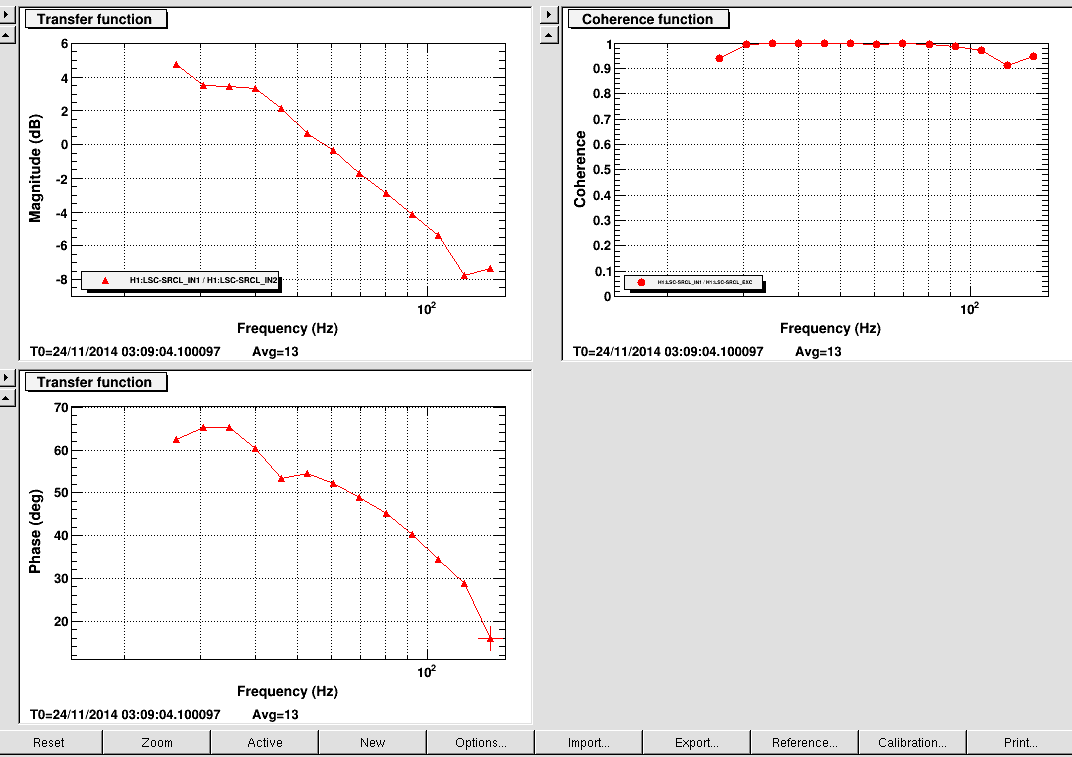
We measured the LSC OLTFs and found that MICH and PRCL didn't have much phase margin (~25deg each). We reduced the gain for these loops so that they both have >30deg. The MICH gain is now 3 (was 5) and PRCL is 15 (was 22).
Afterwards I mucked around with the OMC, I found a set of good misaligned values for ITMX and ITMY that minimized the RIN at the dark port when the other ITM was aligned (presumably this steers ghost beams away from the OMC). Following Gabriele's instructions I used the picos to center the beam on IMC WFS A and added some offsets to the IMC ASC loops; this reduced the intensity noise measured by the ISS second loops PDs by a factor of three or so. I tried to engage the ISS second loop but failed. The script posted here did not appear to work; I tried to follow these directions but the loop was unstable.
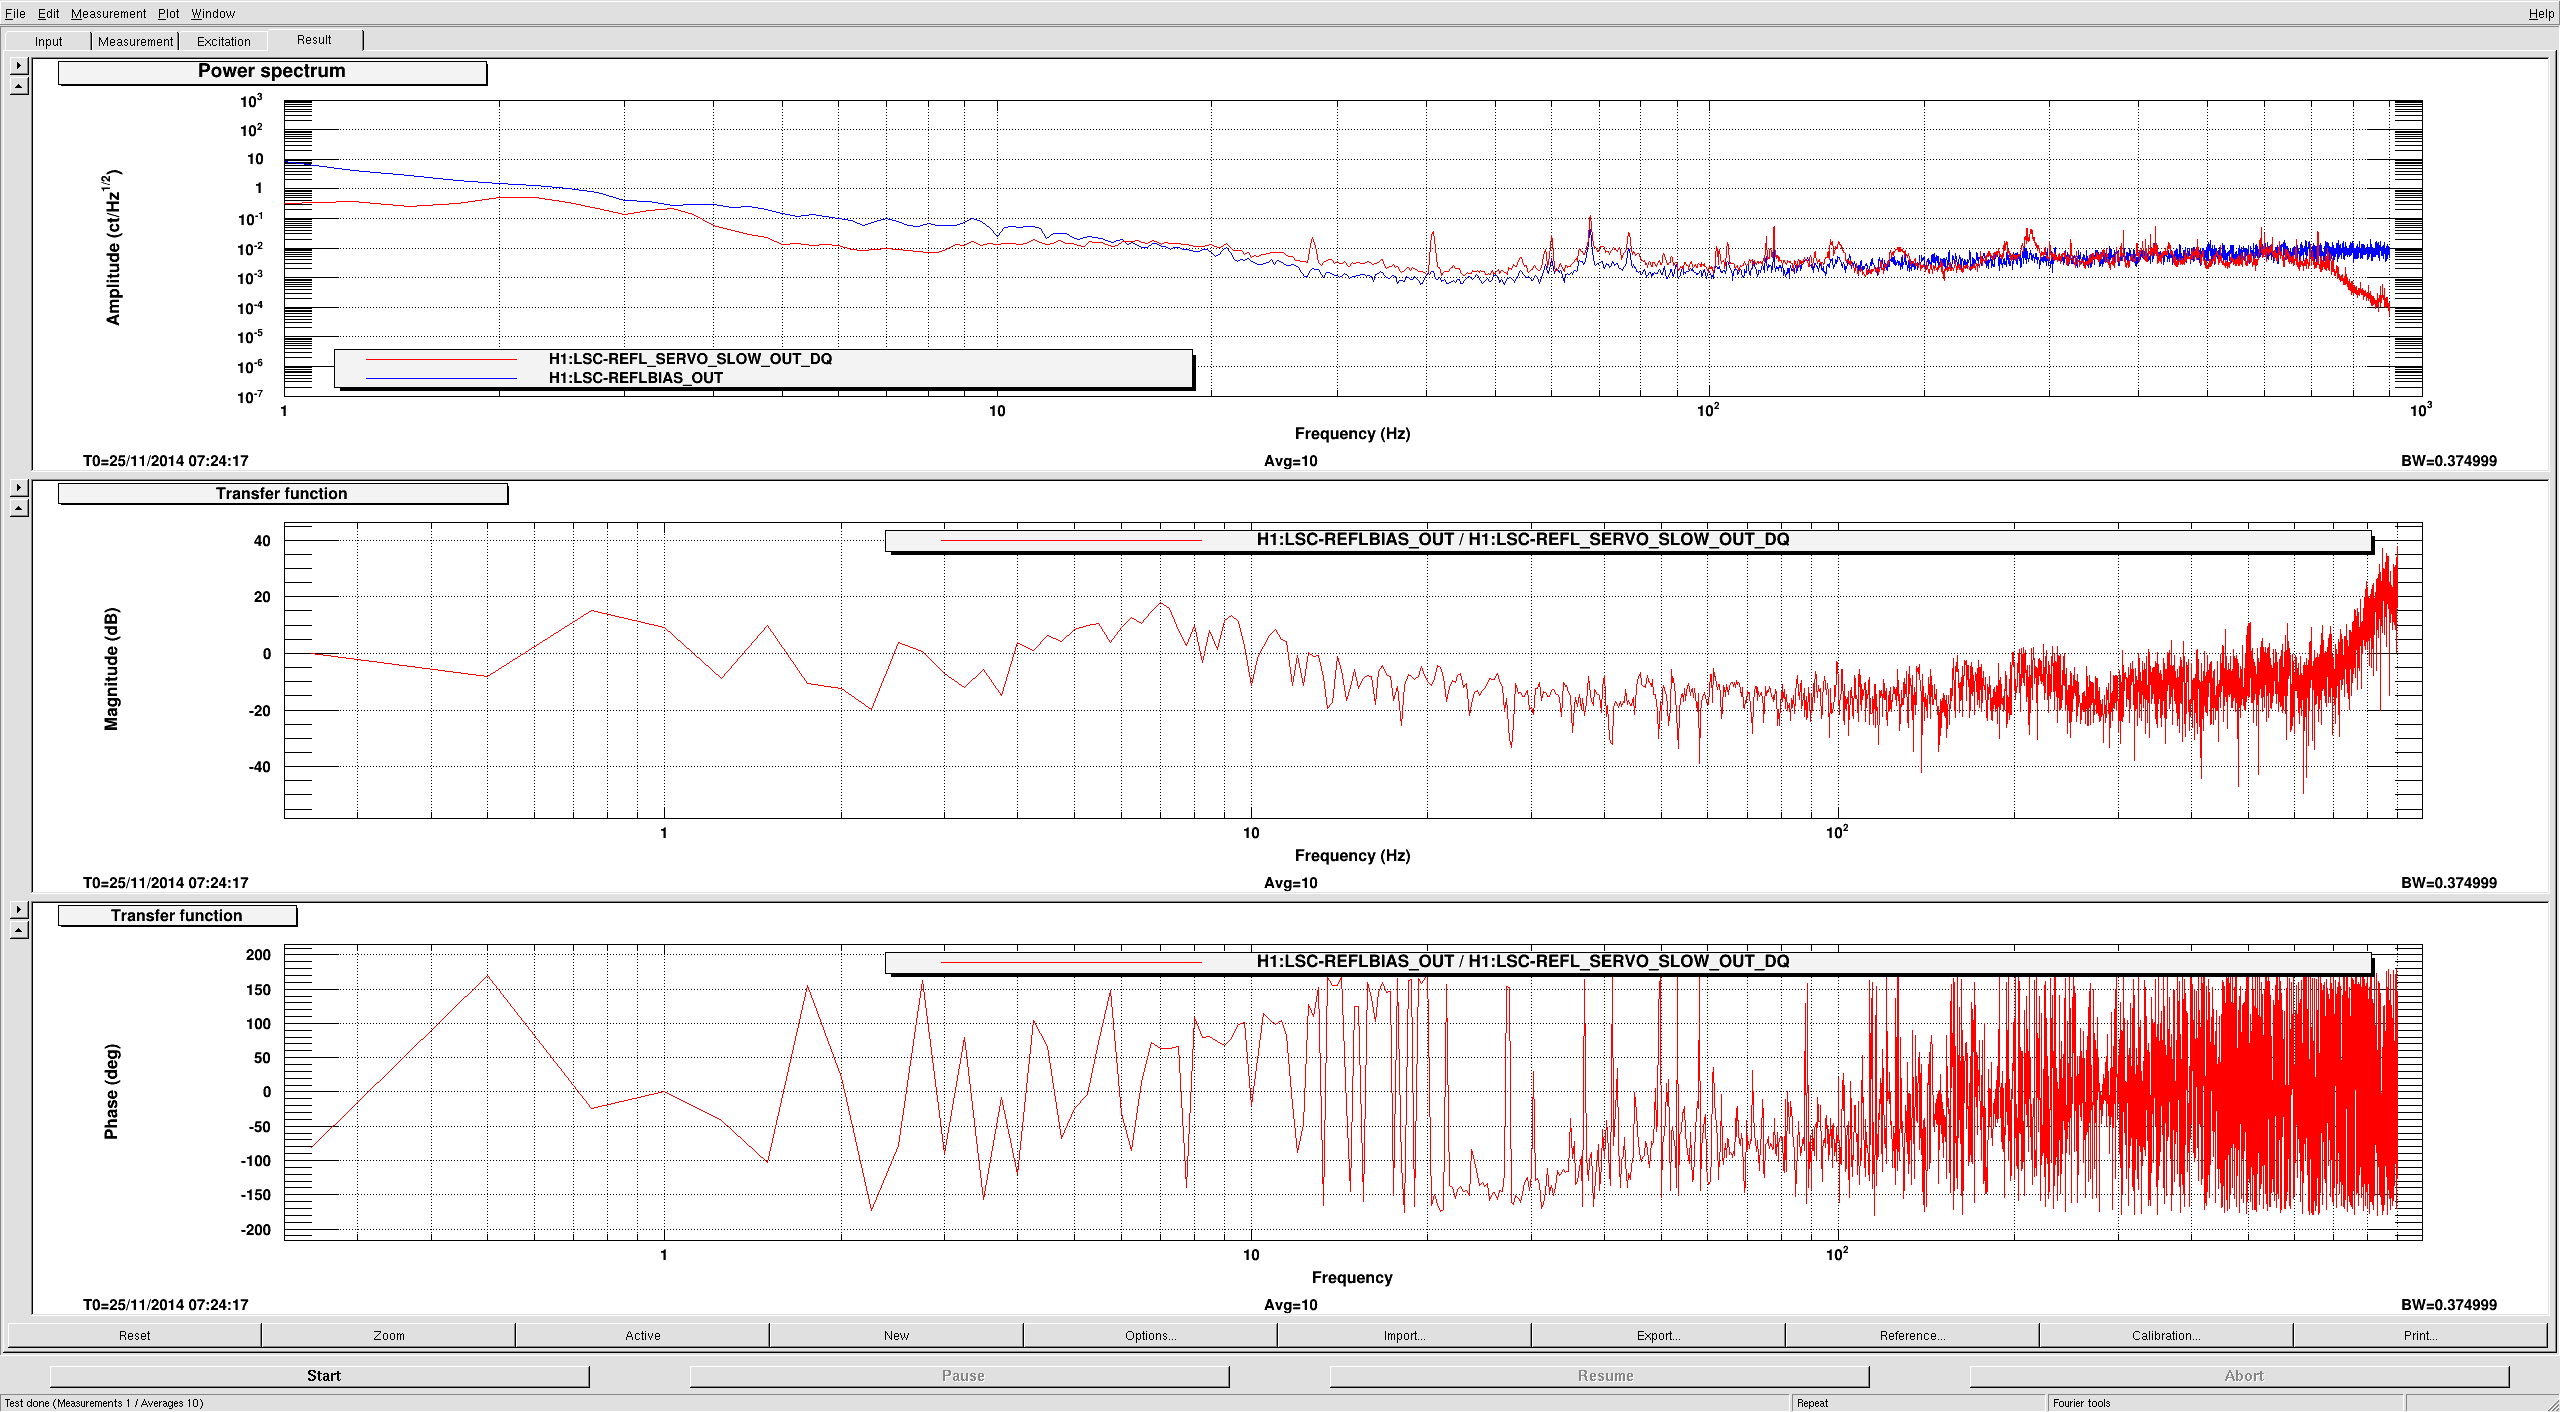
Plots attached are MICH, PRCL, SRCL loops before we reduced the gain to get some phase back in MICH and PRCL.


Two IR HR removed
There were two IR HR mirrors on the table that were not necessary any more, so I removed them and brought them back to the SQZ area cabinet.
Bug on the ISCTEX
Look what we've found there. I think the moth was attracted by the laser or maybe an LED inside, managed to crawl in from an opening under the white tape that covers a hole on the feedthrough panel, but couldn't find his/her way out and died.
I also found the same kind of moth in a bag of clean wipes. The entire bag went into the trash bin.