J. Kissel
I've measured new transfer functions necessary redesign of the H1SUSETMY UIM (L1) DRIVEALIGN frequency-dependent decoupling filters for L2P and L2Y. For the impatient, the last page of the last attachement shows a comparison between the proposed new design and the old, currently installed / in-use design. I have *not* installed this filter because I'd like to discuss the results with commissioners tomorrow morning (and it'll take me some time to resurrect quack to get these installed). In fact, this may argue for us to indeed just copy over ETMX's filter.
Details:
-----------------------------------------
I attach the measurement results (see 2014-11-13_H1SUSETMY_L1_drivealignfilters_rawdata.pdf), but the raw templates can be found here:
/ligo/svncommon/SusSVN/sus/trunk/QUAD/H1/ETMY/SAGL1/Results/Data/
2014-11-13_H1SUSETMY_L1_L2PY_WhiteNoise_ReactionChainTest.xml
2014-11-13_H1SUSETMY_L1_L2PY_WhiteNoise.xml
2014-11-13_H1SUSETMY_L1_P2PY_WhiteNoise.xml
2014-11-13_H1SUSETMY_L1_Y2PY_WhiteNoise.xml
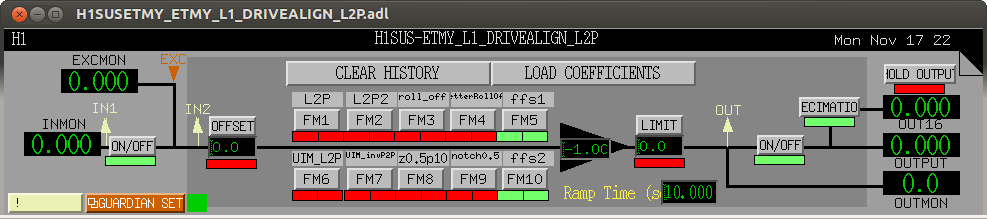
Not that I drove through the TEST filter banks (instead of having to turn off all the existing filters in the LOCK and DRIVEALIGN banks), and made sure that optical lever damping was OFF, and local damping was the LLO design as described in LHO aLOG 14959.
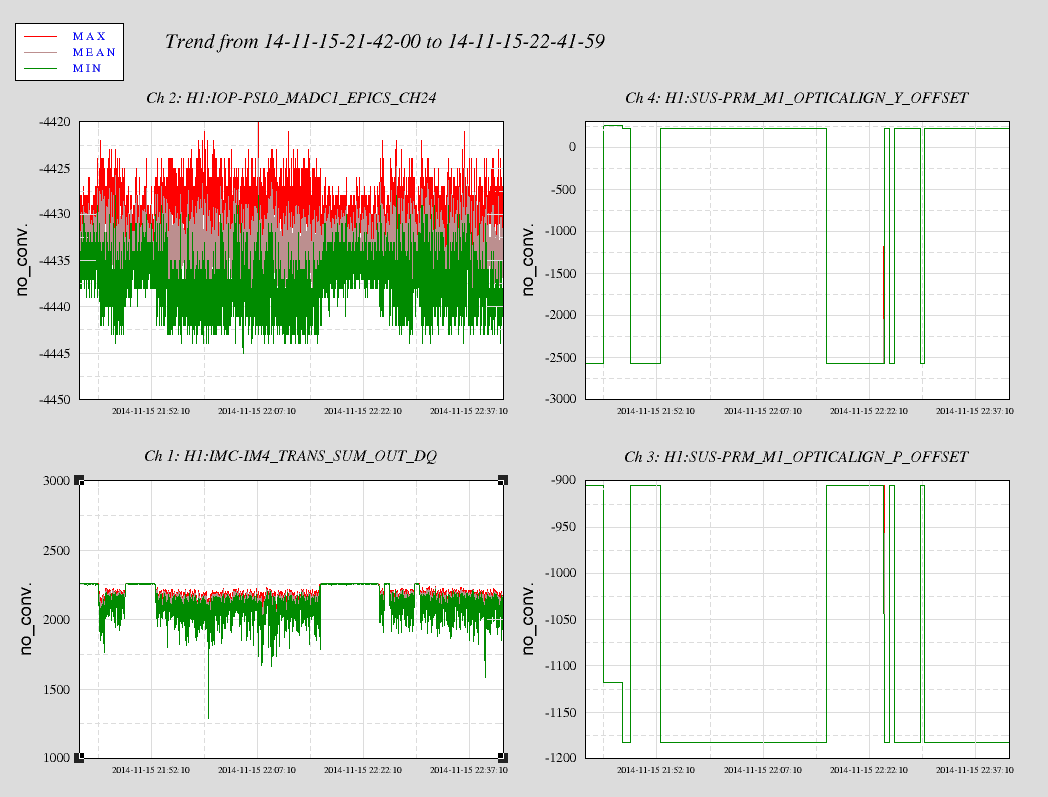
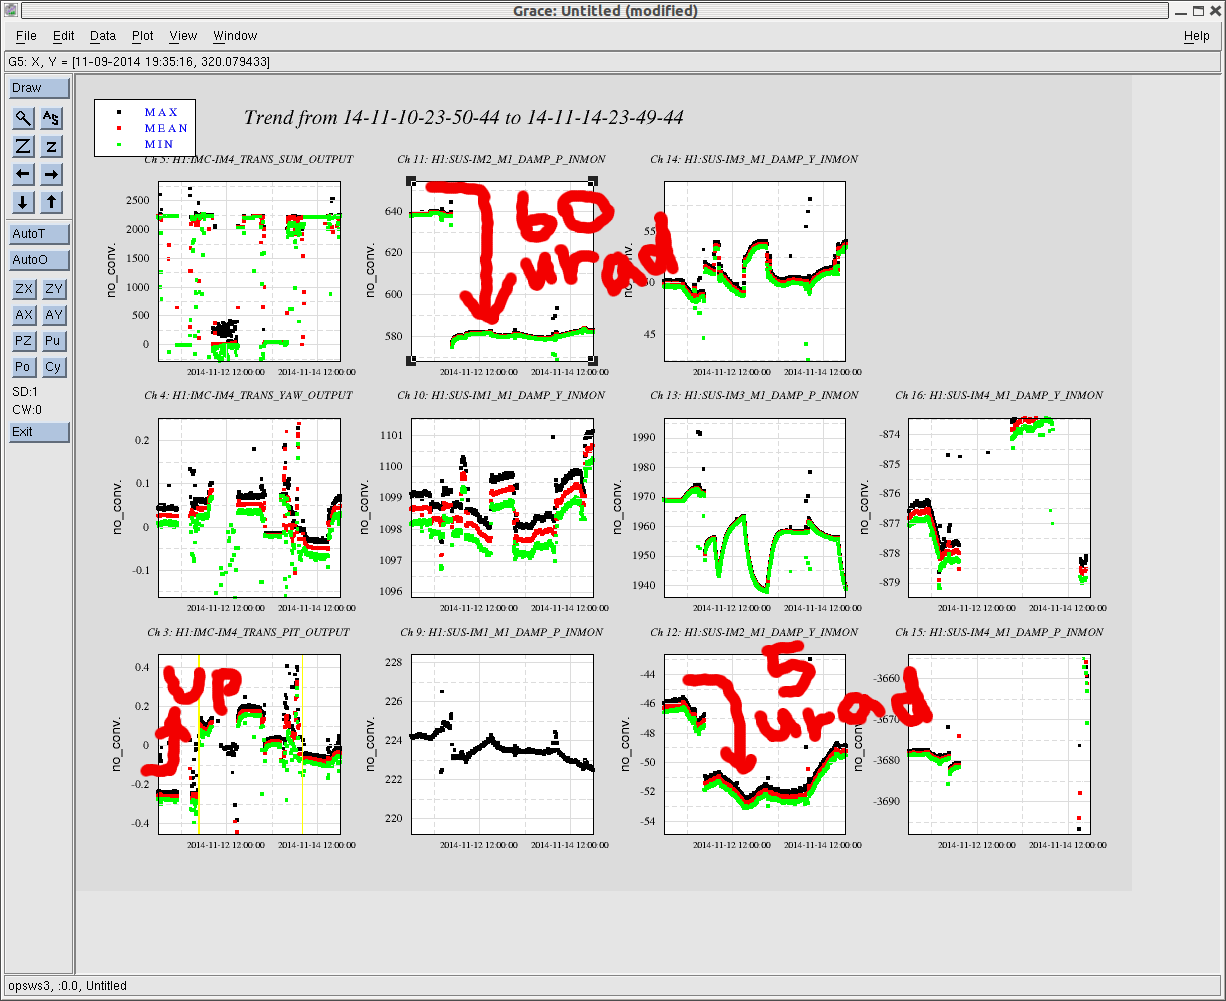
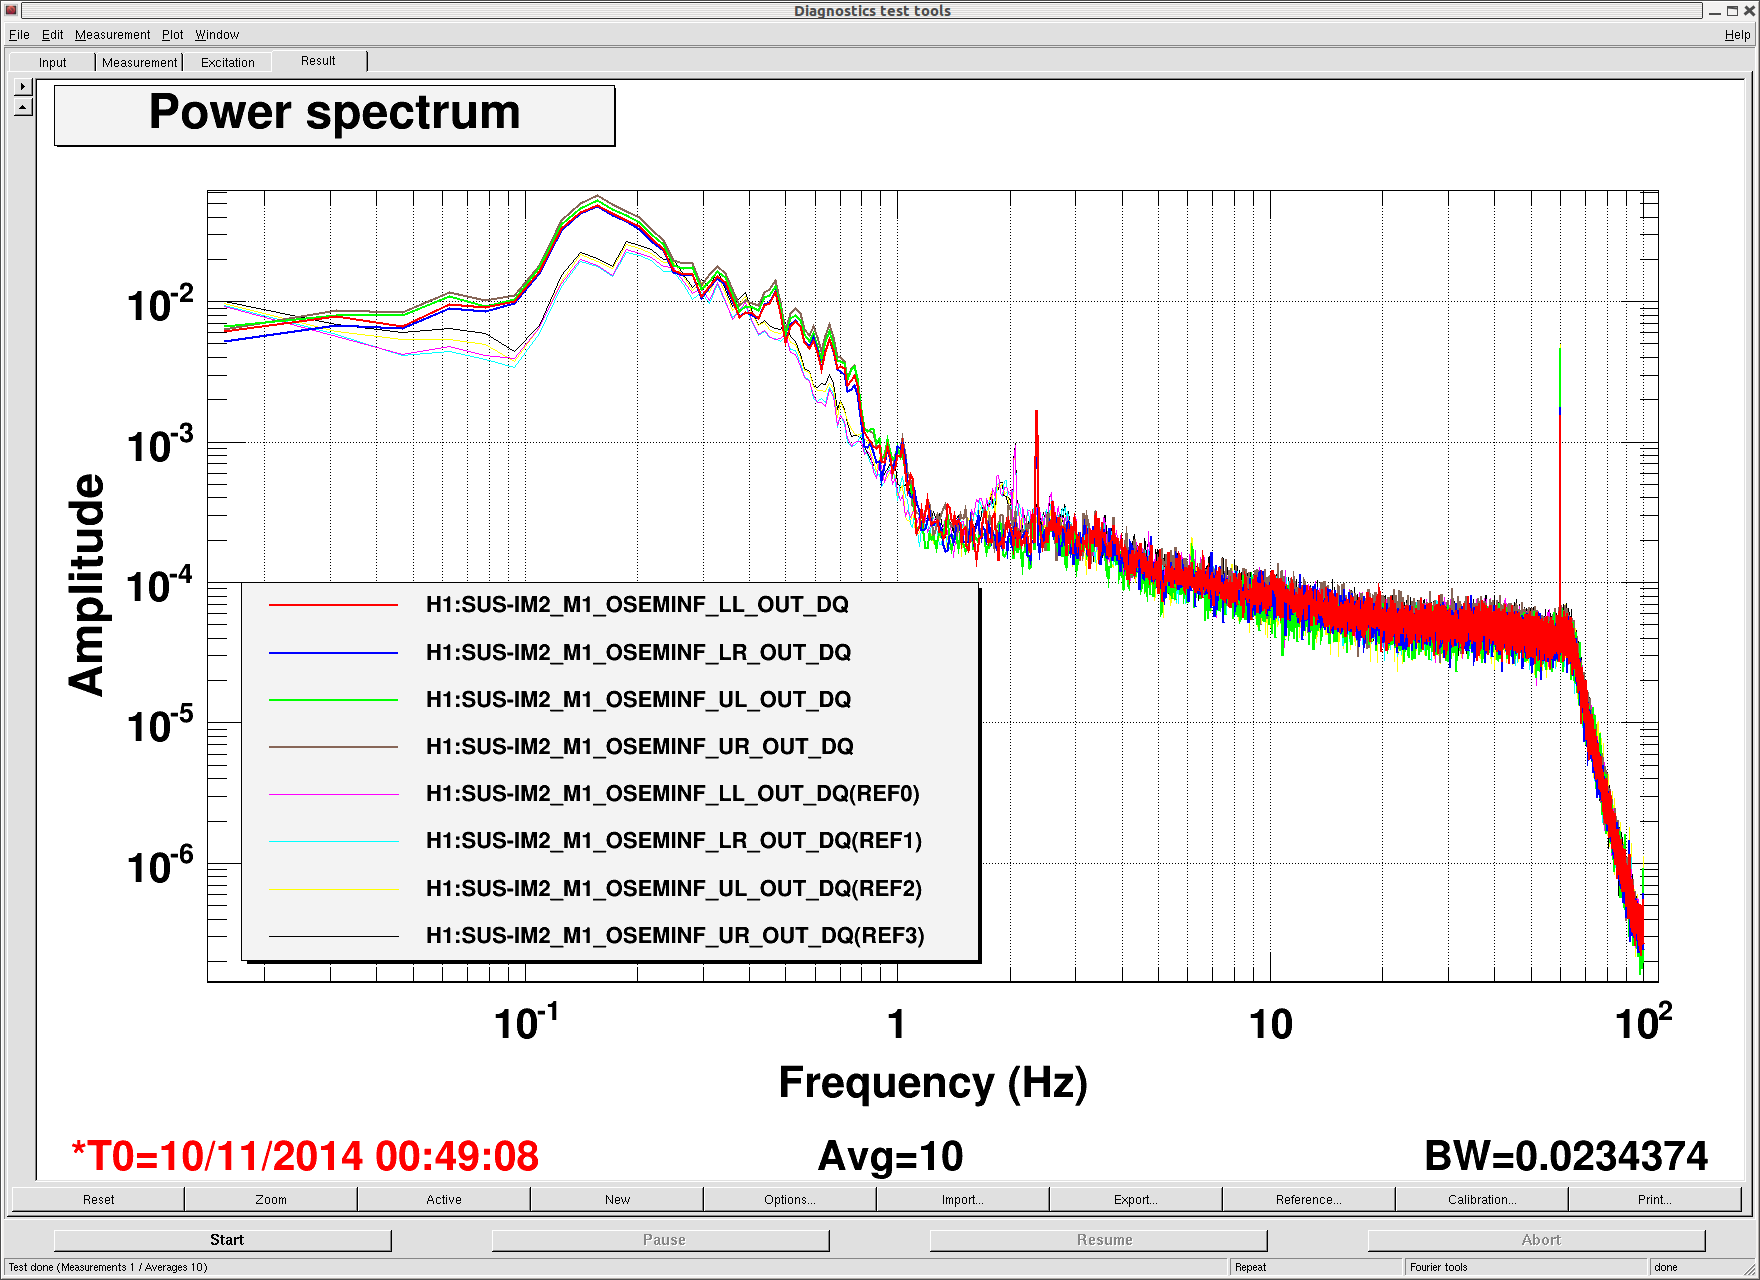
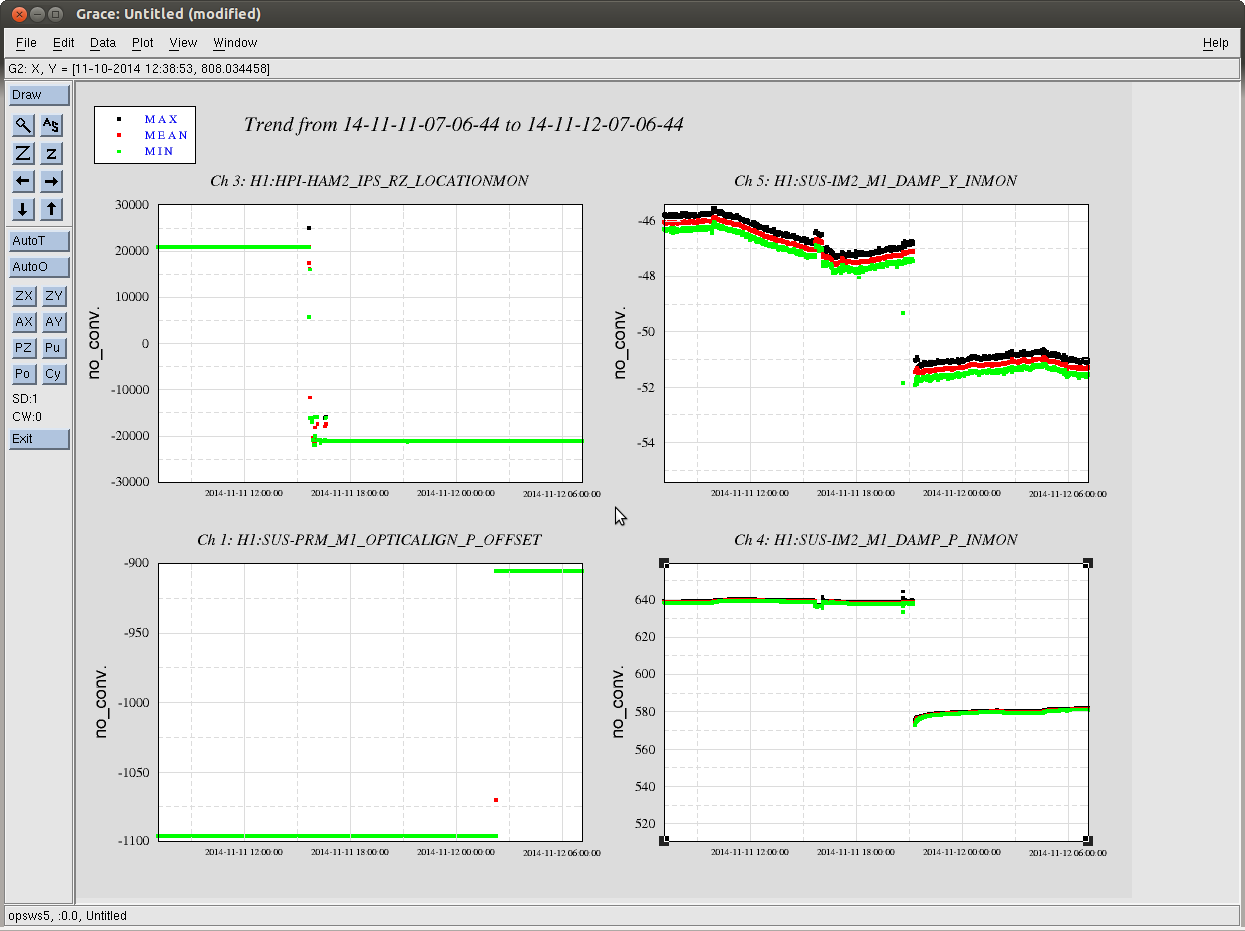
I focus this entry solely on L2P, but the data exists for an L2Y filter if ever needed. in the first four pages, Pink curves are the current measurement, and black curves are what were used in the original design of the previous filter by Arnaud (see LHO aLOG 11832). The encouraging fact is that the data supports exactly what we'd model from the change in damping loop filter design (see green traces on pg 5 of first attachement to LHO aLOG 14959). As an aside -- just because Betsy made me think of it while chasing down slider values -- what effect does reaction chain alignment have on these off-diagonal, lower-stage transfer functions? One might guess that if the L2P cross-coupling isn't something fundamental but a result of dirt alignment affects between the coils on the reaction chain and the magnets on the main, then one would see a change in the L2P transfer function with different alignments of the reaction chain. The good news is that is doesn't have any effect -- see the last page of 2014-11-13_H1SUSETMY_L1_drivealignfilters_rawdata.pdf. I compare the same transfer function for 4 different reaction chain alignments. They still have the old dead-reckoned calibration factors installed, so we know they're not exactly [urads] but close enough for the scale of these offsets used; they use up about 1/2 the DAC range.
As far as the design goes, I used the same transfer function fitting routine and filter generation software suite that (I think) Arnaud used, namely the function
/ligo/svncommon/SusSVN/sus/trunk/QUAD/Common/FilterDesign/Scripts/Length2Angle_decoupling.m
which is essentially a wrapper around the function,
/ligo/svncommon/SusSVN/sus/trunk/Common/MatlabTools/happyVectfit.m
which Keita's wrapper around the function,
/ligo/svncommon/SusSVN/sus/trunk/Common/MatlabTools/vectfit3.m
All tweaking of input parameters to the fitting routine, and plots were made using the overarching script
/ligo/svncommon/SusSVN/sus/trunk/QUAD/H1/ETMY/SAGL1/design_H1SUSETMY_L1_L2P_20141113.m
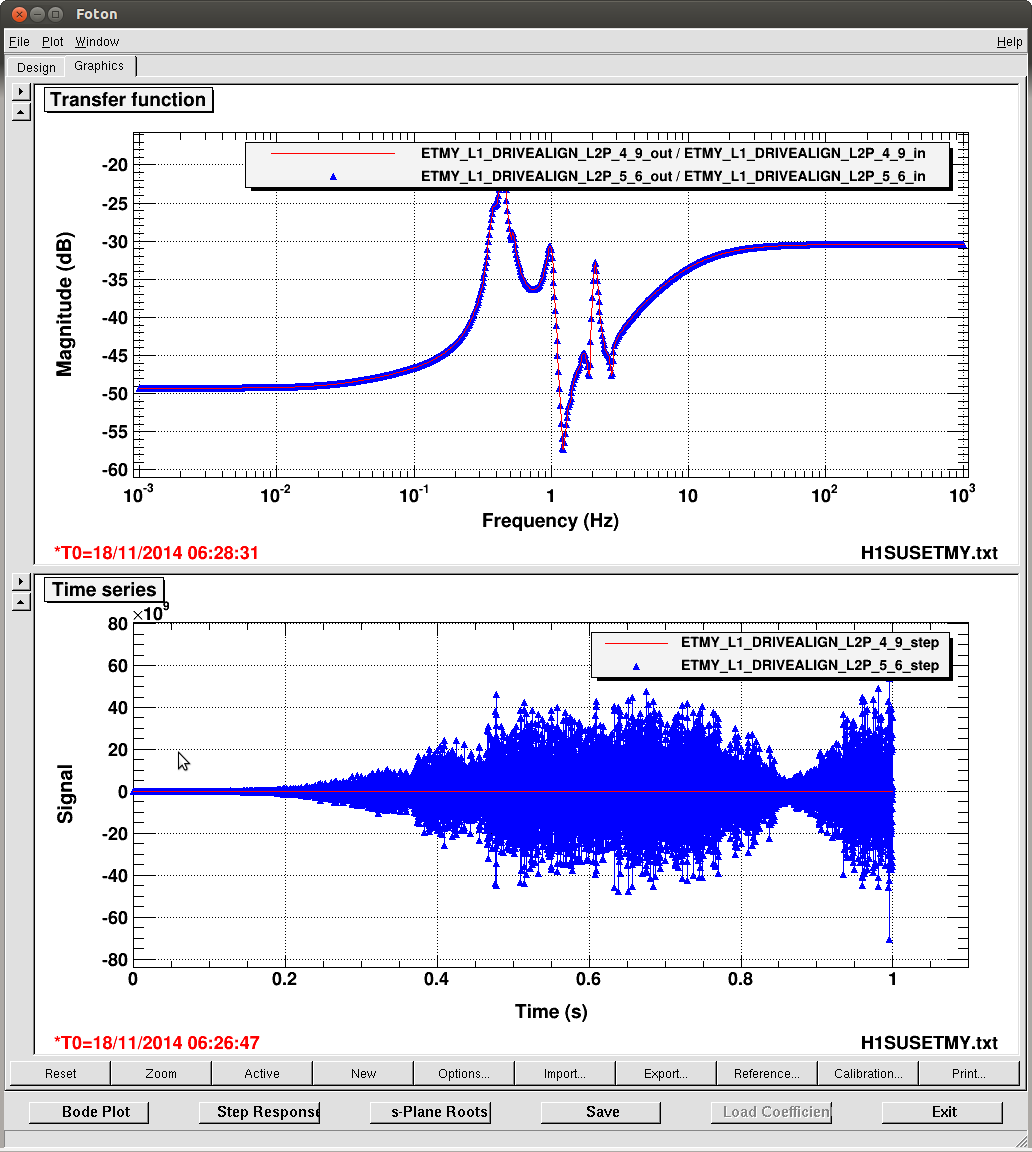
Notable key additions to the design software -- a computation of the final filter's impulse response, as well as a comparison to the previous design.
As I know Arnaud had struggled, I struggled to find a fit with which I was really happy, namely because we all *know* that the L2P transfer function should fall off as some large power of frequency (again, see the models of these TFs on pg 5 of LHO aLOG 14959), but I can't find a set of parameters happyVectFit / vectfit3.m that allows for such a roll-off at high frequency. Indeed, the height of the final flat part of the L2P fit transfer function directly determines the high-frequency gain of the decoupling filter, and directly impacts the impulse response time. I settled on a filter that does a poor job at reproducing the > 2 [Hz] behavior of the L2P measurement, BUT I think it's OK because
(a) the small magnitude of the high-frequency causes a significant drop in impulse response time, and
(b) At the UIM, we're typically driving below 2 [Hz] -- especially if the crossover remains at 0.9 [Hz] as quoted in LHO aLOG 15025, so the accuracy of inversion is not so critical. Though I didn't find any design aLOGs, this seems to have been the philosophy behind the ETMX UIM L2P filter because it ends up looking strikingly similar.
I should say also that having to tune the uncertainty tolerance, the order (i.e. number of poles) in the filter, the tolerance for when to throw out adjacent poles and zeros, the frequency range over which to fit -- all free parameters into happyVectFit.m -- as one has to do to get what one wants in the end really destroys the advantage of automating the fitting process. If only there was a better way...