Offsets tuning
Today I set down again to improve the working point of the IMC angular controls, ina way similar to waht I did in the past (see here)
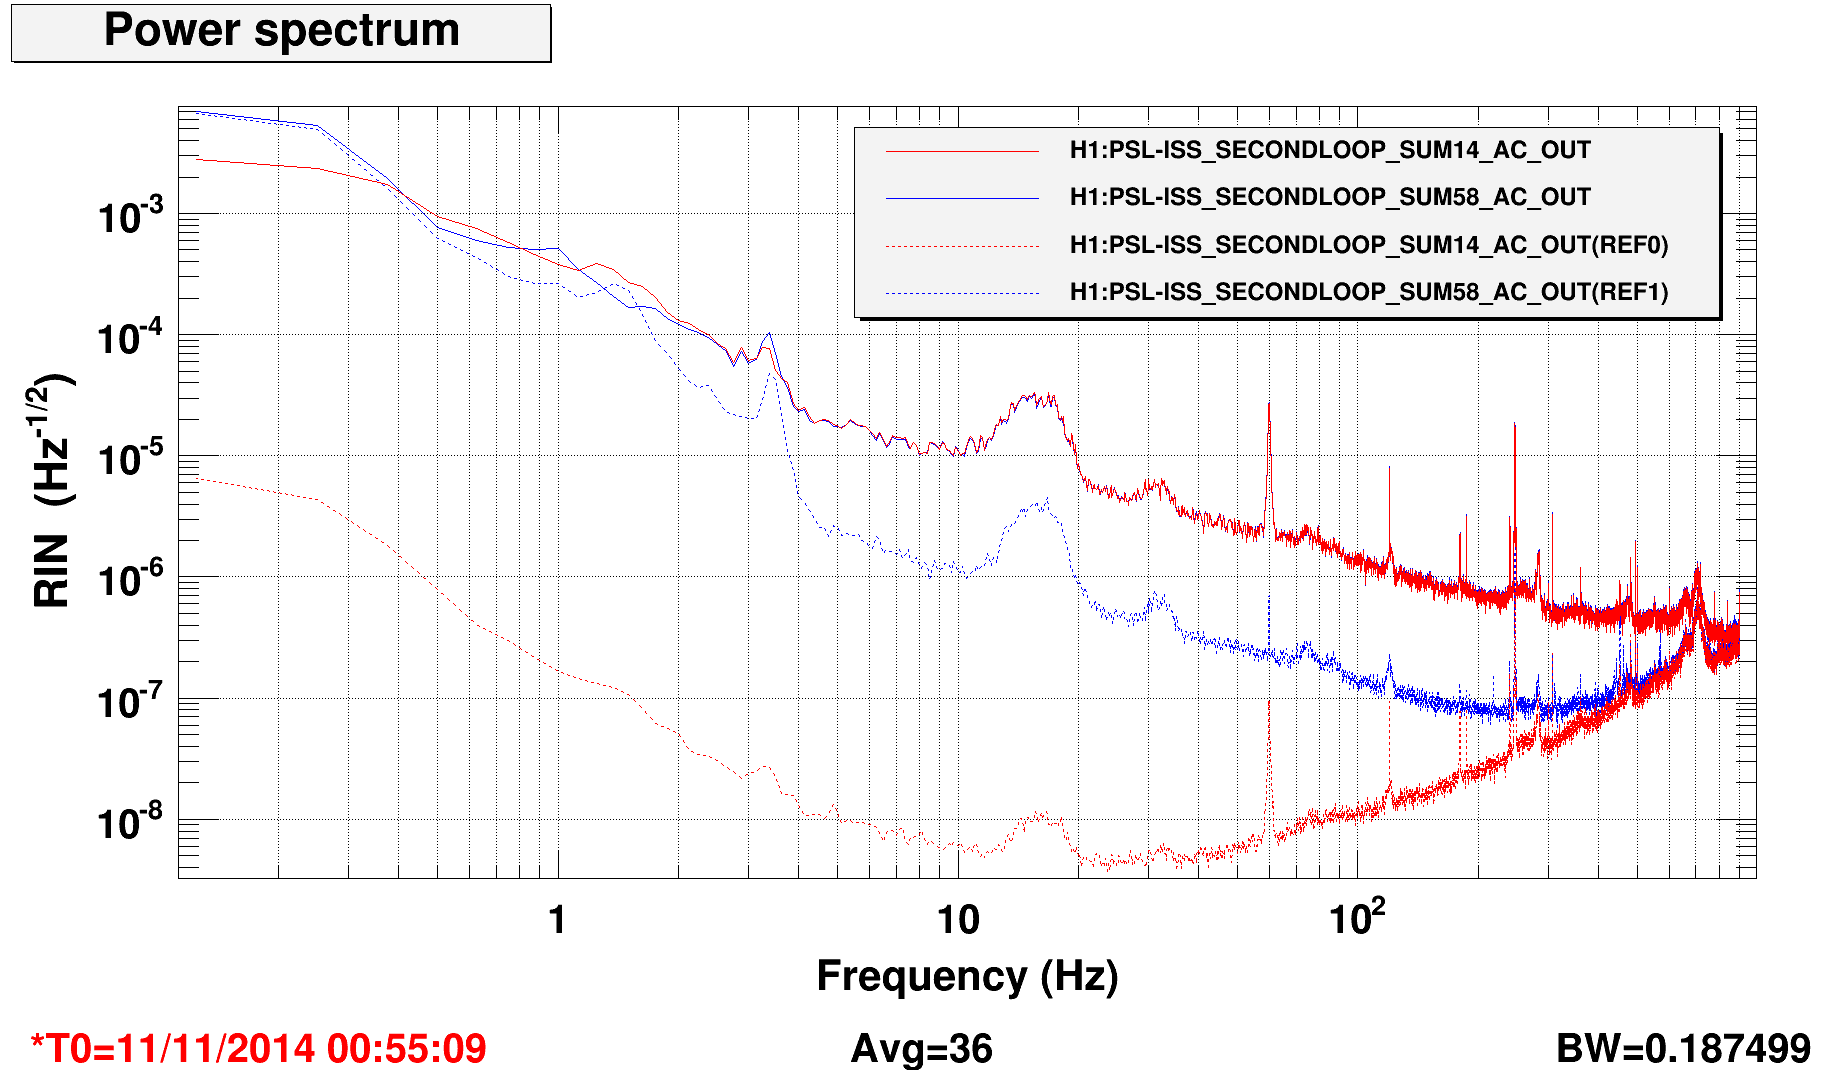
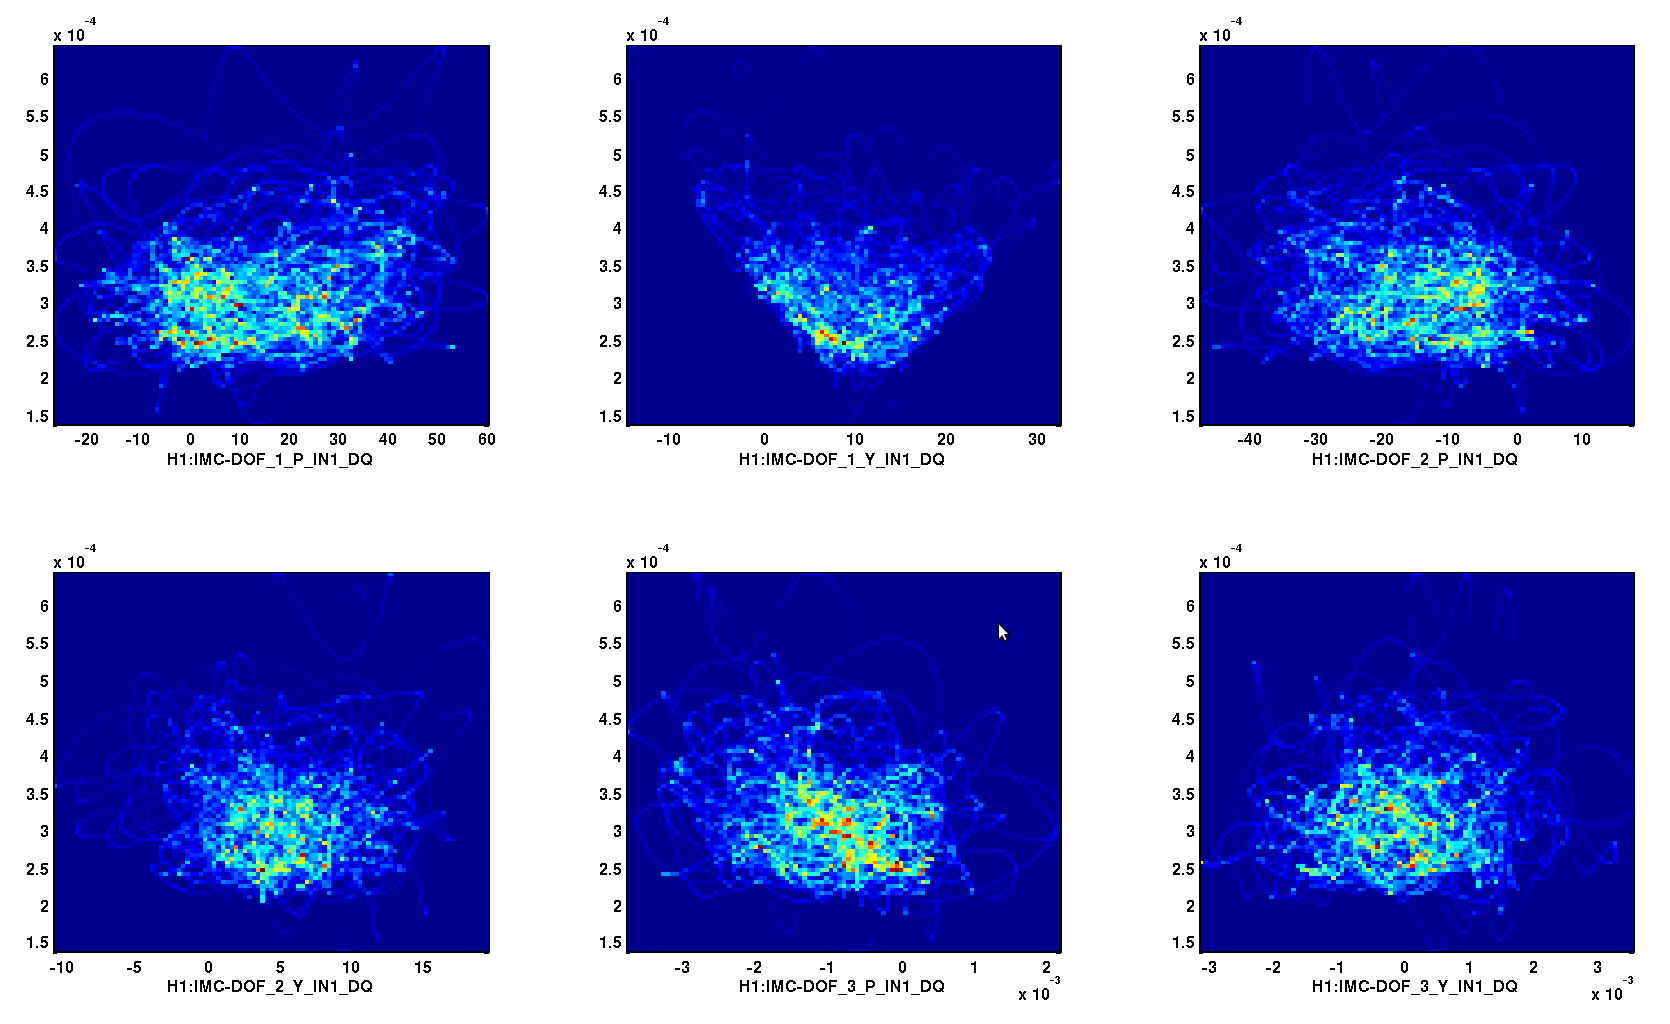
The first step was to histogram the band-limited RMS noise of the ISS second loop photodiodes, to measure the dependency of the RIN on the residual angular motion of the IMC. The first attached plot shows the BLRMS between 200 and 1000 Hz, histogrammed against the six IMC degrees of freedom. It is apparent that there are offsets in almost all signals. The offset is particularly evident in DOF_1_Y. Fo future reference, the period considered is between 10.21 and 10.42 local time.
Using these histograms, I finely tuned the following offsets (which are different from what was running before):
|
|
DOF 1 |
DOF 2 |
DOF 3 |
|
Pitch |
-15 |
15 |
1e-3 |
|
Yaw |
-9 |
-5 |
0 |
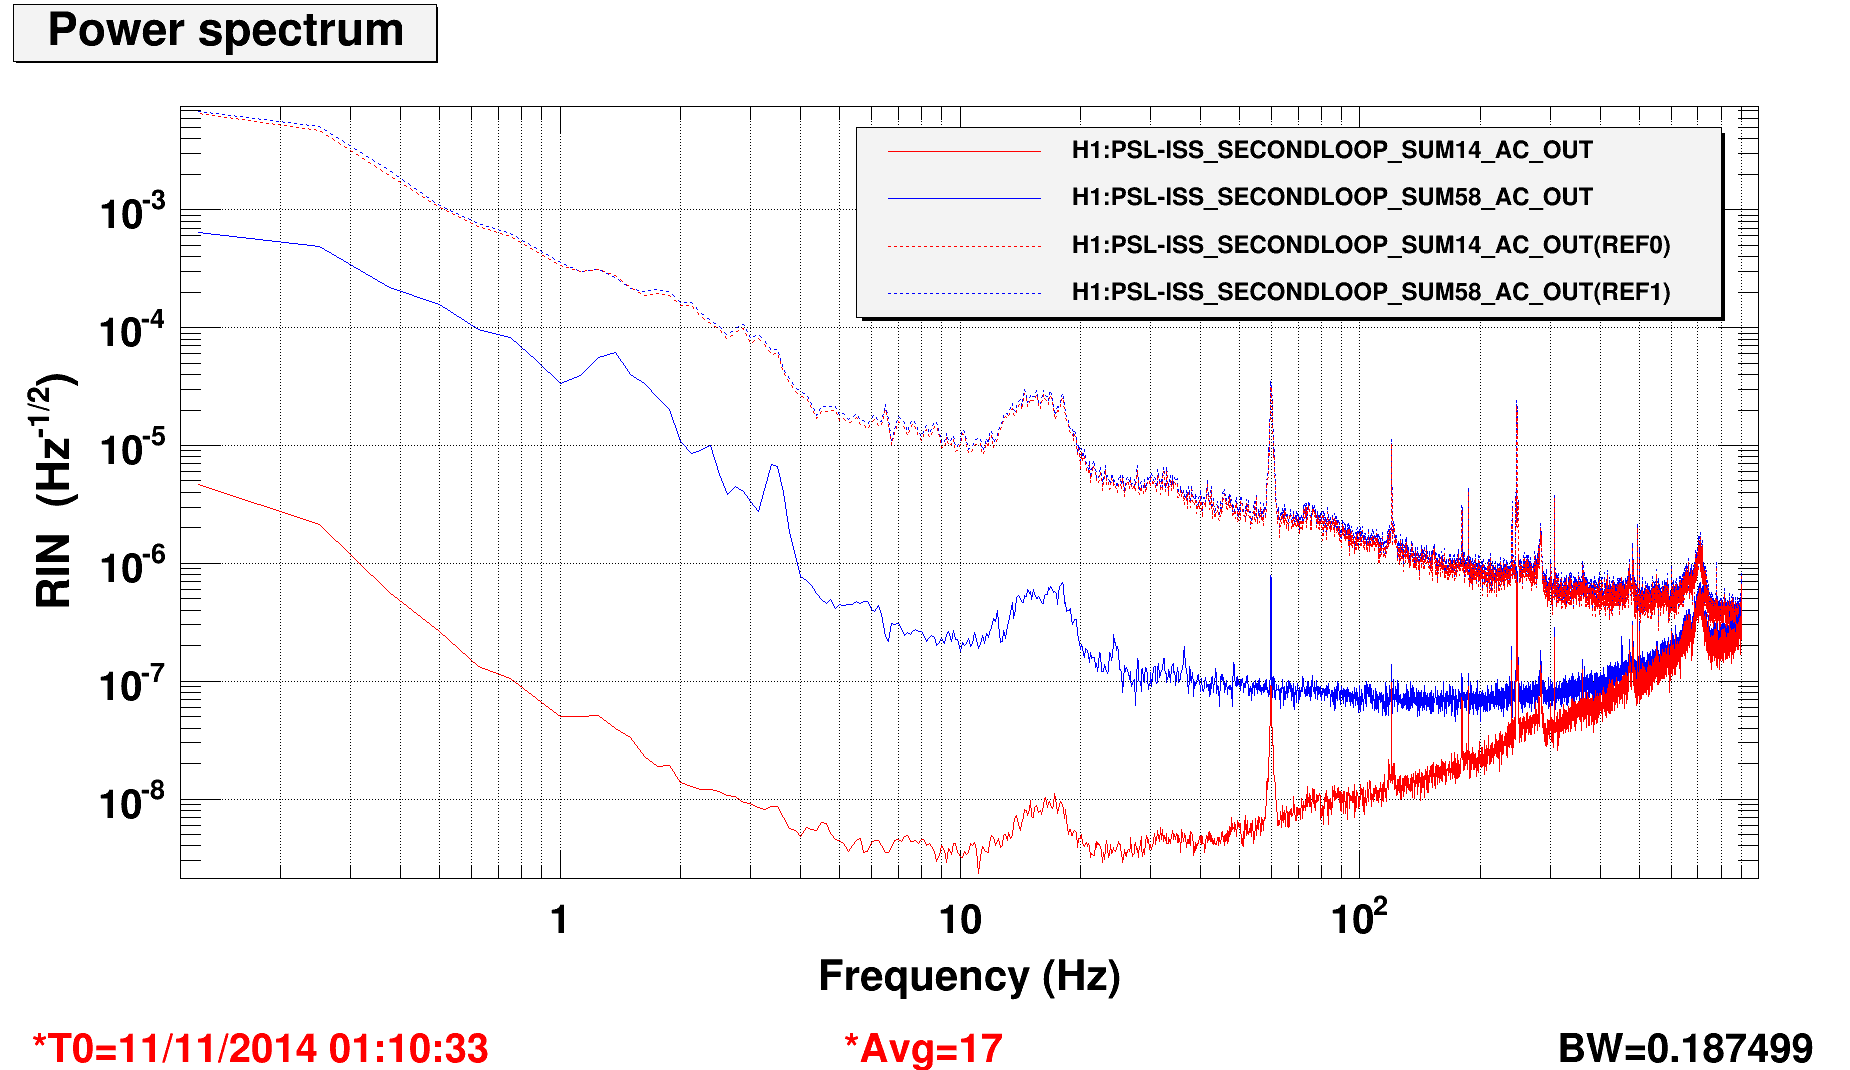
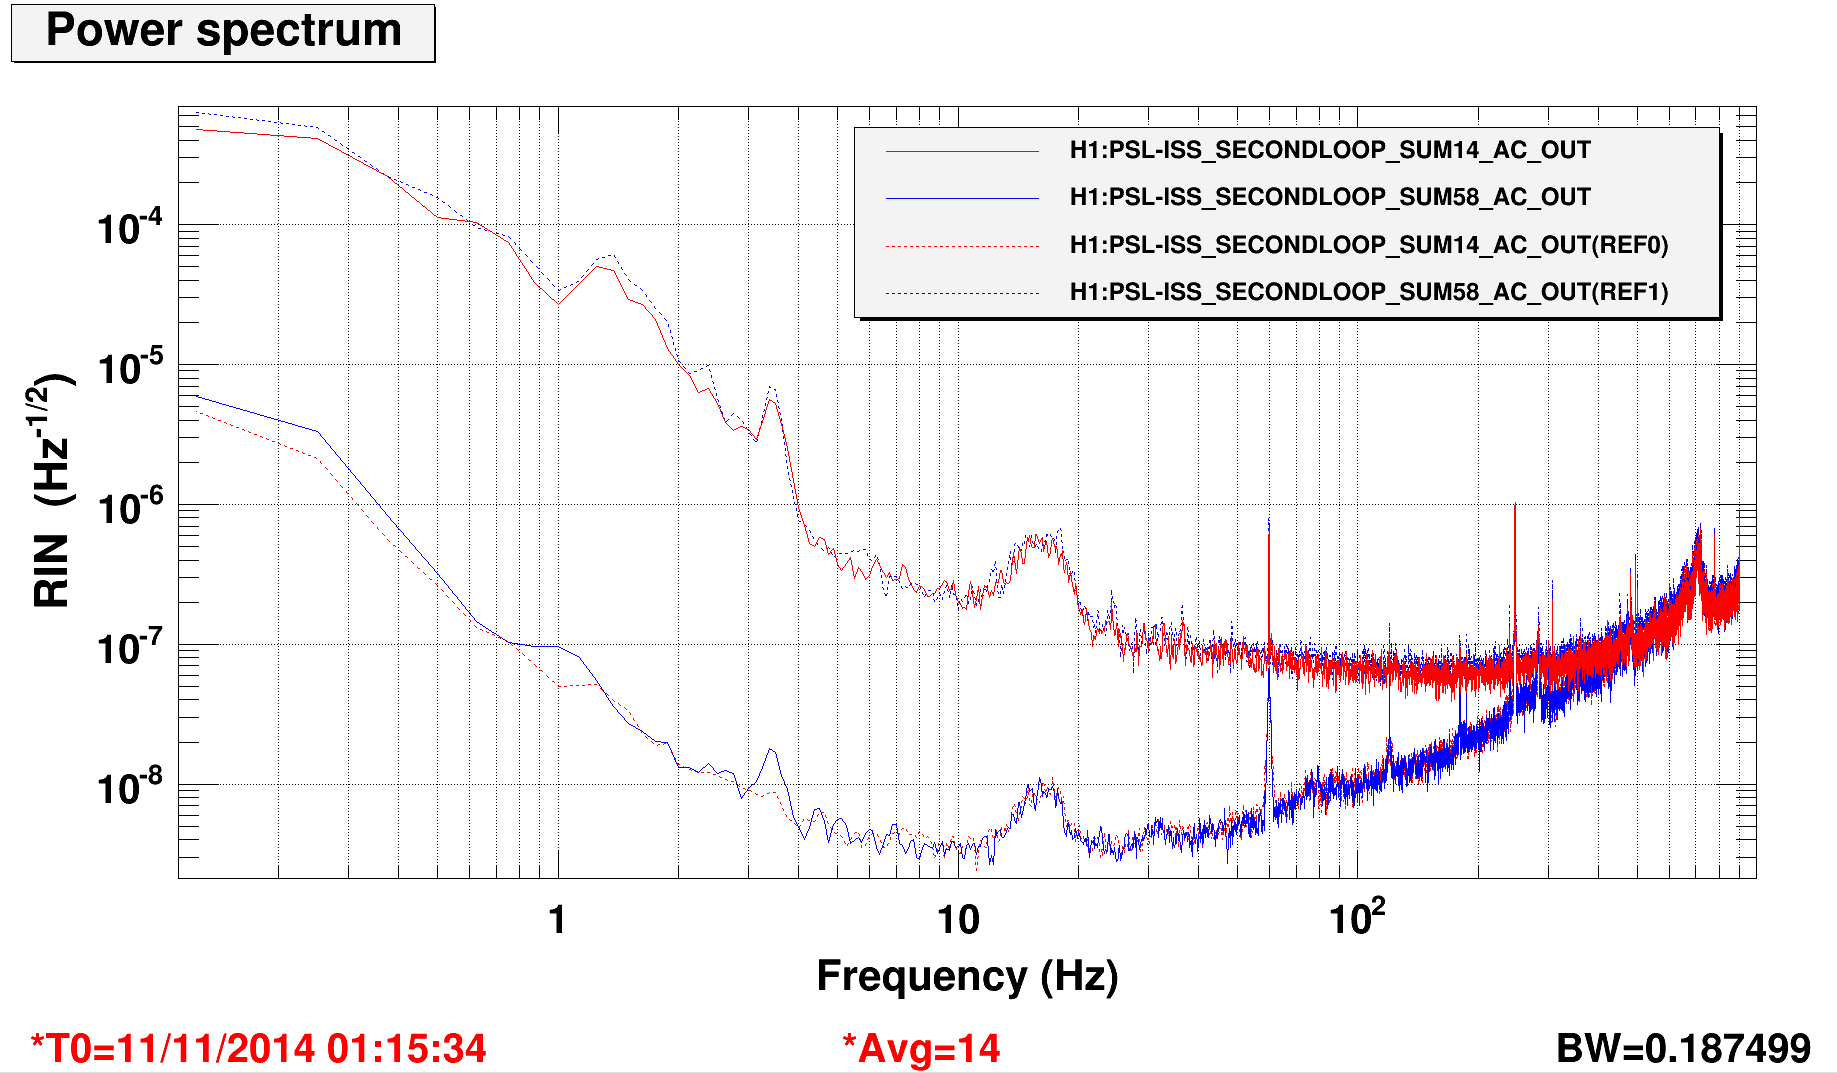
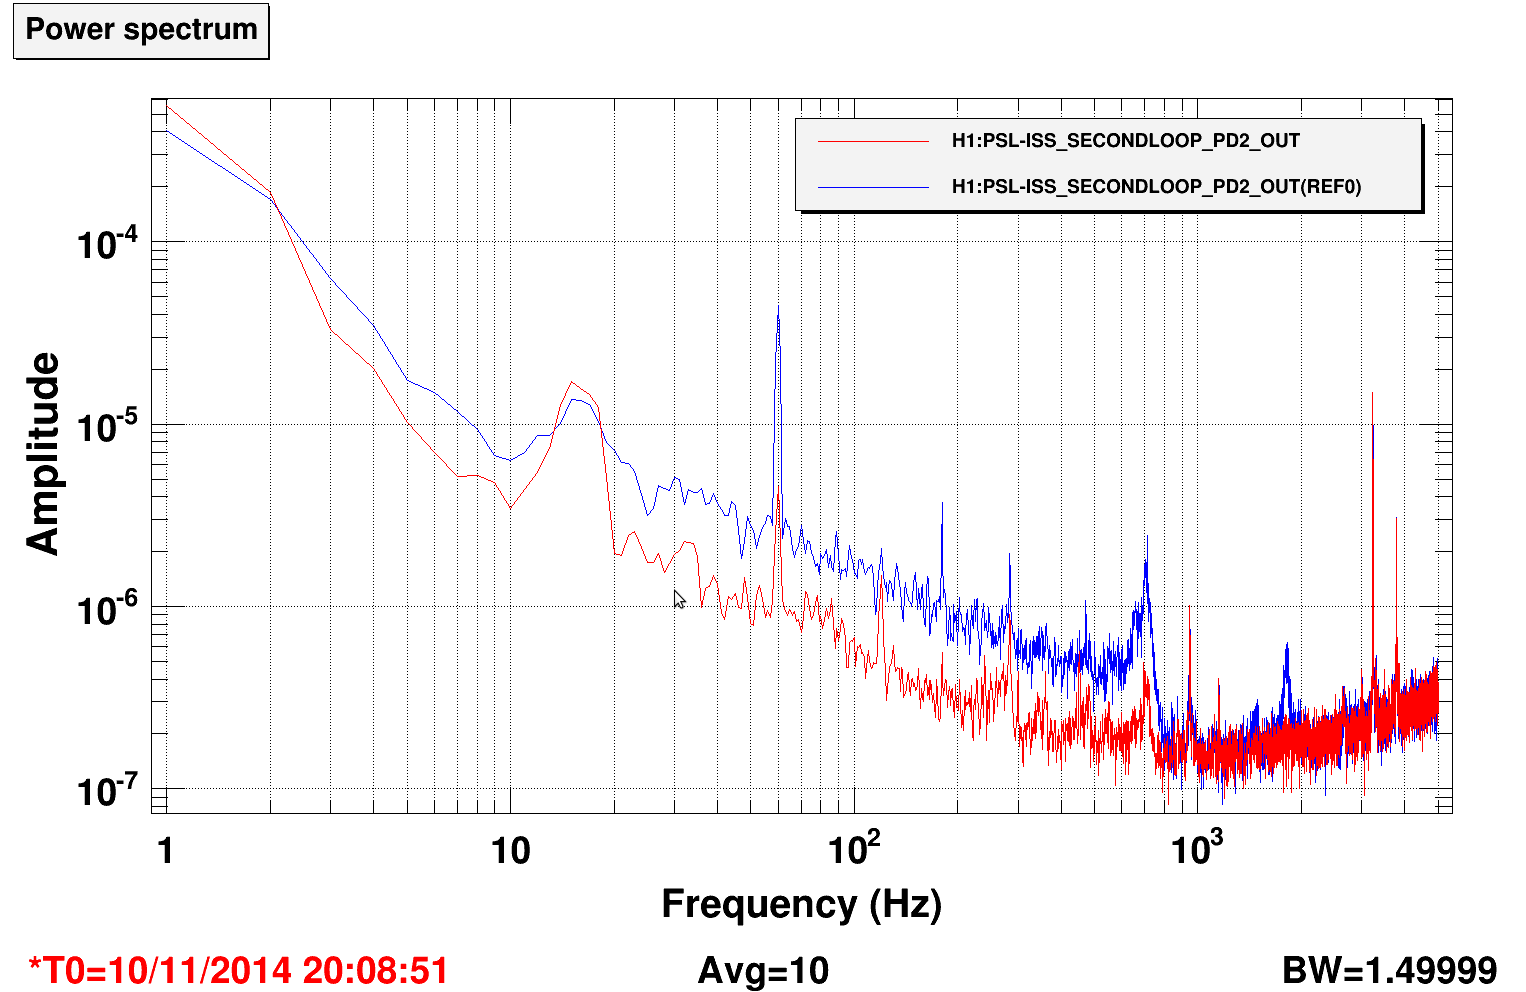
The second attached figure shows the improved histograms after this tuning. The third plot shows the reduction in the noise as seen by the ISS second loop (sorry, the plot is not calibrated in units of RIN). For future reference, the period considered is between 11.10 and 11.29 local time.
The intensity noise is however still clearly non stationary and the fluctuations seem loosely related to the residual motion of the IMC degrees of freedom.
After some other activities, reported below, I had the impression that the alignment was not more optimal (higher noise in the ISS diodes). I checked again the offsets and it turned out that setting DOF_3 to zero did improve the noise. Therefore I suspect that some of the offsets are not very stable over time.
Calibration lines to check drifts
To track more accurately those possible drifts, I added two lines on the PZT: pitch at 155 Hz (amplitude 3) and yaw at 247 Hz (amplitude 3). My goal is to leave these lines on all night and then use them to reconstruct any variation of the jitter to RIN coupling.
PZT noise injections
FInally, I injected some broad band noise in the PZT, to measure the transfer functions to the IMC signals. Here are the times
PZT pitch amplitude 30, elliptic band pass 10-550 Hz: from 12.20 to 12.27 local time
PST yaw amplitude 30, elliptic band pass 10-550 Hz: from 12:28 to 12:34 local time
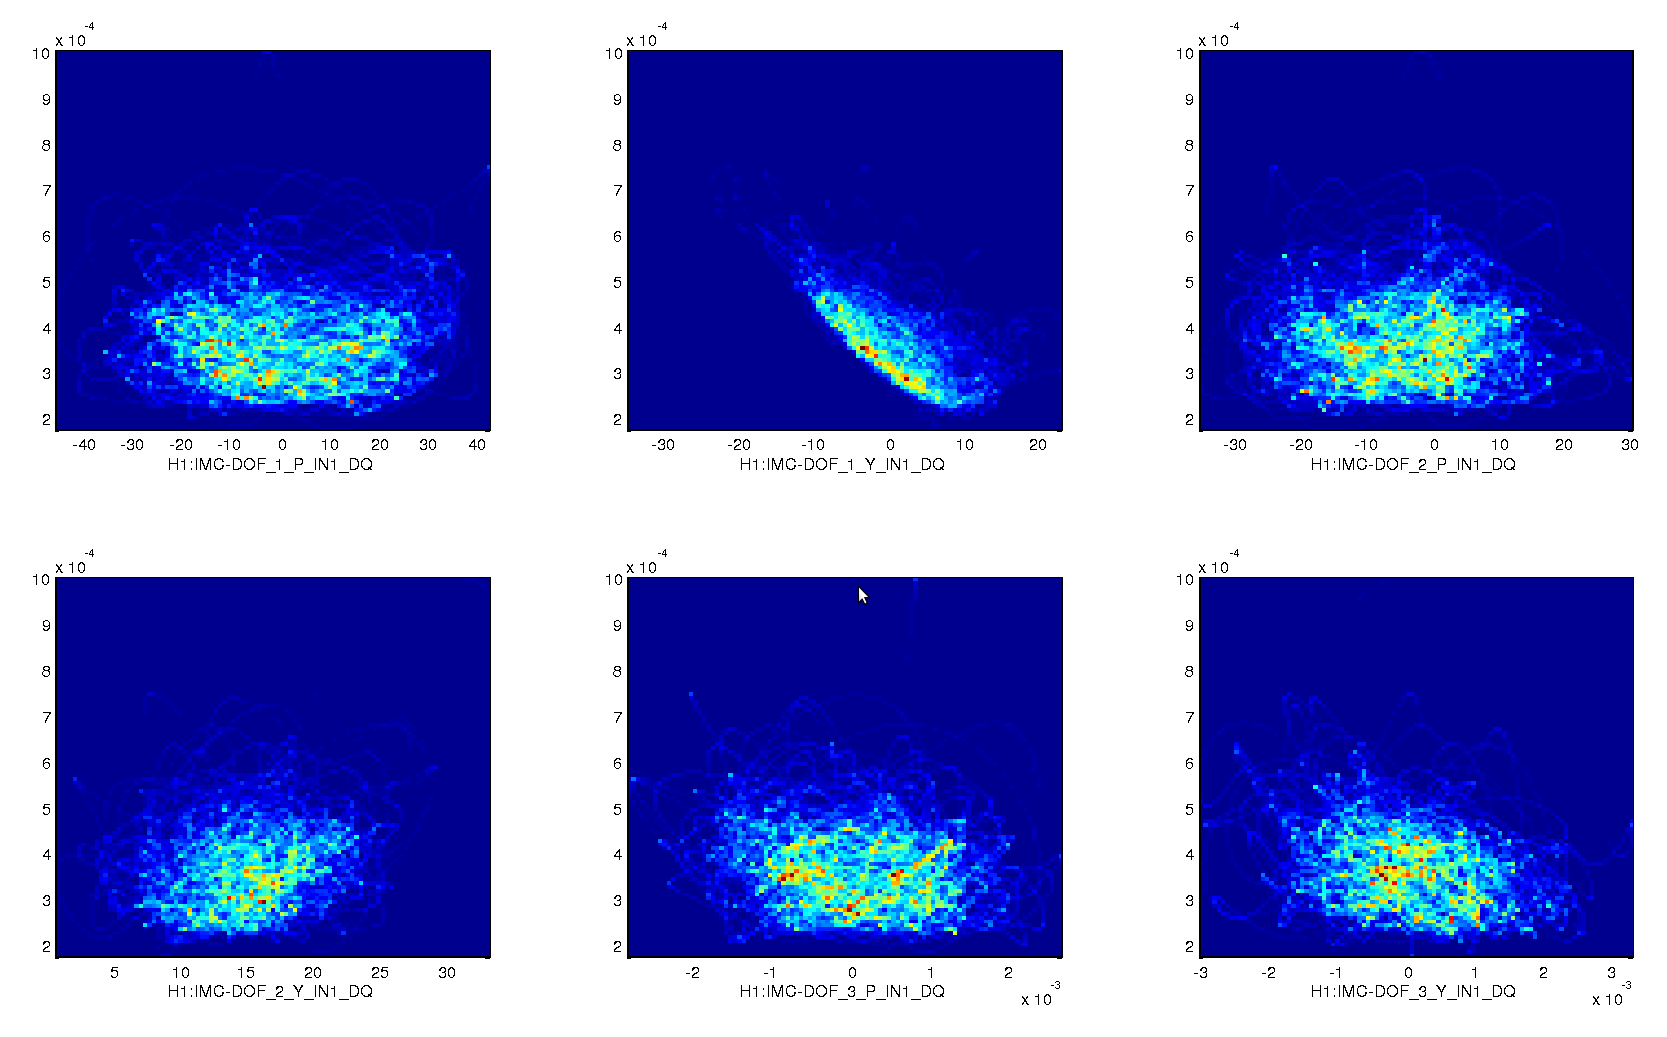
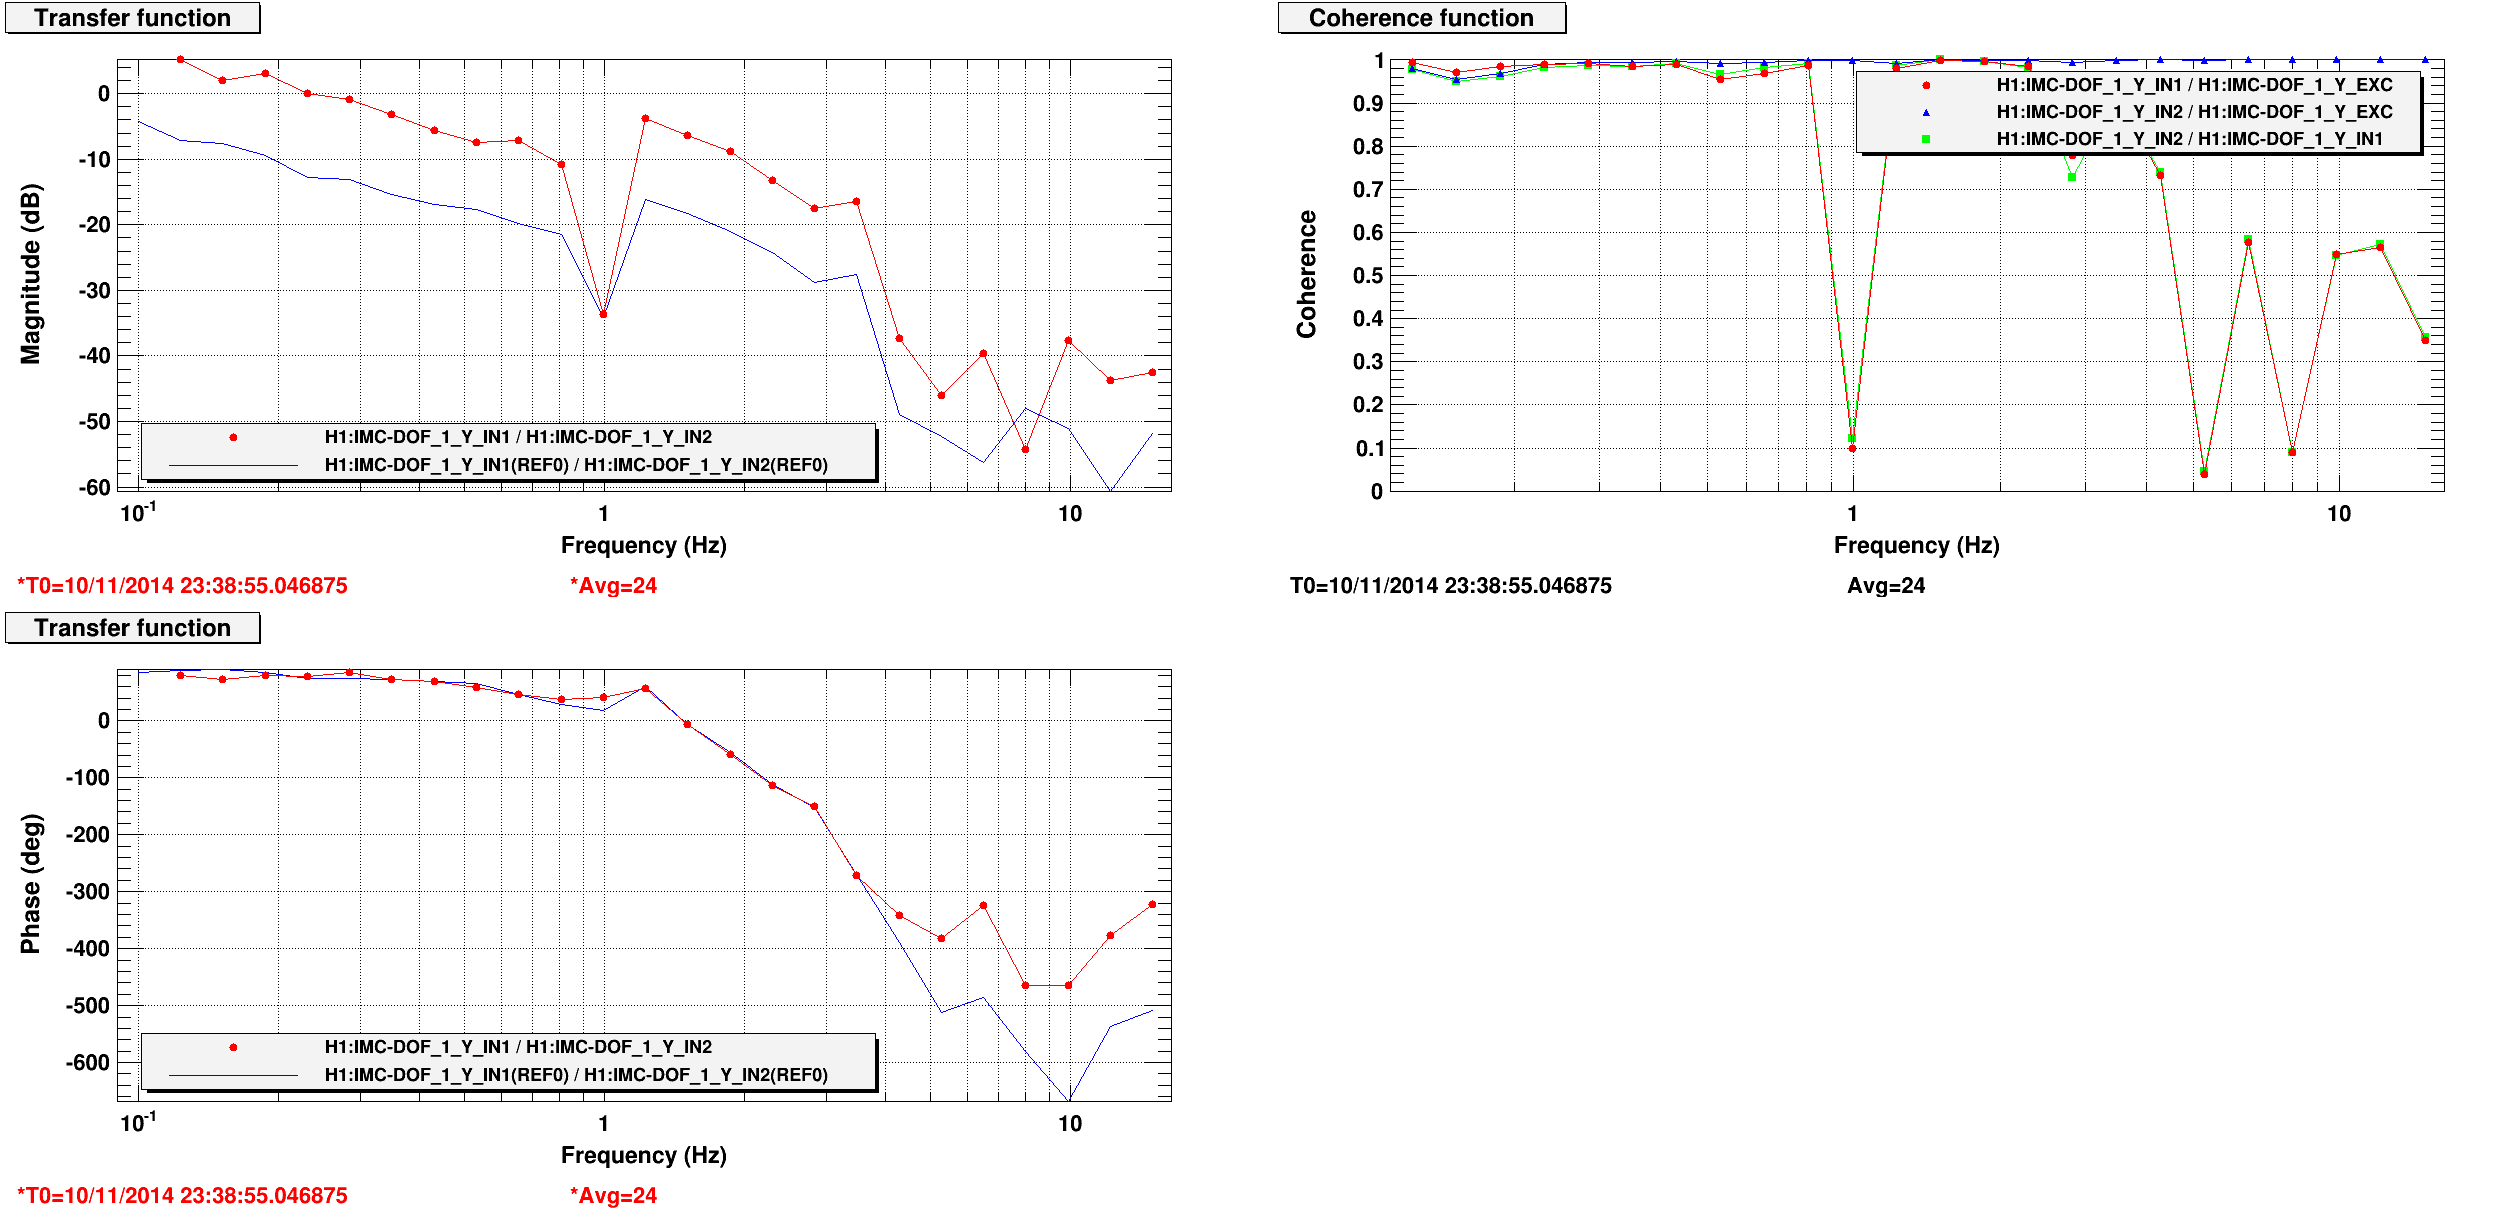
Increasing DOF_1_Y gain
The histograms hinted at the fact that the fluctuations in the RIN were correlated to DOF_1_Y. I measured its open lop gain and the unity gain frequency was about 60 mHz. I increased the gain by a factor 4, thus moving the UGF to a bit more than 200 mHz. See fourth plot. However, this did not produce any significant improvement in the intensity noise. This is consistent with the idea that most of the coupling is due to "fast" motion of the input beam.