(Keita Daniel)
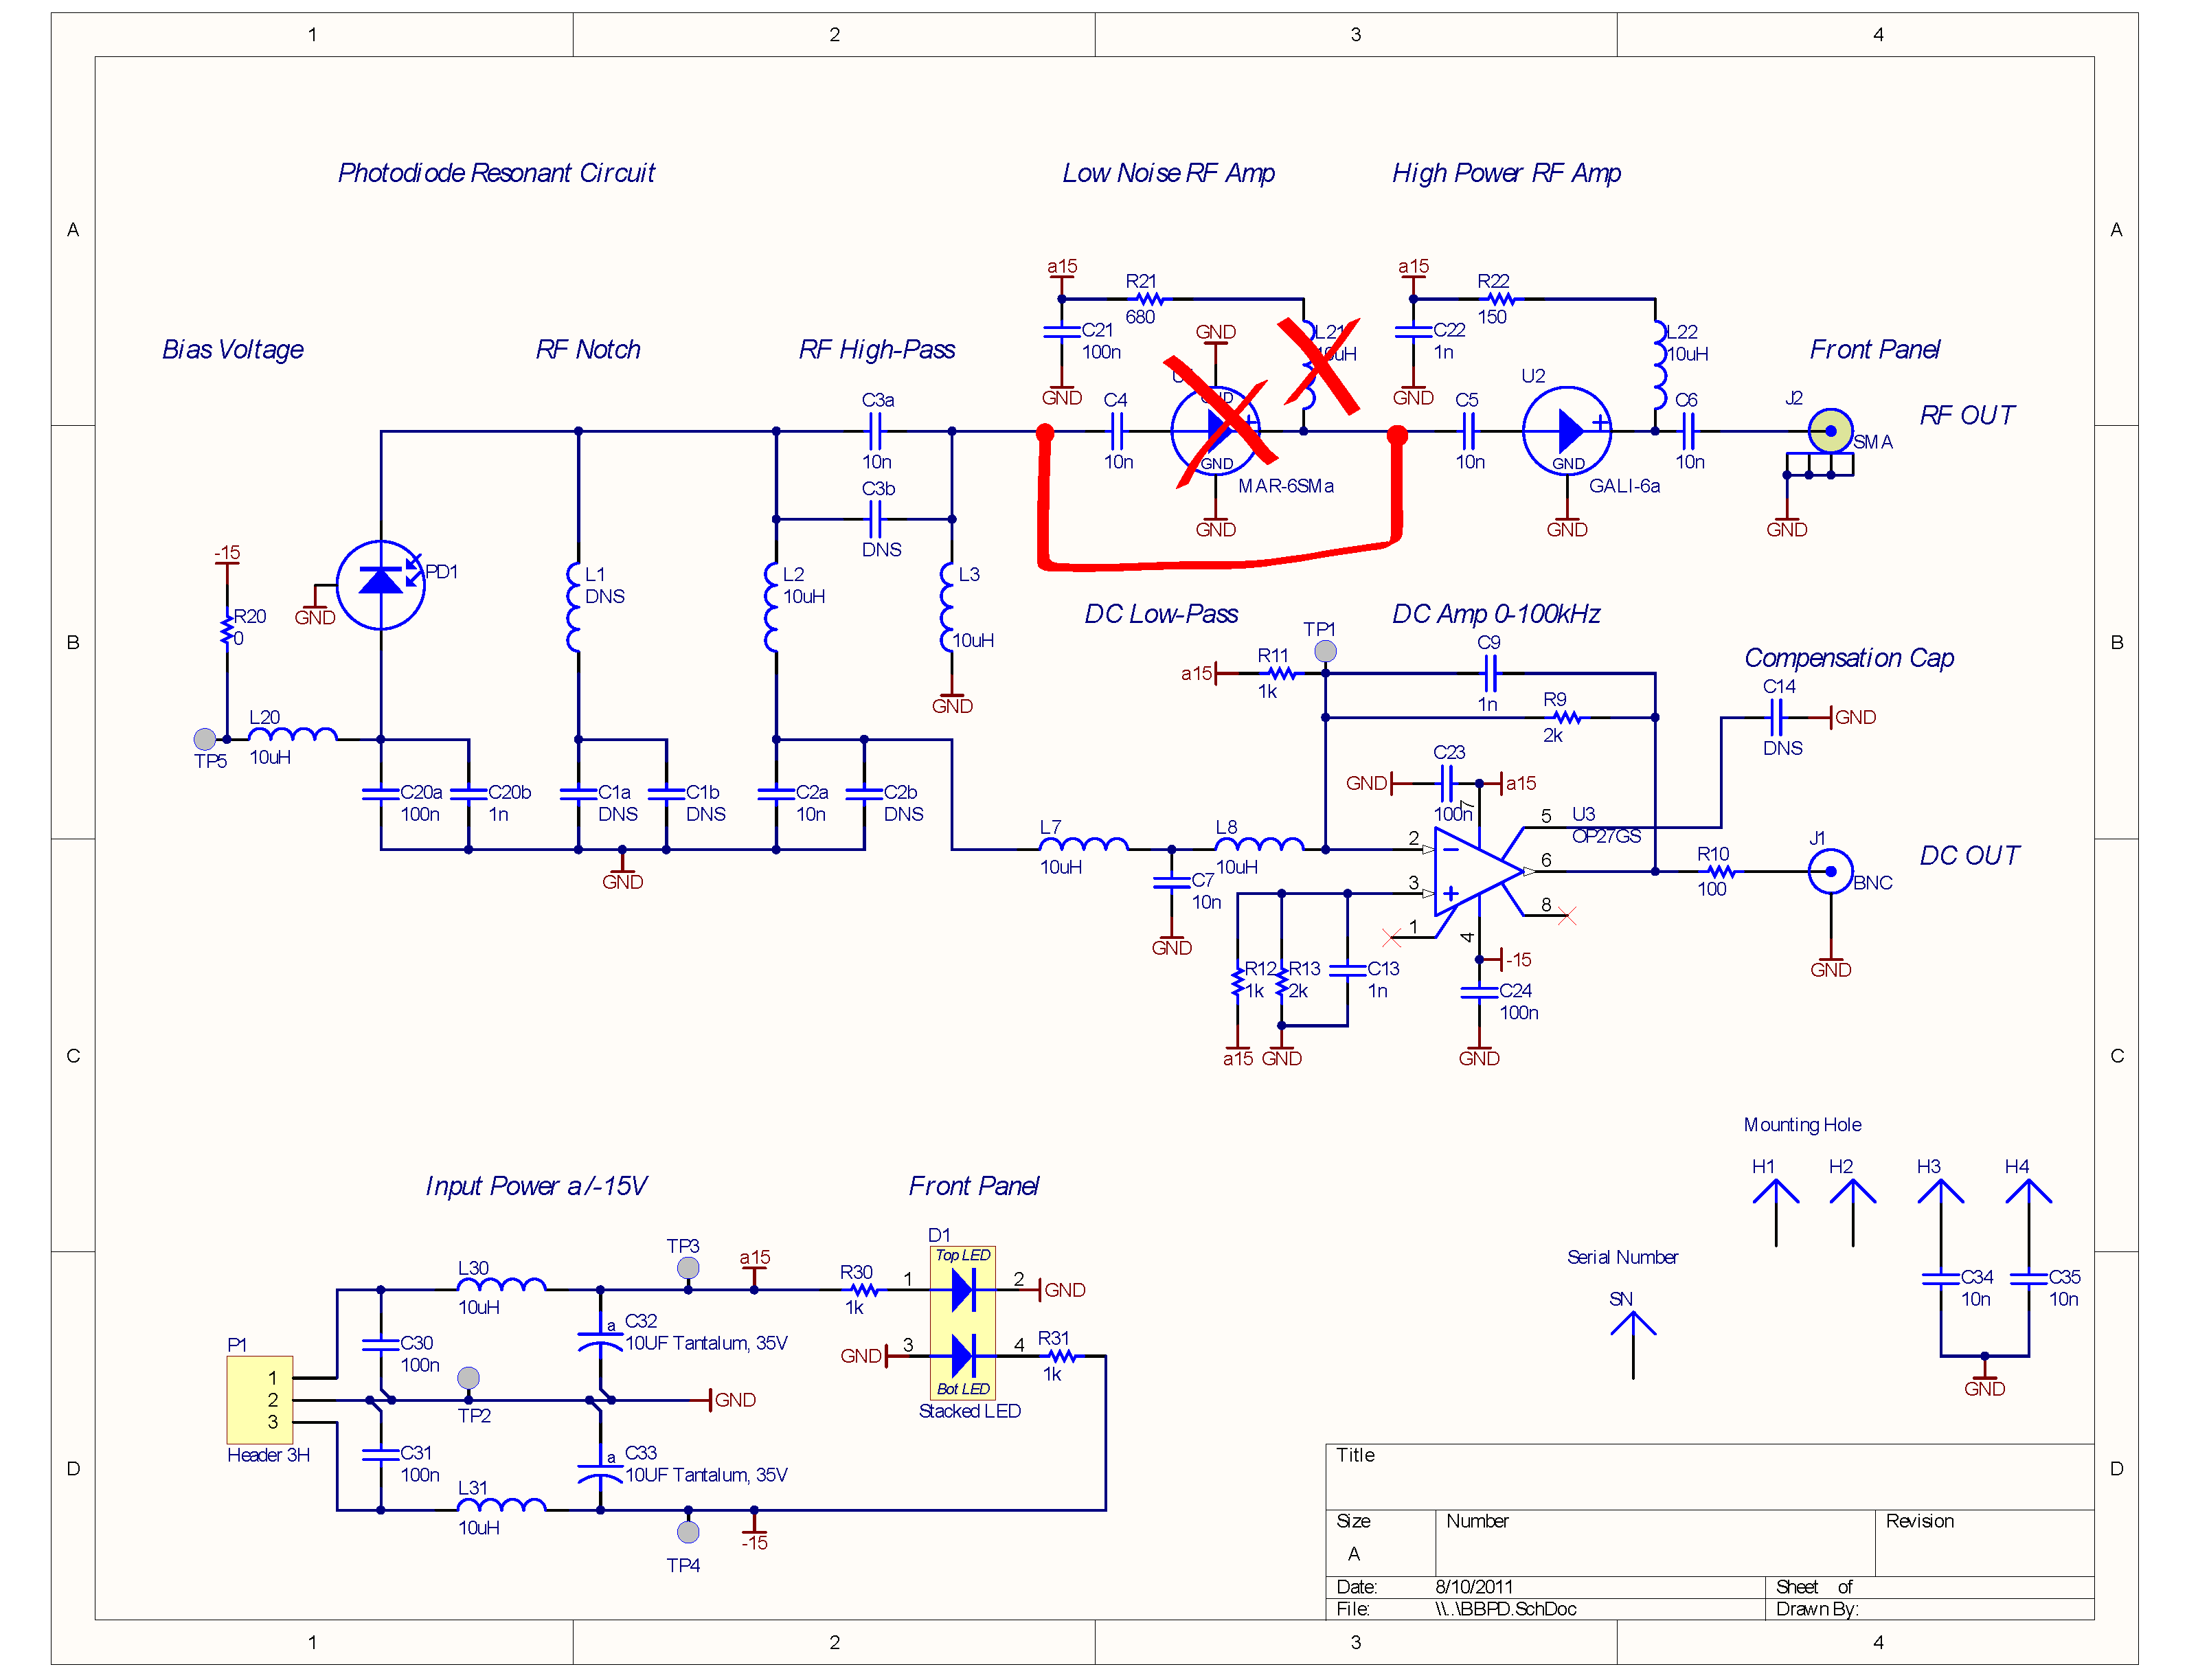
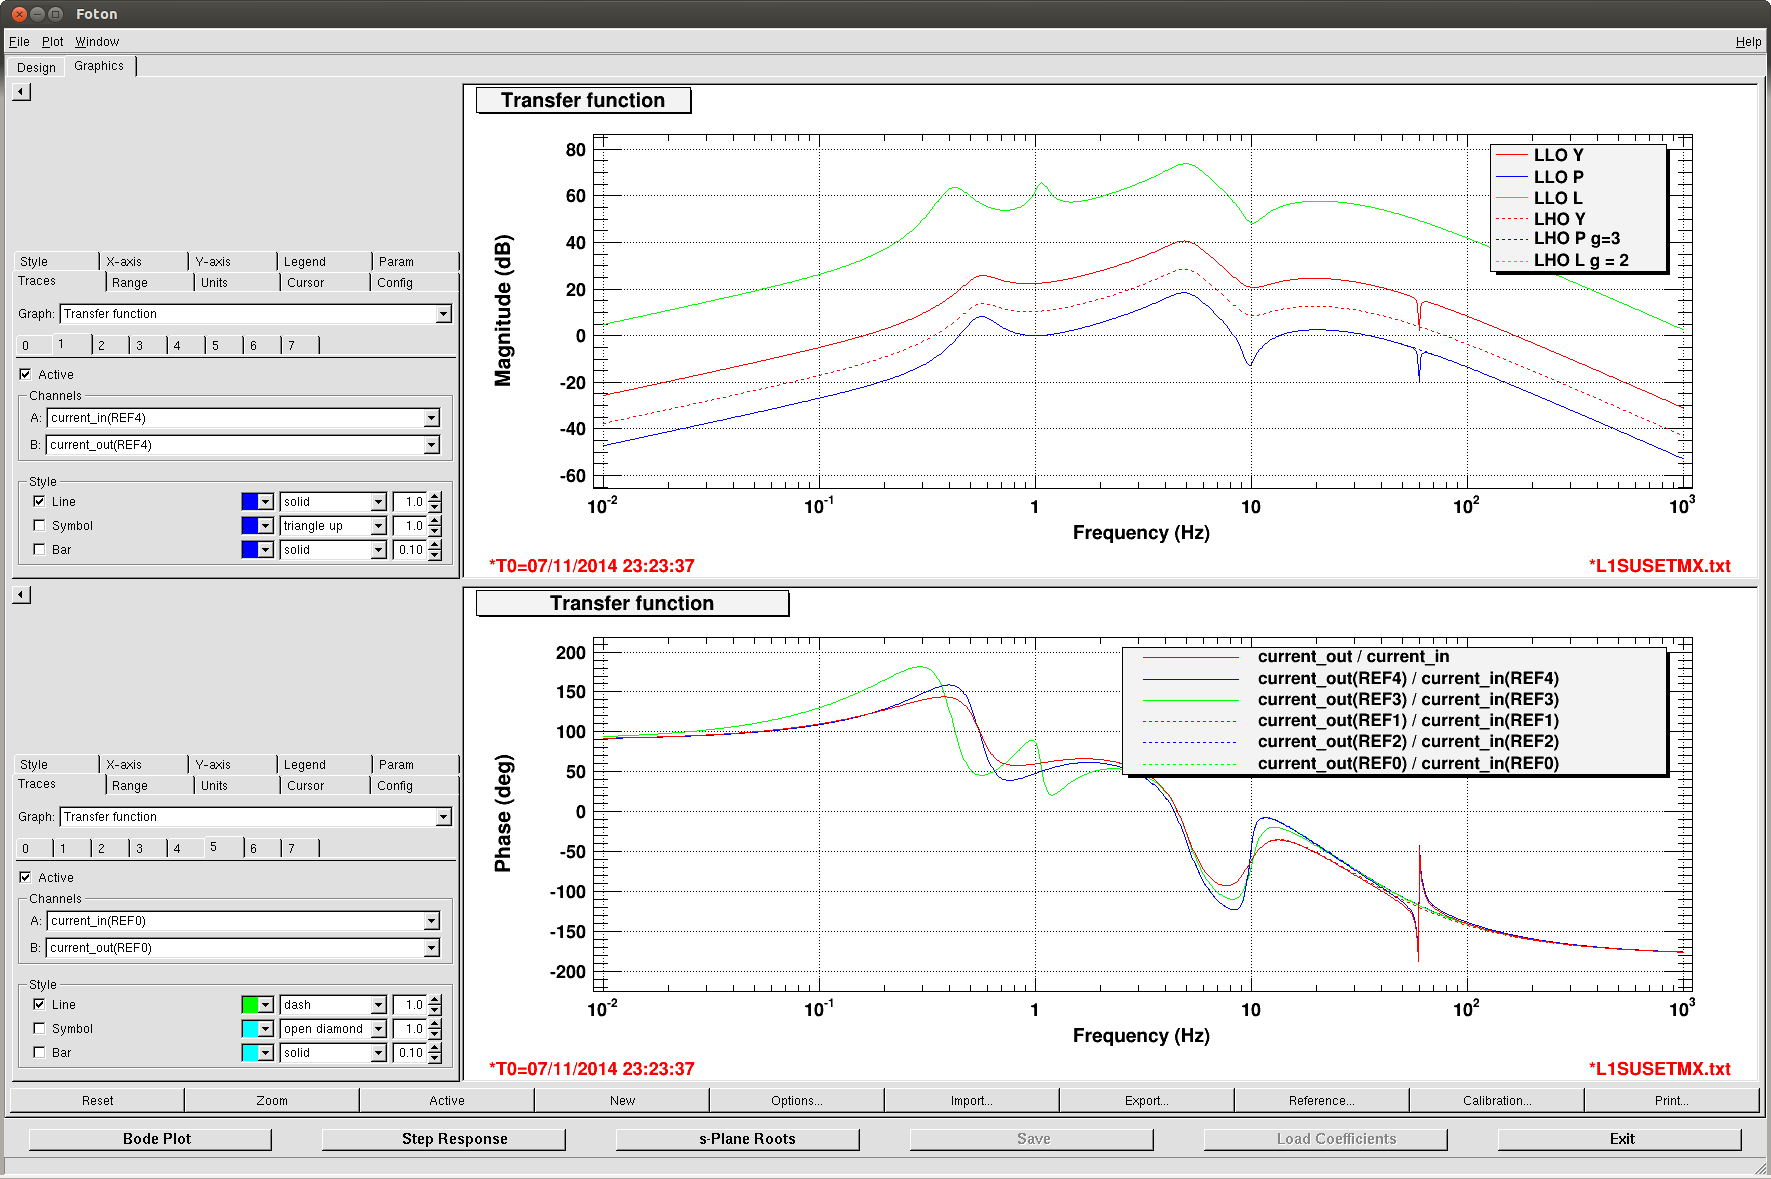
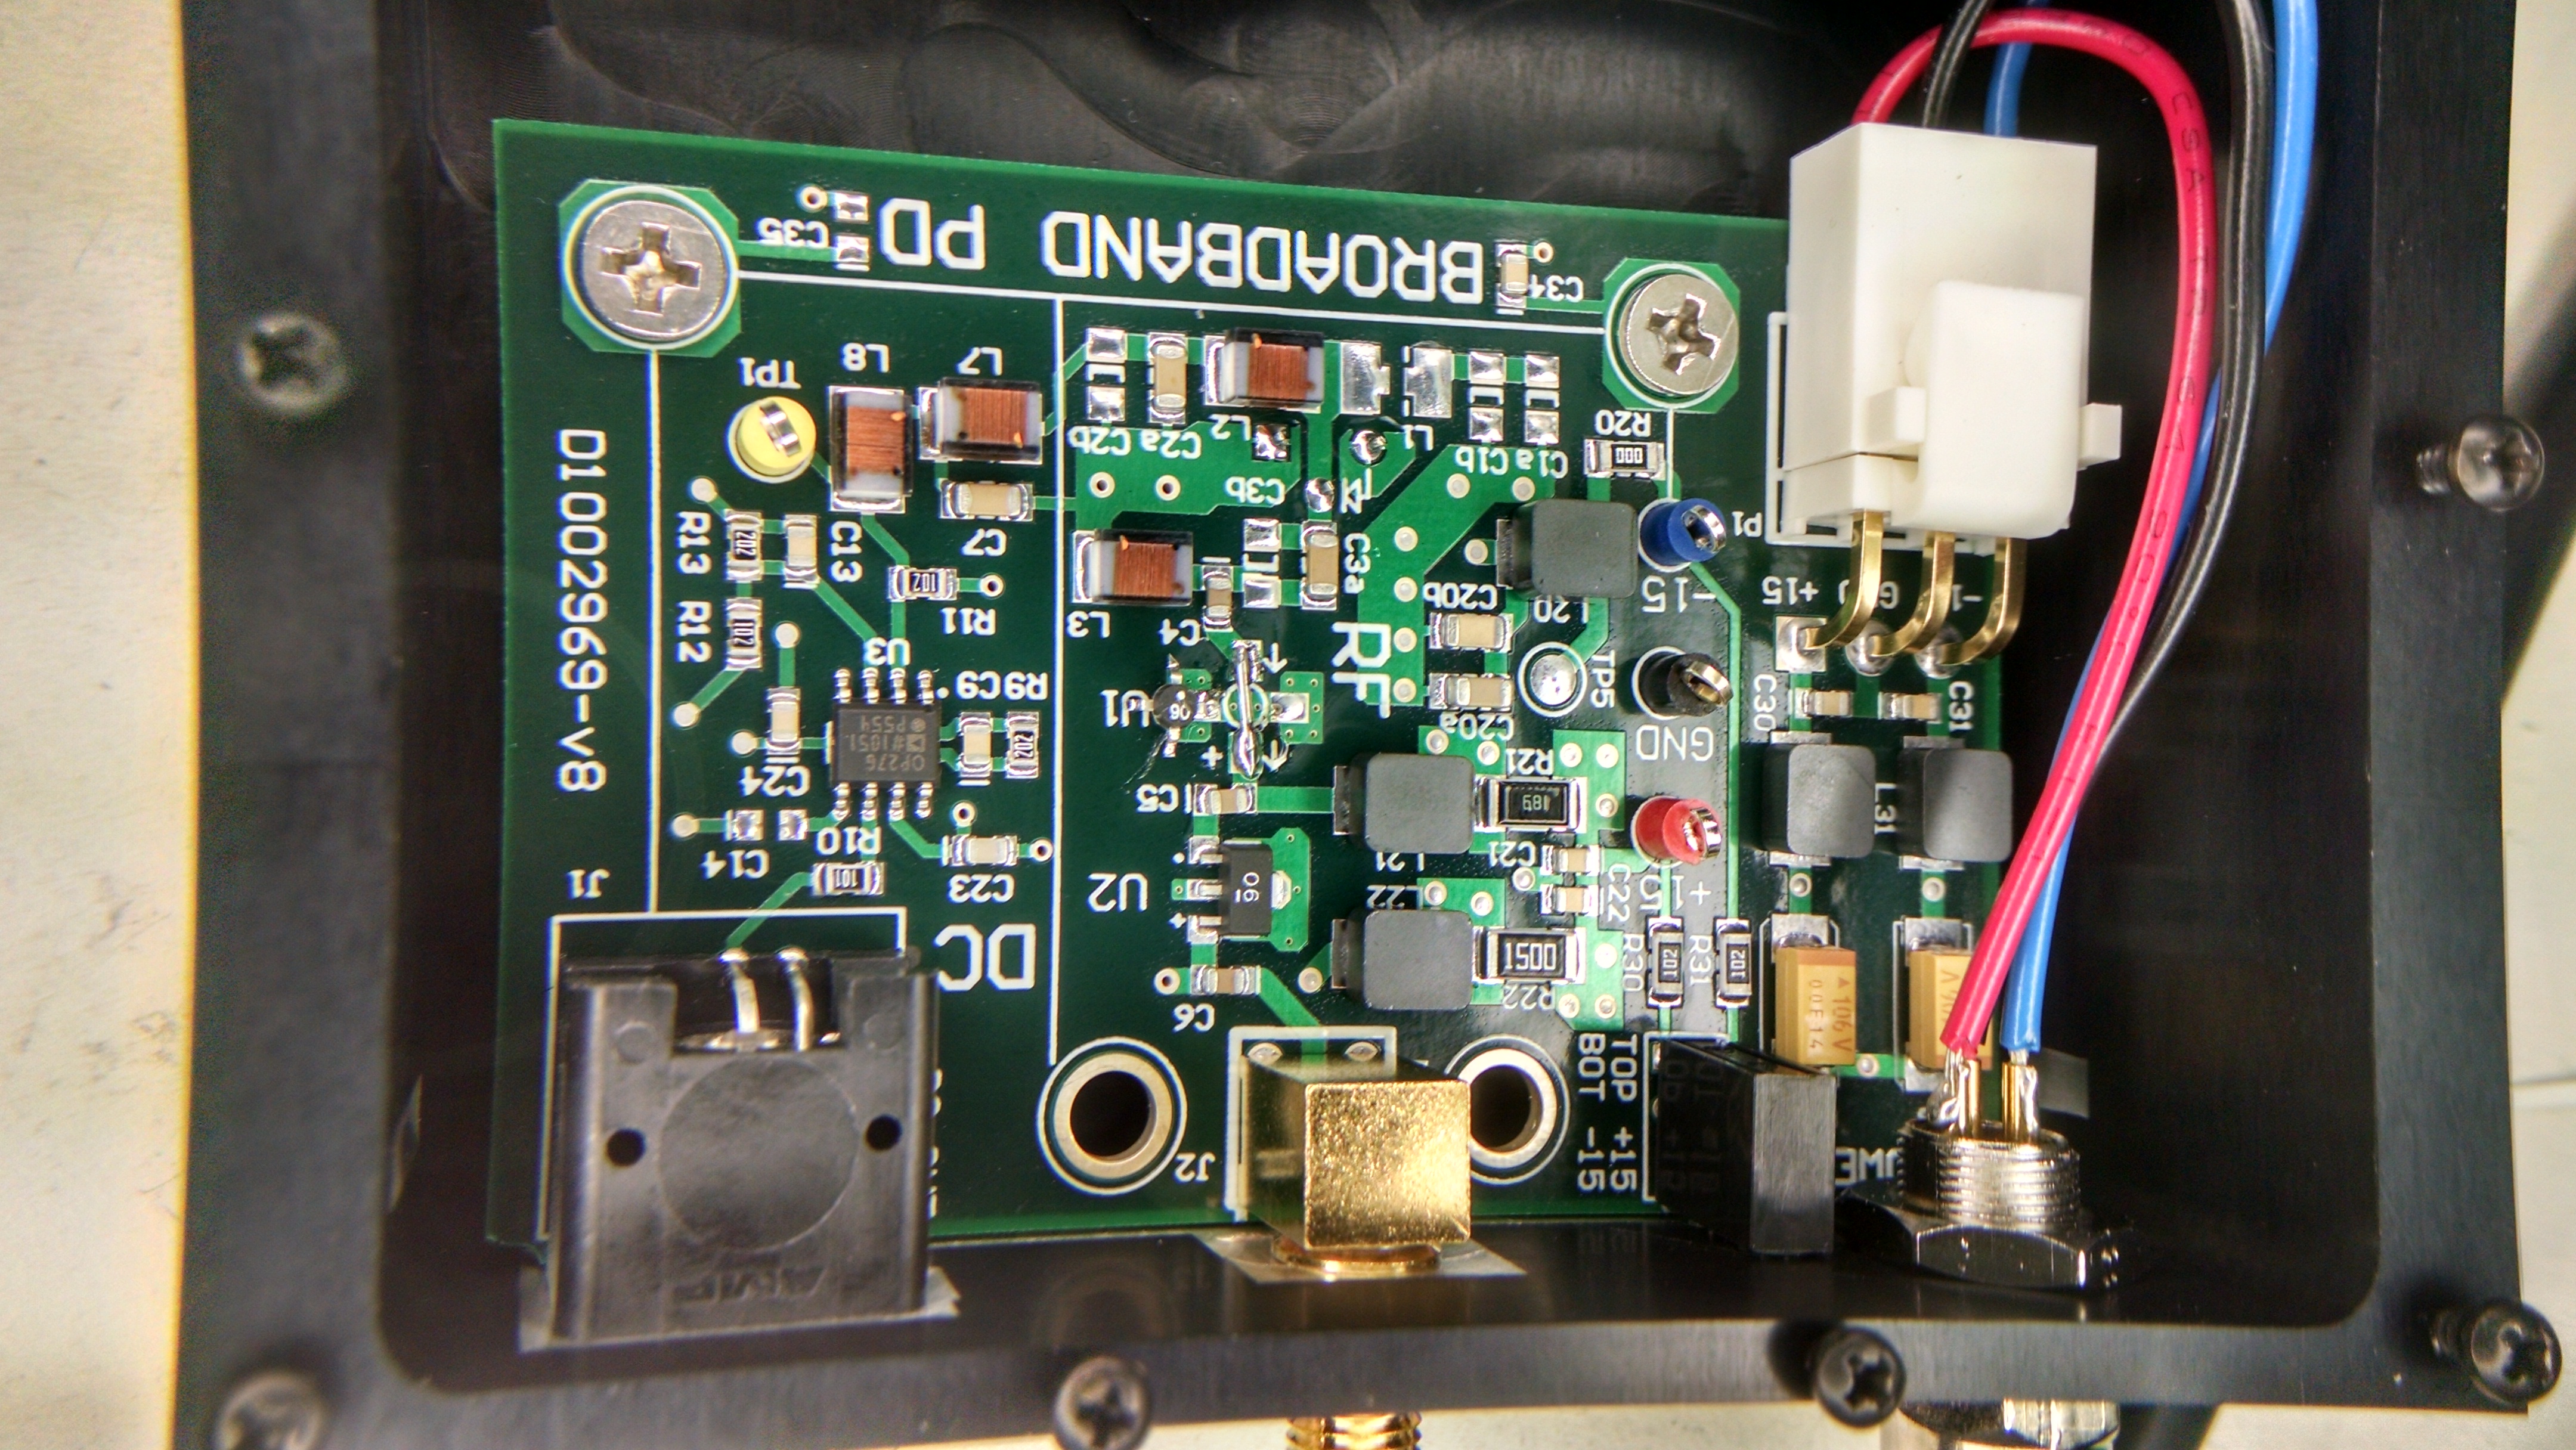
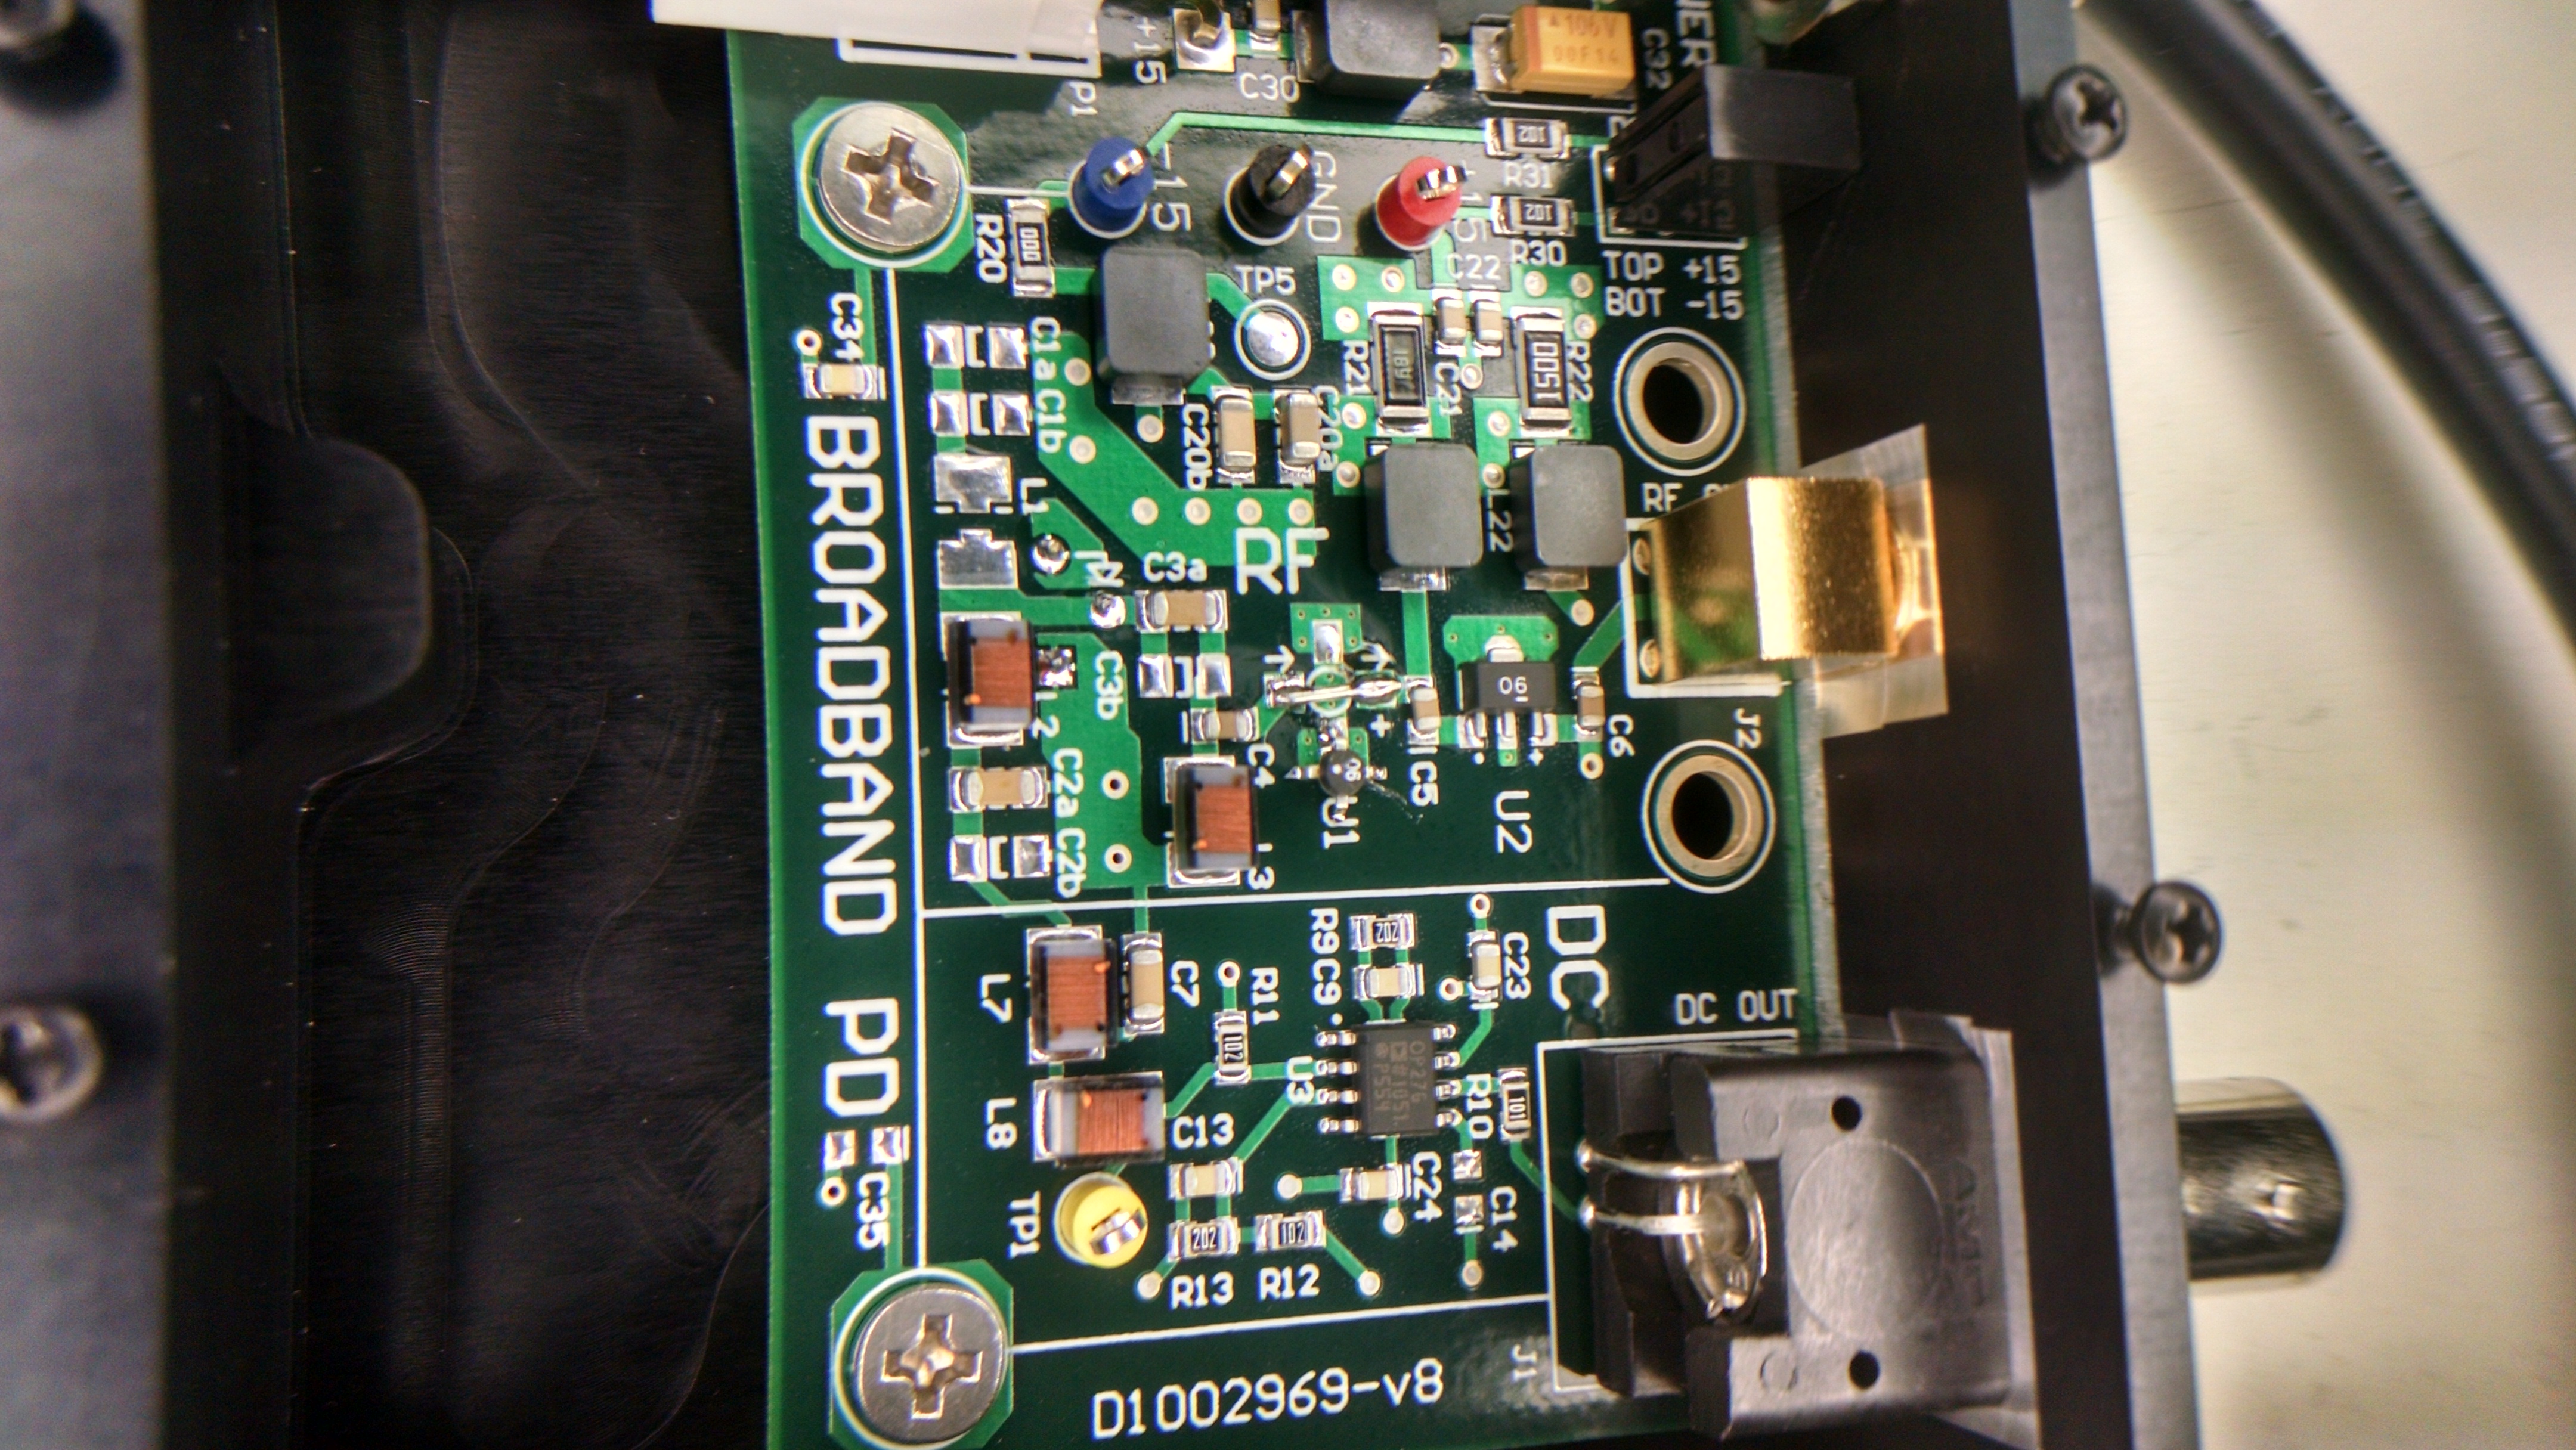
A spare BBPD with serial number S1200247 has been modified by removing and bypassing U1, the first RF amplifier stage. The attached BBPD_tf1.pdf file shows the transfer function before and after. Plot tf2 shows the ratio.
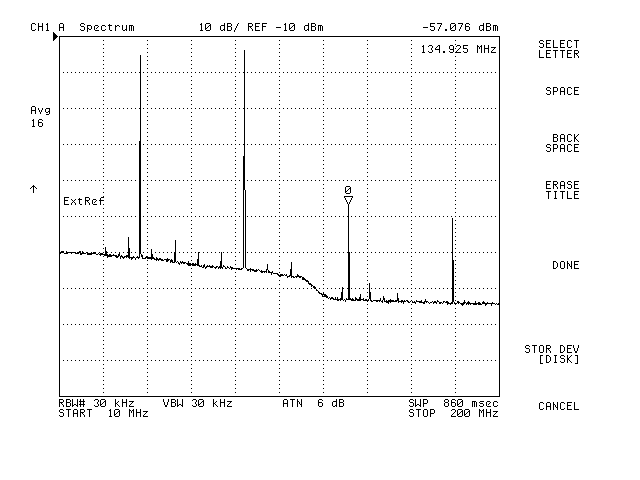
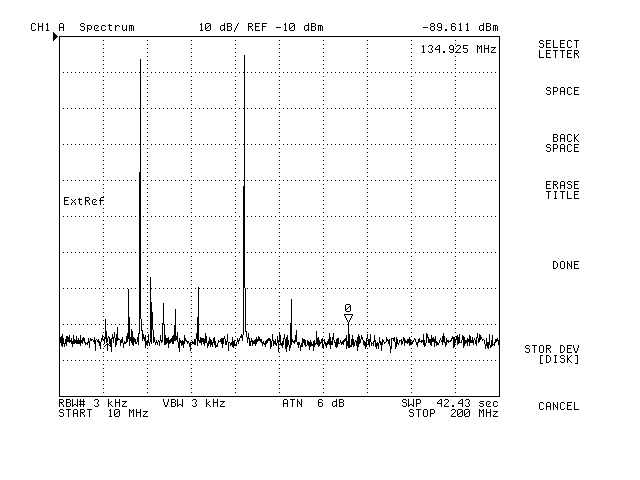
We took a baseline intermodulation product measurement by sending a two tone signal into the AM laser. The first tone was at 45 MHz and generated a line with -15 dBm amplitude. The second tone was a 90 MHz line also at -15 dBm. Plot IP2.png shows IP2 and IP3 lines at 135 MHz and 180 MHz with amplitudes of -57 dBm and -60 dBm, respectively.
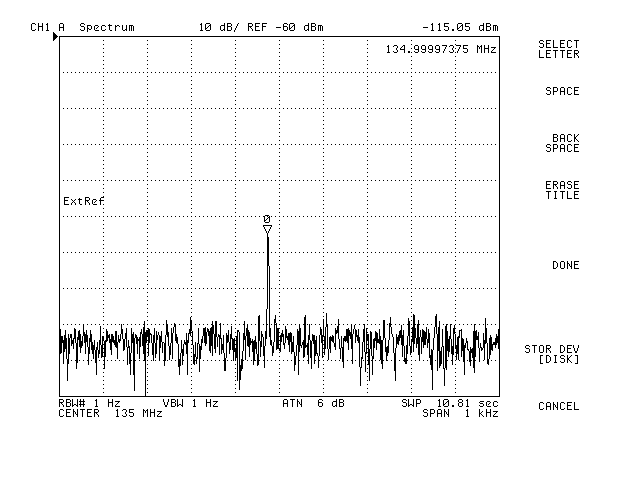
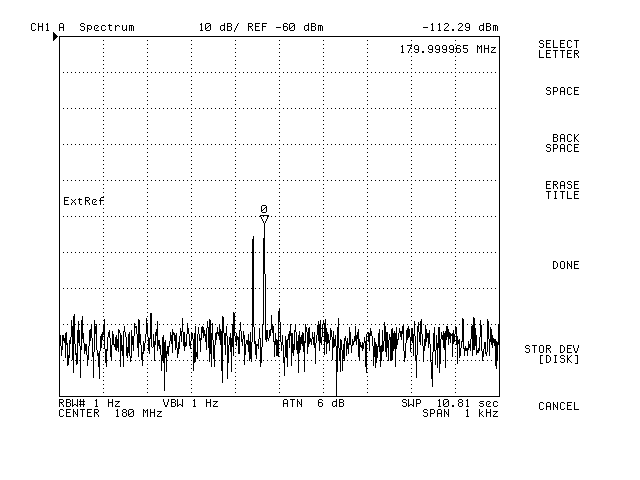
The plot labeled IP2M shows the same measurement after the removal of U1. Close-in plots IP2M135 and IP2M180 show spectra with lower resolution bandwidth. The intermodulation lines are visible at a level around -115 dBm. One might consider this an upper limit, since the dominant distortion could be in the AM laser head. The IP2M135A plots shows one of the lines moved by 100 Hz. This now separates IP2 (lower frequency) and IP3 lines.
Finally, the IP2Mplus plot includes 20 dB higher drive levels to bring the lines back to -15 dBm. The 135 MHz lines shows up at -90 dBm which seems puzzeling low compared to the above measurement.

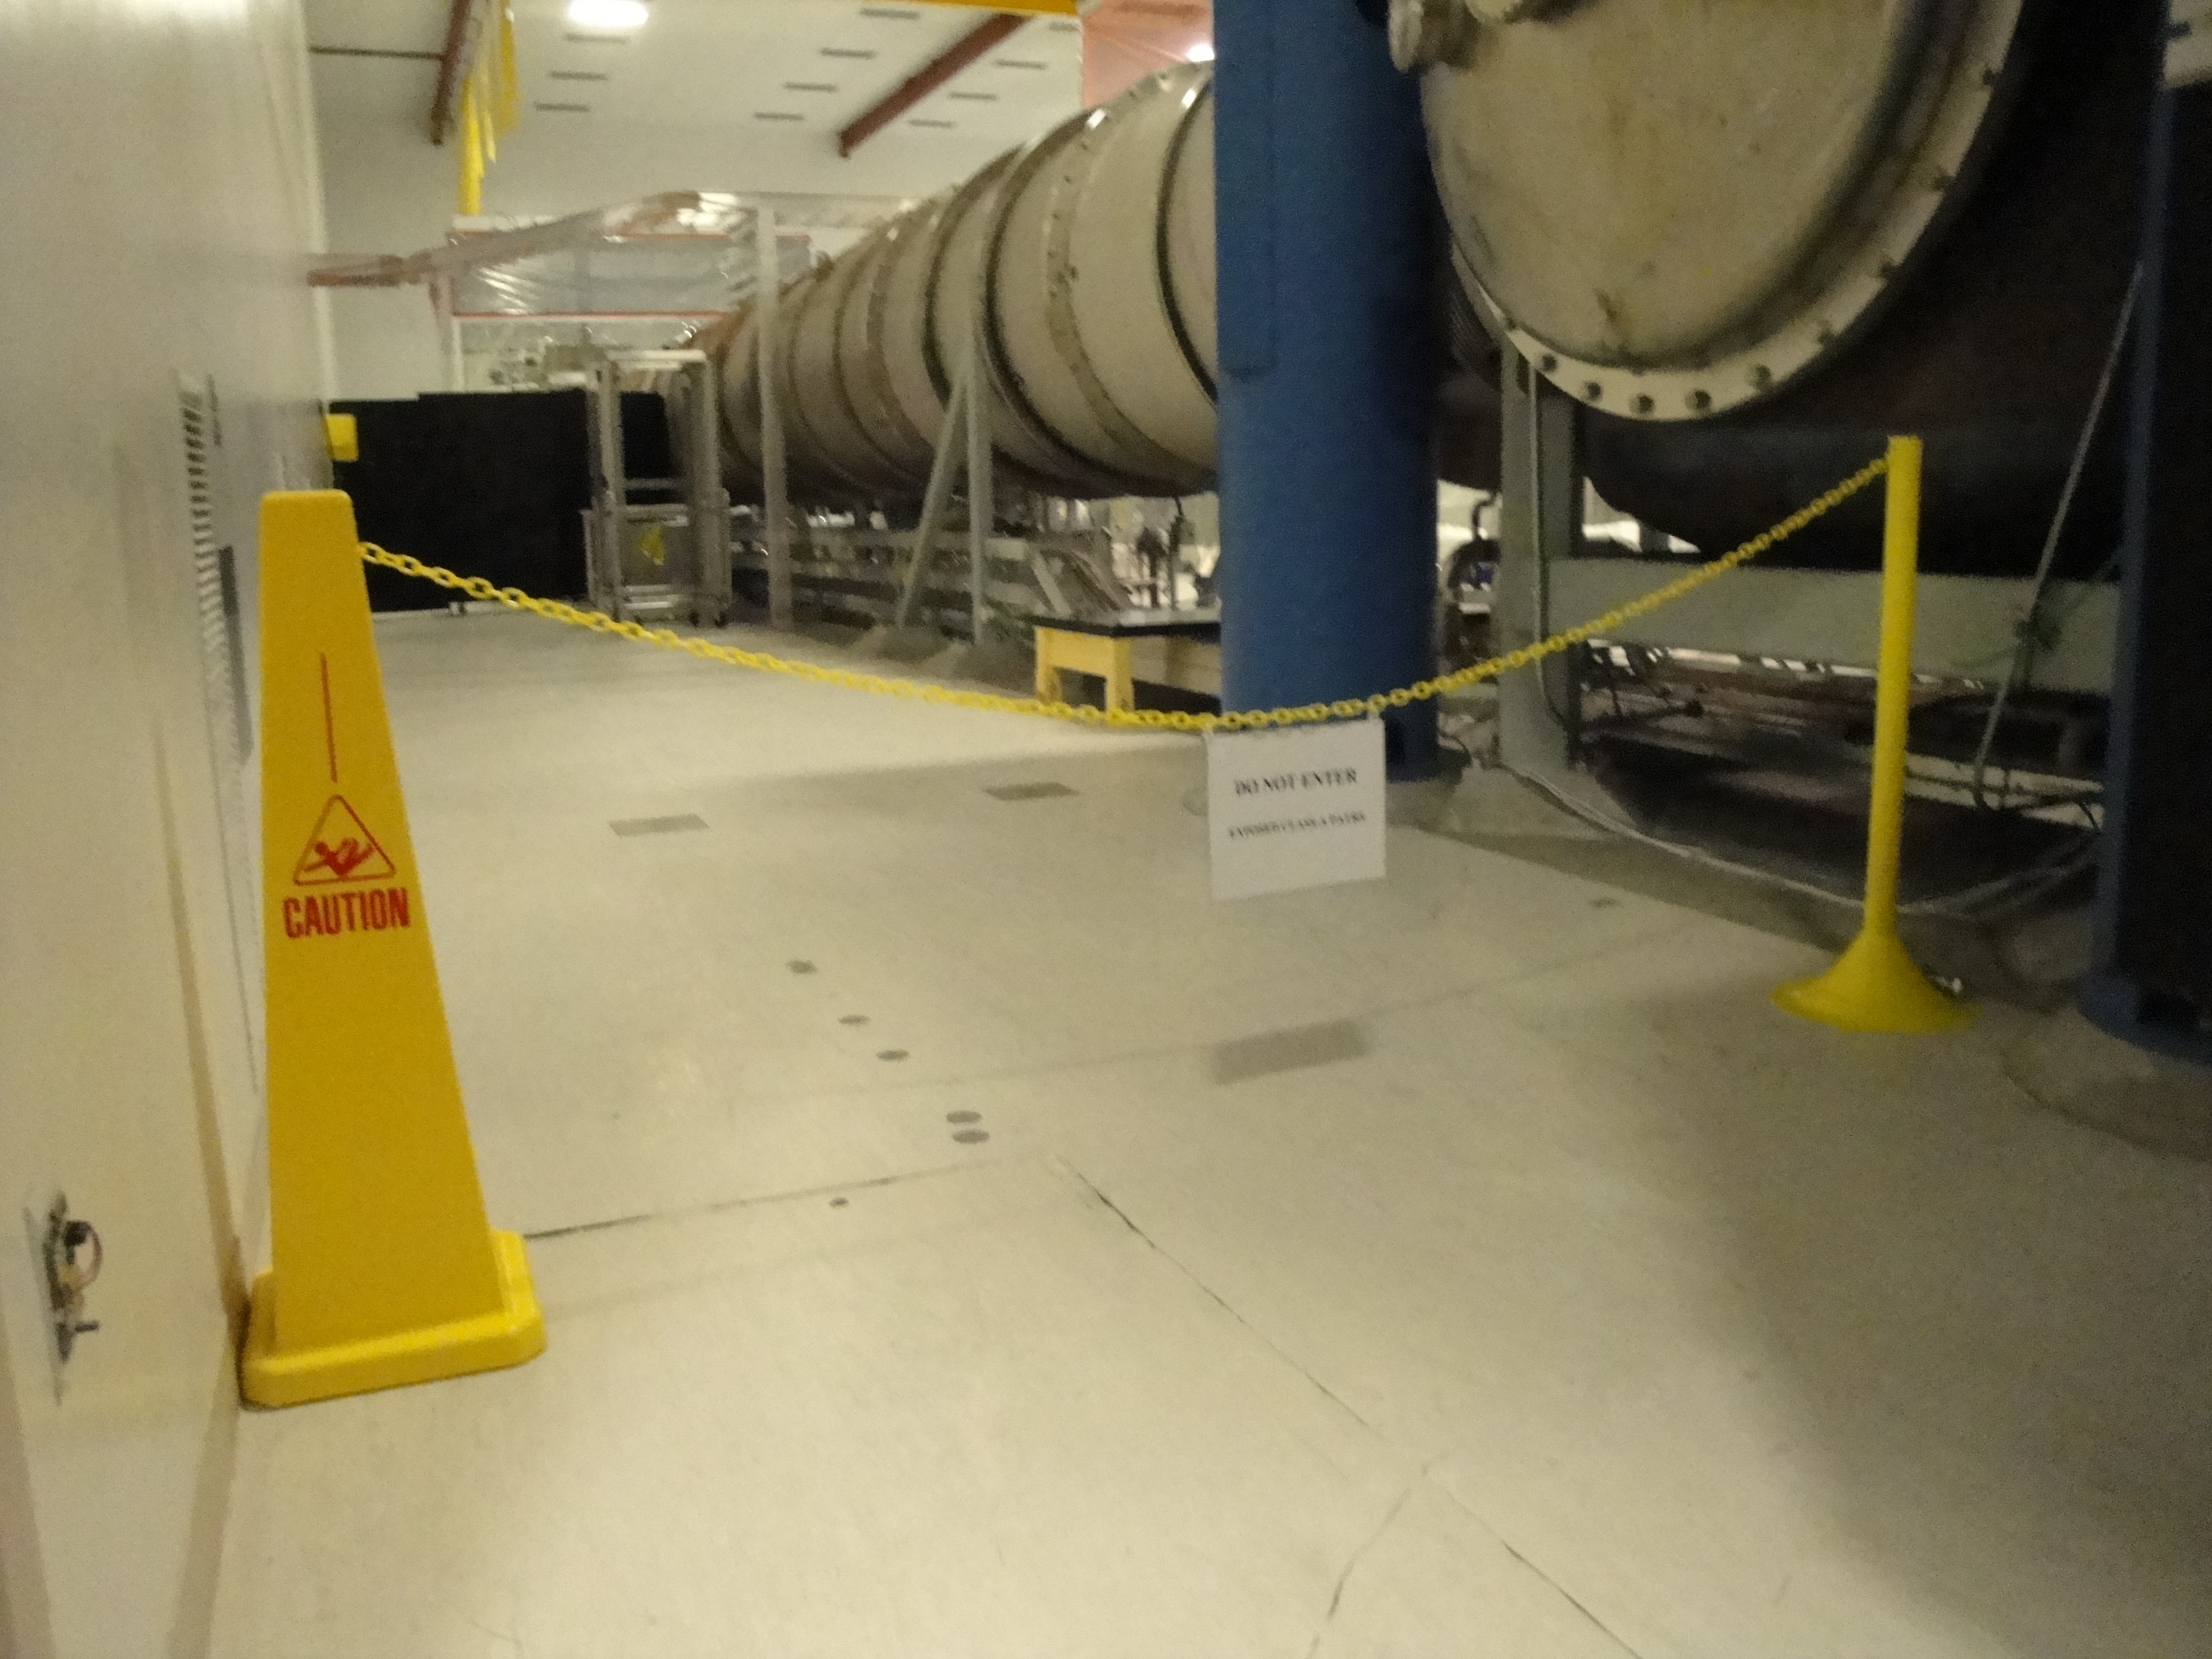
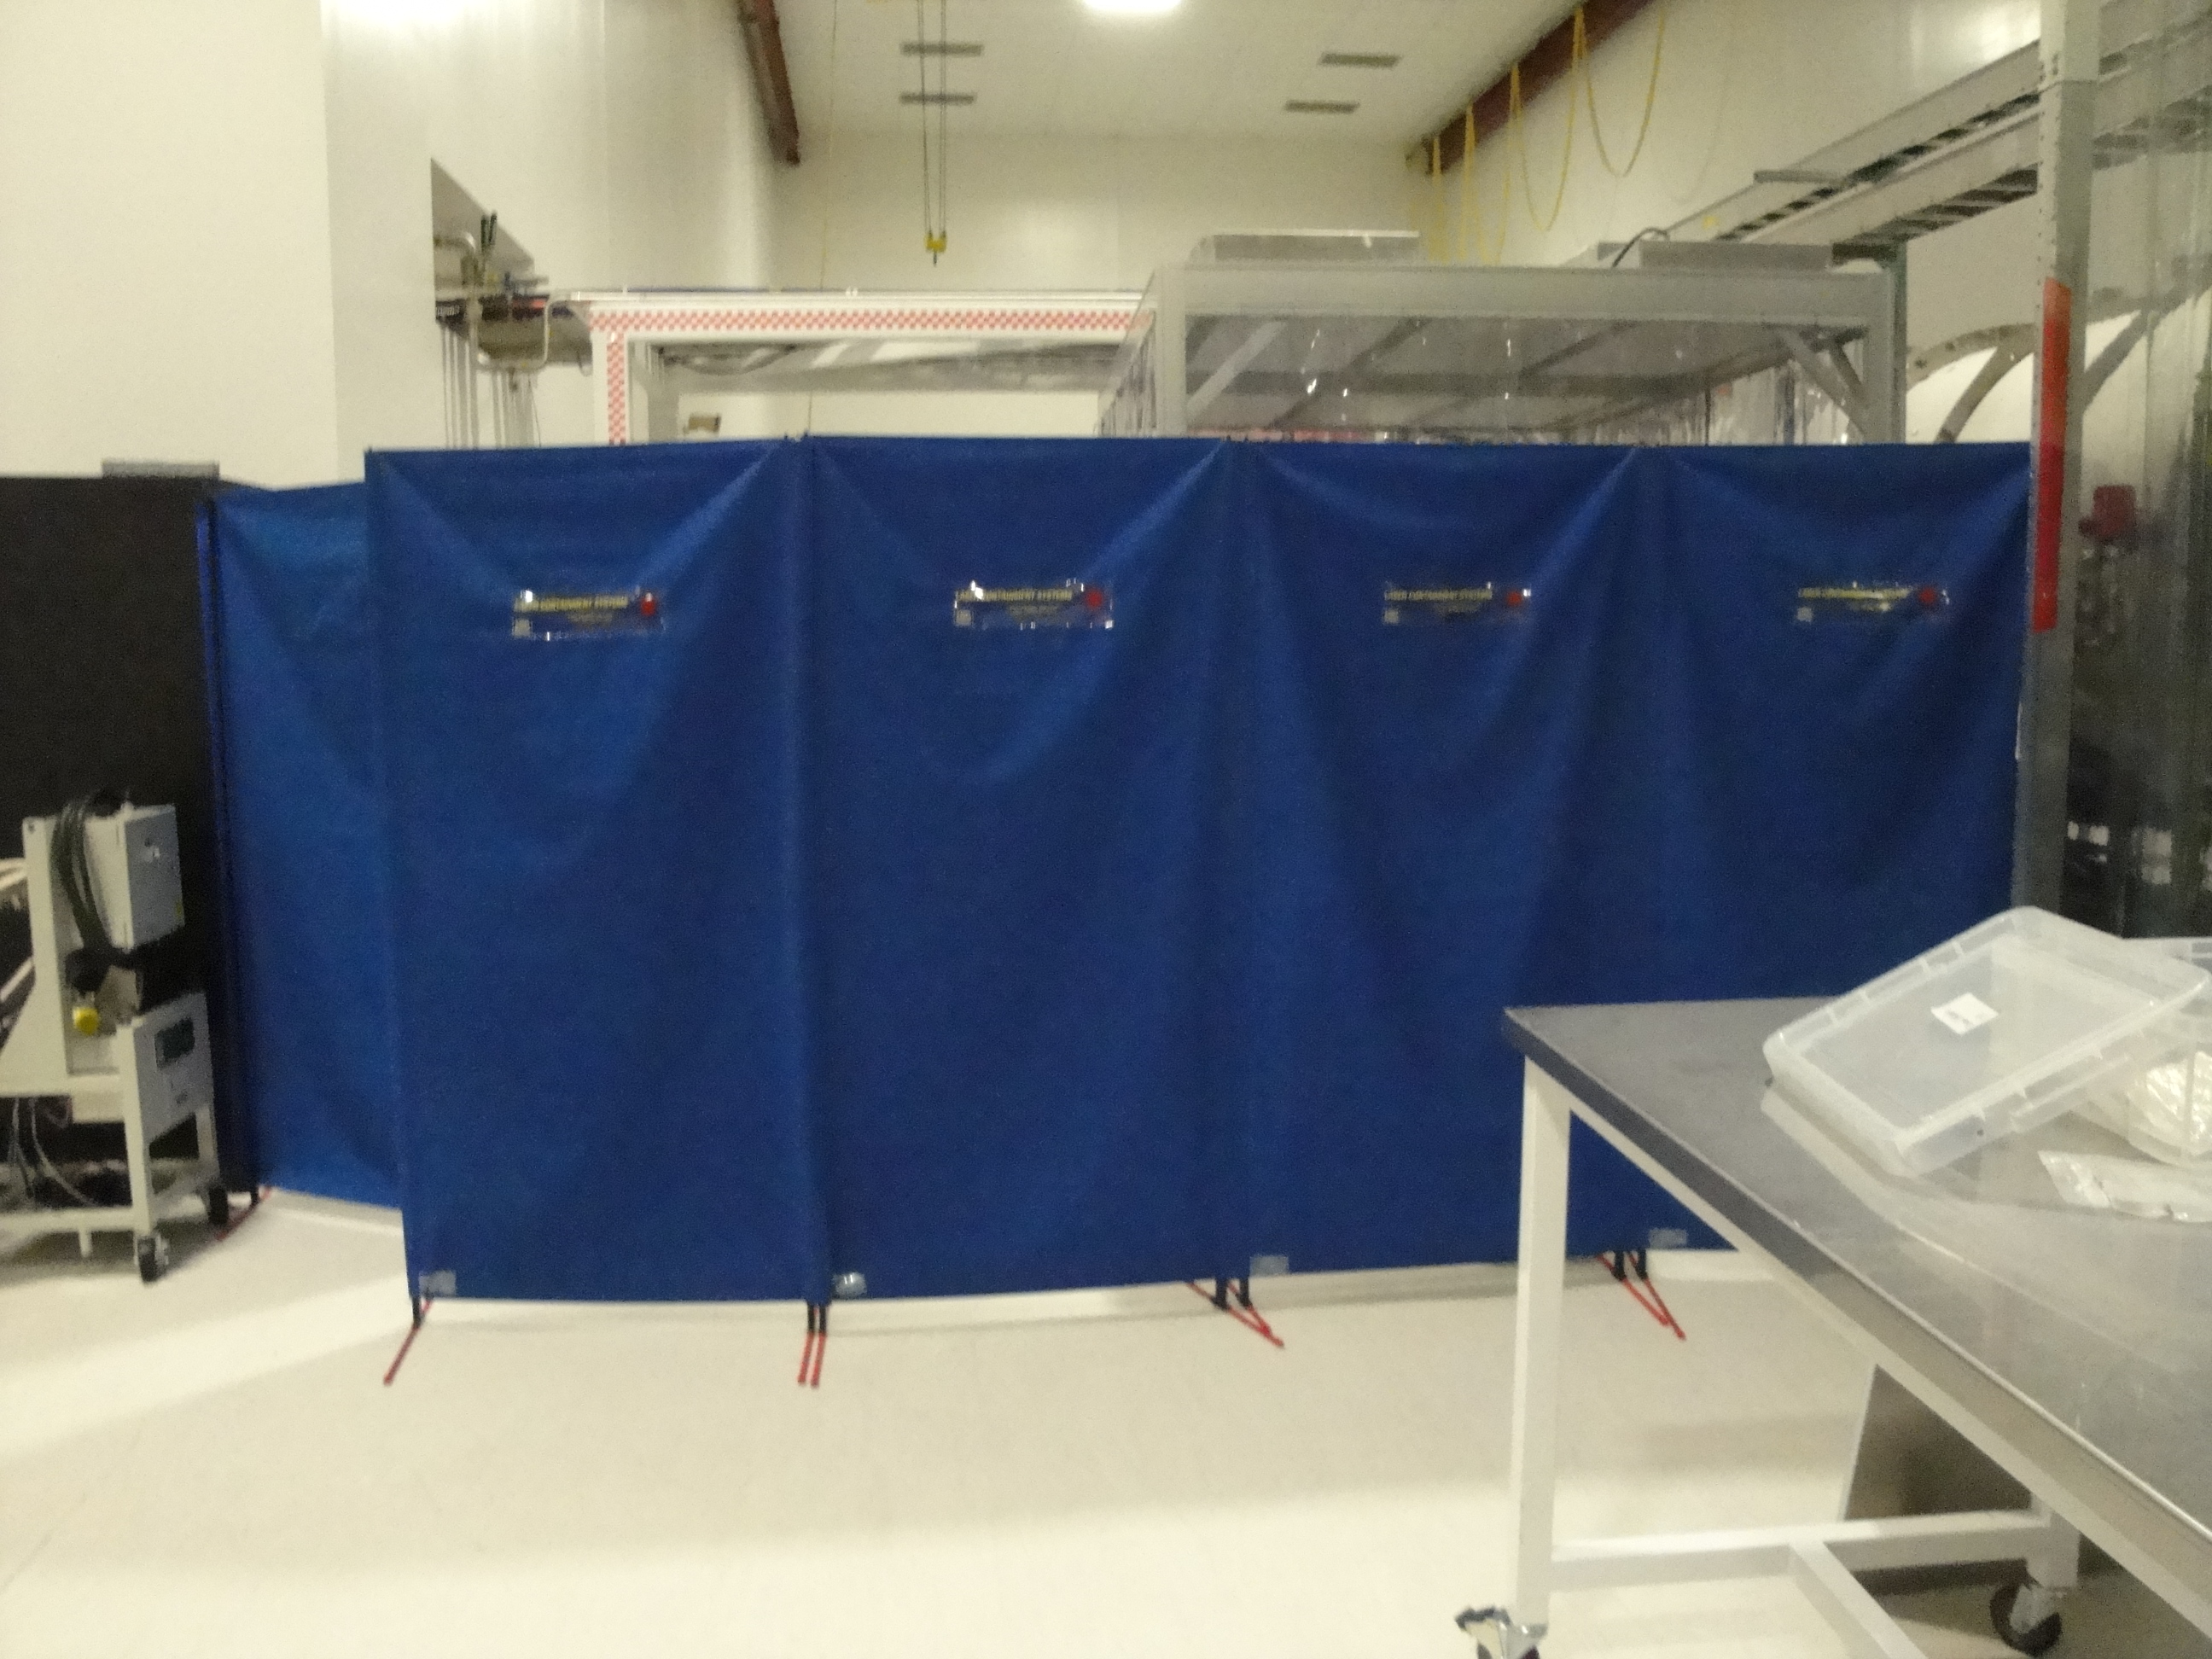
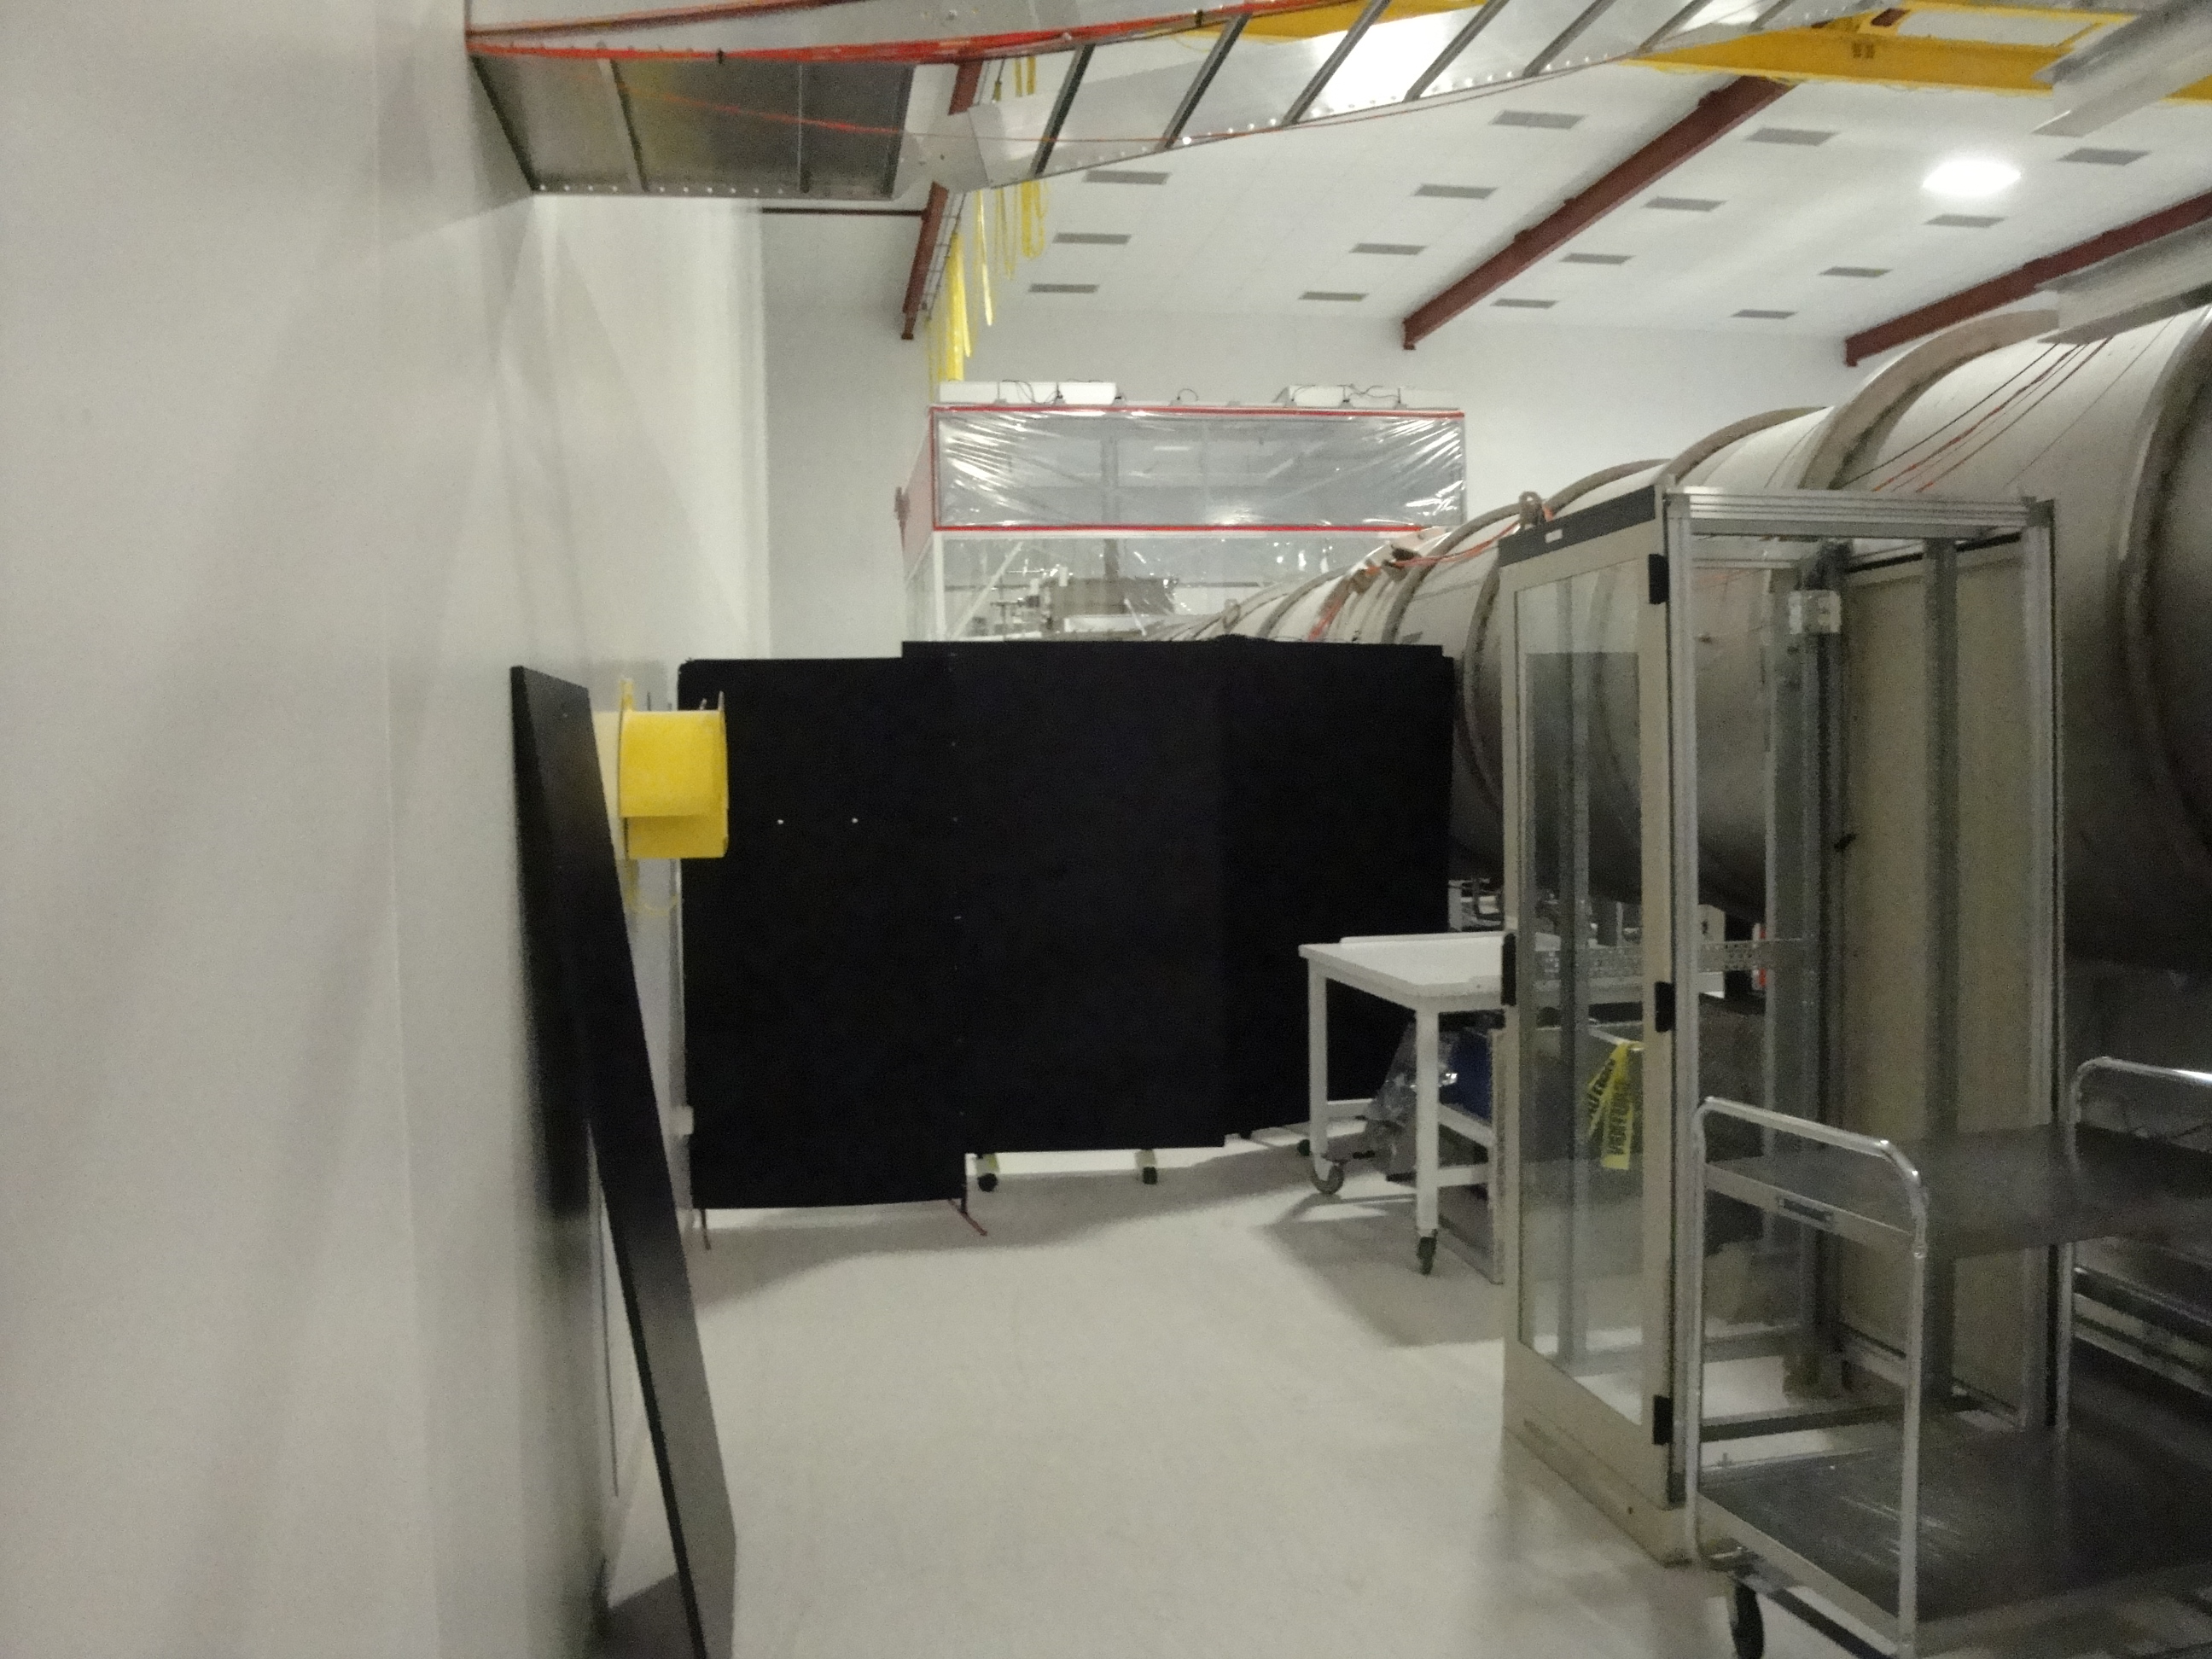
Modification pictures.
At Caltech, optical tests for a BBPD unit with the equivalent modification was done.
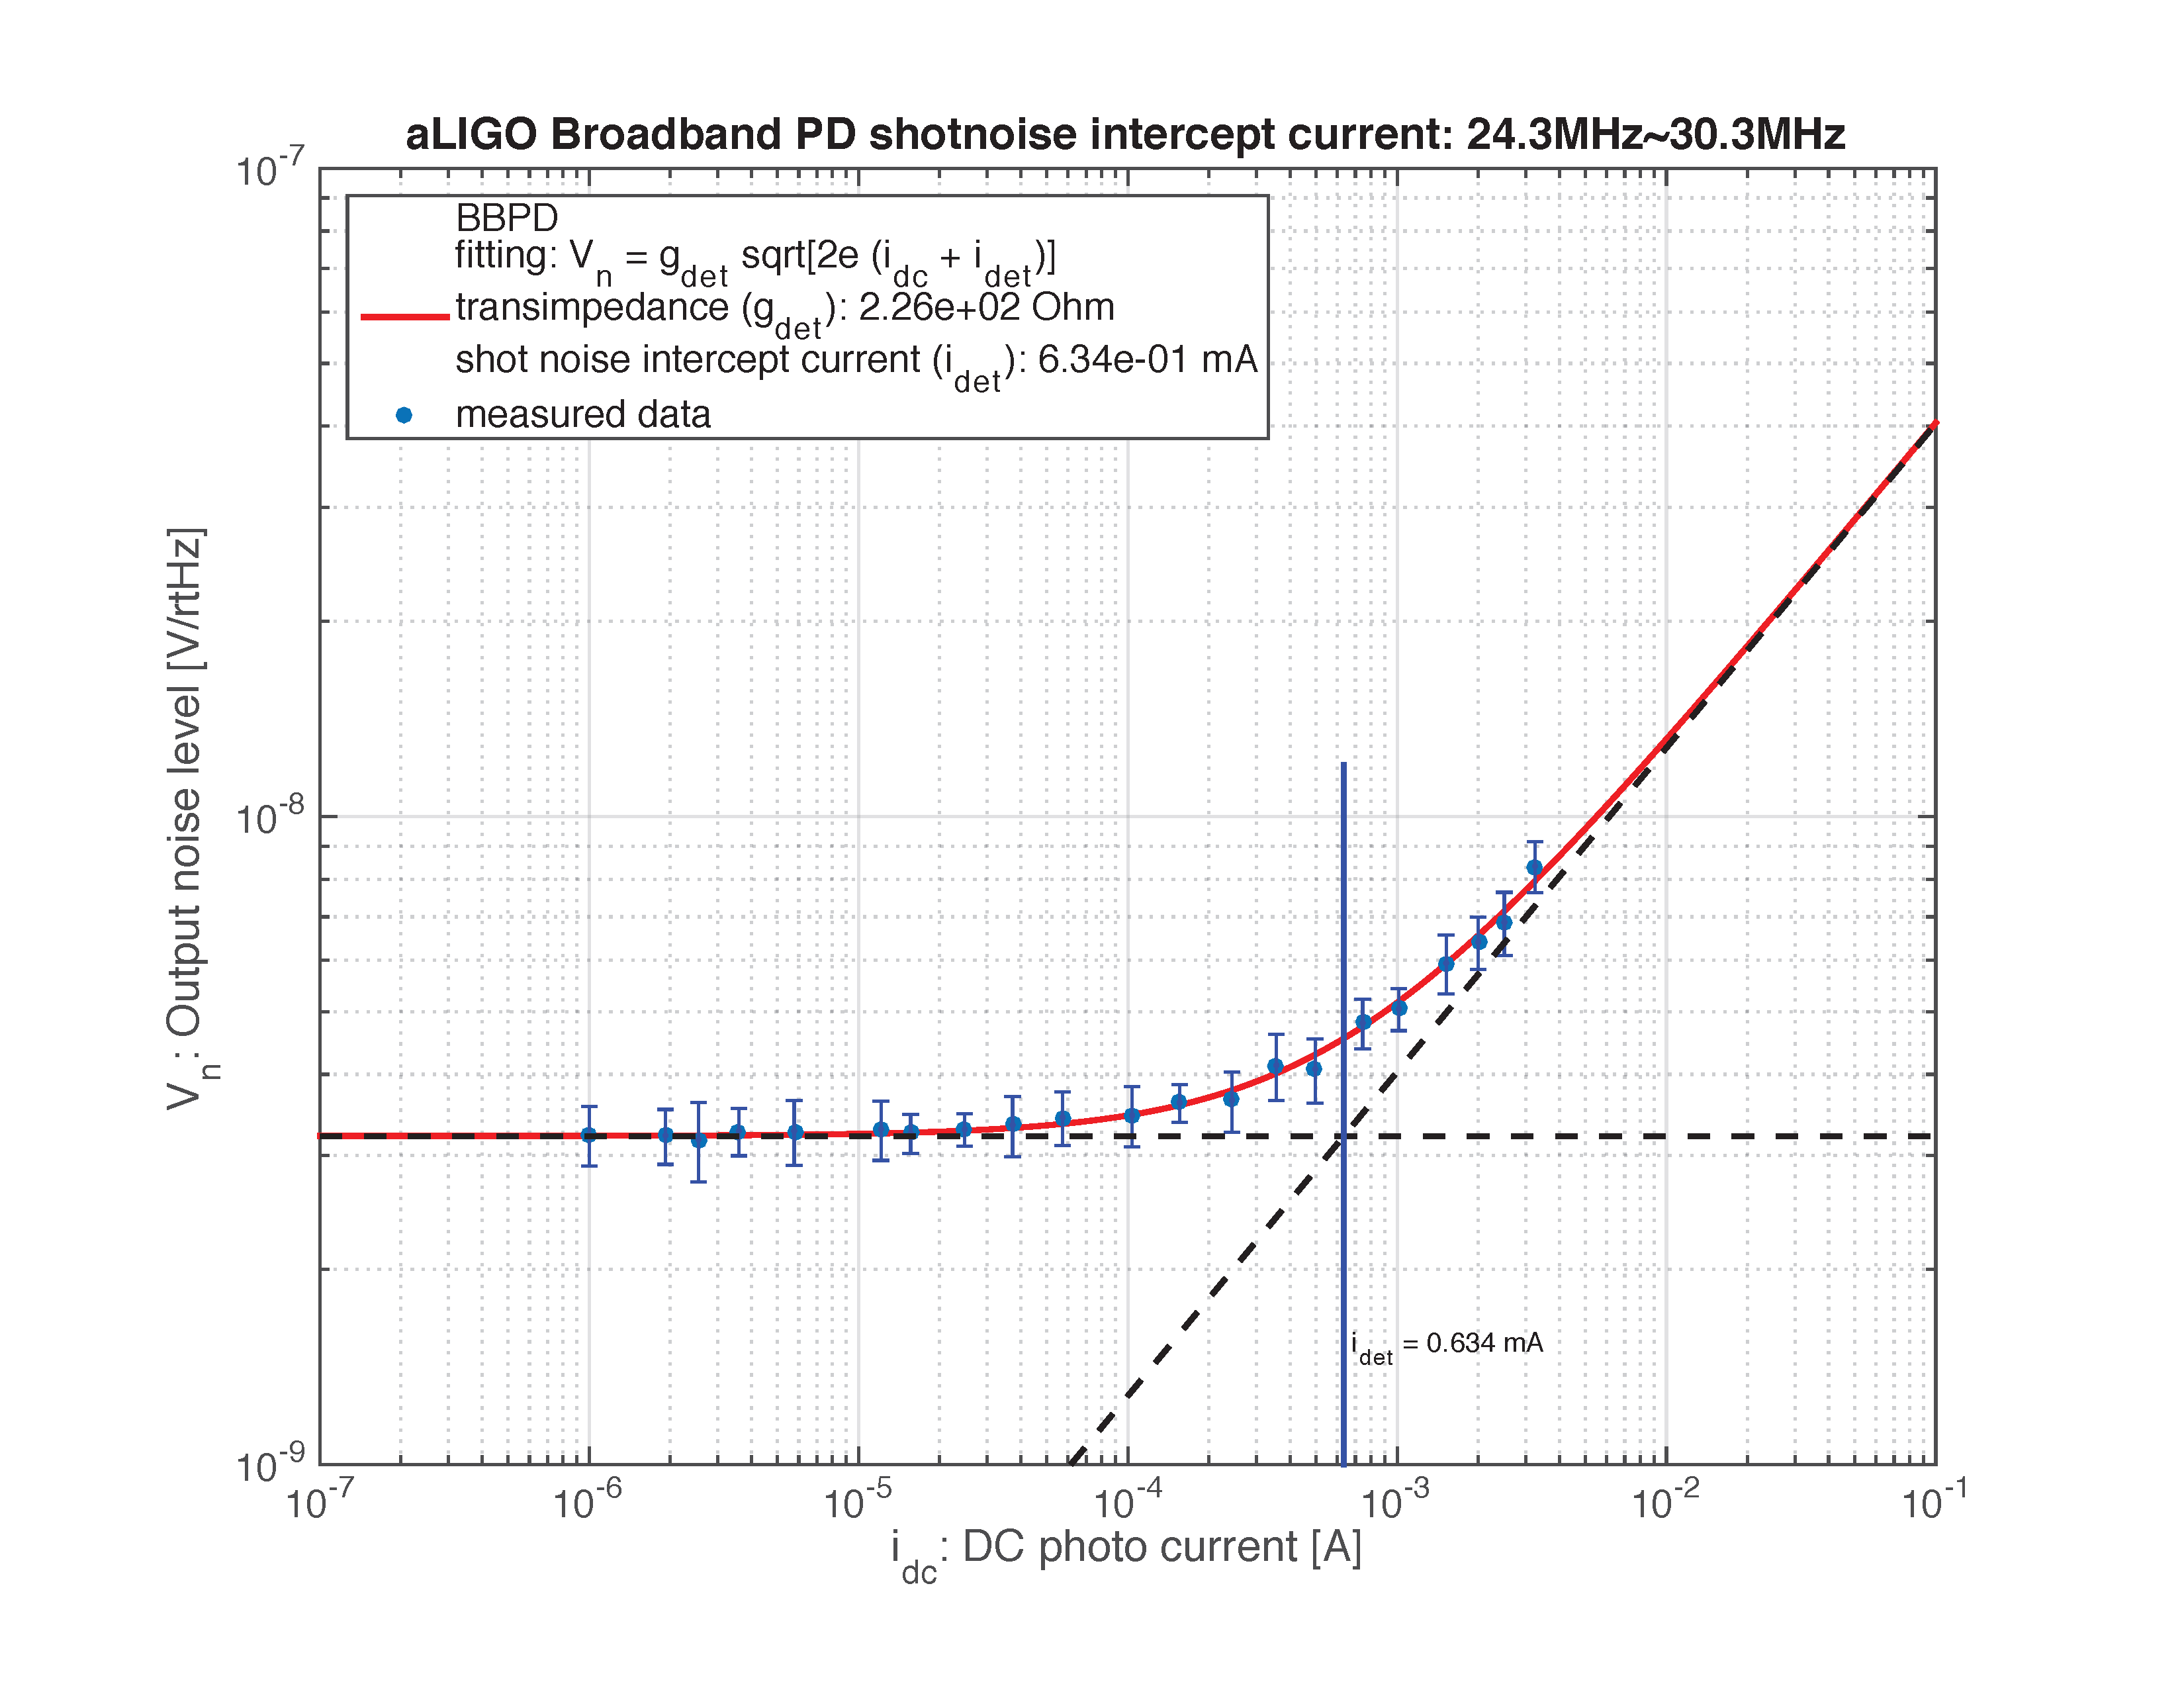
27MHz: Transimpedance 226Ohm, Shot noise intercept current 0.63mA
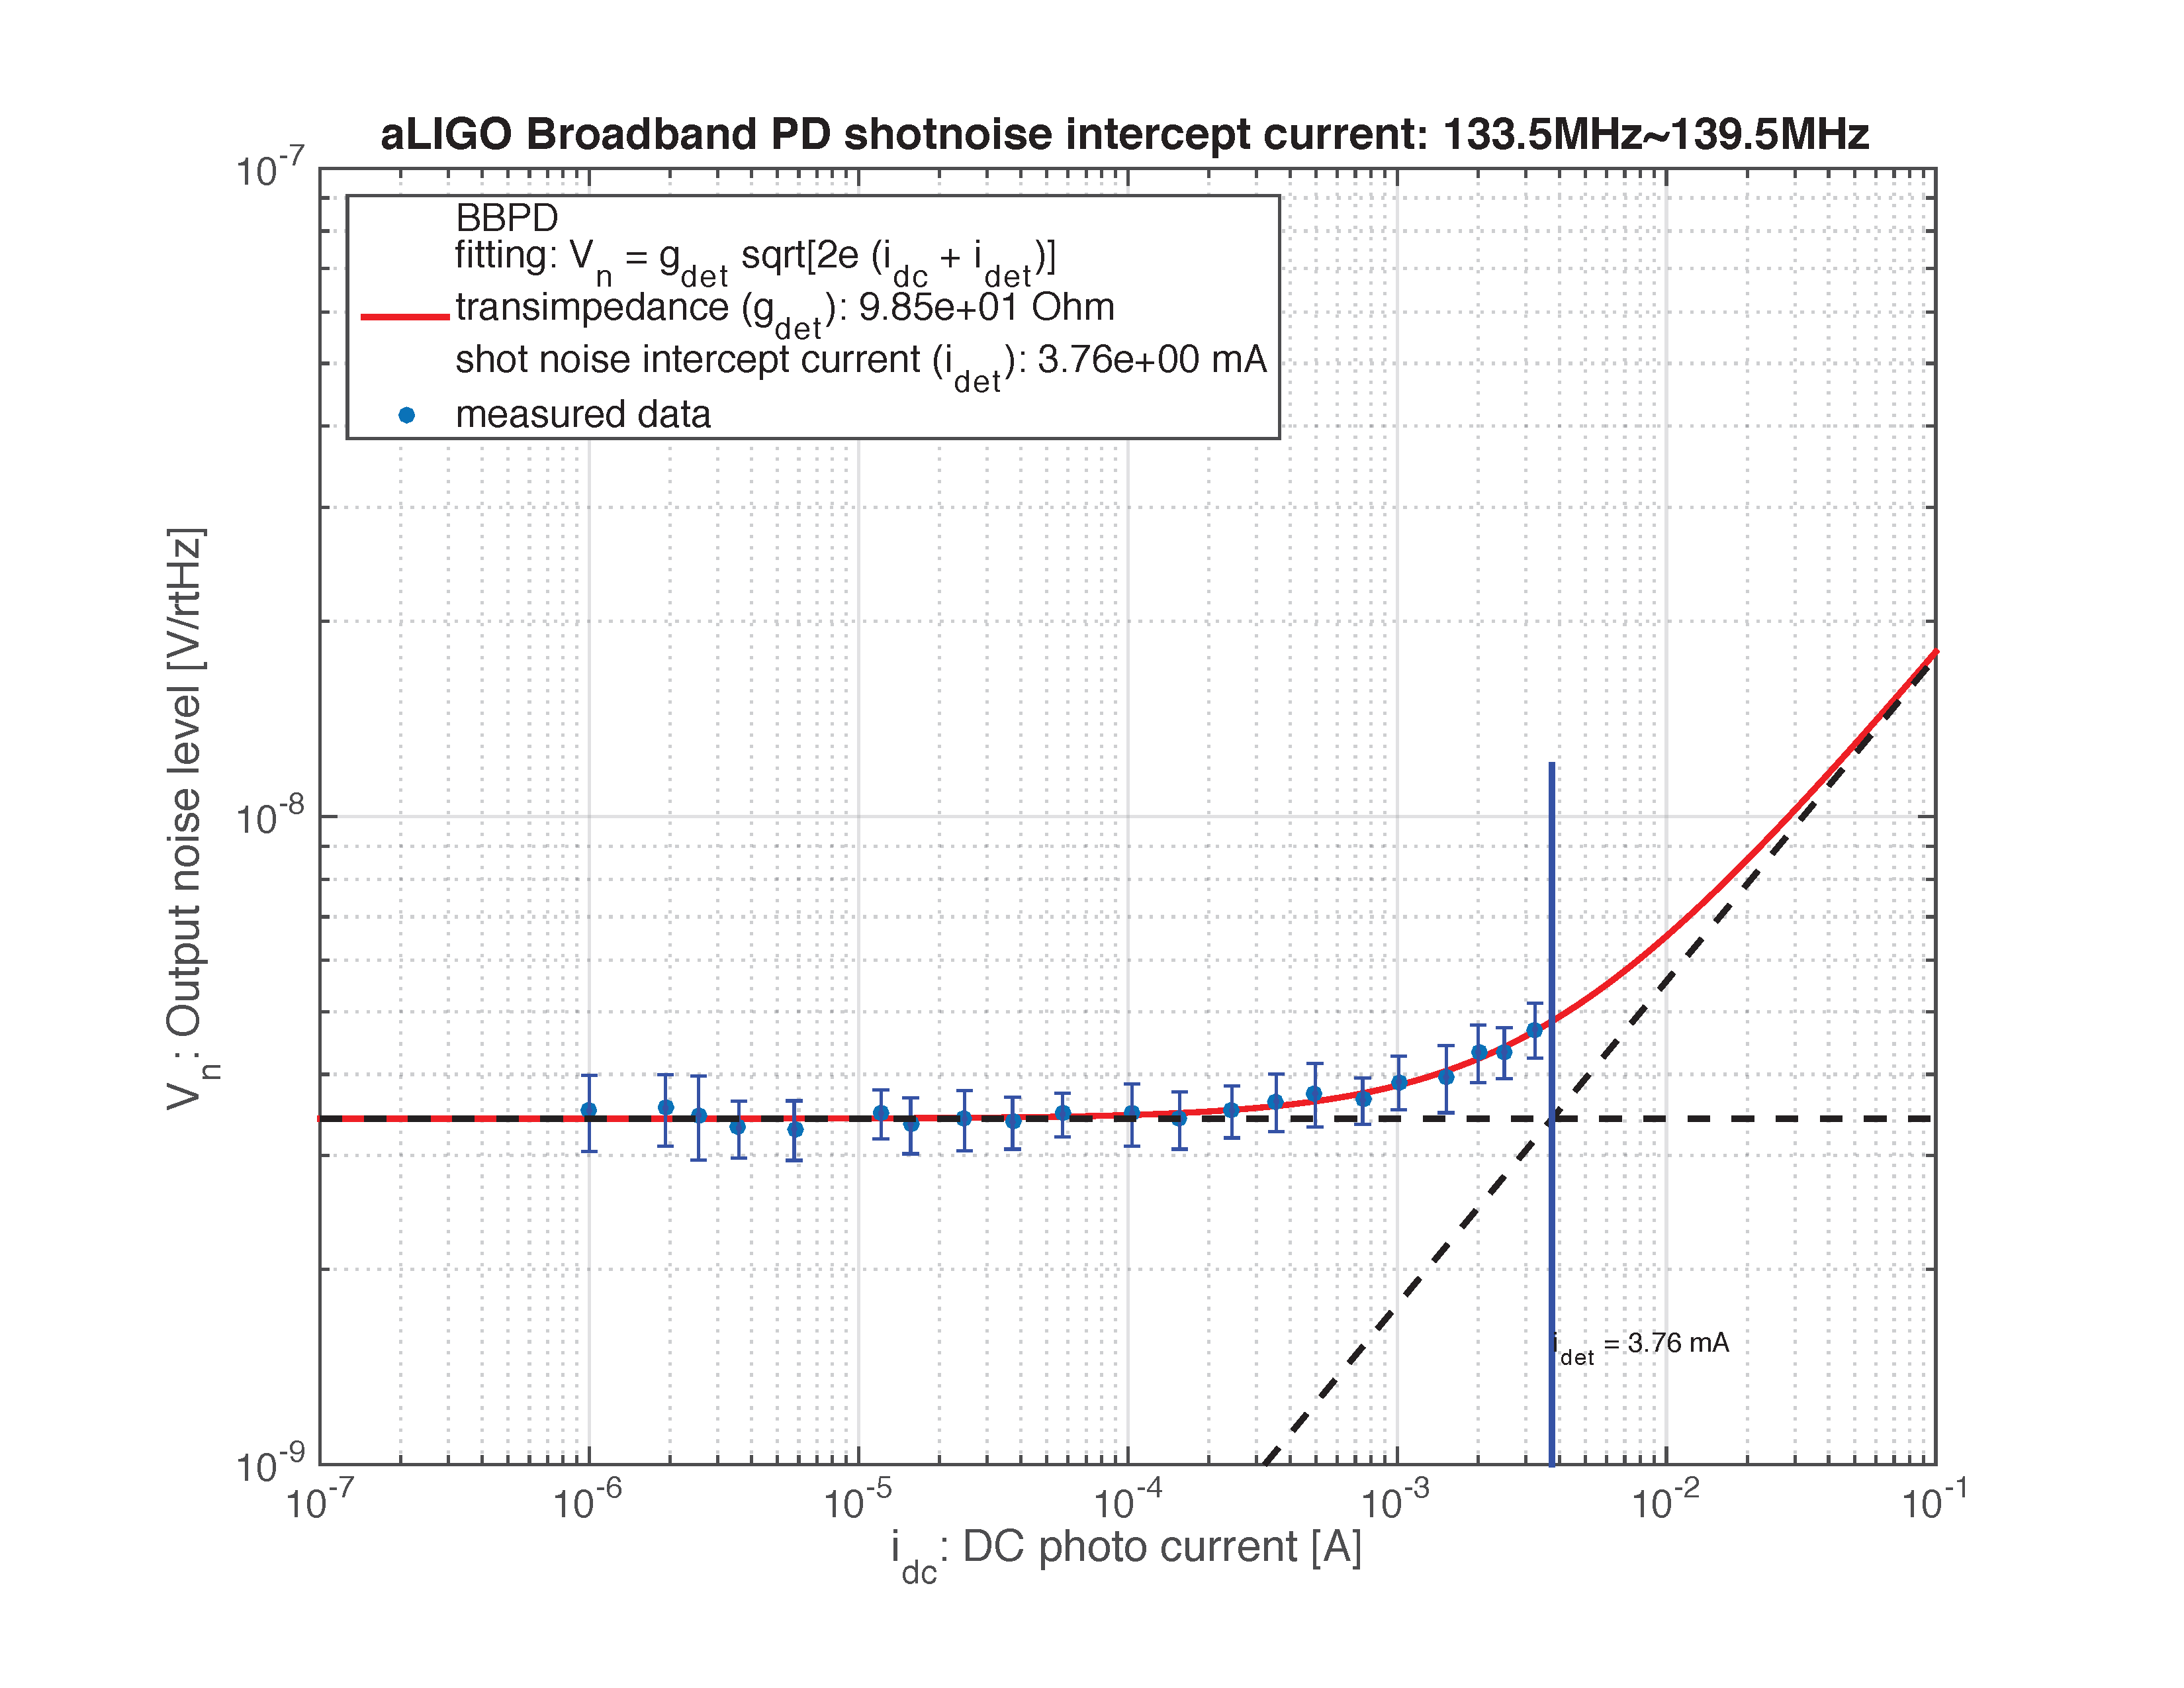
135MHz: Transimpedance 98.5Ohm, Shot noise interept current 3.8mA
These numbers are as expected.
In the attachments the following results are found:
- Schematic diagram
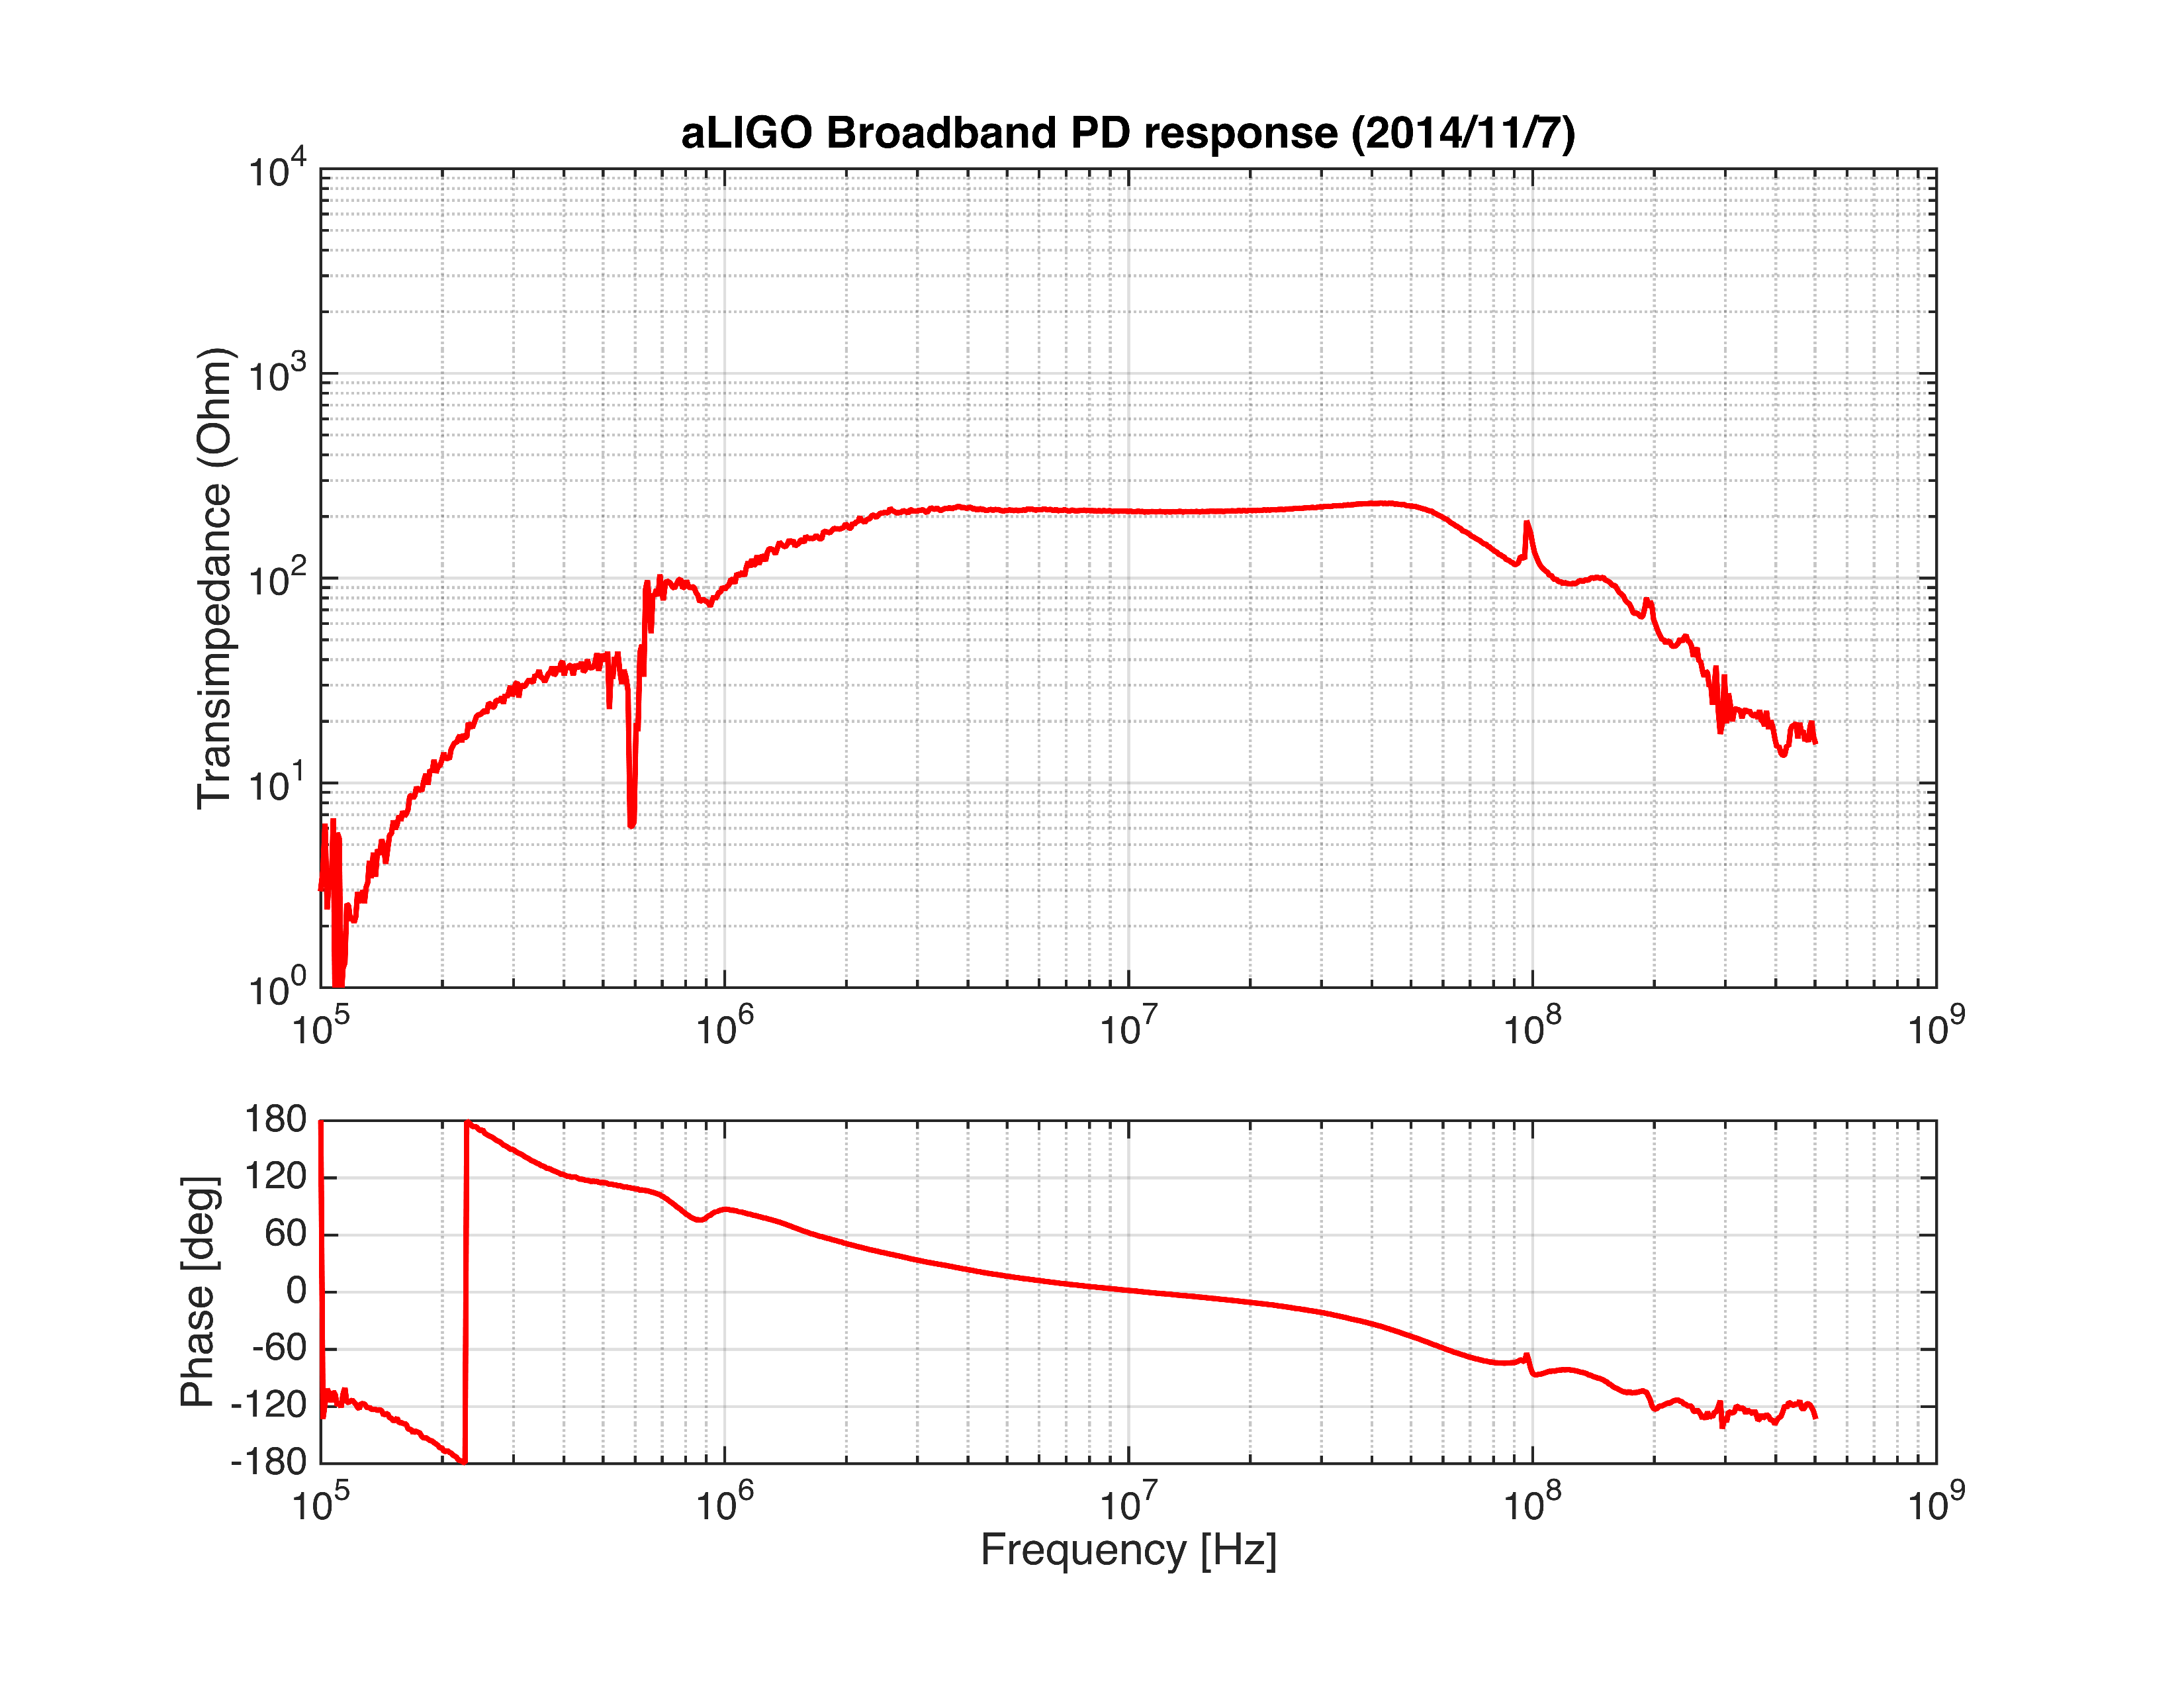
- Transimpedance (0.1-500MHz)
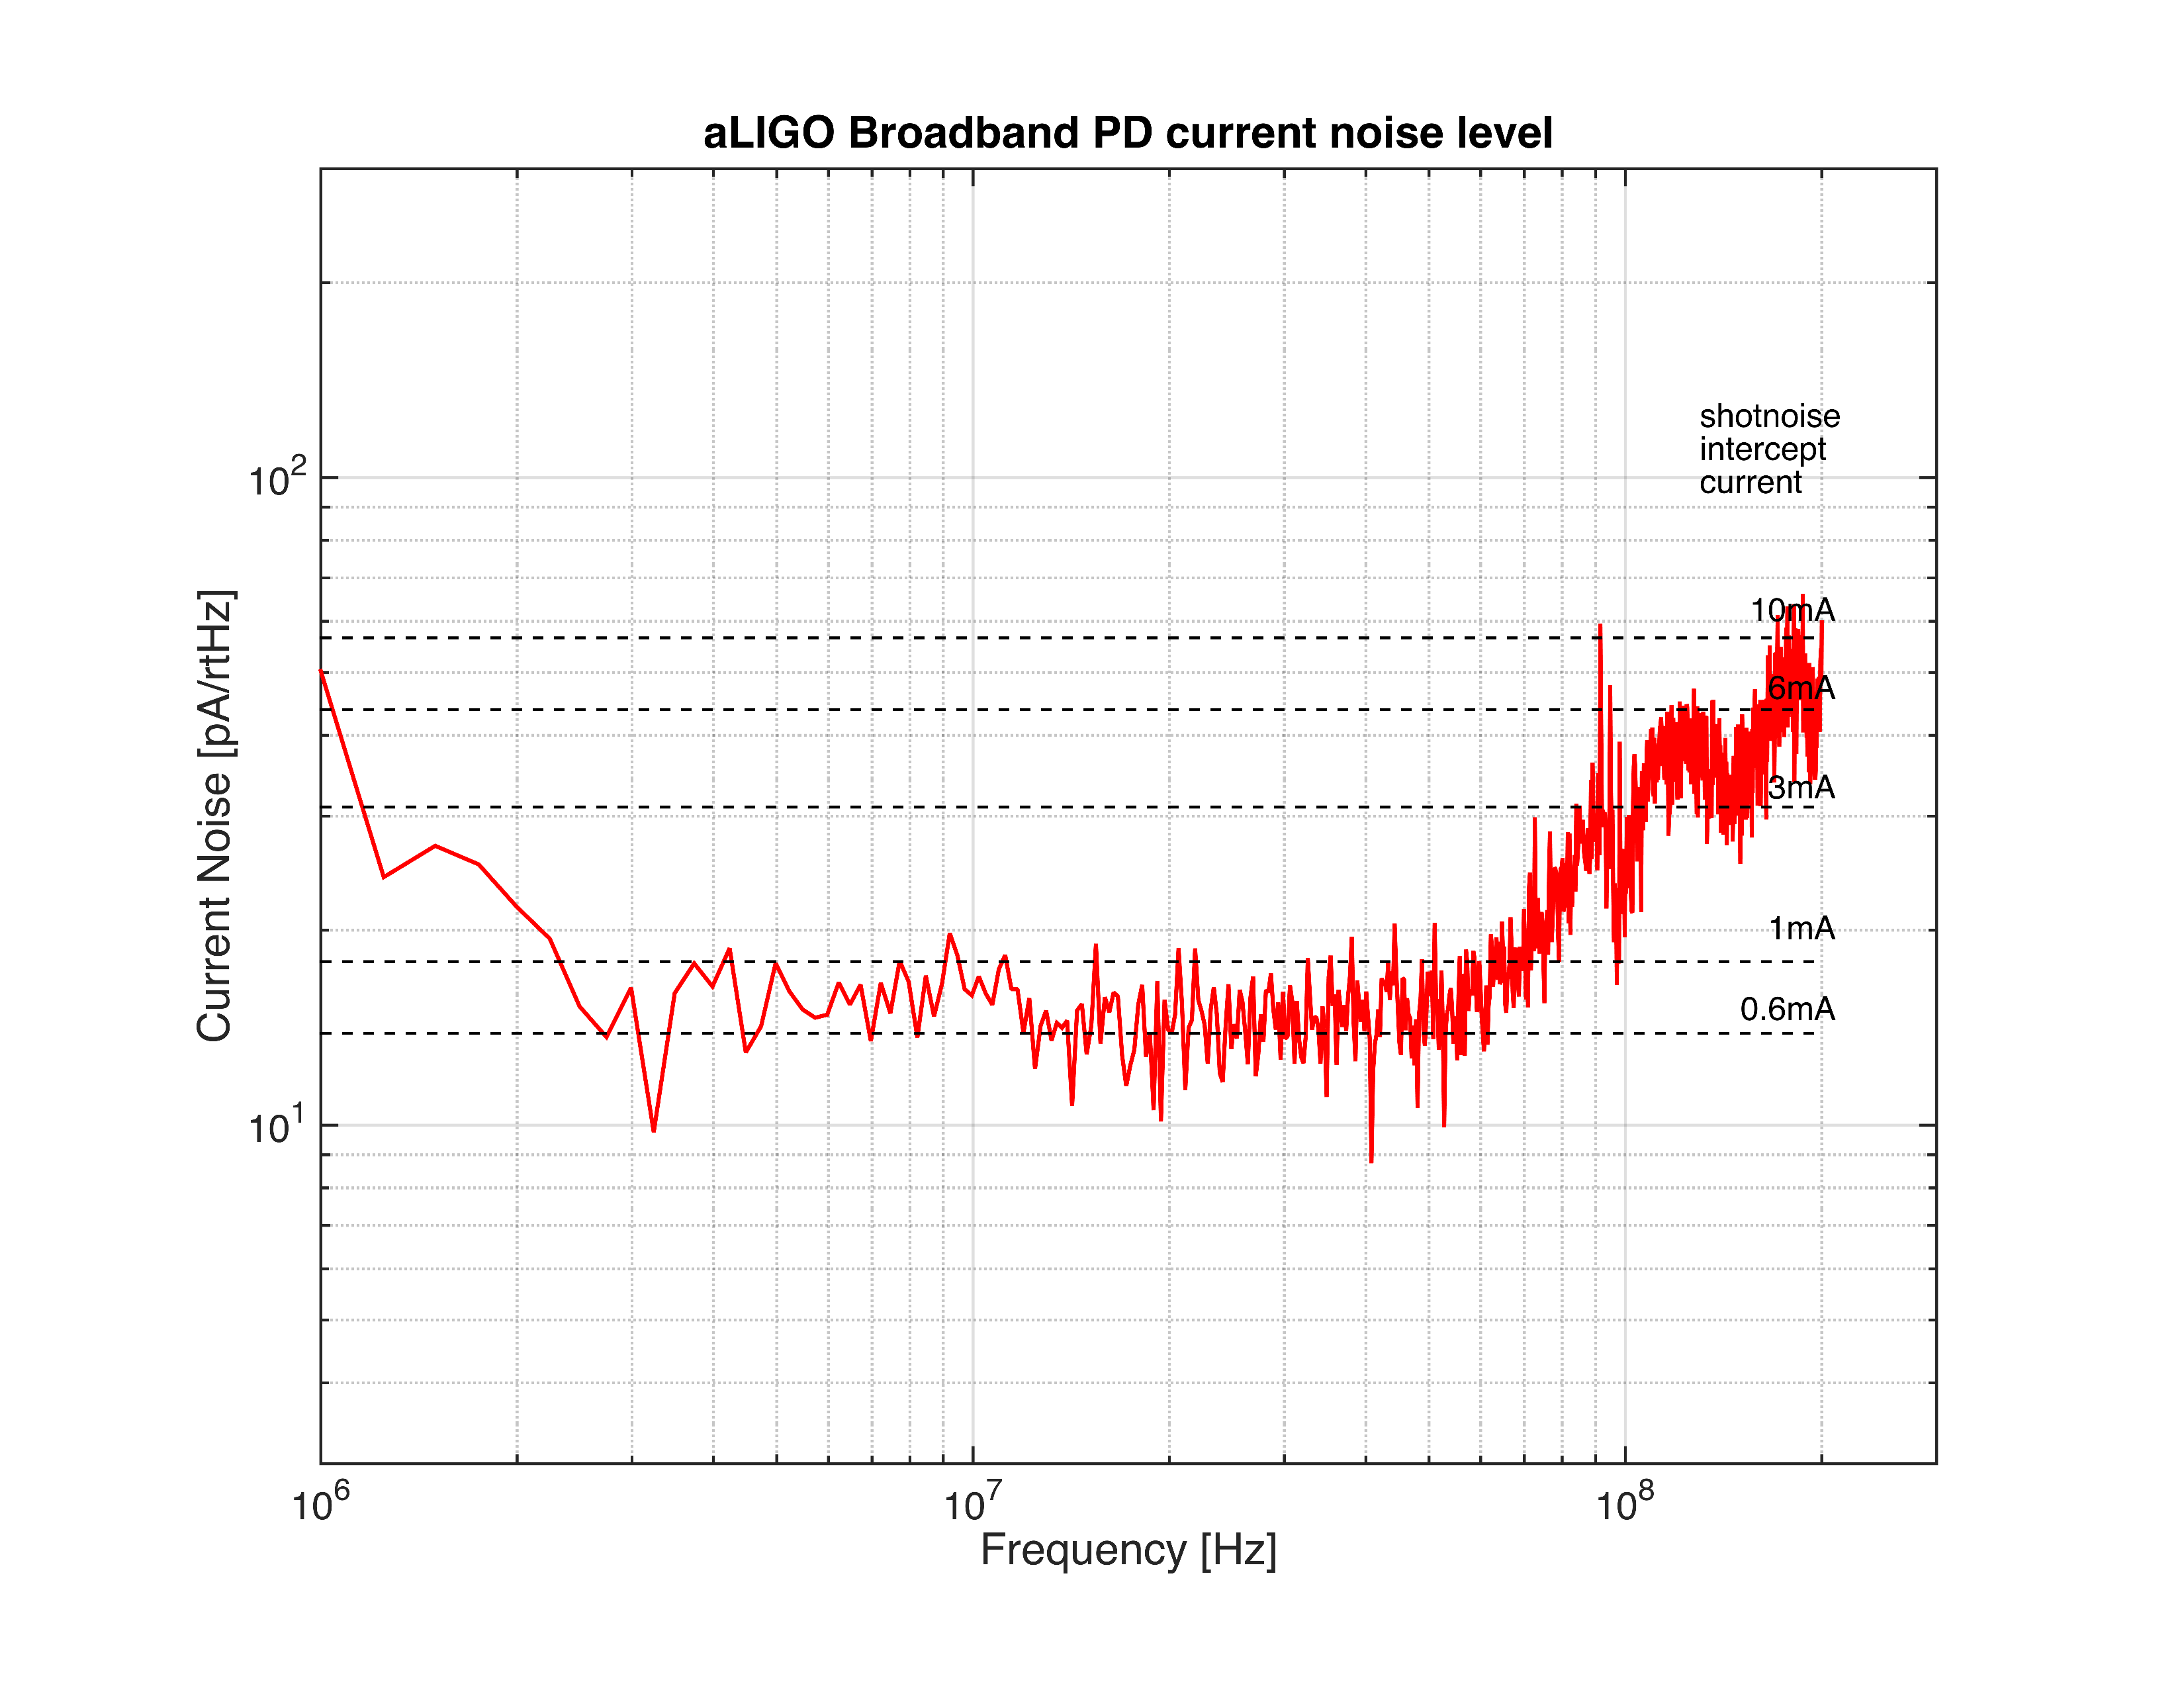
- Current noise level
- Transimpedance/Shot noise intercept current measurement with incandescent light at 27MHz and 135MHz
- IP2/IP3 measurement (same as before)