evan.goetz@LIGO.ORG - posted 12:27, Thursday 23 January 2025 - last comment - 16:59, Thursday 23 January 2025(82420)
Preliminary look at 524k and 16k DCPD data before and after additional anti-alias filtering
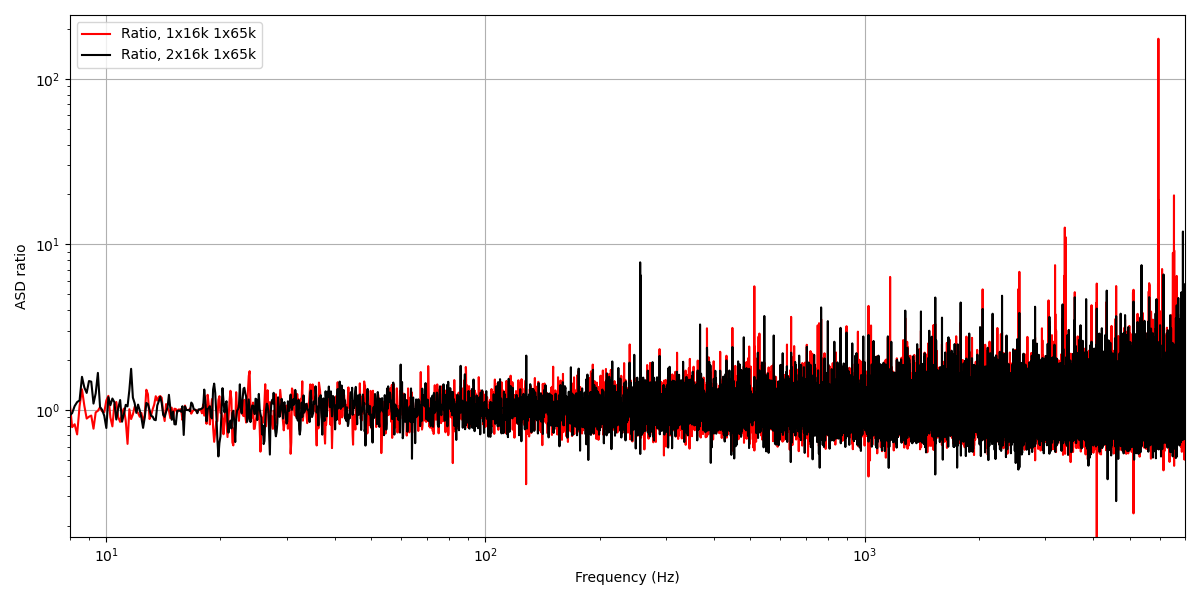
E. Goetz, J. Kissel, L. Dartez

In previous aLOGs (see, e.g., LHO aLOG 82405), we had to decimate the 524 kHz data offline in order to evaluate the improvement of TEST channels with changes to anti-alias filtering. We expected to see a reduction in artifacts with the addition of 1 extra 65-16k decimation filter. Attached is a figure showing before and after the ratio of ASDs calculated in DTT from the DCPD A0 channel (not the TEST A channels). This figure shows some improvements (though perhaps hard to see visually) and introduces more questions, especially comparing to a plot like in LHO aLOG 82405, attached here as well.

Statistics:
Bins above 1% before = 33416
Bins above 1% after = 30273
Bins above 1% before, f < 2000 Hz = 9011
Bins above 1% after, f < 2000 Hz = 8362
Mean before = 1.1087
Mean after = 1.0651
Mean before, f < 2000 Hz = 1.0756
Mean after, f < 2000 = 1.0495

So we do see that the number of bins above 1% has gone down as expected (good), but the raw number of bins above 1% is much different than our expectations. Figure 1 simply seems far noisier than Figure 2. What is the cause of this? It would seem to imply that the IOP downsampling is not simply grabbing 1 value for every 32 samples in a consistent manner, or perhaps the way DTT grabs and exports the PSD data? I'll have to keep digging, but this seems strange
Images attached to this report

Comments related to this report
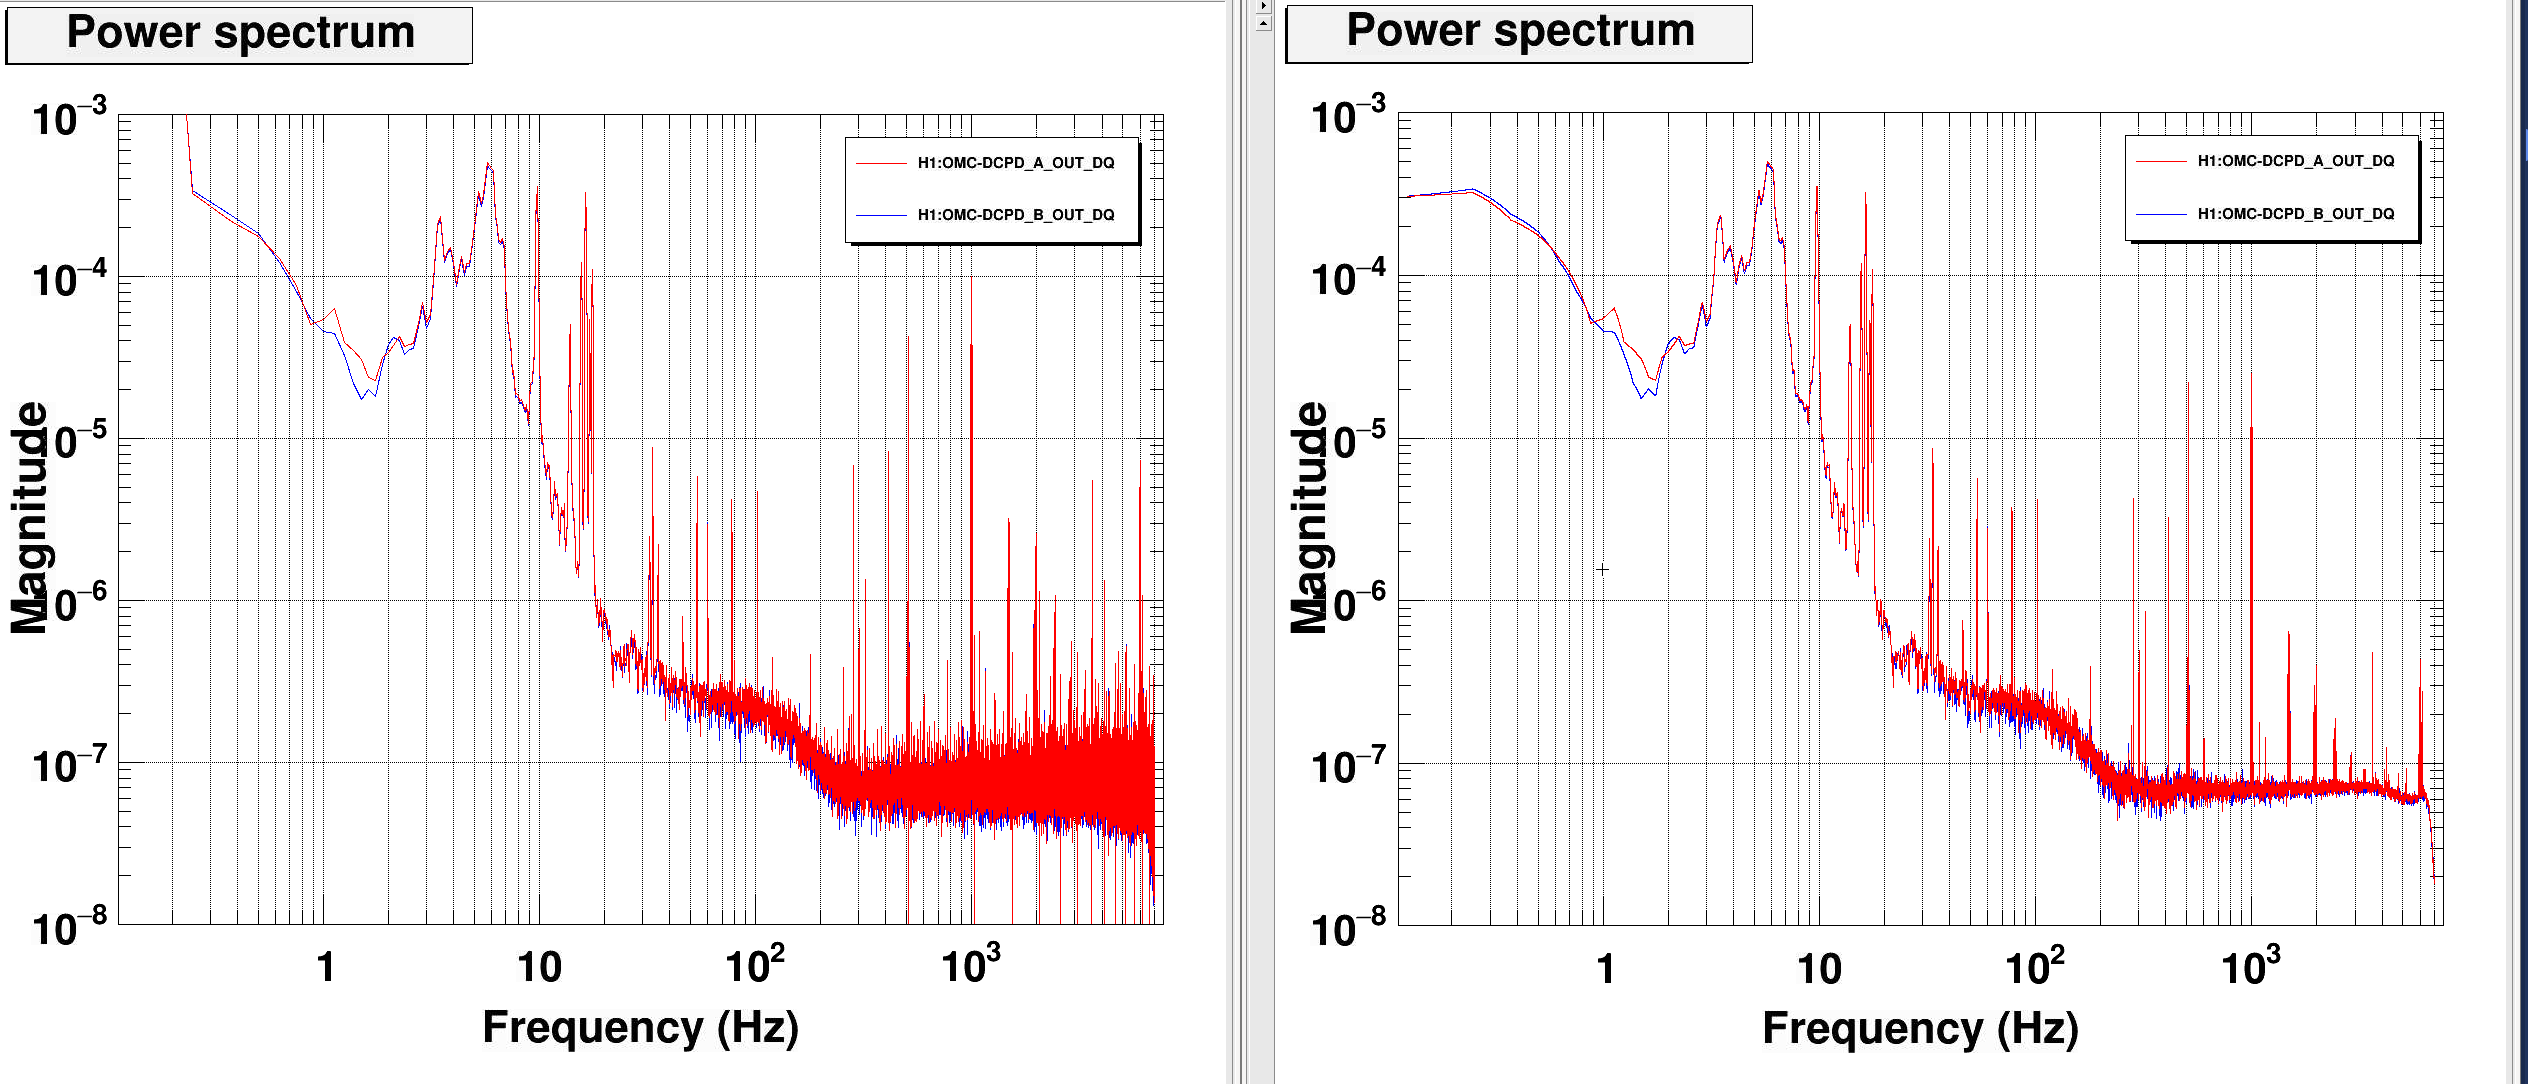
This may be improved by using a the double precision version of diaggui, 'diaggui_test', creates much less noisy ASDs, especially at higher frequencies.
In the attached image, single precision ASD is on the left and double precision is i on the right.
Images attached to this comment
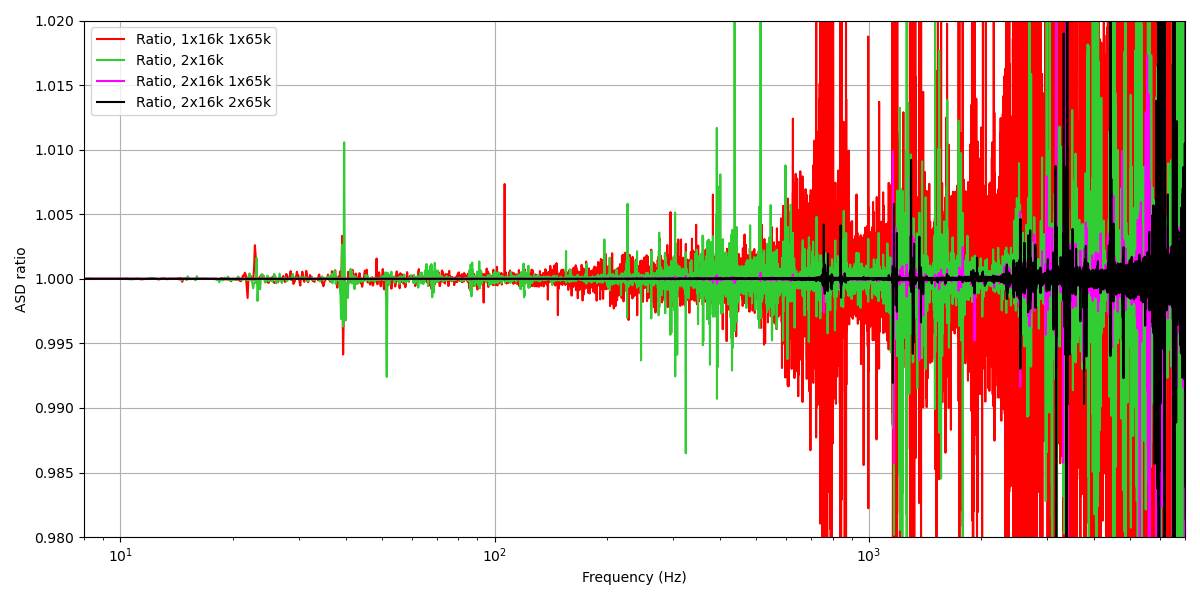
There may be a DTT export precision issue at play here with the ASD as Erik suggests. I wanted to carry out a time series analysis offline, so I exported all of the data before and after for the 16k (H1:OMC-DCPD_A_OUT_DQ) and 524k (H1:OMC-DCPD_A0_OUT) channels. Then I computed the PSD of the 524k channel and 16k channel, plus downsampling the 524k channel and computing the PSD.

Then I plot the ratio of the 16k PSD over the 524k PSD (cut off to the 16k Nyquist) to inspect the data for excess noise before and after the addition of the extra 65-16k downsampling filter. I don't understand the red curve, but the blue curve seems reasonable, as well as the black and grey curves. The blue curve shows excess noise that is then suppressed by the additional filter seen in the absence of large ratio values in the black and gray curves.

This result shows that the extra filtering is helpful, but until we can push a new calibration, we'll have to hold off adding it in.
Images attached to this comment


