The first new Guardian daemons are now running!
The IMC is now fully under guardian control. The guardian components are (given by their full guardian identifier):
-
ISC_IMC
-
/opt/rtcds/userapps/release/ioo/common/guardian/ISC_IMC.py
-
handles H1:IMC- channels
-
SUS_MC2
-
/opt/rtcds/userapps/release/sus/common/guardian/SUS_MC2.py
-
handles H1:SUS-MC2 channels. Currently this is inheriting from the generic SUS module (/opt/rtcds/userapps/release/sus/common/guardian/SUS.py), and adding additional control states on top.
-
IFO_IMC
-
/opt/rtcds/userapps/release/sys/common/guardian/IFO_IMC.py
-
IMC manager that controls both ISC_IMC and SUS_MC2 guardians
The paths listed are the fulls paths to the guardian system description modules that are being executed for each guardian process. Given a system identifier FOO, guardian looks for a python module named FOO.py in the common/guardian subdirectories of the various relevant subsystems in the userapps path.
The IFO_IMC manager is the top level control. It instructs SUS_MC2 and ISC_IMC to go to their ACQUIRE states if the IMC is not locked, and then transitions SUS_MC2 to turn on boost filters after ISC_IMC guardian reports that the IMC lock has been achieved. If ISC_IMC looses lock, IFO_IMC sees this and moves SUS_MC2 and ISC_IMC back to their ACQUIRE states.
MEDM interface
The primary interface for controlling the processes is their medm screens, which are accessible from the "GRD" menu in the sitemap:
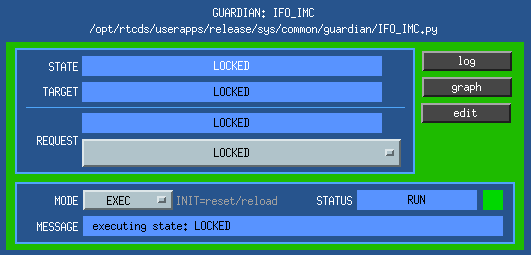
The REQUEST button selects the requested state of the system. The MODE button selects the operational mode of the guardian process. EXEC indicates that it is executing guardian code. The STATUS reflects the guardian process status. In this case, the IFO_IMC guardian is executing the RUN method of the LOCKED state.
The buttons at the upper right allow for displaying the log of the daemon, displaying the current system graph, and editing the underlying system module code.
guardian daemon controls
All three guardian processes are running under the new guardian control infrastructure on h1guardian0:
controls@operator1:~ 0$ guardctrl list
IFO_IMC * run: IFO_IMC: (pid 8739) 7805s, want down; run: log: (pid 13060) 78412s
ISC_IMC * run: ISC_IMC: (pid 6400) 9332s, want down; run: log: (pid 1346) 66758s
SUS_MC2 * run: SUS_MC2: (pid 2208) 66732s, want down; run: log: (pid 2050) 66737s
SUS_SR2 * run: SUS_SR2: (pid 32679) 96154s, want down; run: log: (pid 23722) 230173s
controls@operator1:~ 0$
The guardctrl command line interface can be used to start/stop/restart the daemon process, as well as create new ones as needed.
TODO
Some immediate todo task for the next week:
-
The rest of the IMC suspensions (at least MC1 and MC3, and maybe others?) need to be brought under the control of IFO_IMC. These should be ready to go now
-
The base SUS module needs to be improved to properly handle watchdog trips, and other potential critical deviations of the suspensions.
-
Add HAM2 ISI under IFO_IMC. This depends on status of the ISI code, which may be ready next week.
-
Add GRD MEDM overview
-
Add GRD channels to frames
There are also an ever-growing list of guardian bugs (not a bad thing at this point, since it means the system is actually being used now) that I will start filling in in the new guardian bugzilla (thanks Jonathan).