Sheila, Keita, Alexa
Temperature changes in end X (from turning on or off cleanrooms) can mislaign the refl diode. The behavoir in the X end seems similar to what was seen at the Y end in July (alog 7146).
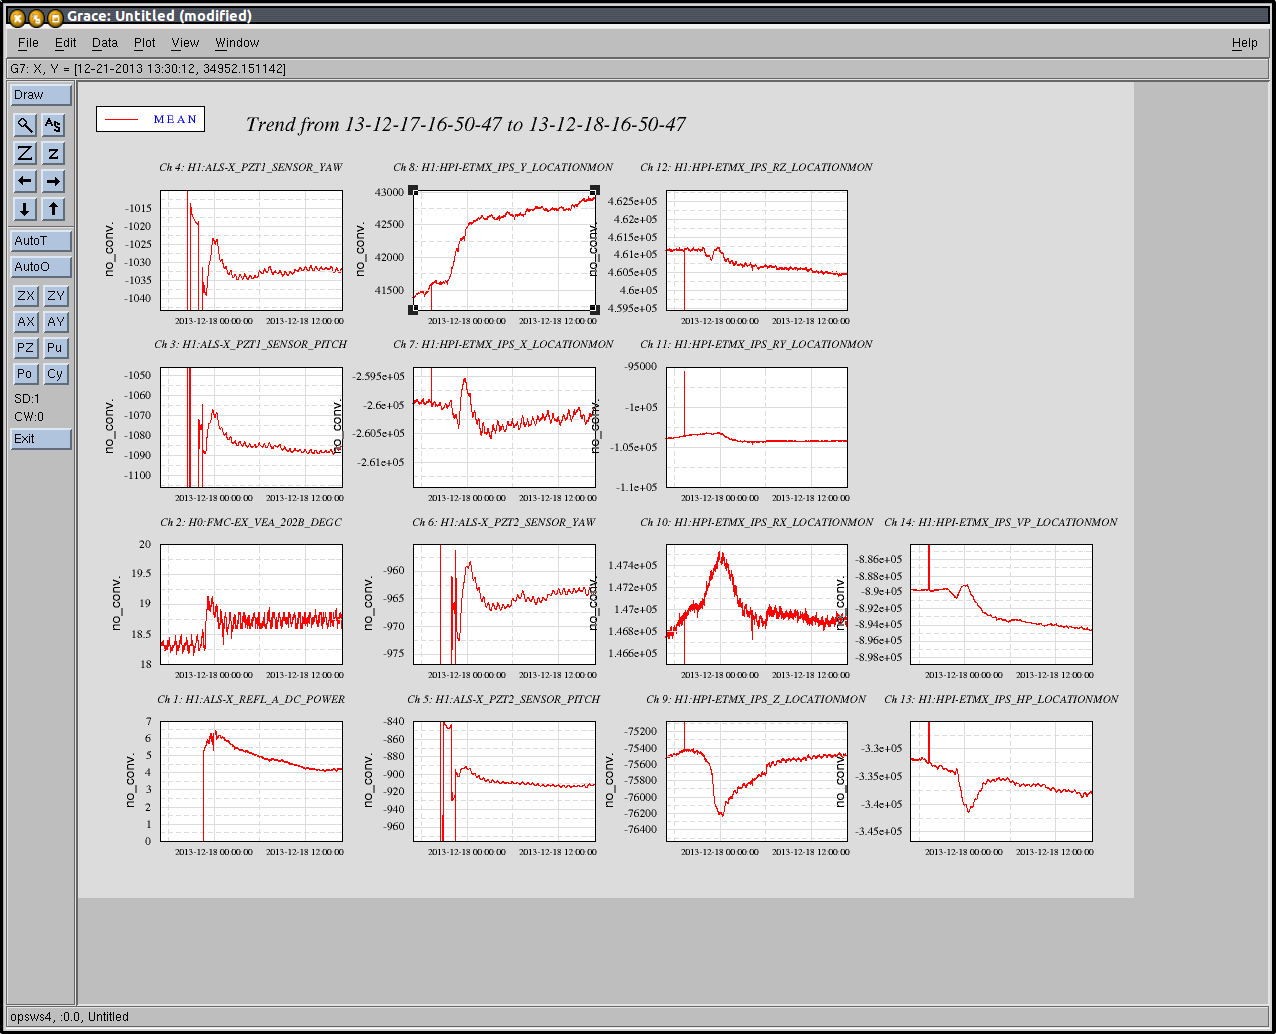
After Alexa realinged the TMSX yesterday (alog 8987) and turned the cleanroom on again, there was a temperature change by about 0.5 deg C in 202B. as the temperature settled you can see the drfit in the ALS input PZT sensors, the retro-reflected beam started to fall off the diode, and there were drifts in HEPI sensors, and bosems. (attached plots) I fixed the calibration for the PZT sensors (they are urad now) just before Alexa did her realignment, that is why there are no earlier trends that are usefull.
I recovered the beam on the diode by moving TMSX just now (11:50 UTC), I moved it by +4urad in YAW. The current alingment offsets are 13urad PIT, -319 urad Yaw.
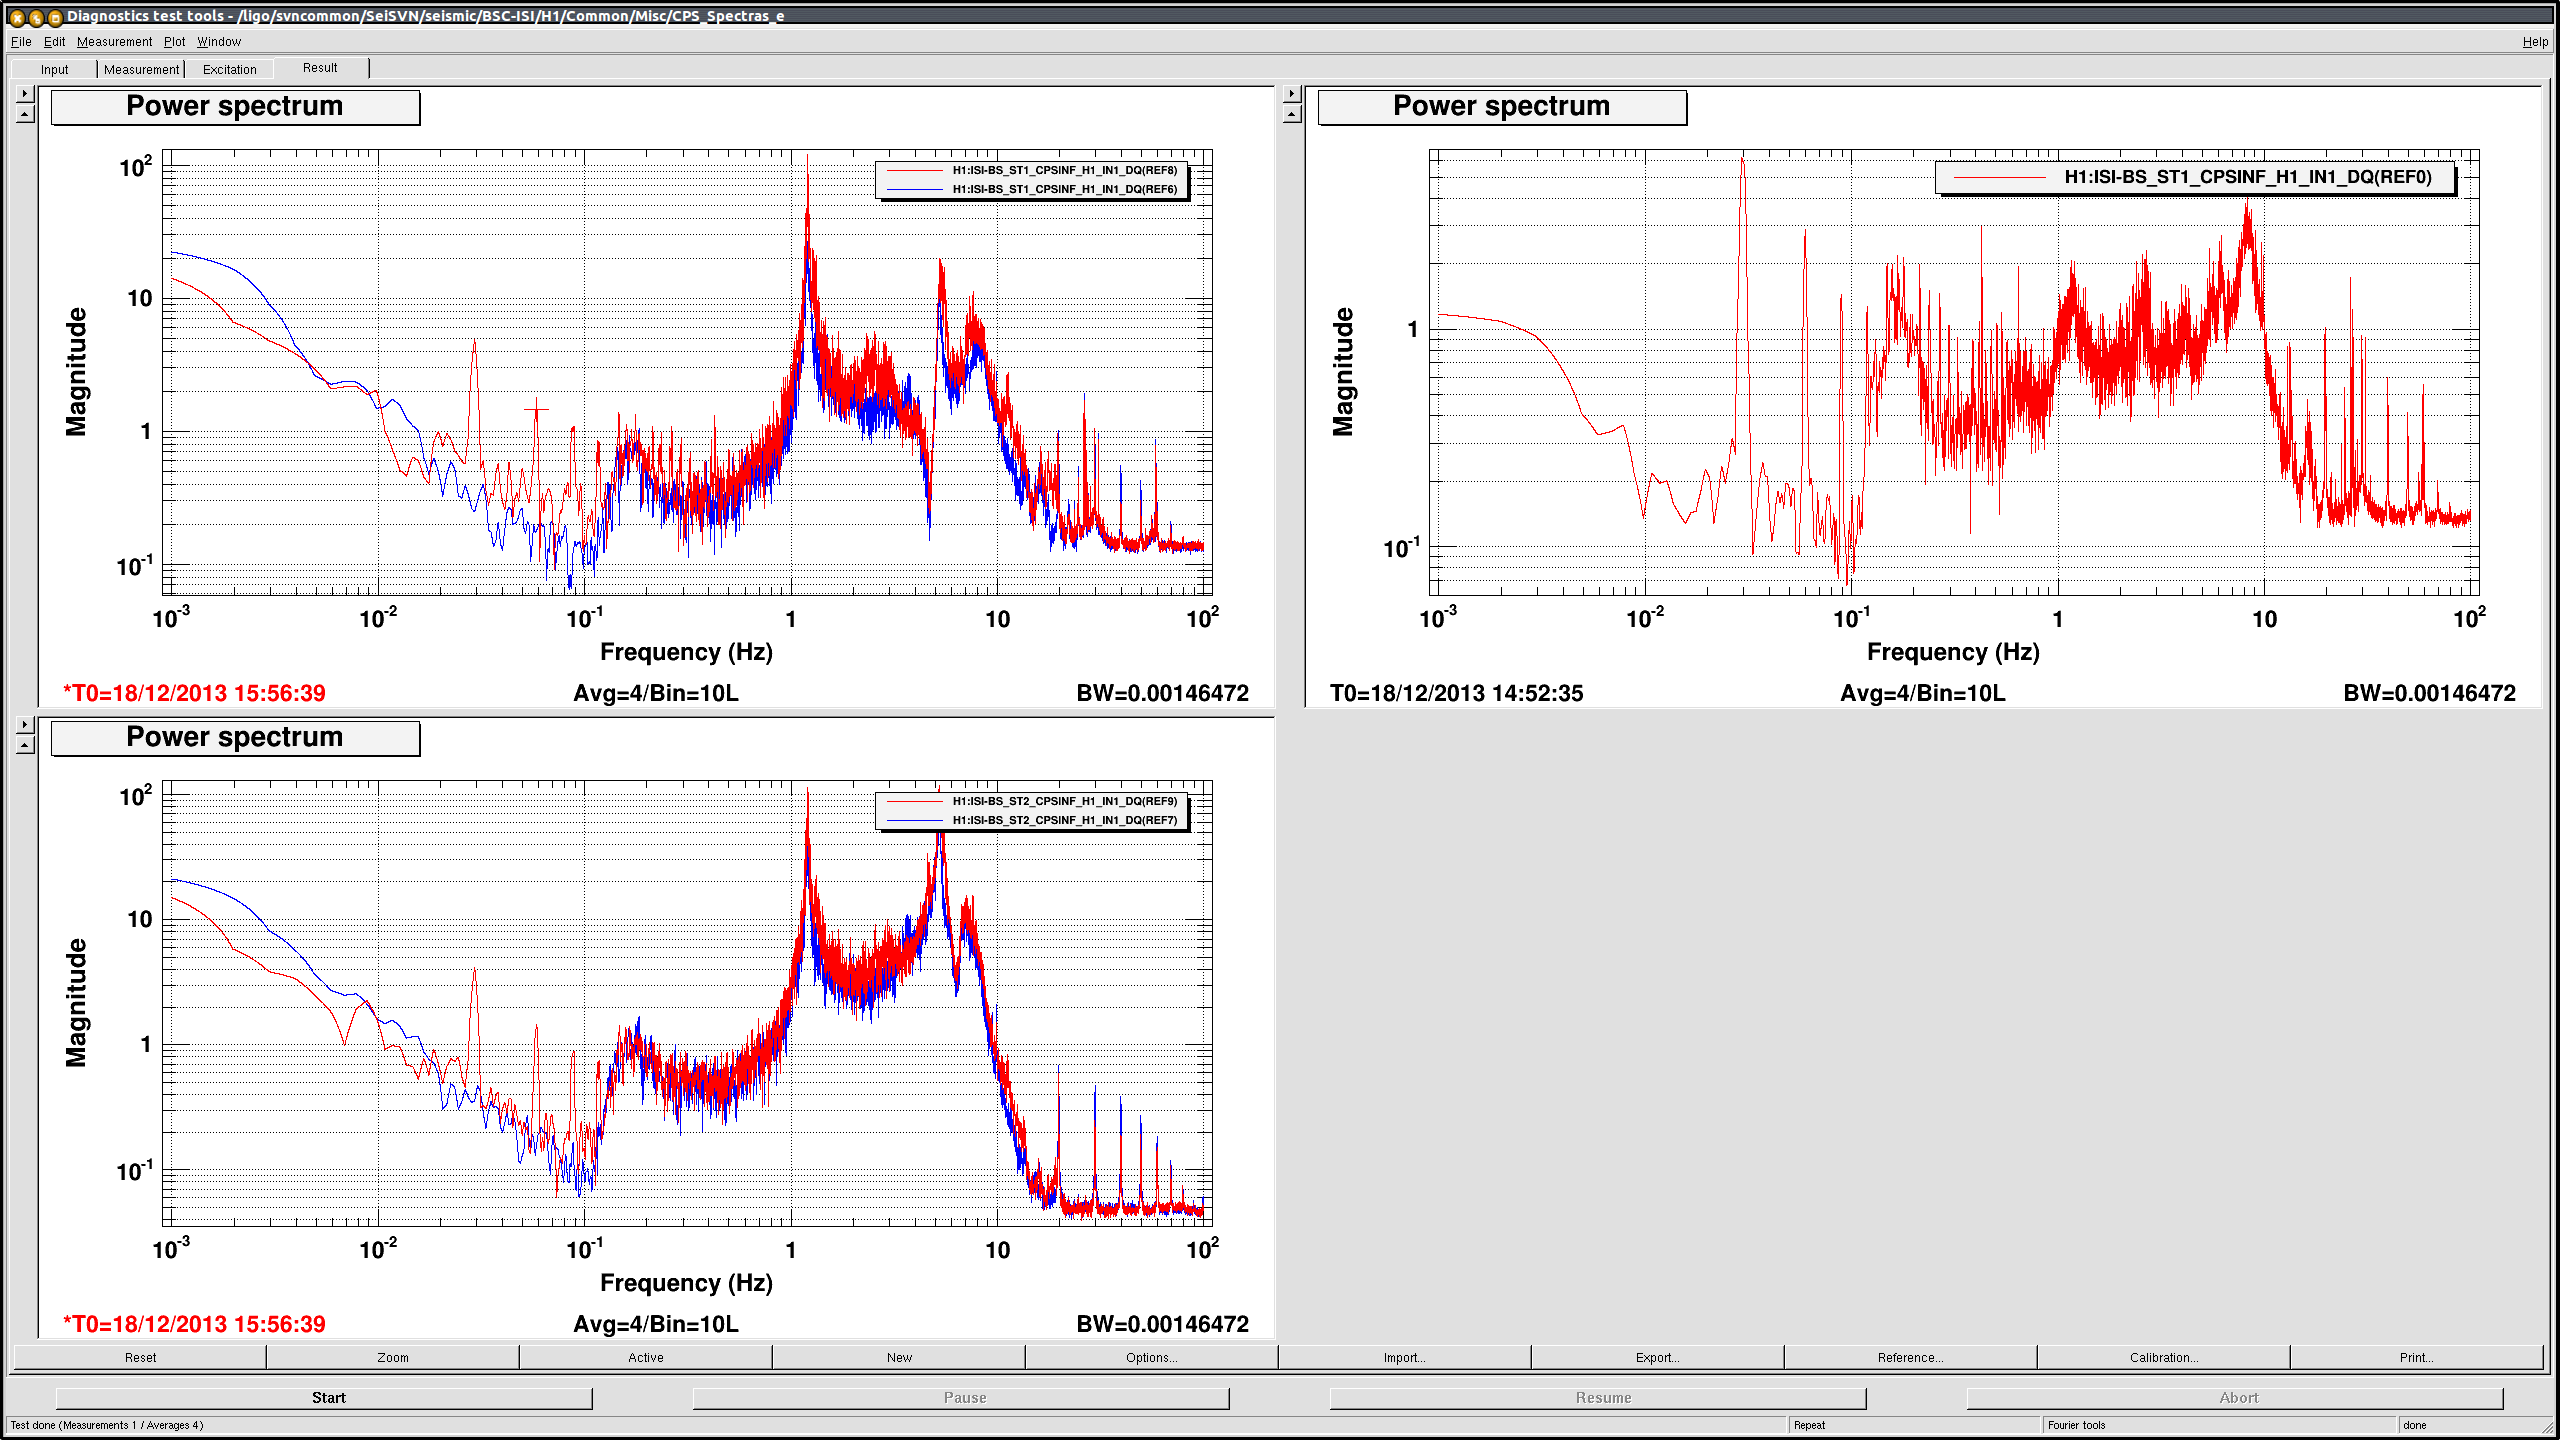
HEPI moved less than 1urad in RZ, not enough to explain the shift we saw. Fabrice said that this amount of motion is not surprising, but that it would be reduced once position loops are commisioned. The TMS bosems do indicate a change of 4urad in yaw (I'm not sure if there is a relative minus sign or not) Jeff suggested I look at the ISI CPS, it seems like the changes due to the temperature chage are less than 100 nrad in RZ and RY, for both stage 1 and stage2.
Conclusion:
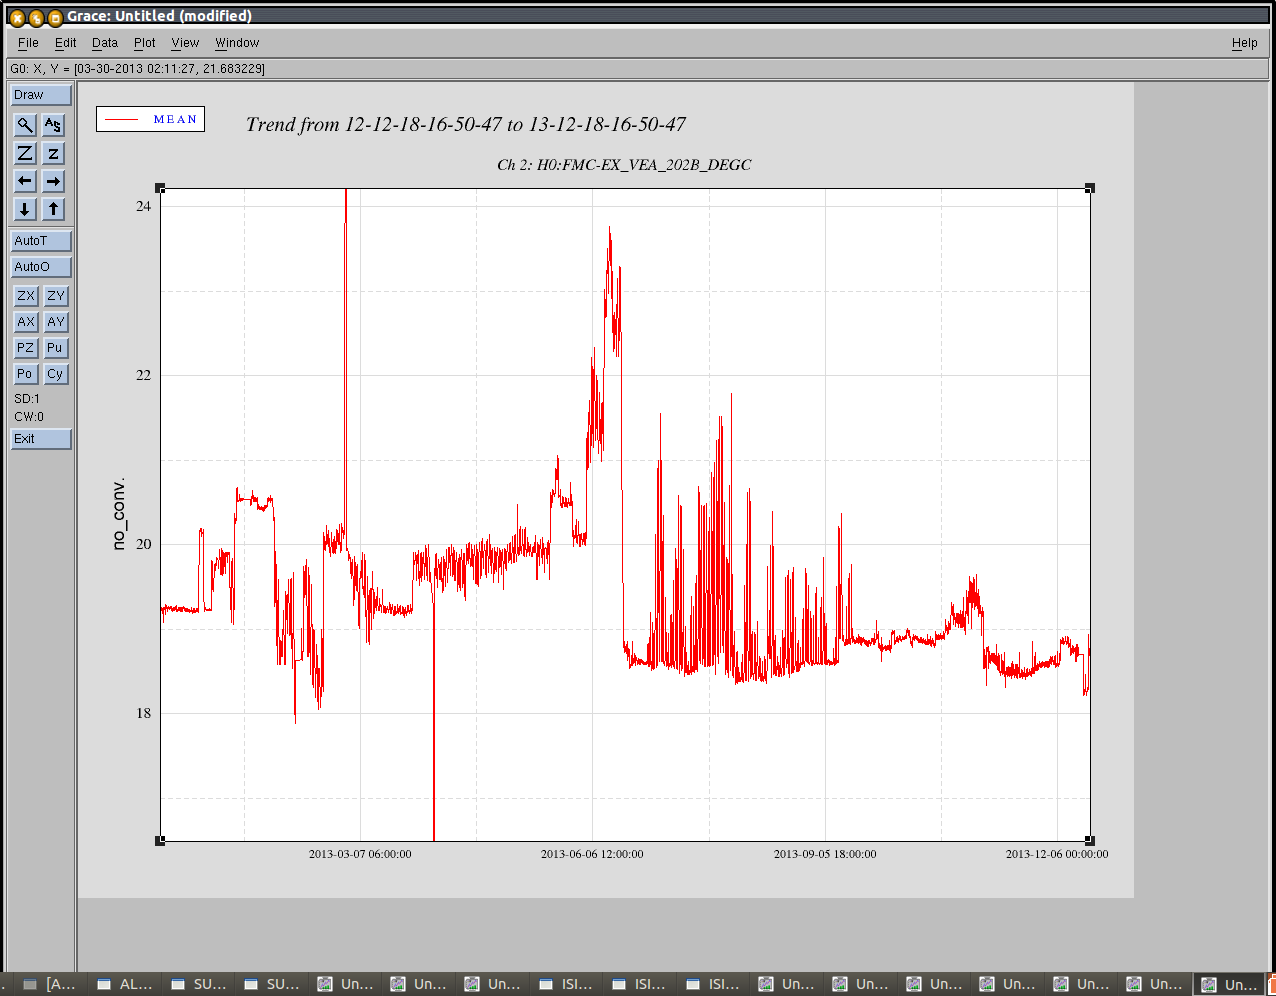
Temperature changes of less than 1 degree C can shift the TMS alingment by 4urad, this is enough to misaling the ALS refl diode. The last plot attached is a one year trend of the temperature at end X, temperature shifts by about a degree C are not unusual, so we may need to find a long term solution for alignment onto this diode. The short term solution is just to leave the cleanroom off.
I will leave things alone for a few more hours to make sure the alignment stays stable after my realingment, then turn the cleanroom off again tonight.
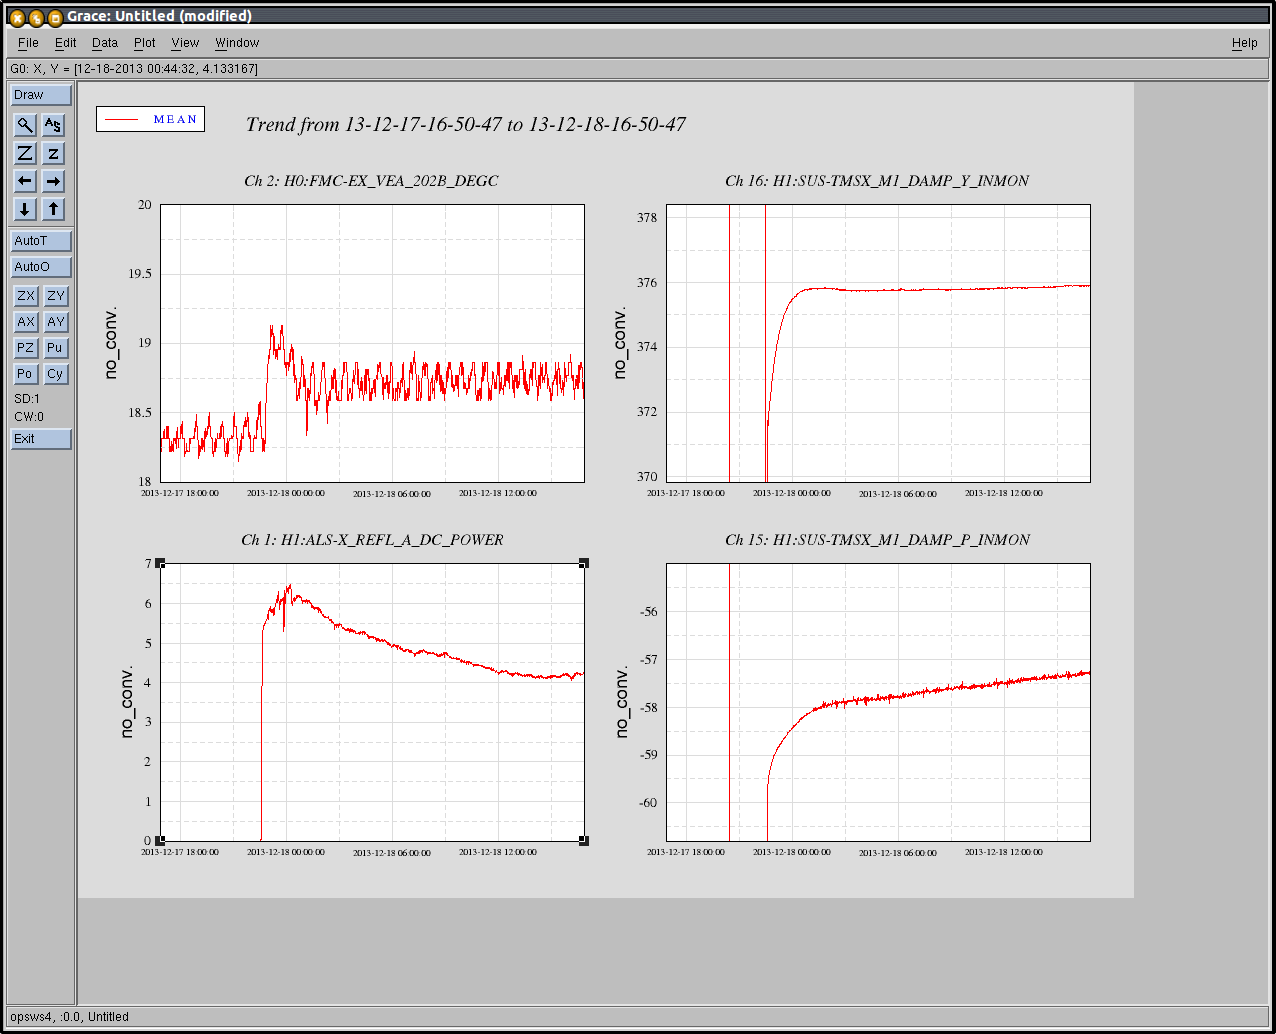
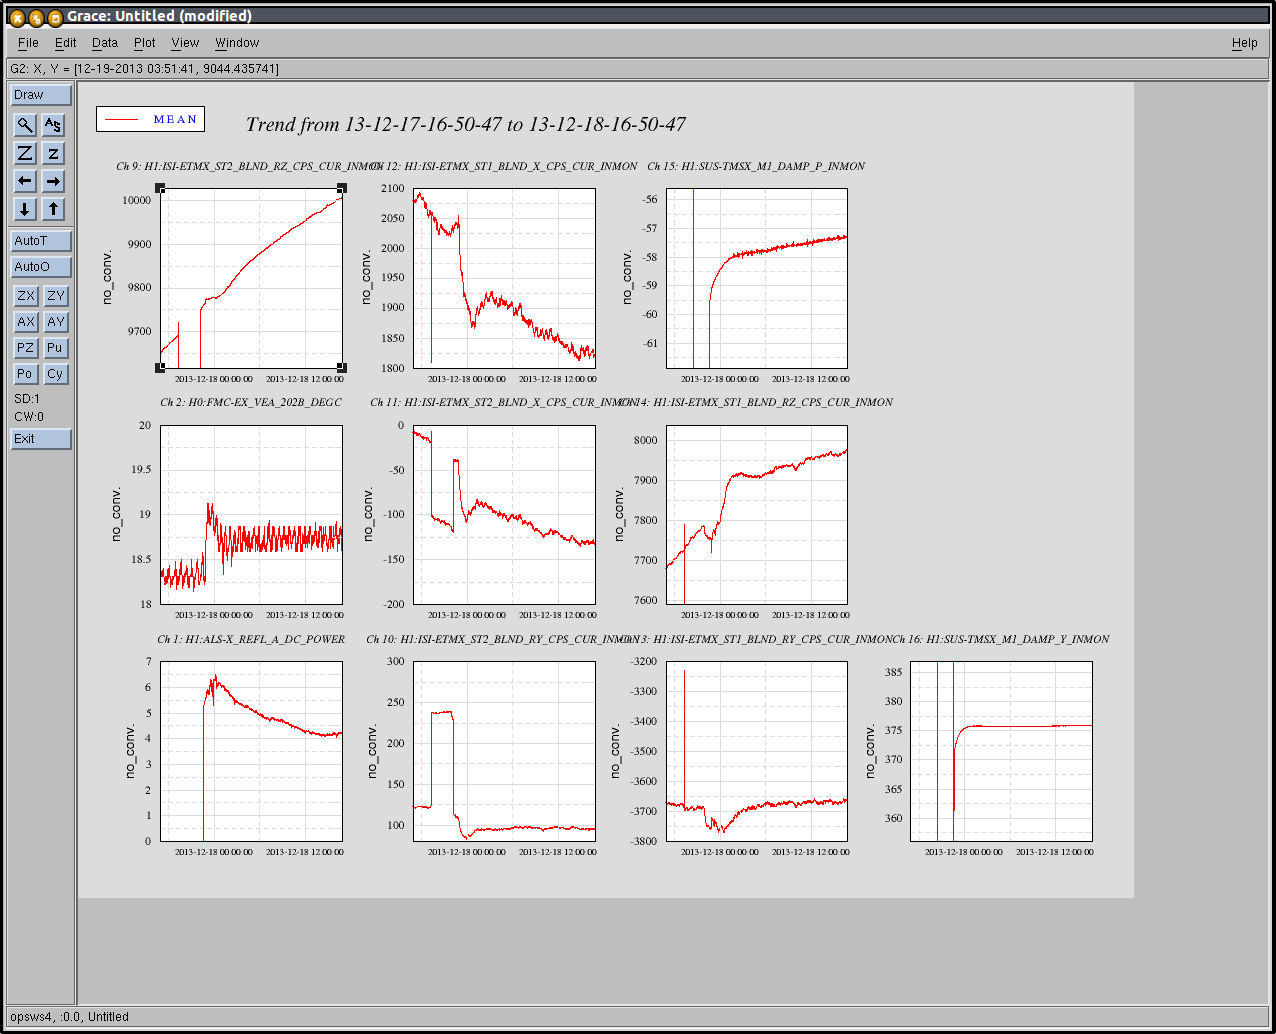
A quick additional info regarding the HEPI sag:

Maraging steel's change of modulus is roughly 1e-4/C, and the HEPI springs elongation is roughly of 1e-2m. So the order of magnitude of the vertical sag should be near 1um/C, which is what is observed in channel 9 (in nm), and it seems to couple to over degrees of freedoms with similar amplitudes.

This will be rejected by the servo-controls once they are installed on this chamber.