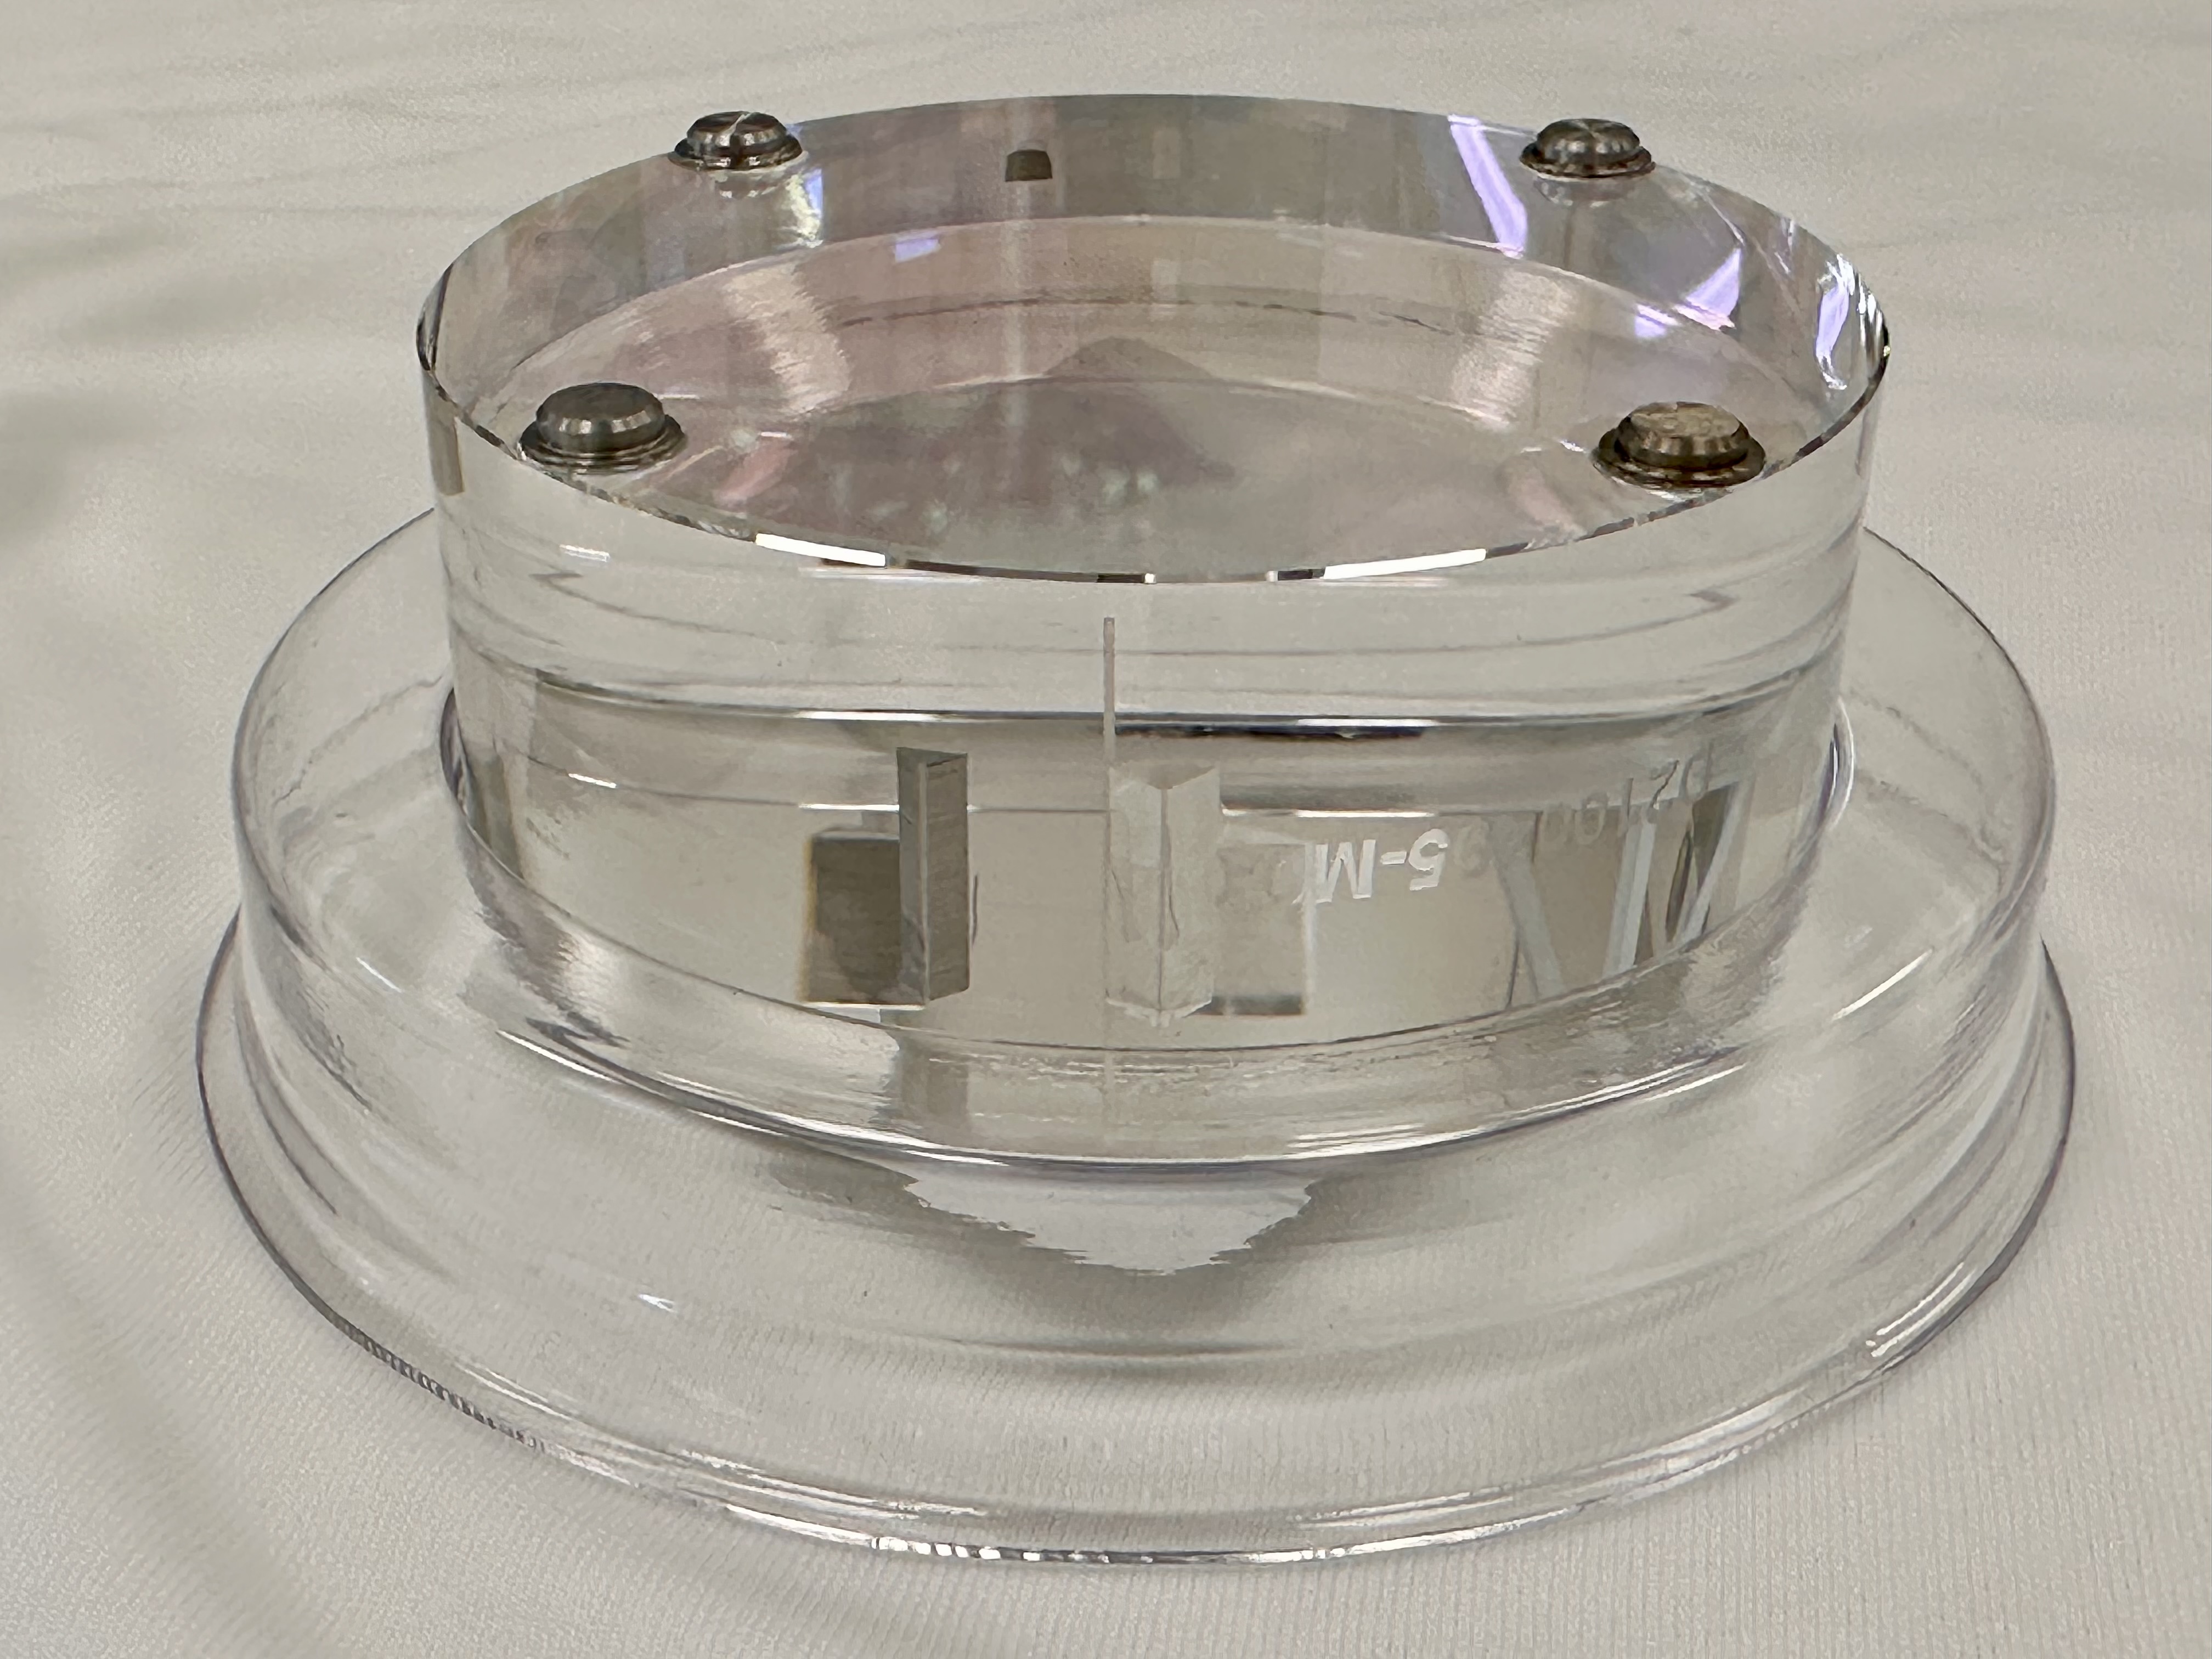
Beam dump for HAM1-HAM2 septum window AR reflection.
This was installed.
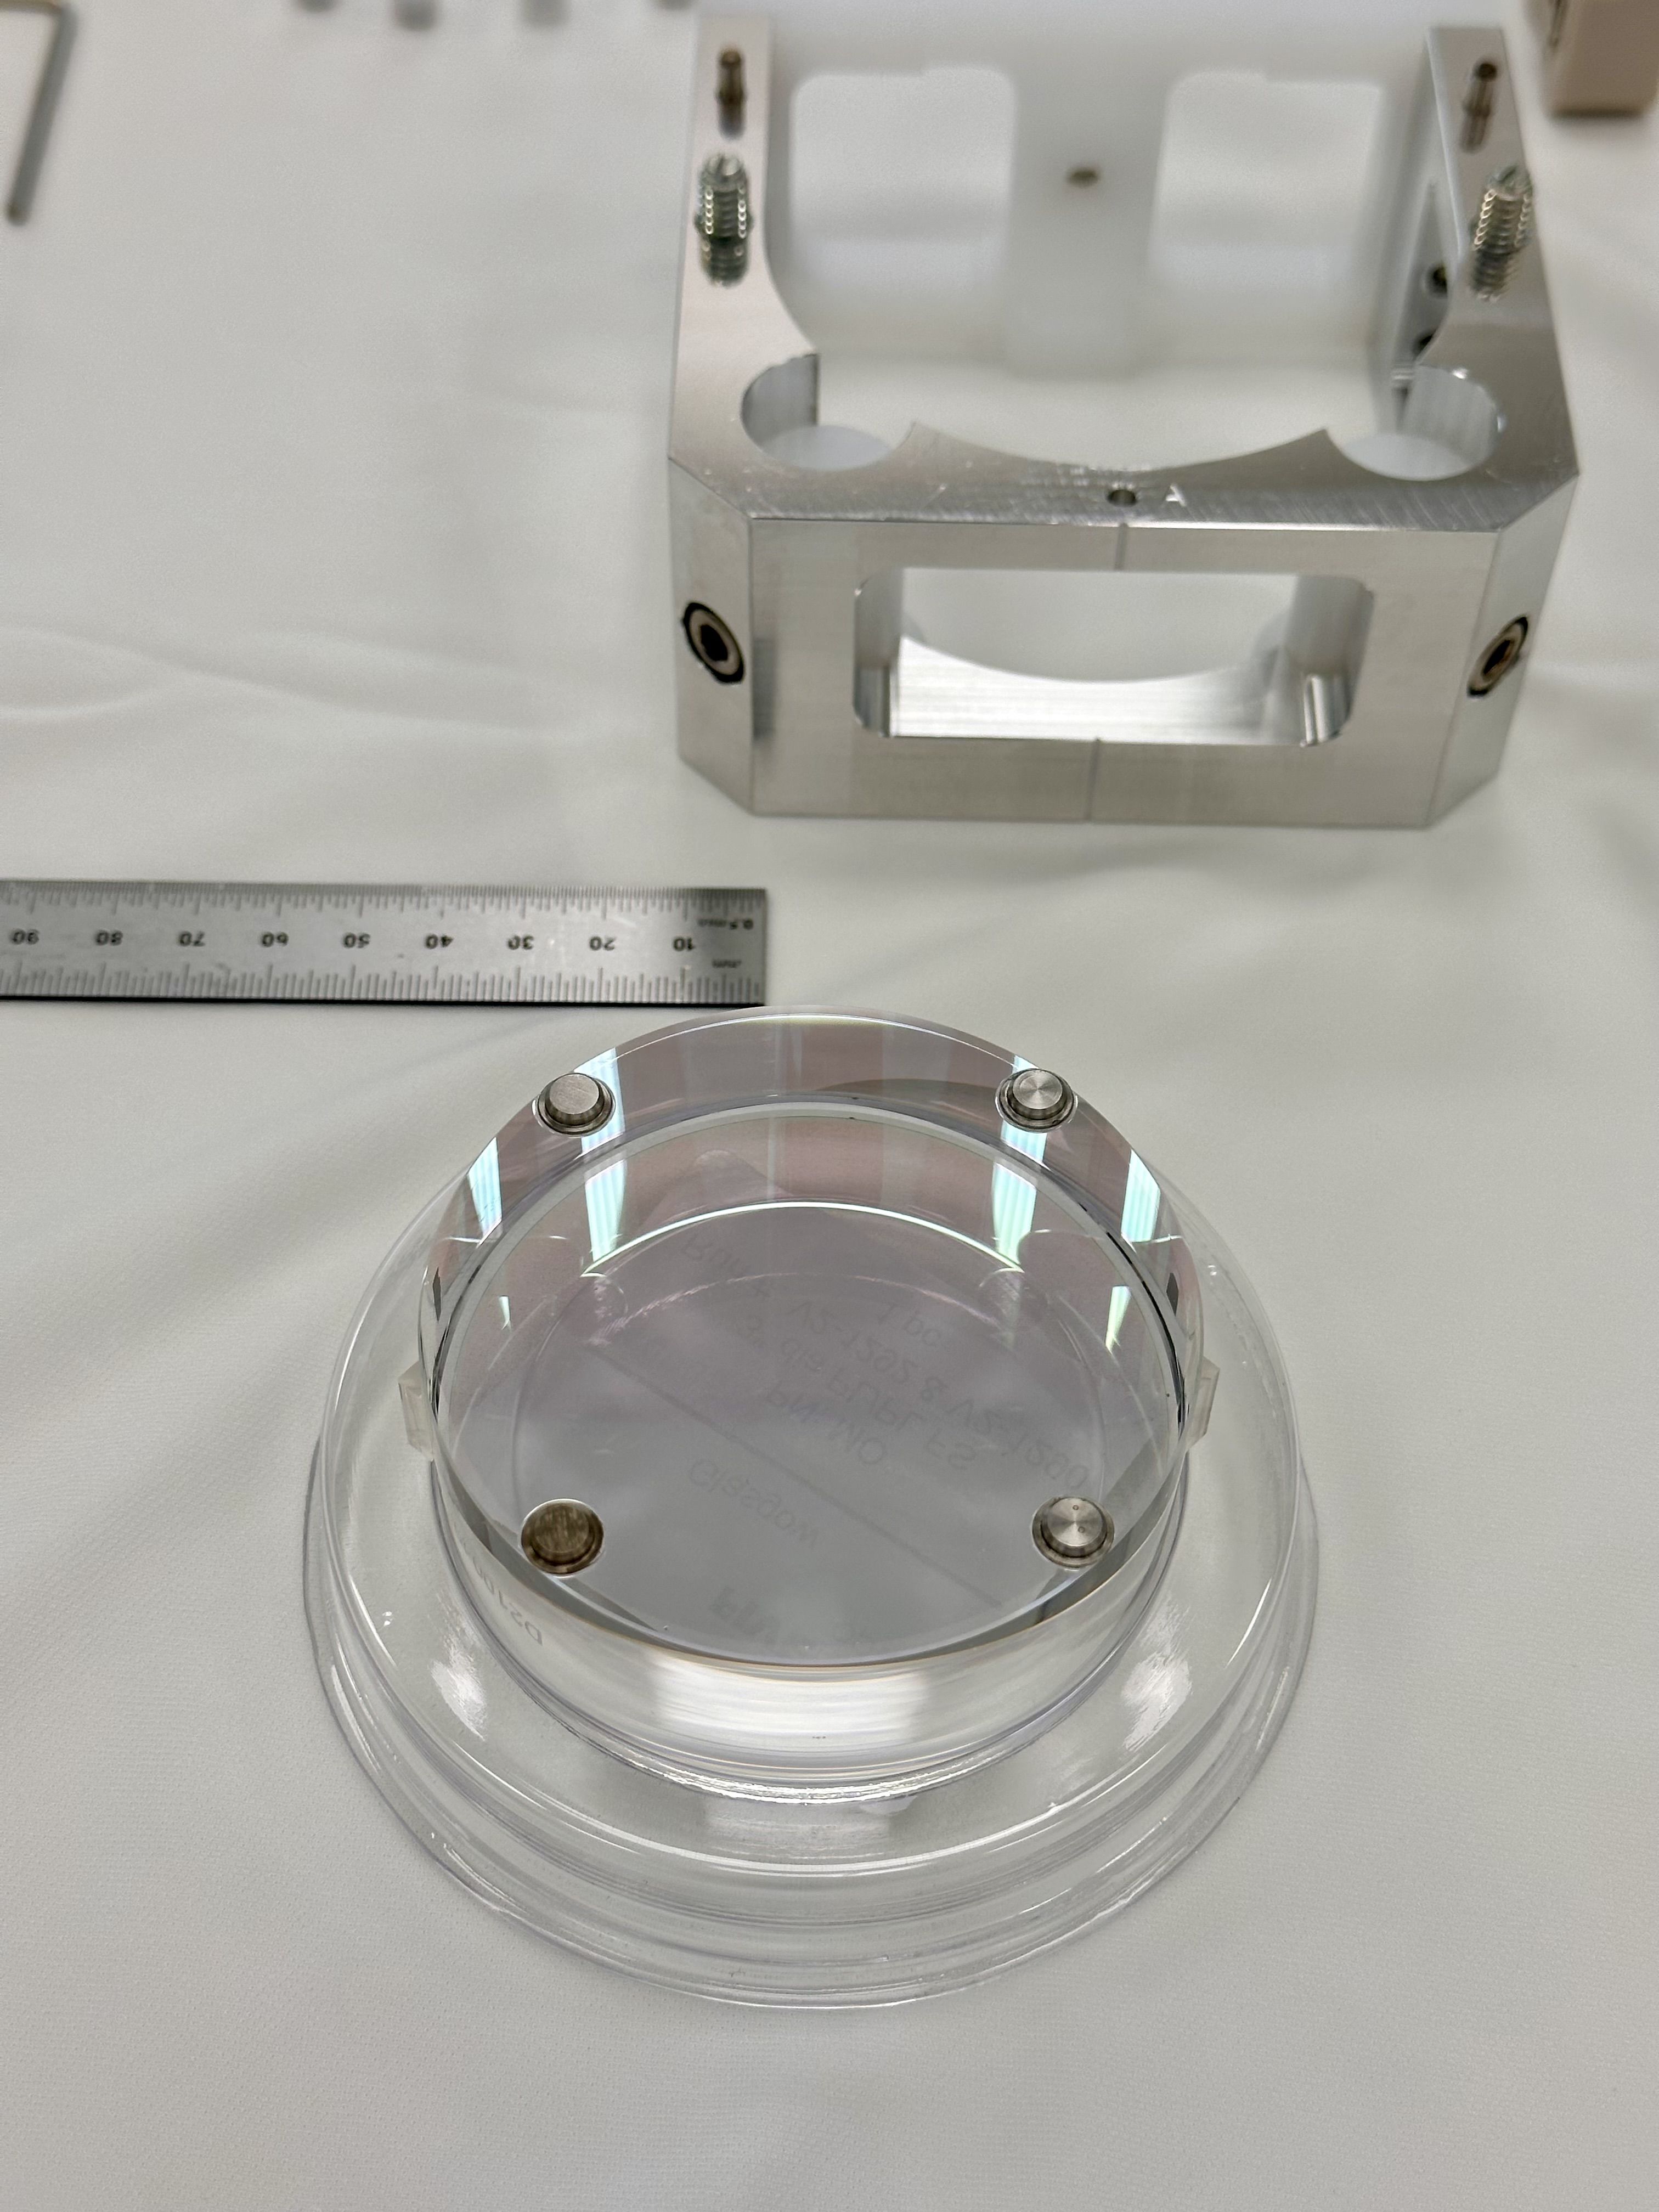
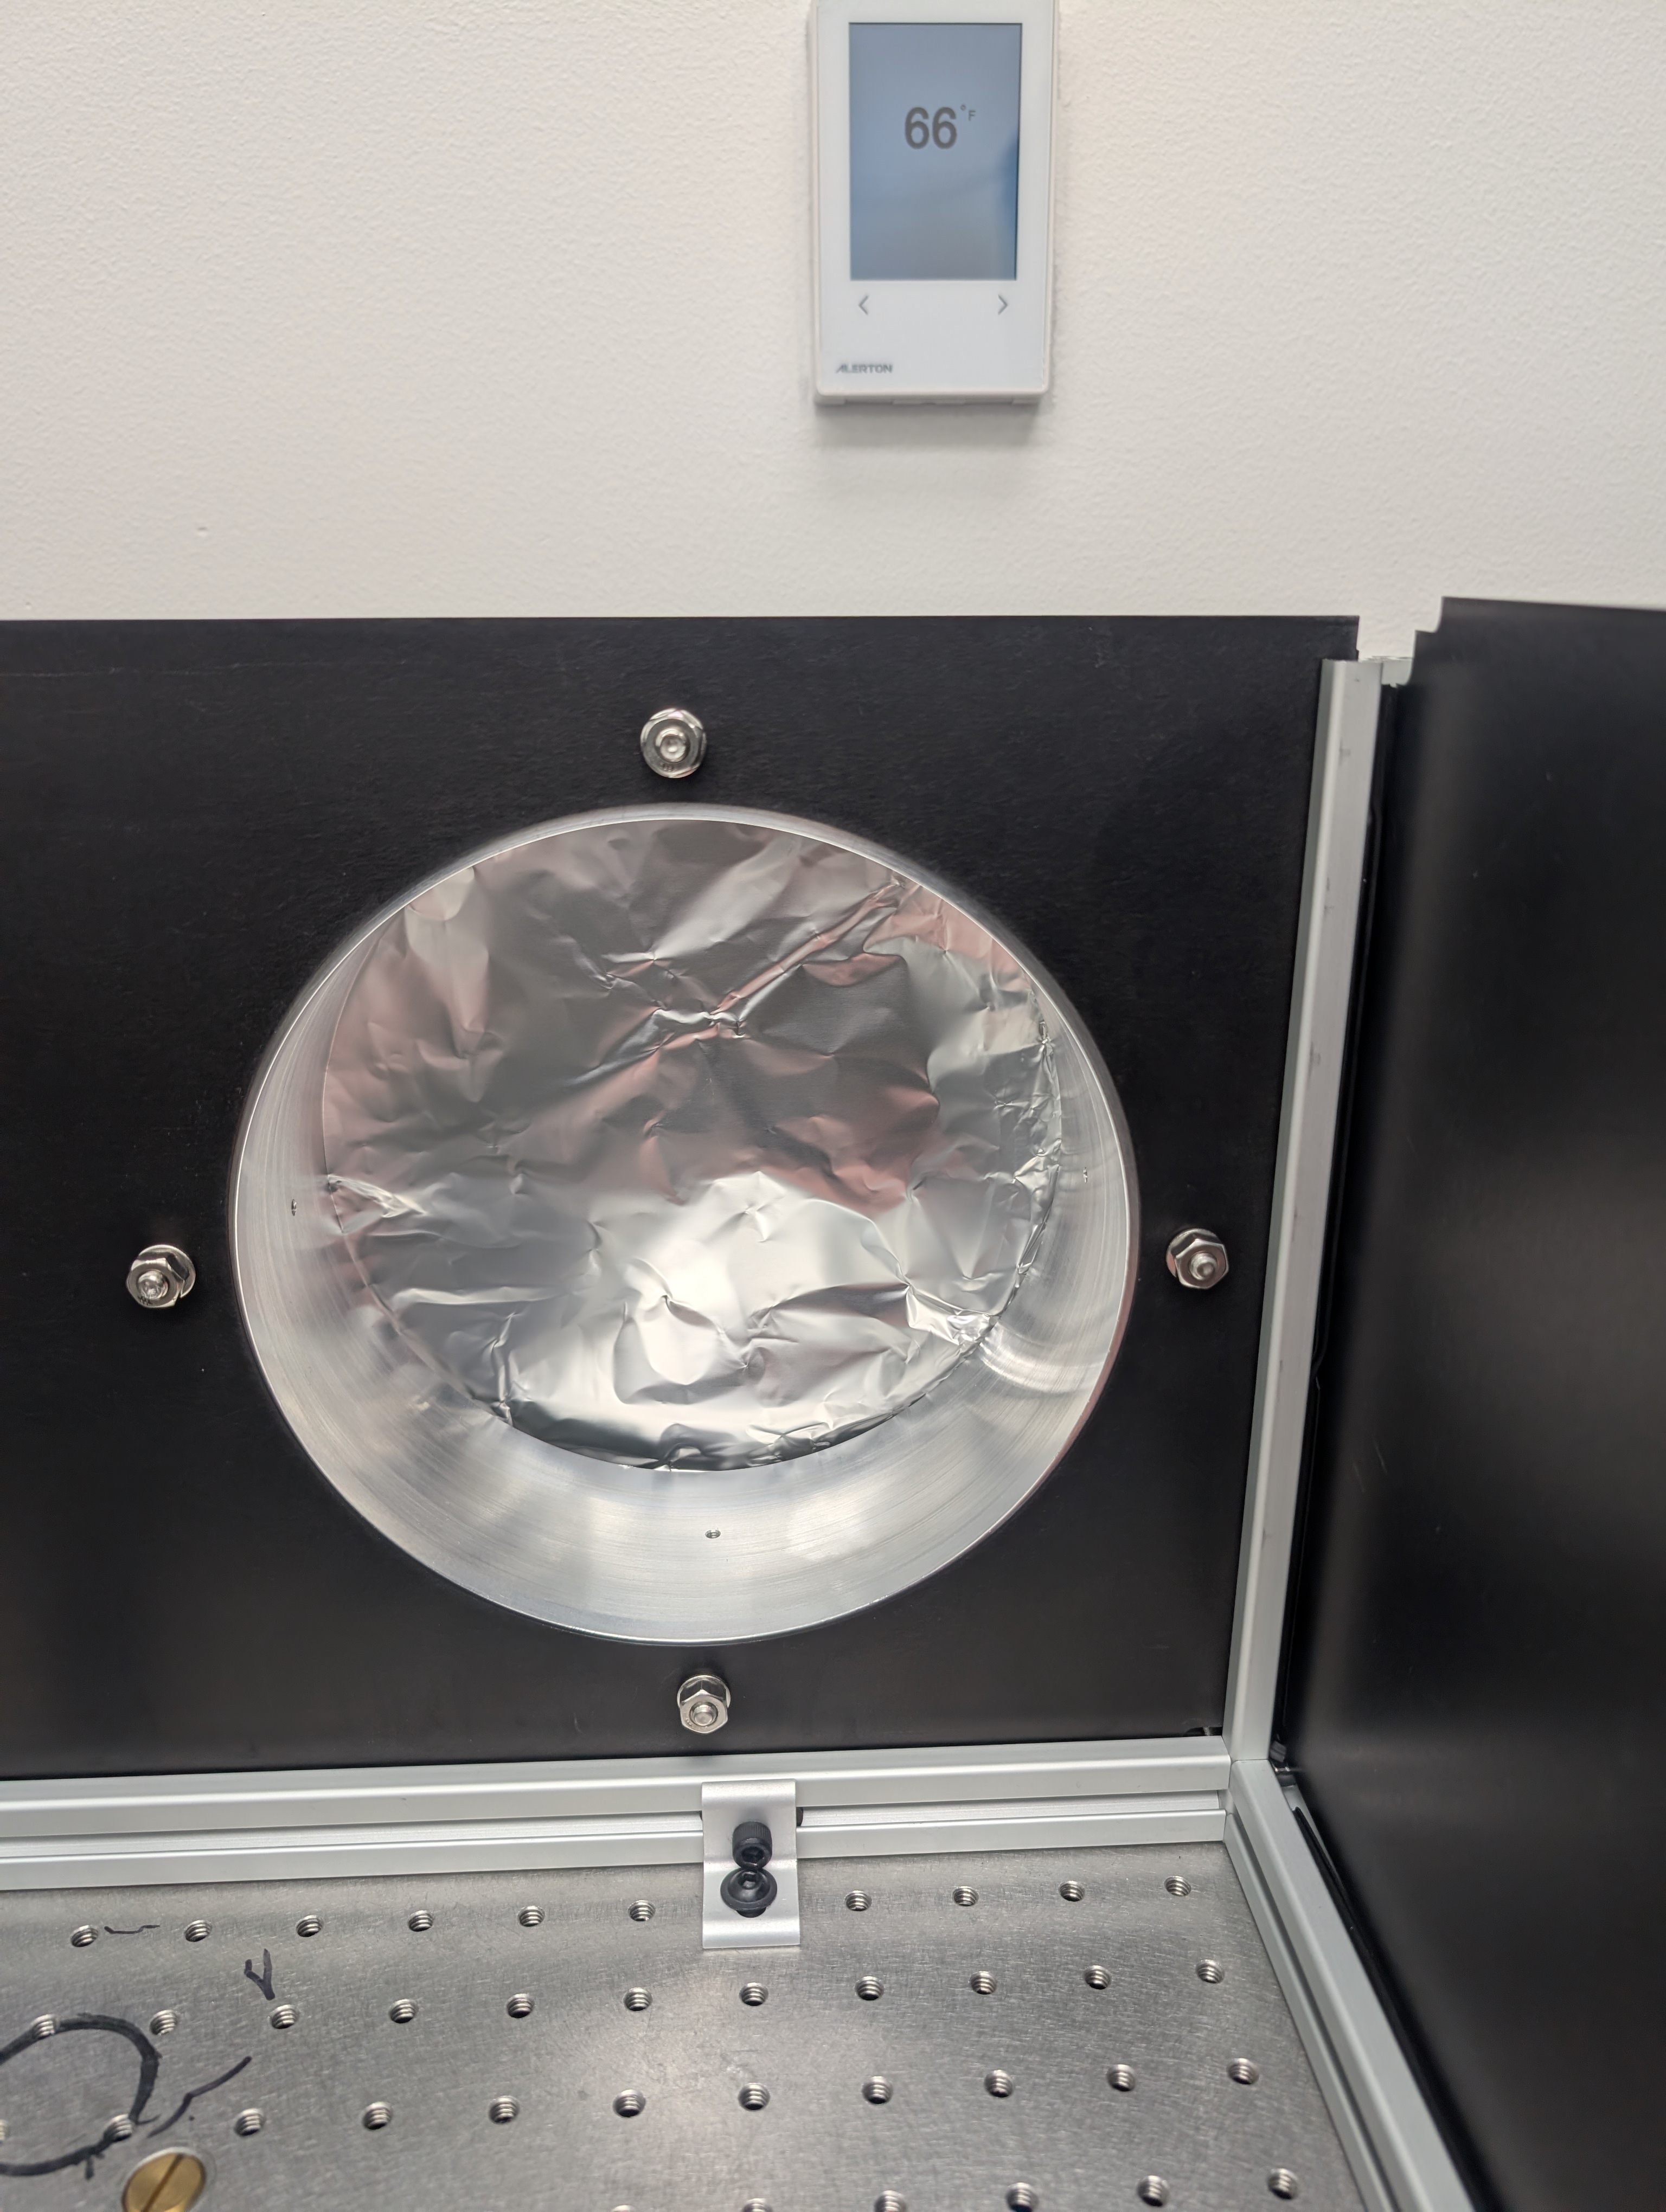
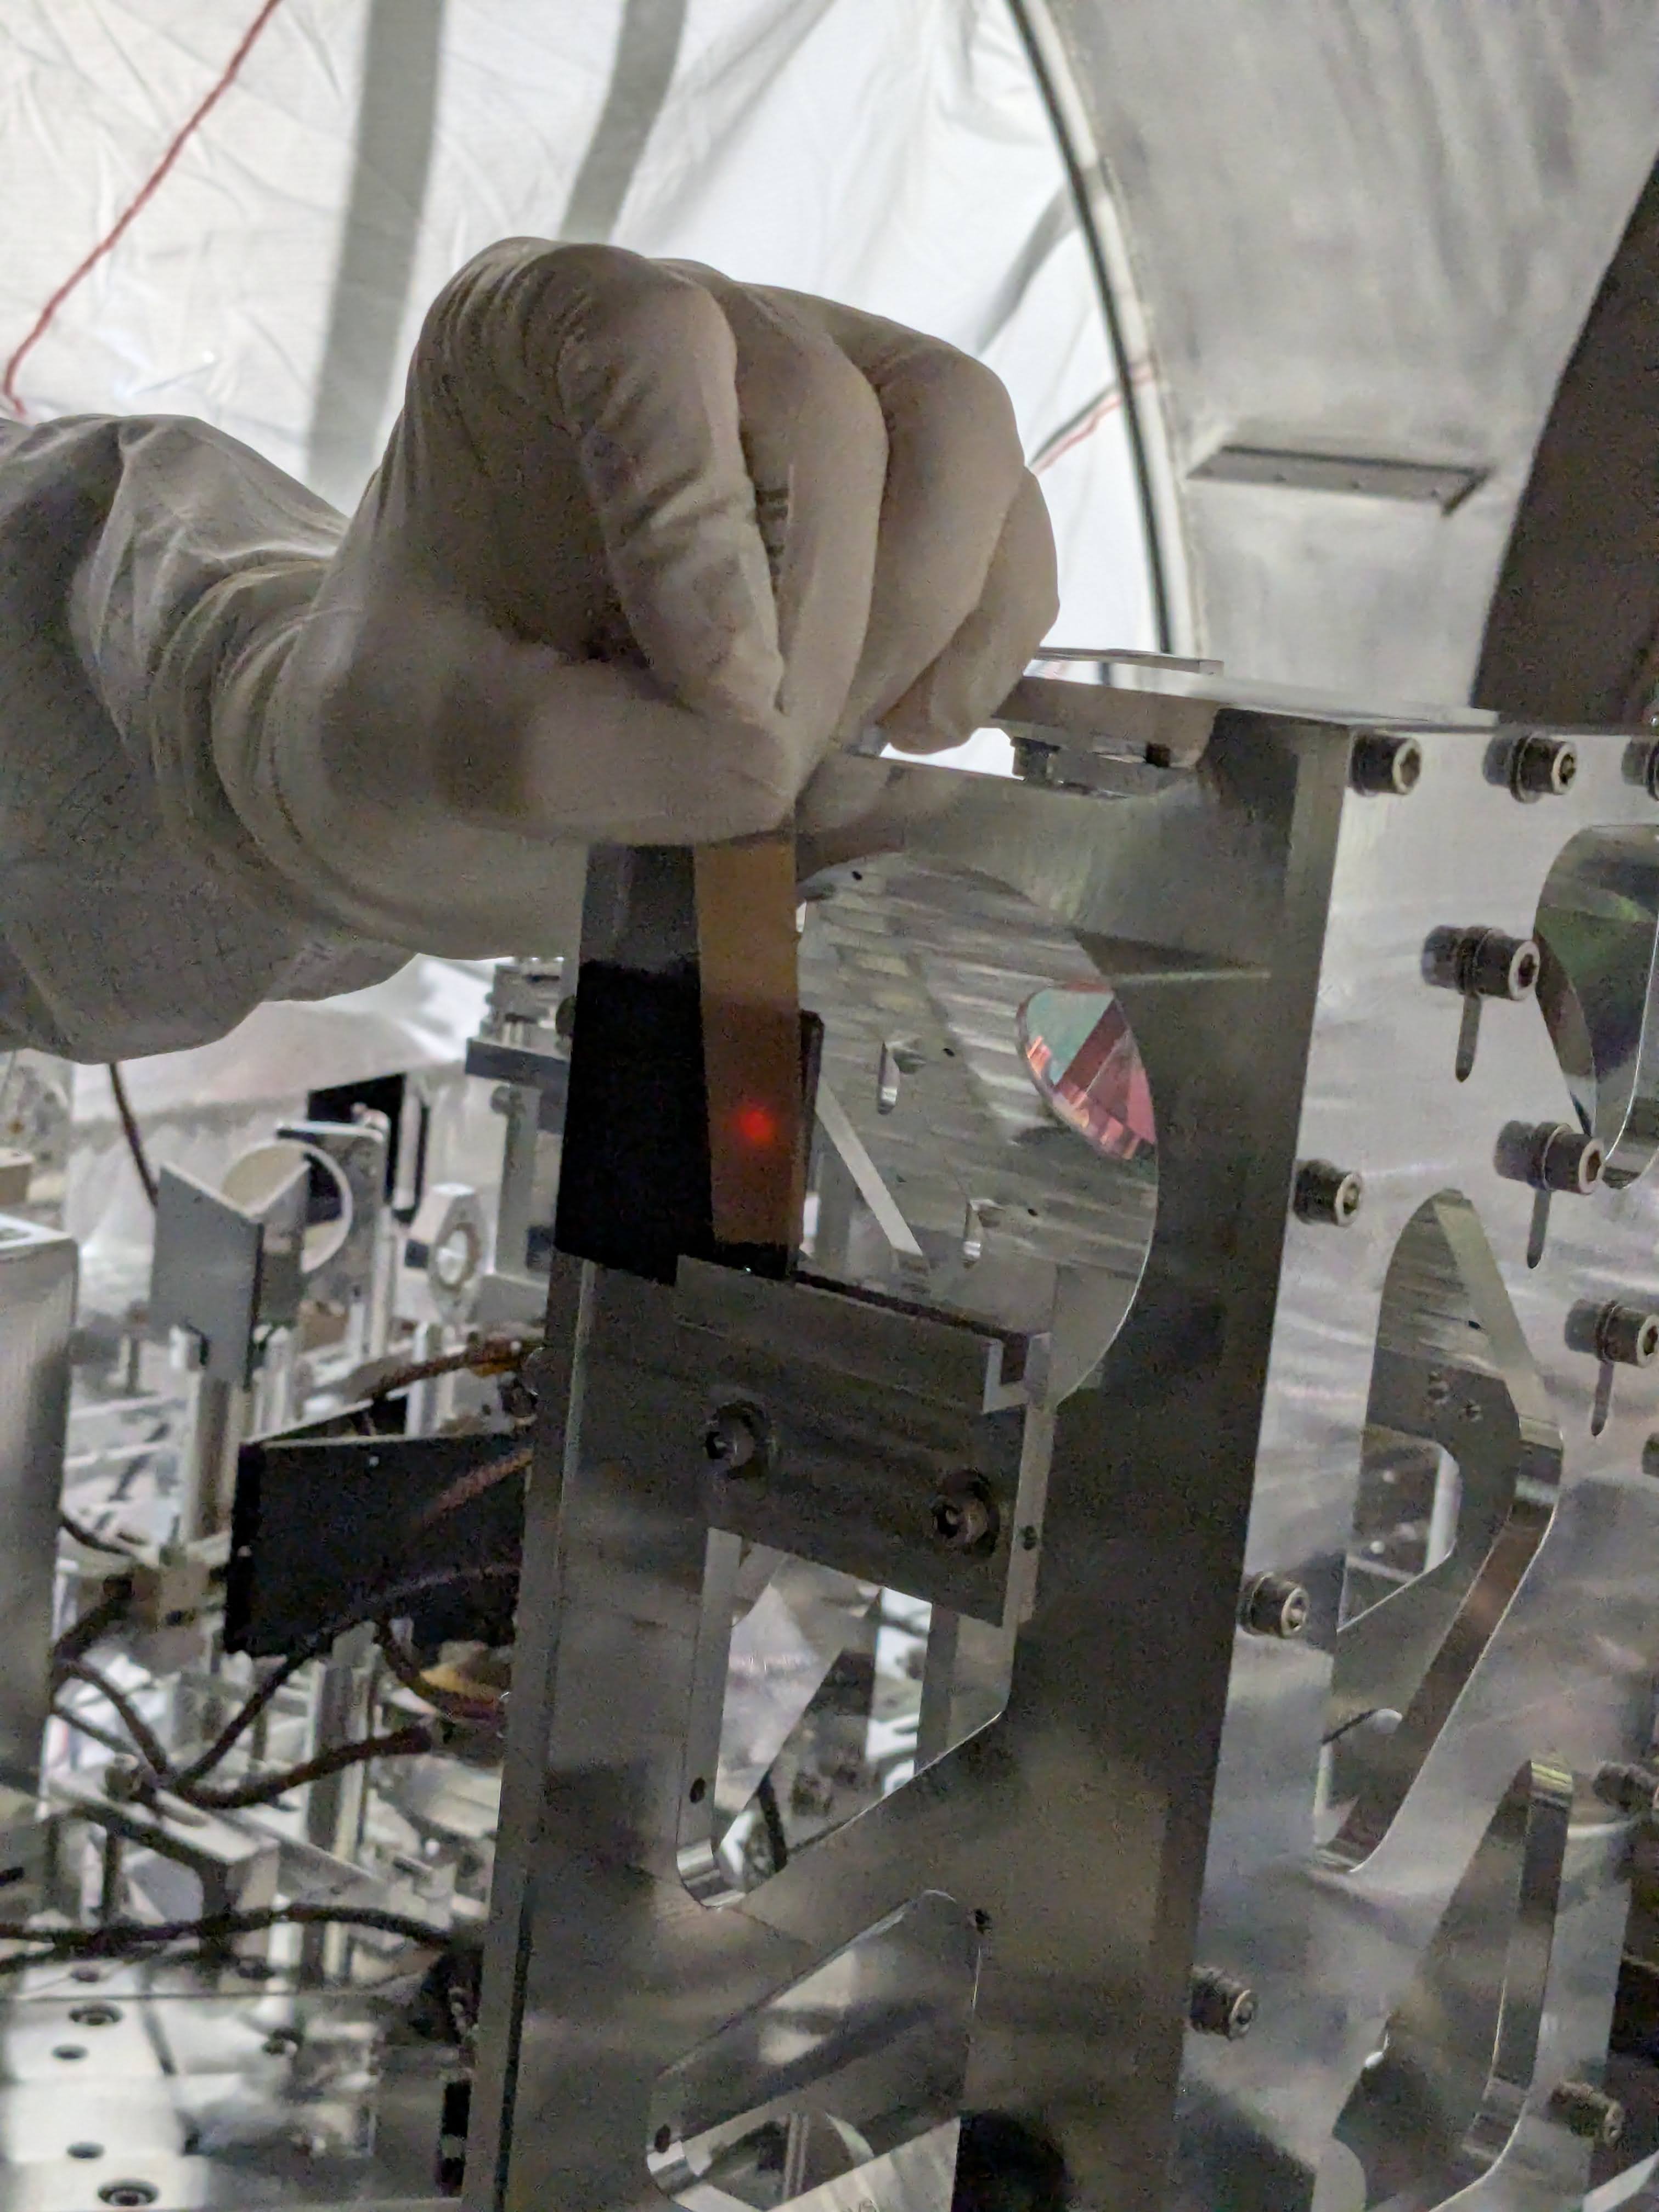
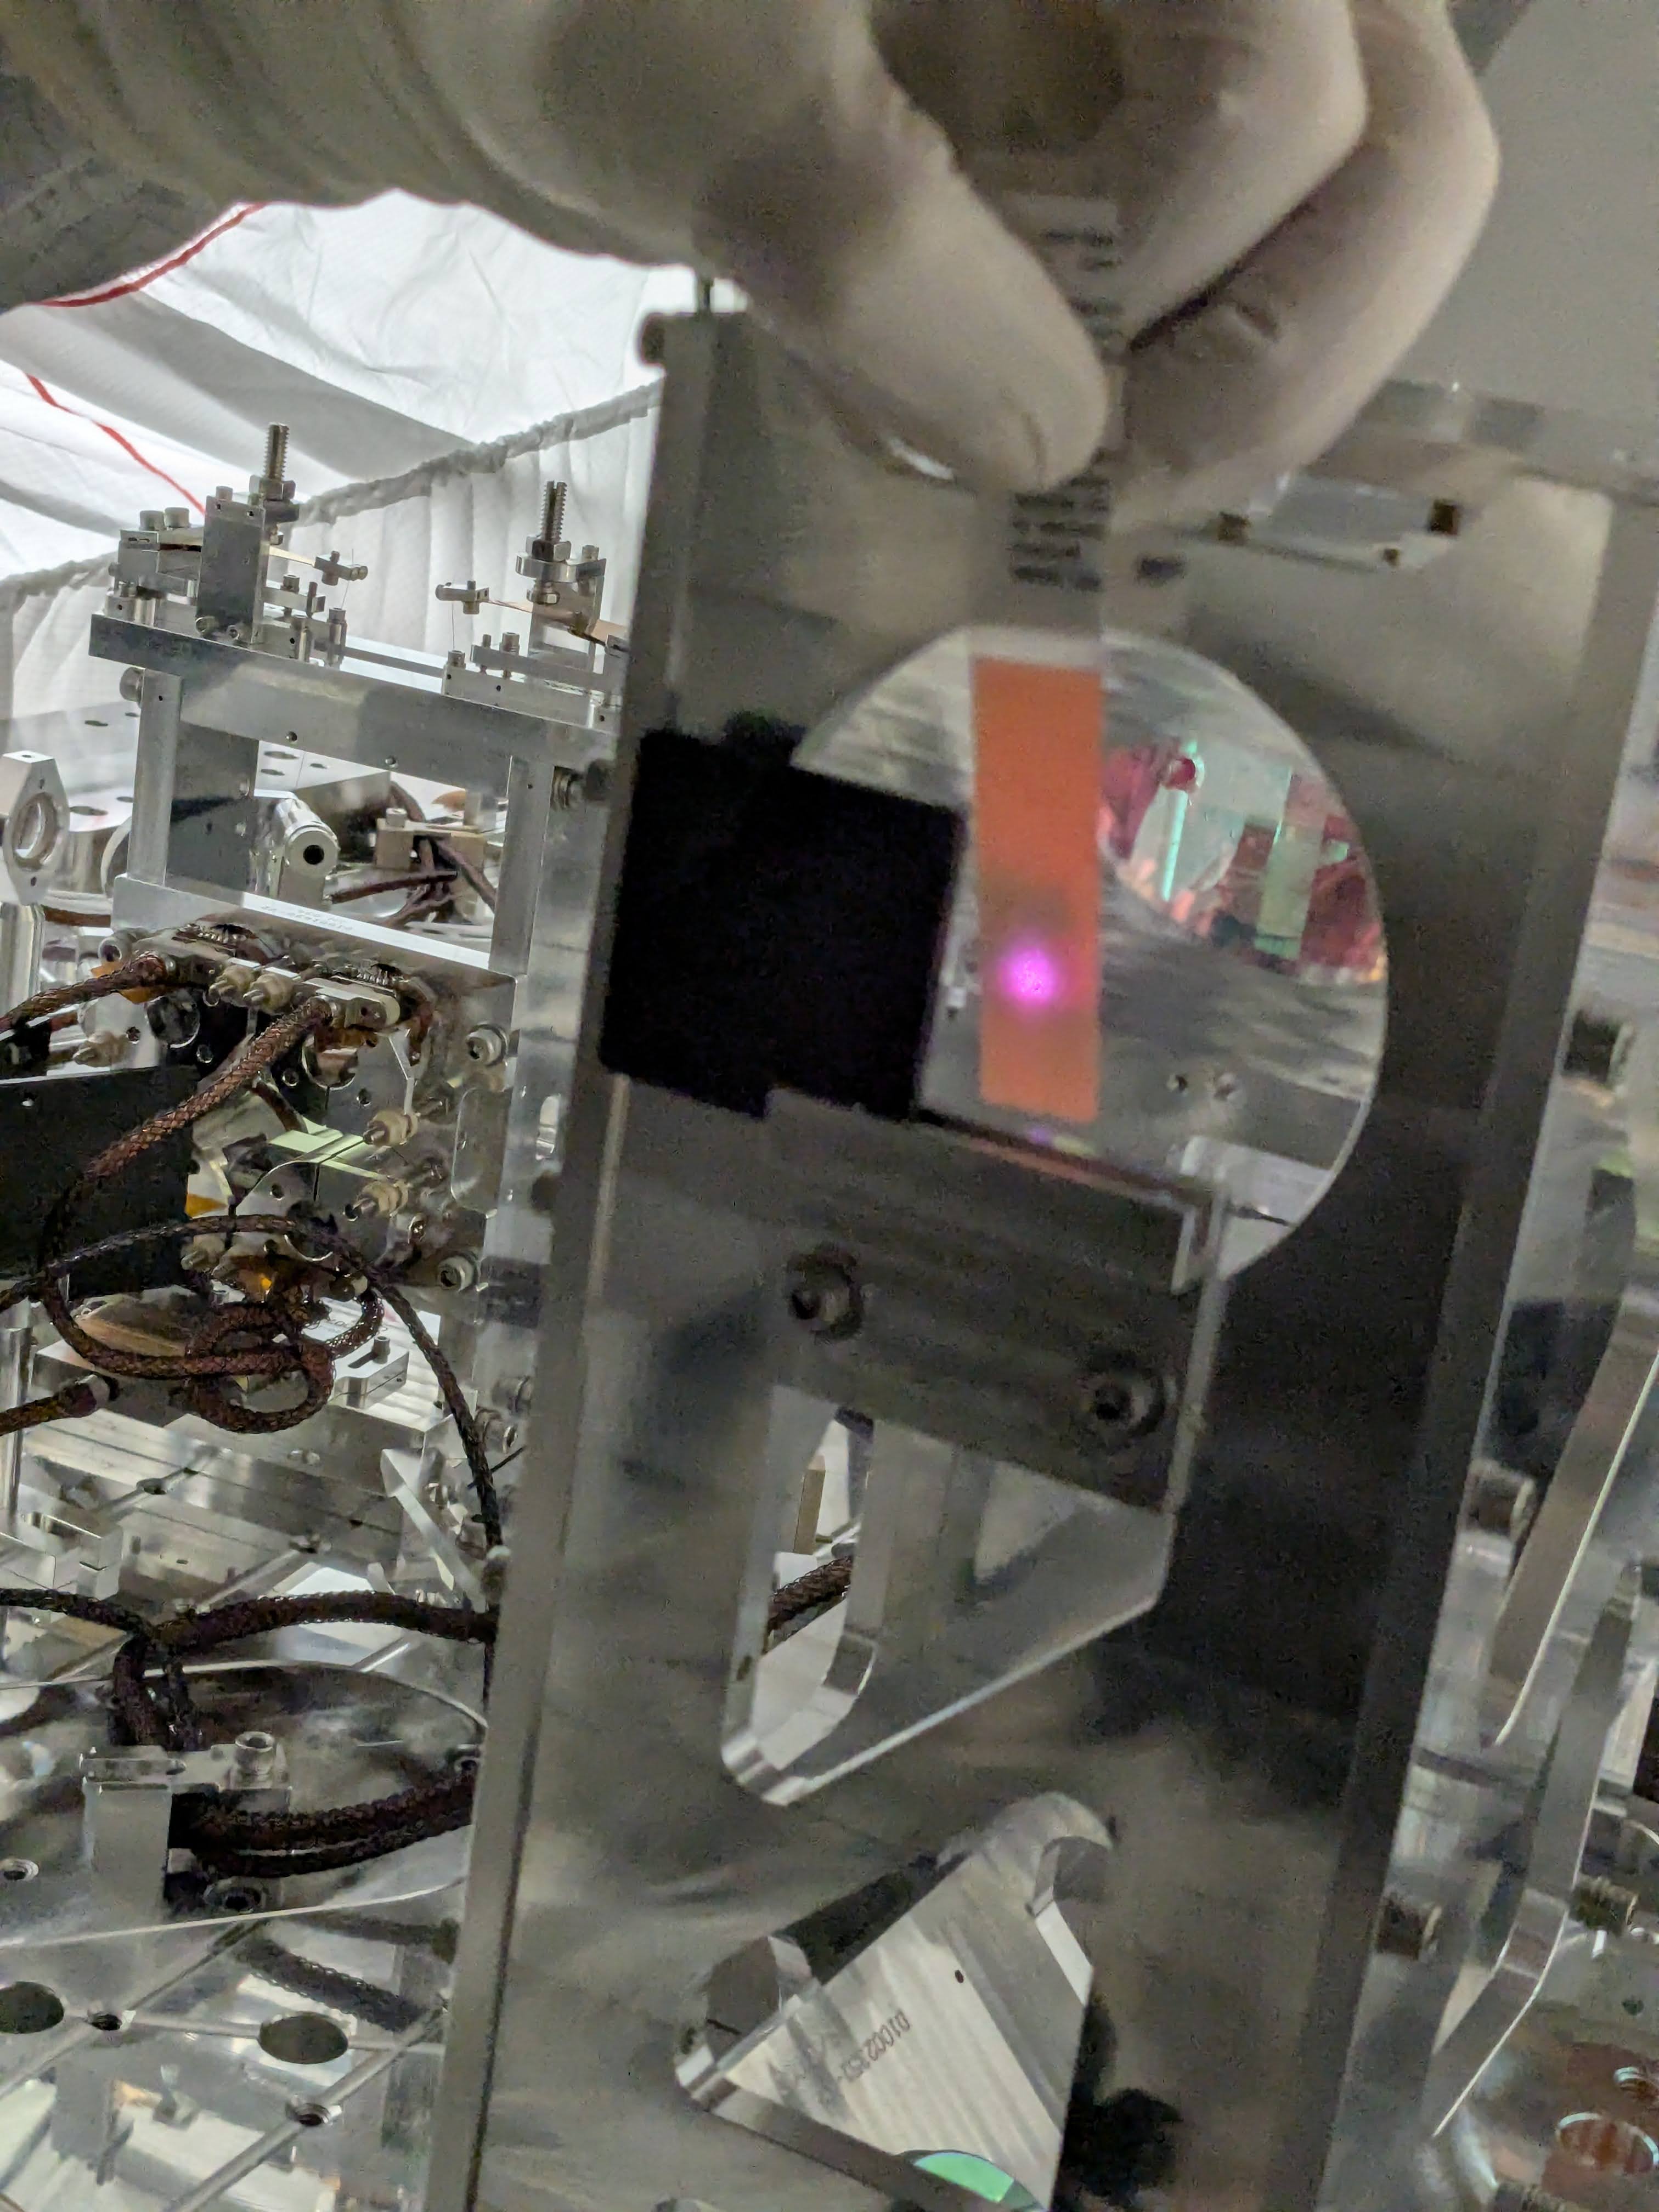
Beam dump for the -Y door viewport reflection.
Jason and Betsy installed it. There seems to be a discussion as to whether or not something else needs to be done.
EOM and JAC power budget again.
We measured the power at various places. While Jason held the power meter head still, I ran the statistics function of the power meter for a few seconds. I only list the mean and the standard deviation.
Wrong pol is king of large, ~0.2% of the main beam power coming out of EOM. That's 200mW when 100W goes through the EOM.
JAC throughput of 92% is not great, but Jason says the alignment and the matching are not really optimised.
| JAC input | 112mW+-462uW | |
| EOM input = JAC output | 103mW+-6.3mW |
JAC OUT/IN = 0.92+-0.06 |
| EOM front AR reflection | 57uW+-4.4uW |
EOM AR/IN = (5.5+0.5)*1e-4 |
| EOM output (including the wrong pol beam) | 96.9mW+-1.4mW | |
| EOM wrong pol beam | 226uW+-17uW |
EOM wrong pol/IN = (2.2+-0.2)*1e-3 |
| EOM main pol (= out total - wrong pol) | 96.7mW +-1.4mW |
EOM main pol/IN = .9978+-2e-4 |
Afternoon work, REFL path aligned, RF lock works (Jennie, Jason, Betsy, Daniel, Keita)
It seemed as if what was supposed to be TFP after HWP was not really TFP, it was temporarily set aside.
REFL path to the JAC REFL RFPD was aligned without TFP. 100mW into JAC was enough to see the REFL beam there.
DC responded as expected.
There was a confusion about which demod chassis was used for JAC, which was sorted out by Daniel who subsequently set the demod phase. I zero-ed the dark offset.
I copied the JAC lock filter from dither path to JAC-L_SERVO path, locked JAC with dither, disabled the input to the dither servo and enabled RF locking in parallel, which worked just fine. I made rough changes to the RF servo to bump up the UGF to ~400Hz without too much gain peaking, I haven't tried anything aggressive to squash the residual motion below 200Hz, you might want to tweak it further.
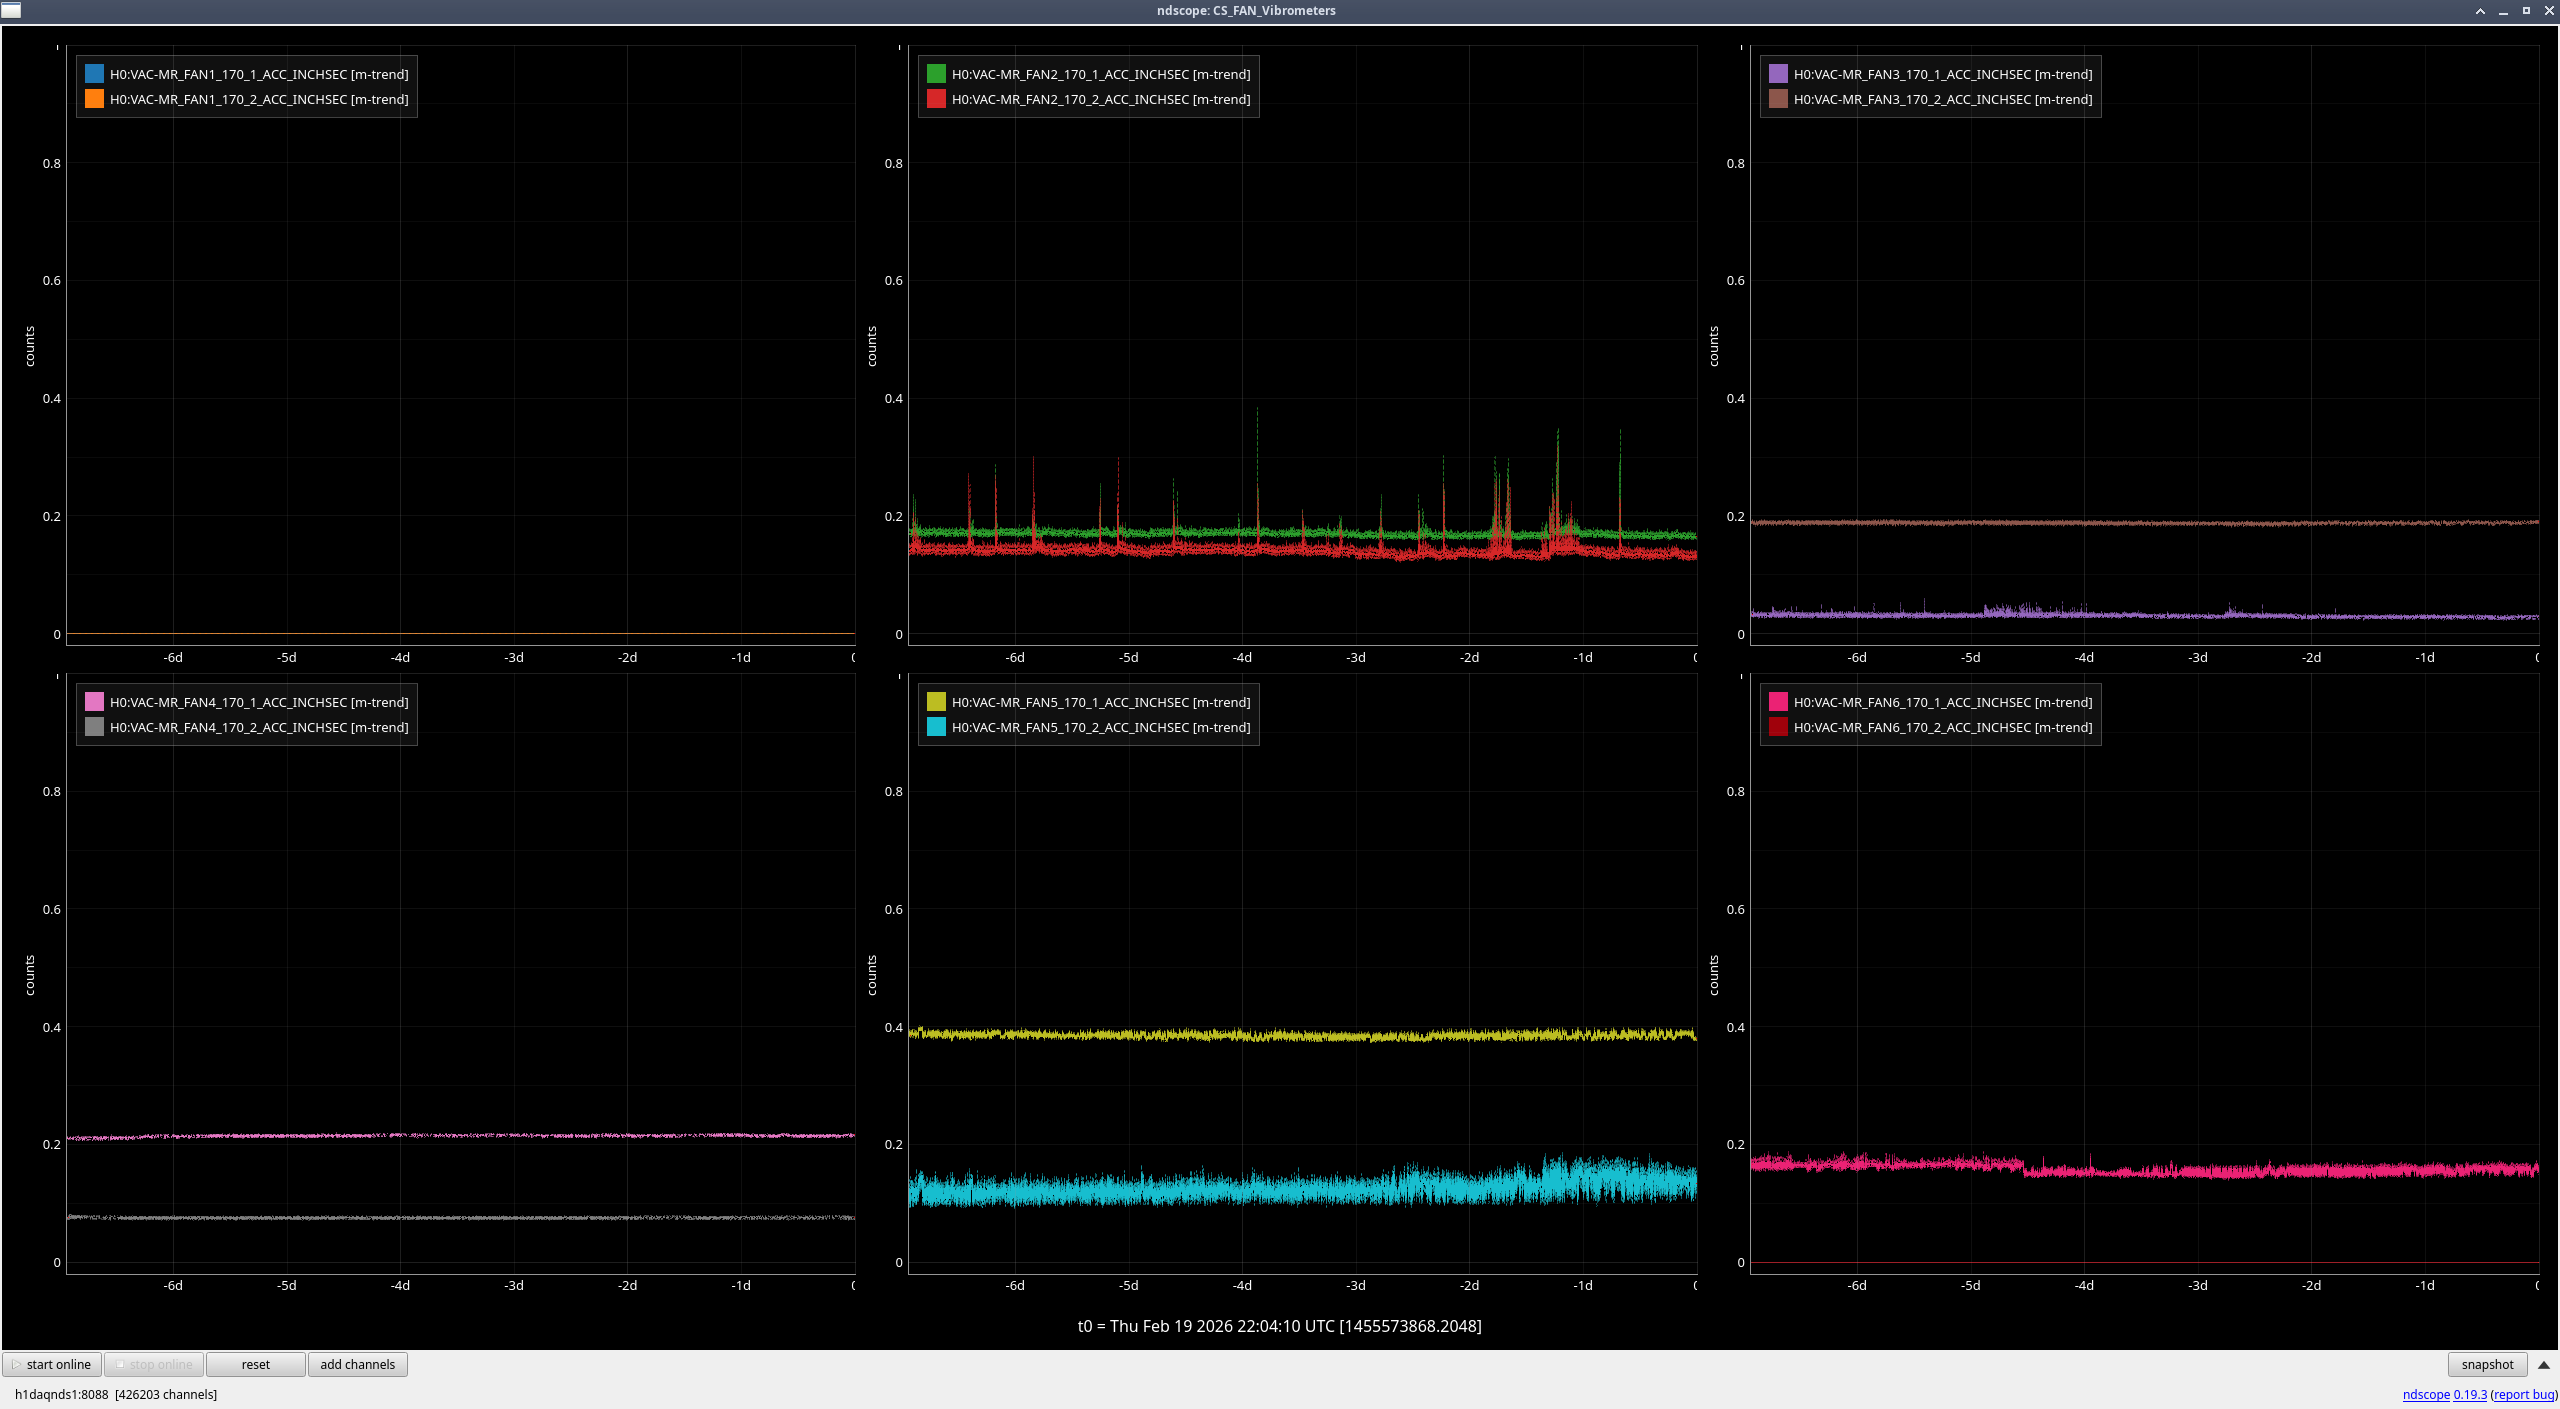
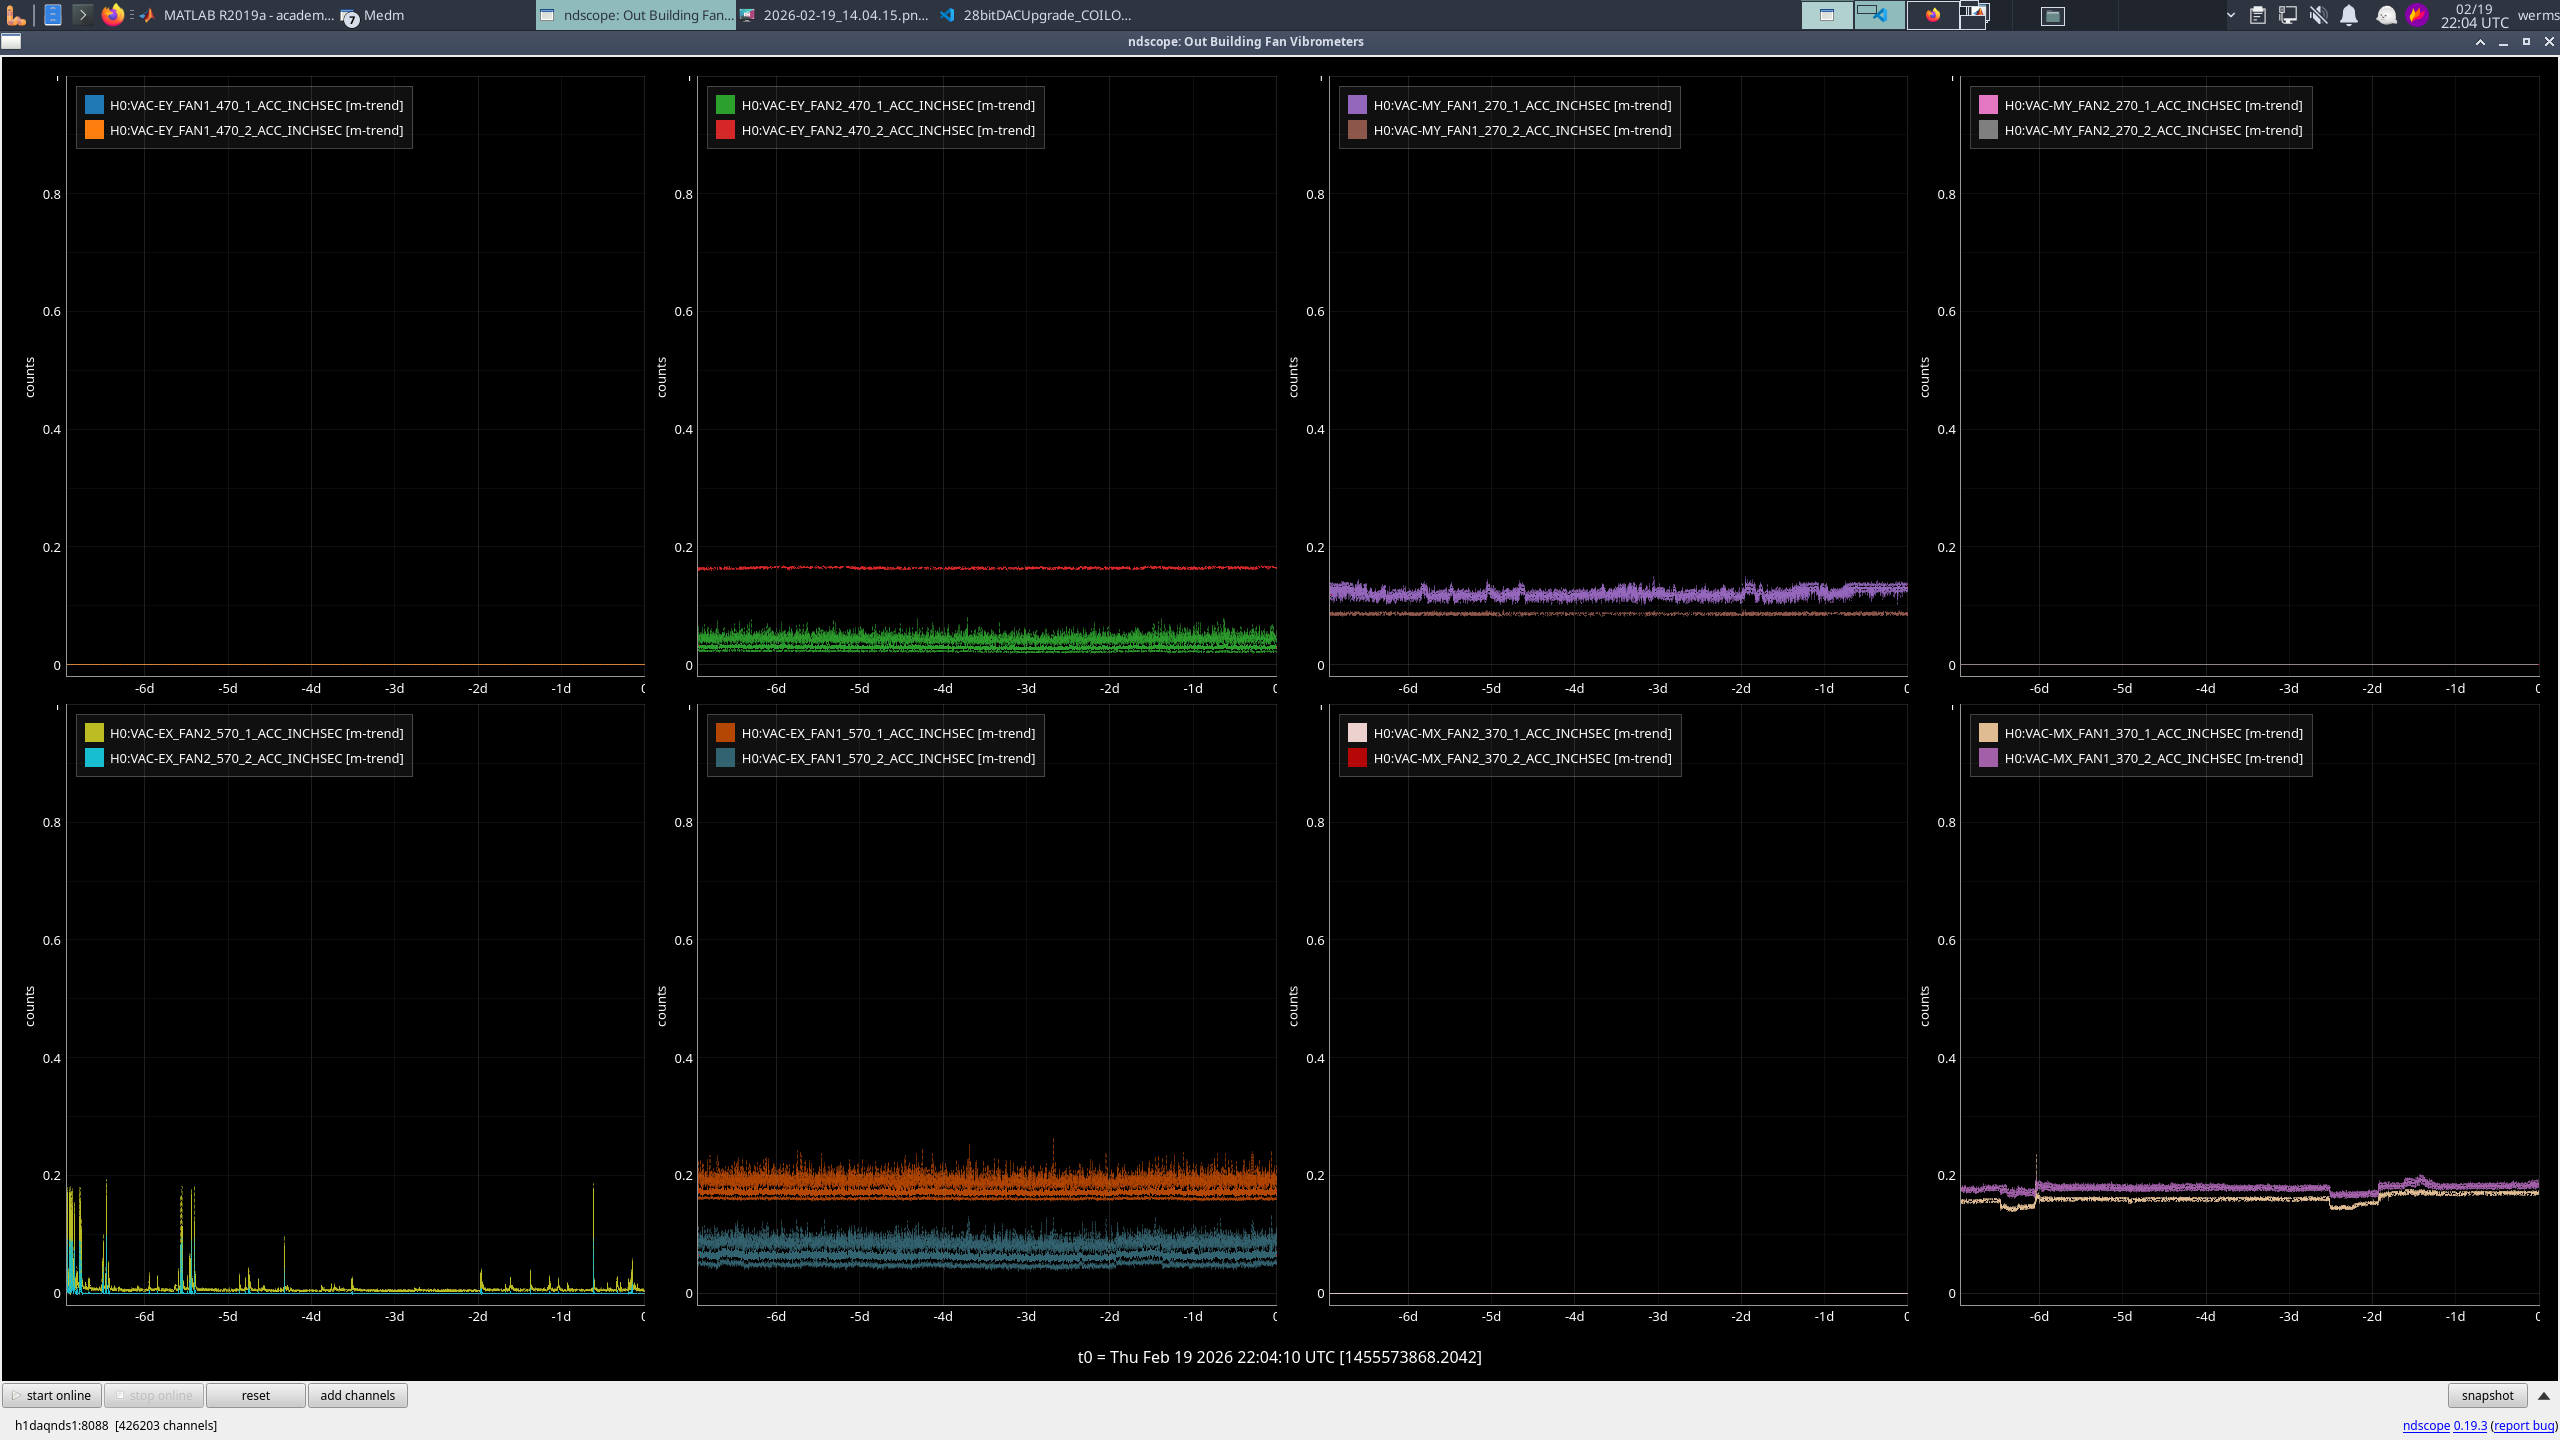
I didn't disable the dither itself for the JAC PZT so we can compare the spectrum of RF and dither side by side. See attached, this was measured with 100mW into JAC, note that the dither error signal is scaled. References are with the purge air on and current traces are with the purge air completely turned down.
Guardian needs to be changed to allow smooth locking with RF.