ryan.crouch@LIGO.ORG - posted 07:30, Saturday 12 October 2024 - last comment - 08:28, Saturday 12 October 2024(80626)
OPS Saturday day shift start
TITLE: 10/12 Day Shift: 1430-2330 UTC (0730-1630 PST), all times posted in UTC
STATE of H1: Observing at 153Mpc
OUTGOING OPERATOR: Oli
CURRENT ENVIRONMENT:
SEI_ENV state: CALM
Wind: 3mph Gusts, 2mph 3min avg
Primary useism: 0.03 μm/s
Secondary useism: 0.38 μm/s
QUICK SUMMARY:
- We've been locked for 17:22!, in observing sincxe 12:17 UTC
- Secondary microseism is rising quicky over the past 12 hours
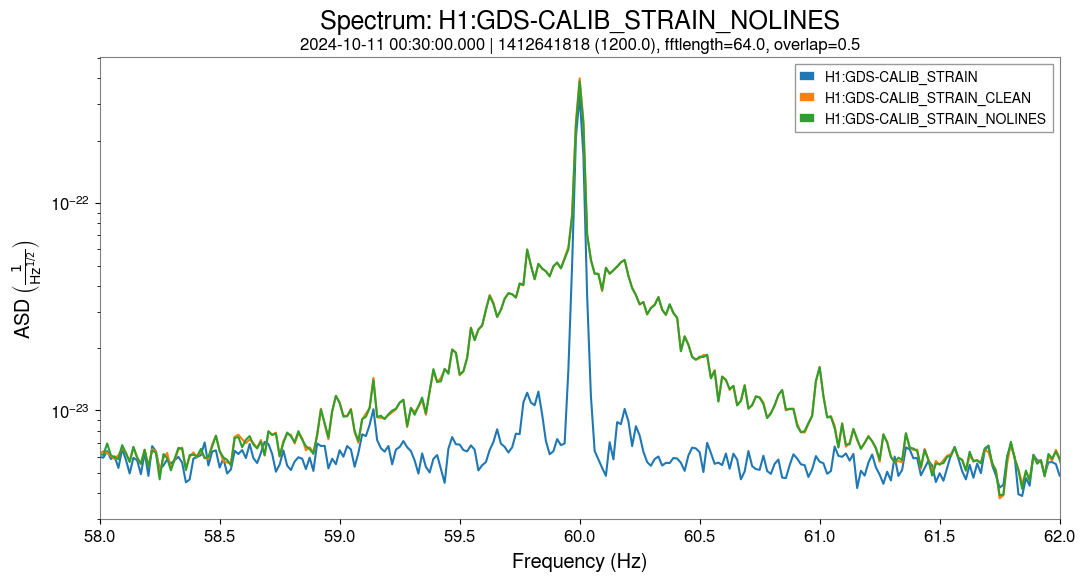
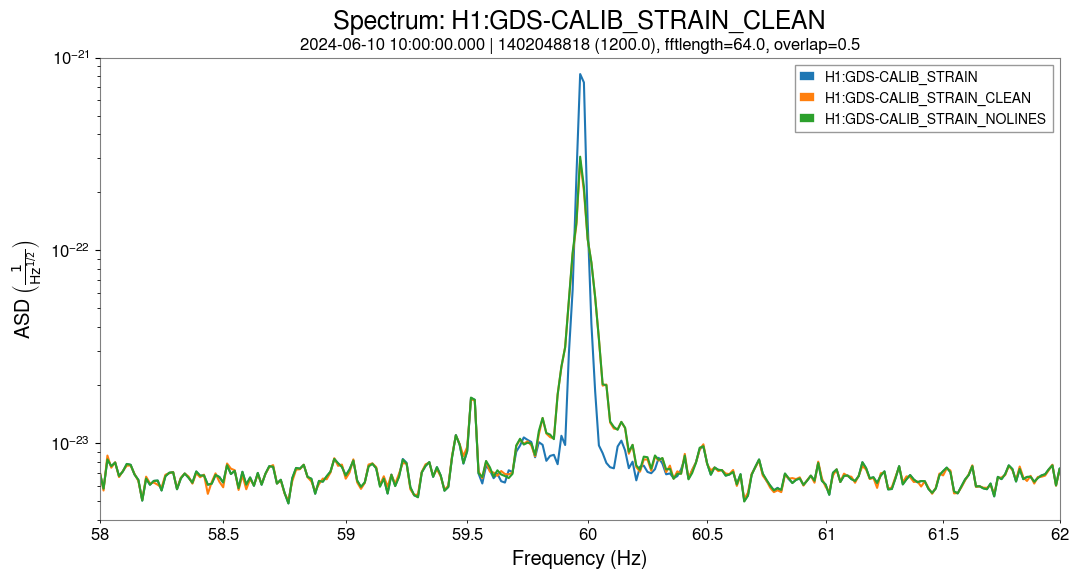
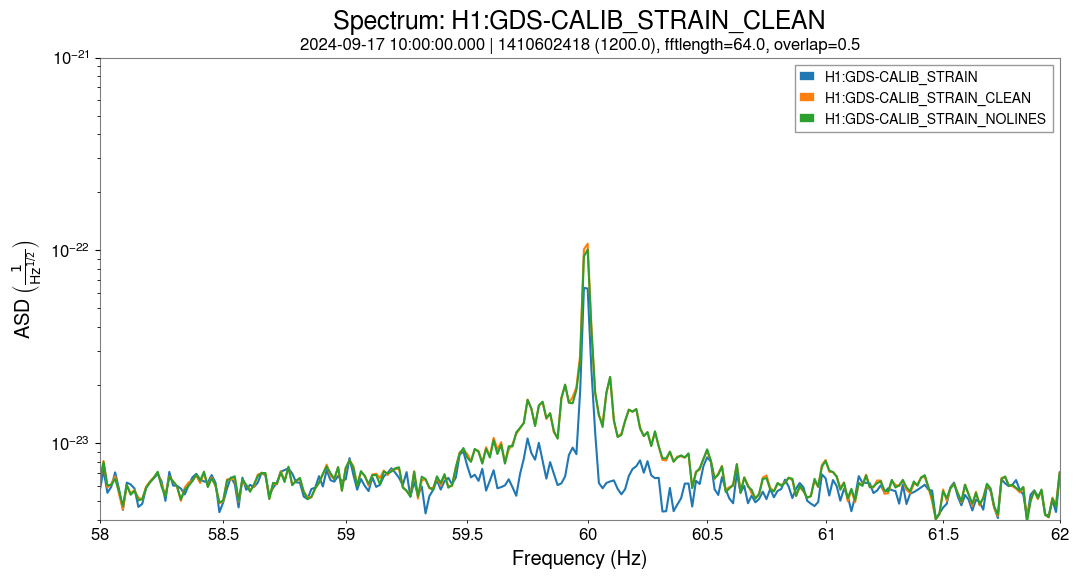
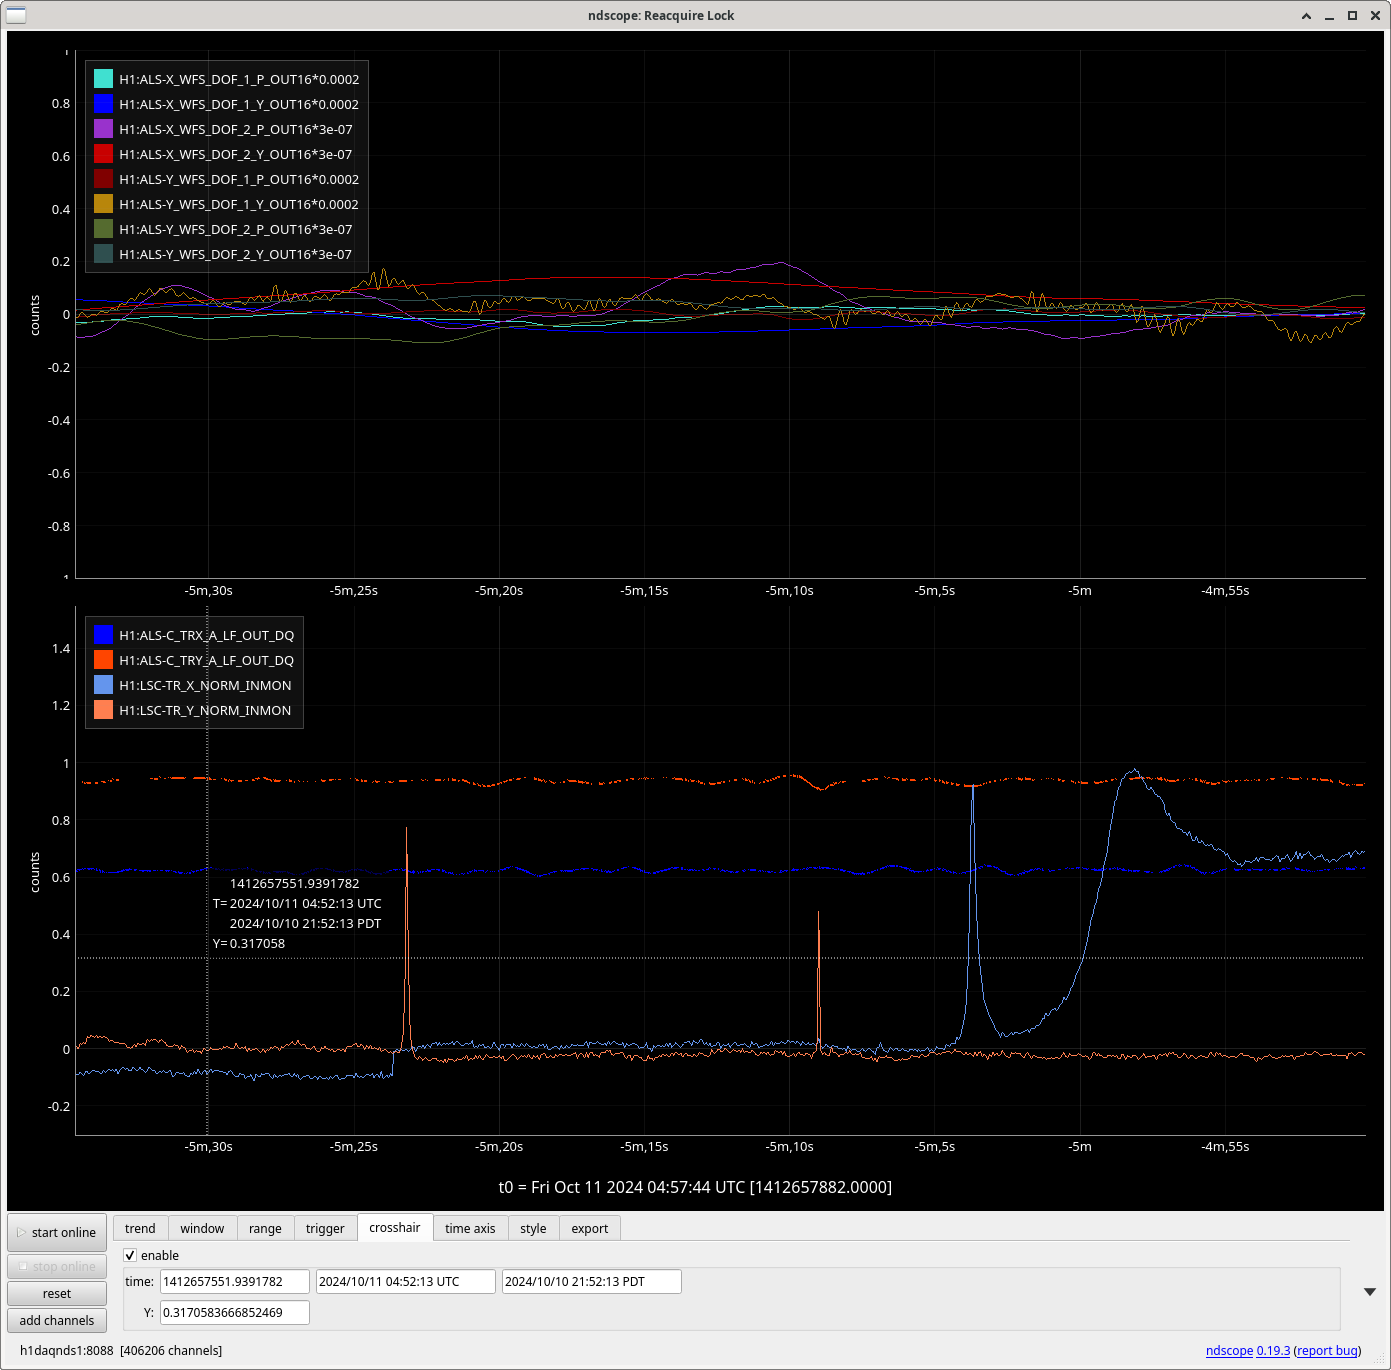
- The range looks like it has been trending down this morning, high freq SQZ doesn't look good again
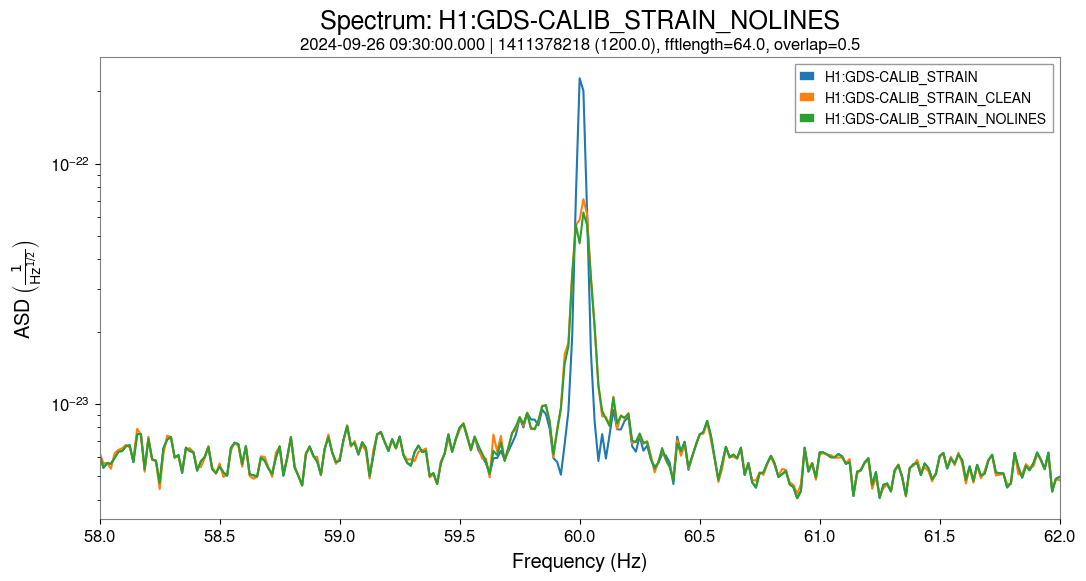
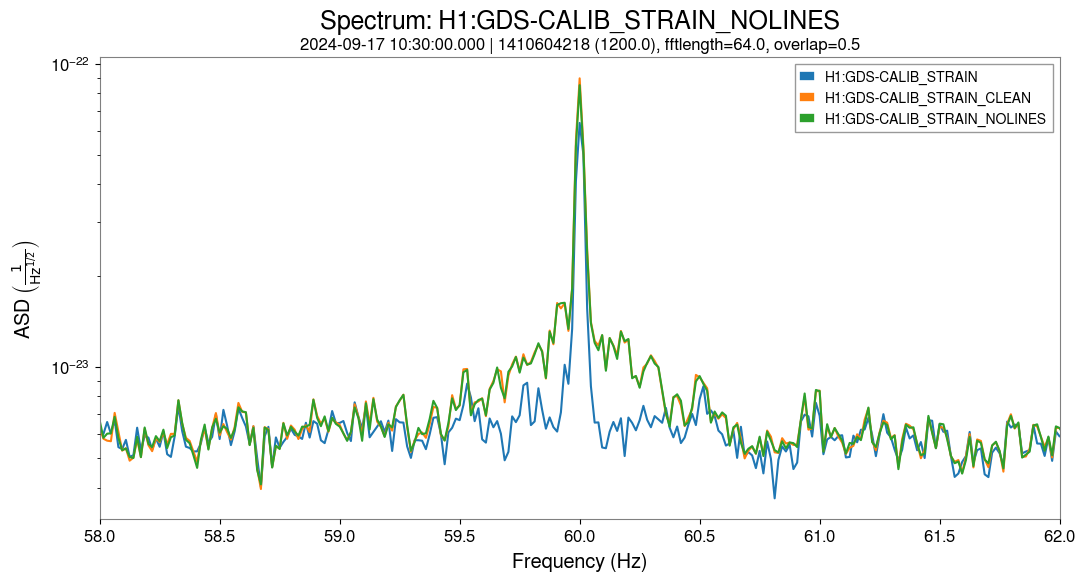 September 26:
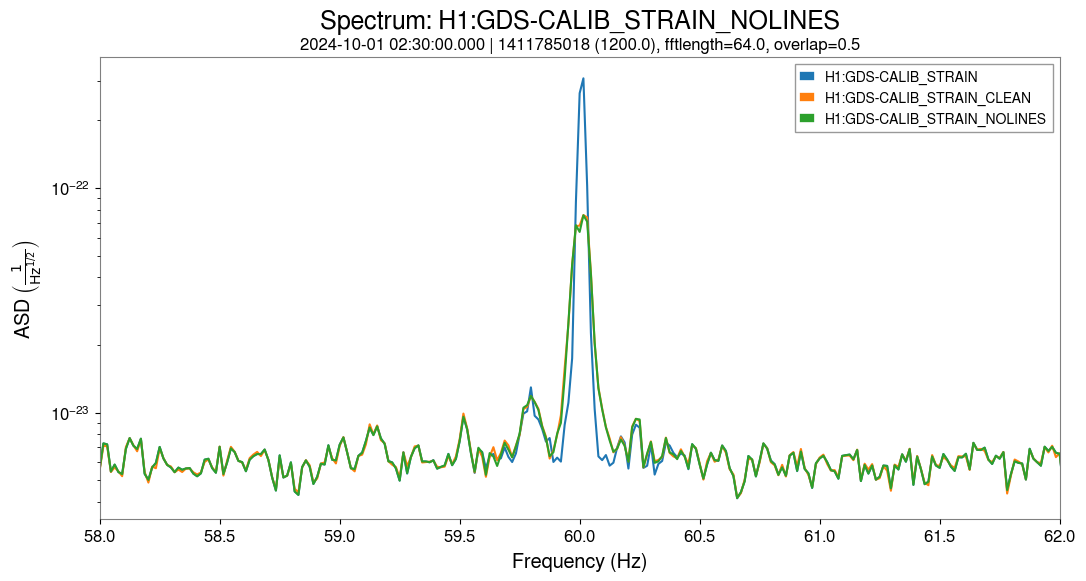
 October 1st:
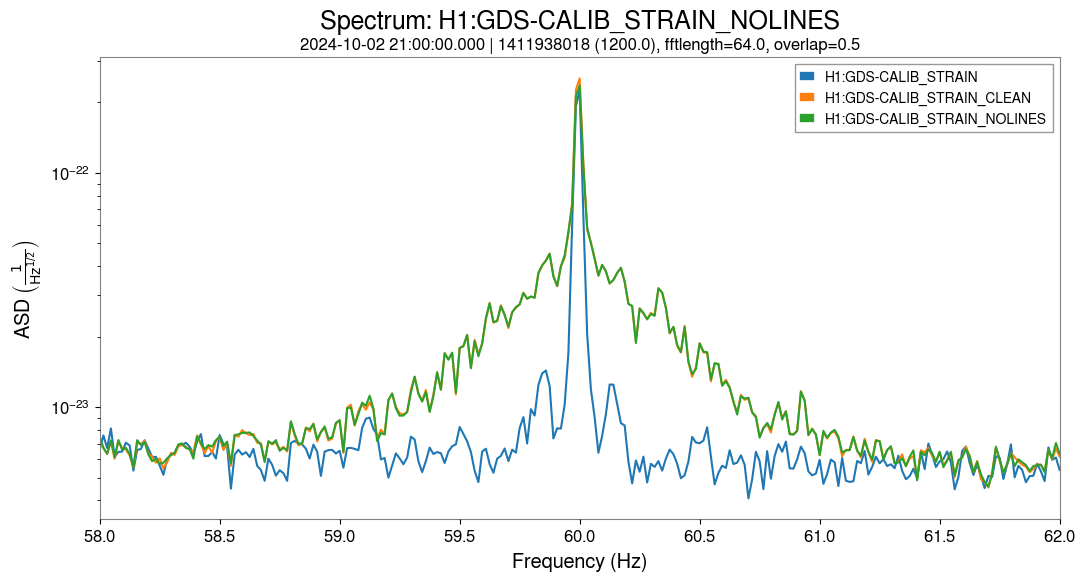
 October 2nd:
 October 11th:

I adjusted the OPO temp from 14:31 to 14:32 UTC and gained ~ 5 Mpc in range
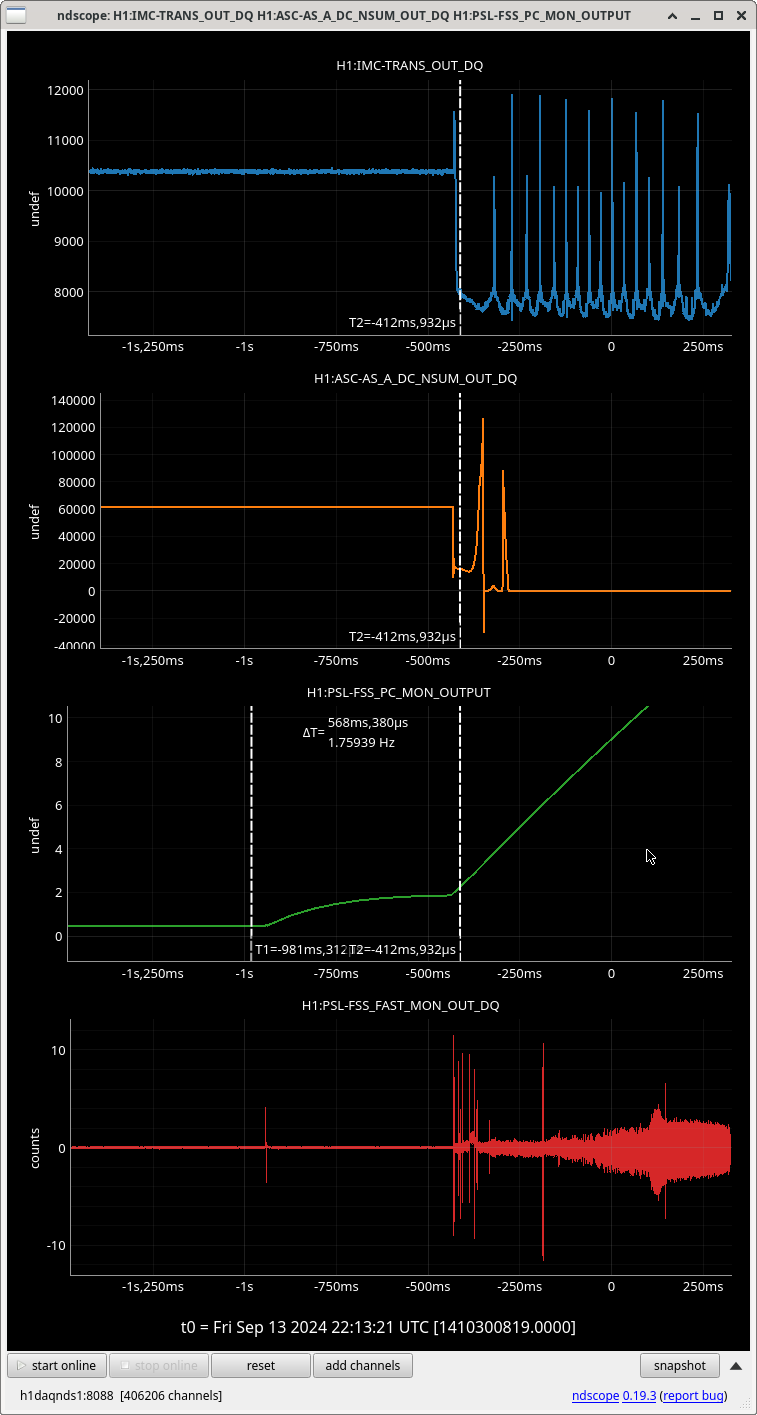
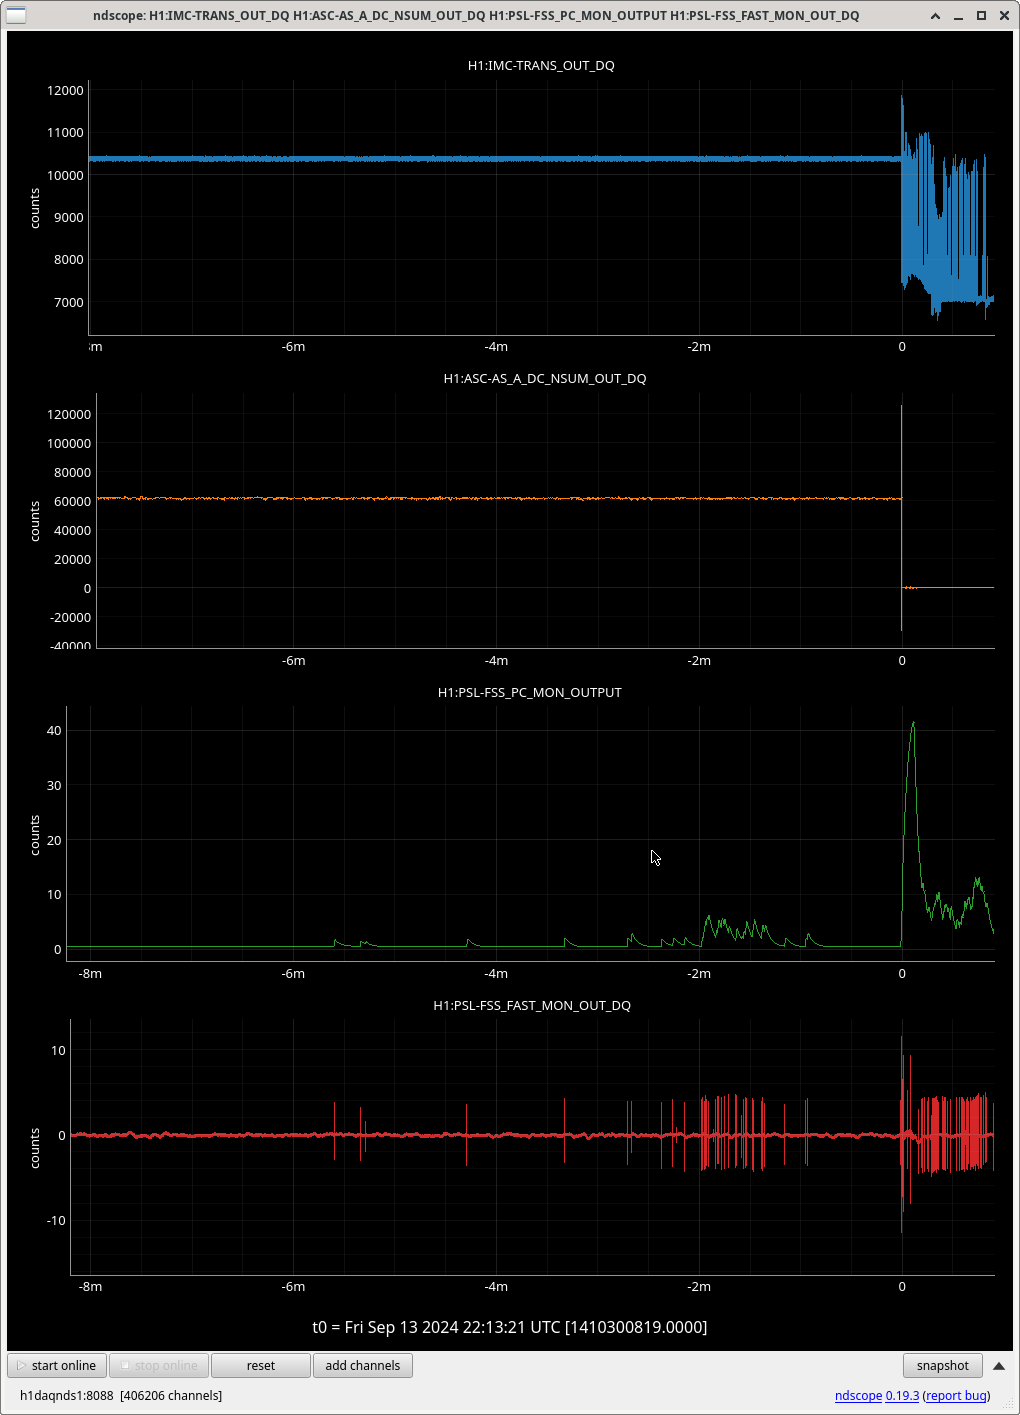
We dropped Observing overnight from 11:47 -> 11:48 UTC and 12:00 -> 12:17 UTC from the ITMY_CO2 laser having to relock.
h1pslcam1 isn't connecting on NUC21