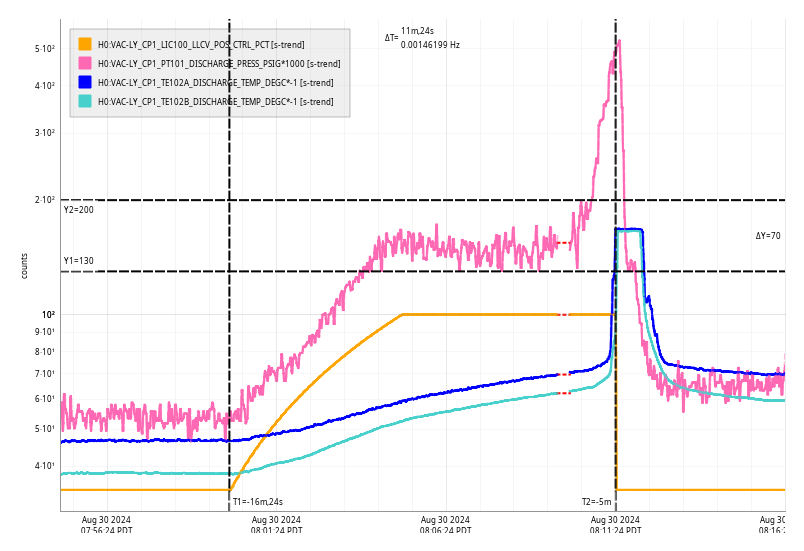
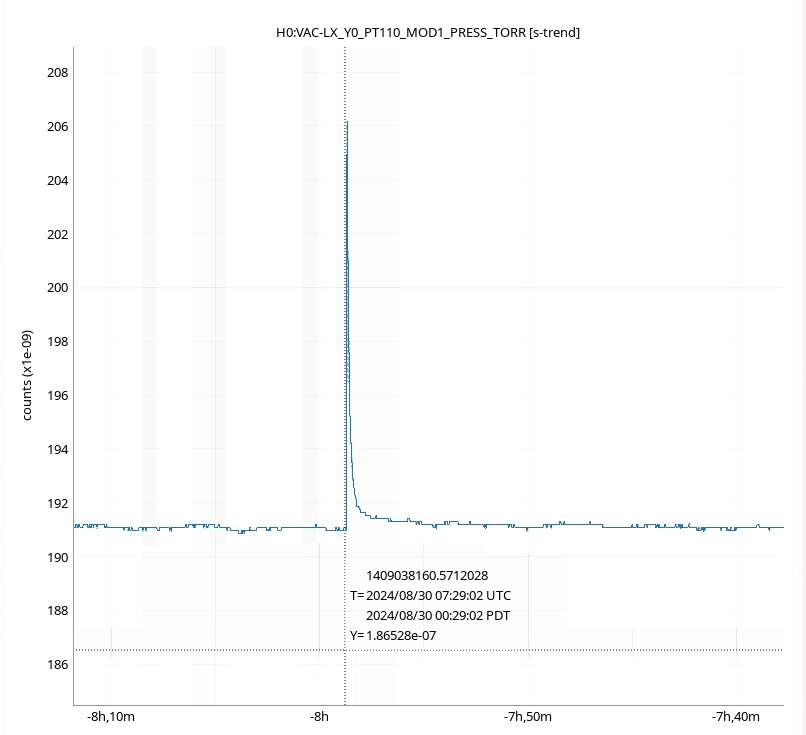
at 00:29 Fri 30 Aug 2024 PDT there was a short vacuum glitch in HAM6 detected by PT110_MOD1.
The pressure increased from 1.90e-07 to 2.06e-07 Torr.
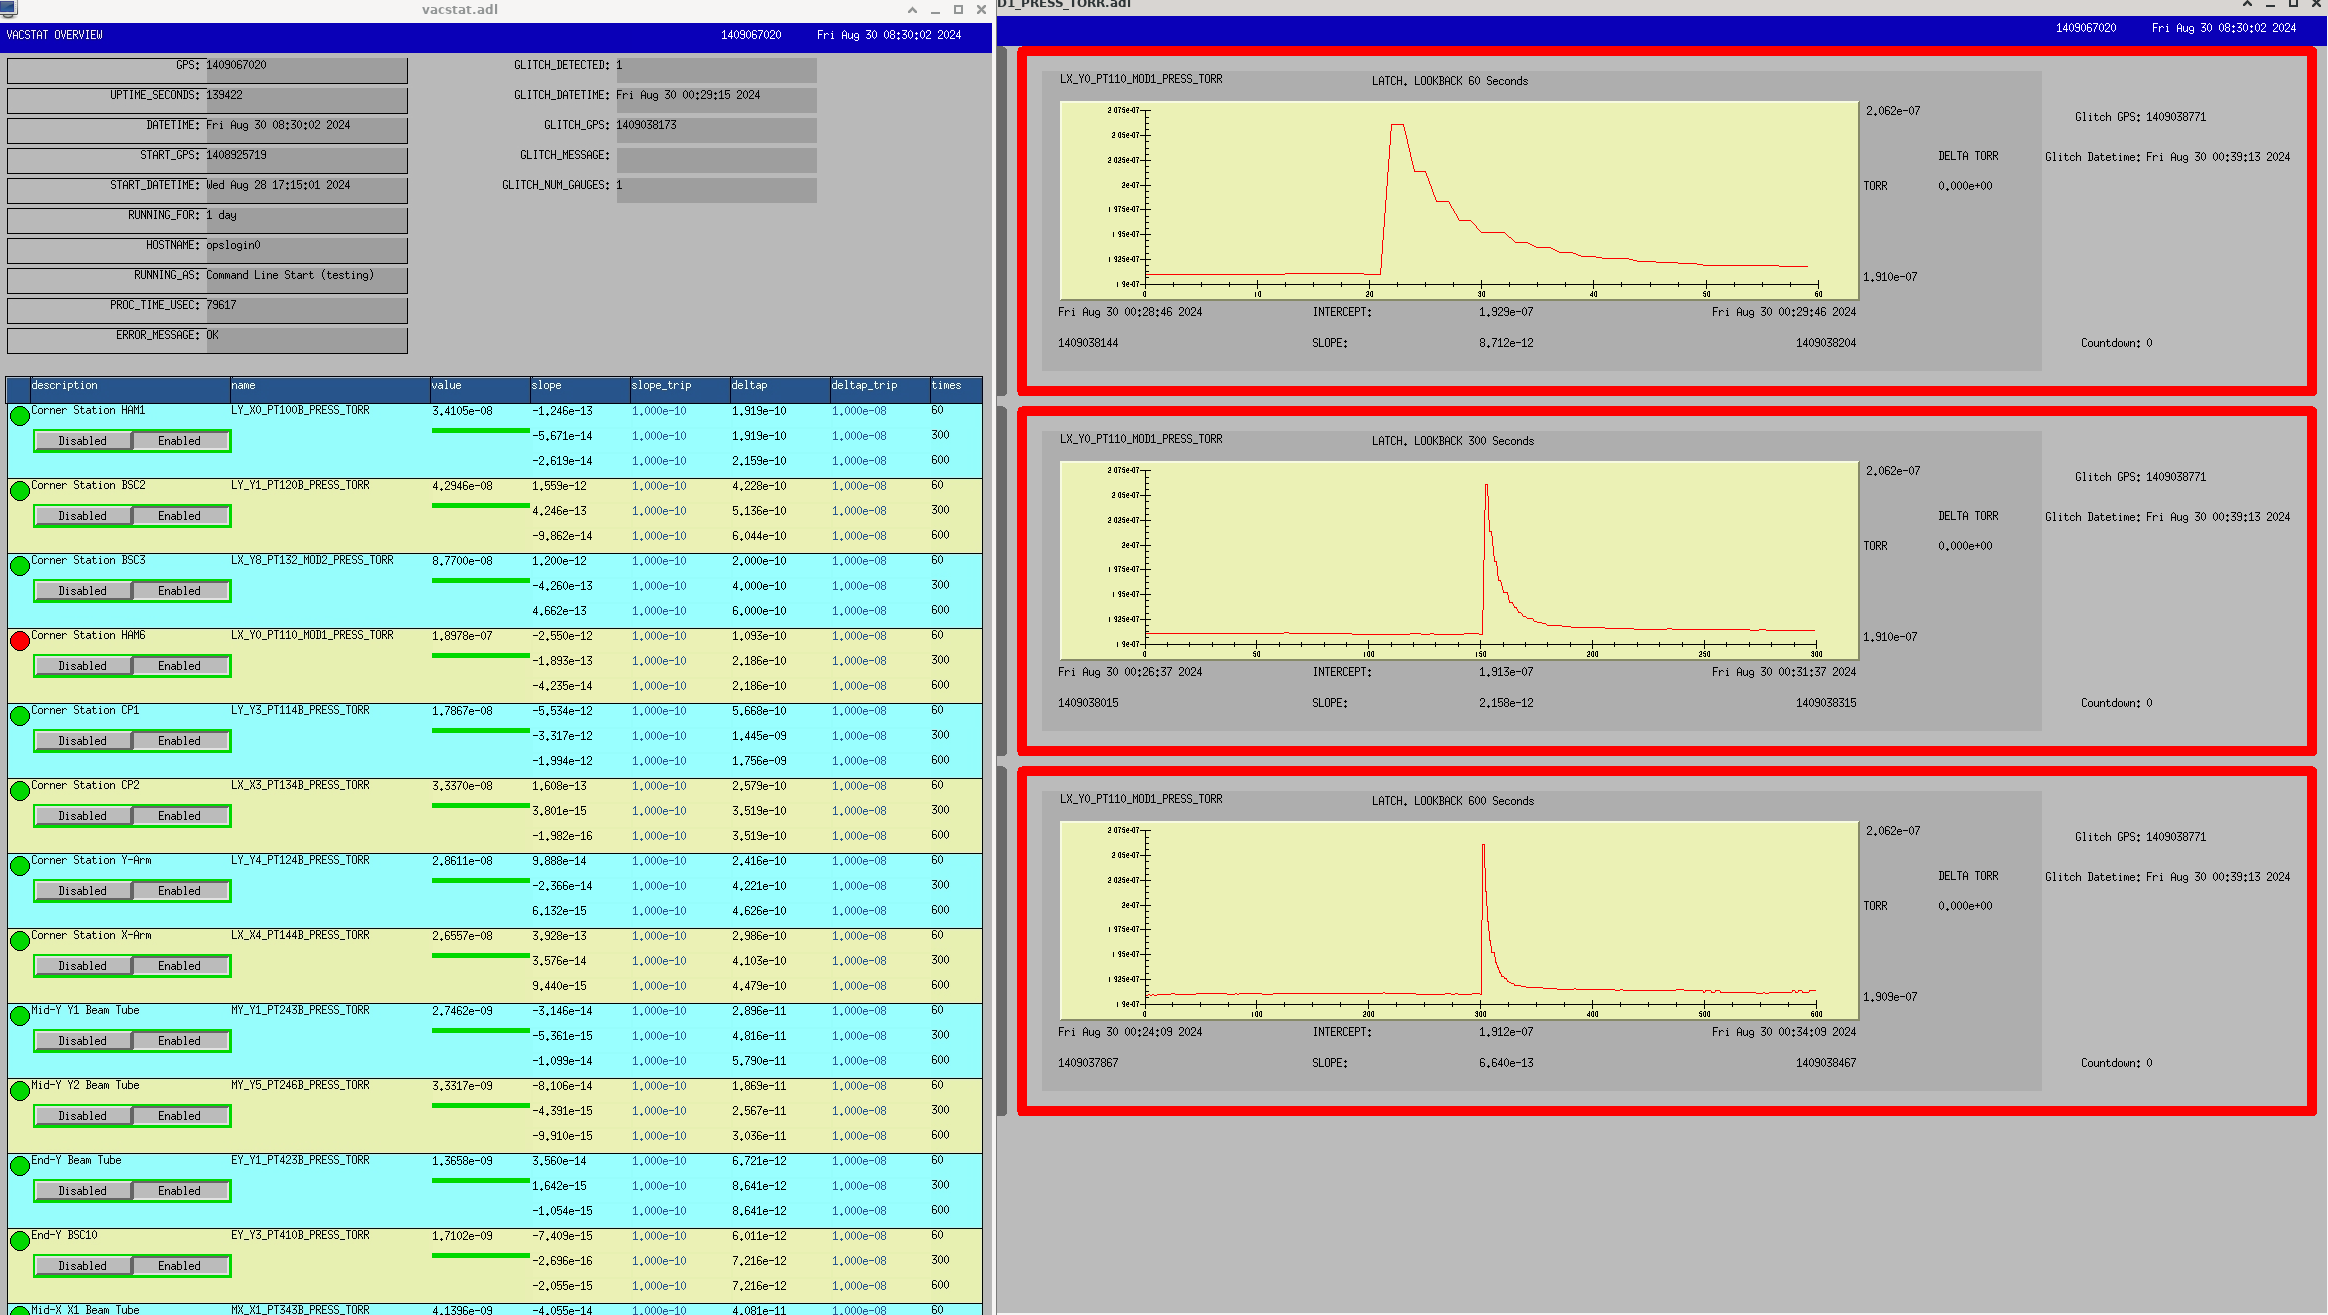
Gitch was detected by VACSTAT.
VACSTAT is in testing mode, and the MEDMs still needs some polishing. The Overview and PT110 MEDM are attached.
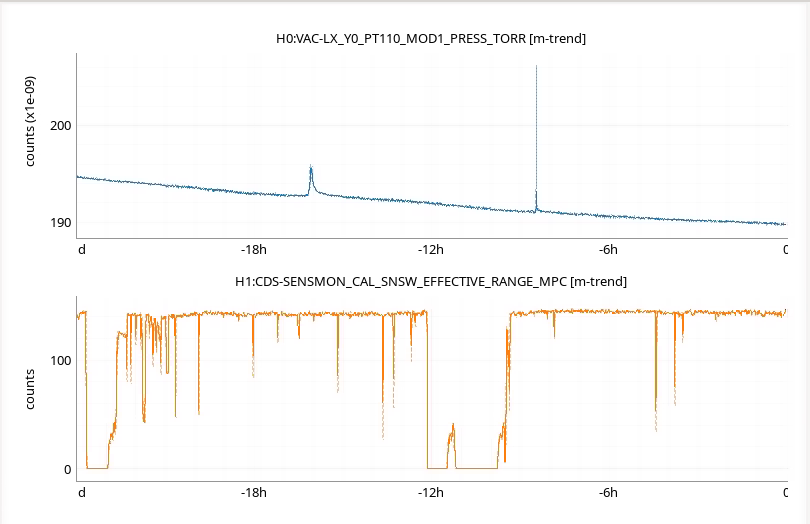
Gitch time doesn't appear to be related to H1 locking or unlocking. 24 hour PT110 and H1 range trend attached.
The smaller, wider glitch on left was at 16:51 Thu and is known about (pump operations as part of noise hunting). The 00:29 glitch is the larger, sharp one to the right.
I've promoted VACSTAT from a H3 test system to a H1 pre-production system. This allows me to add the channel H1:CDS-VAC_STAT_GLITCH_DETECTED to the alarms system (alarms was restarted 10:15). For testing it will send alarms to my cellphone.