Louis, Ibrahim
The test was successful and results can be found in:
/ligo/gitcommon/noise_recorder/data/pcaly_noise/
with some variant of today's date (03/16/24) and the title SRCLOFFSET
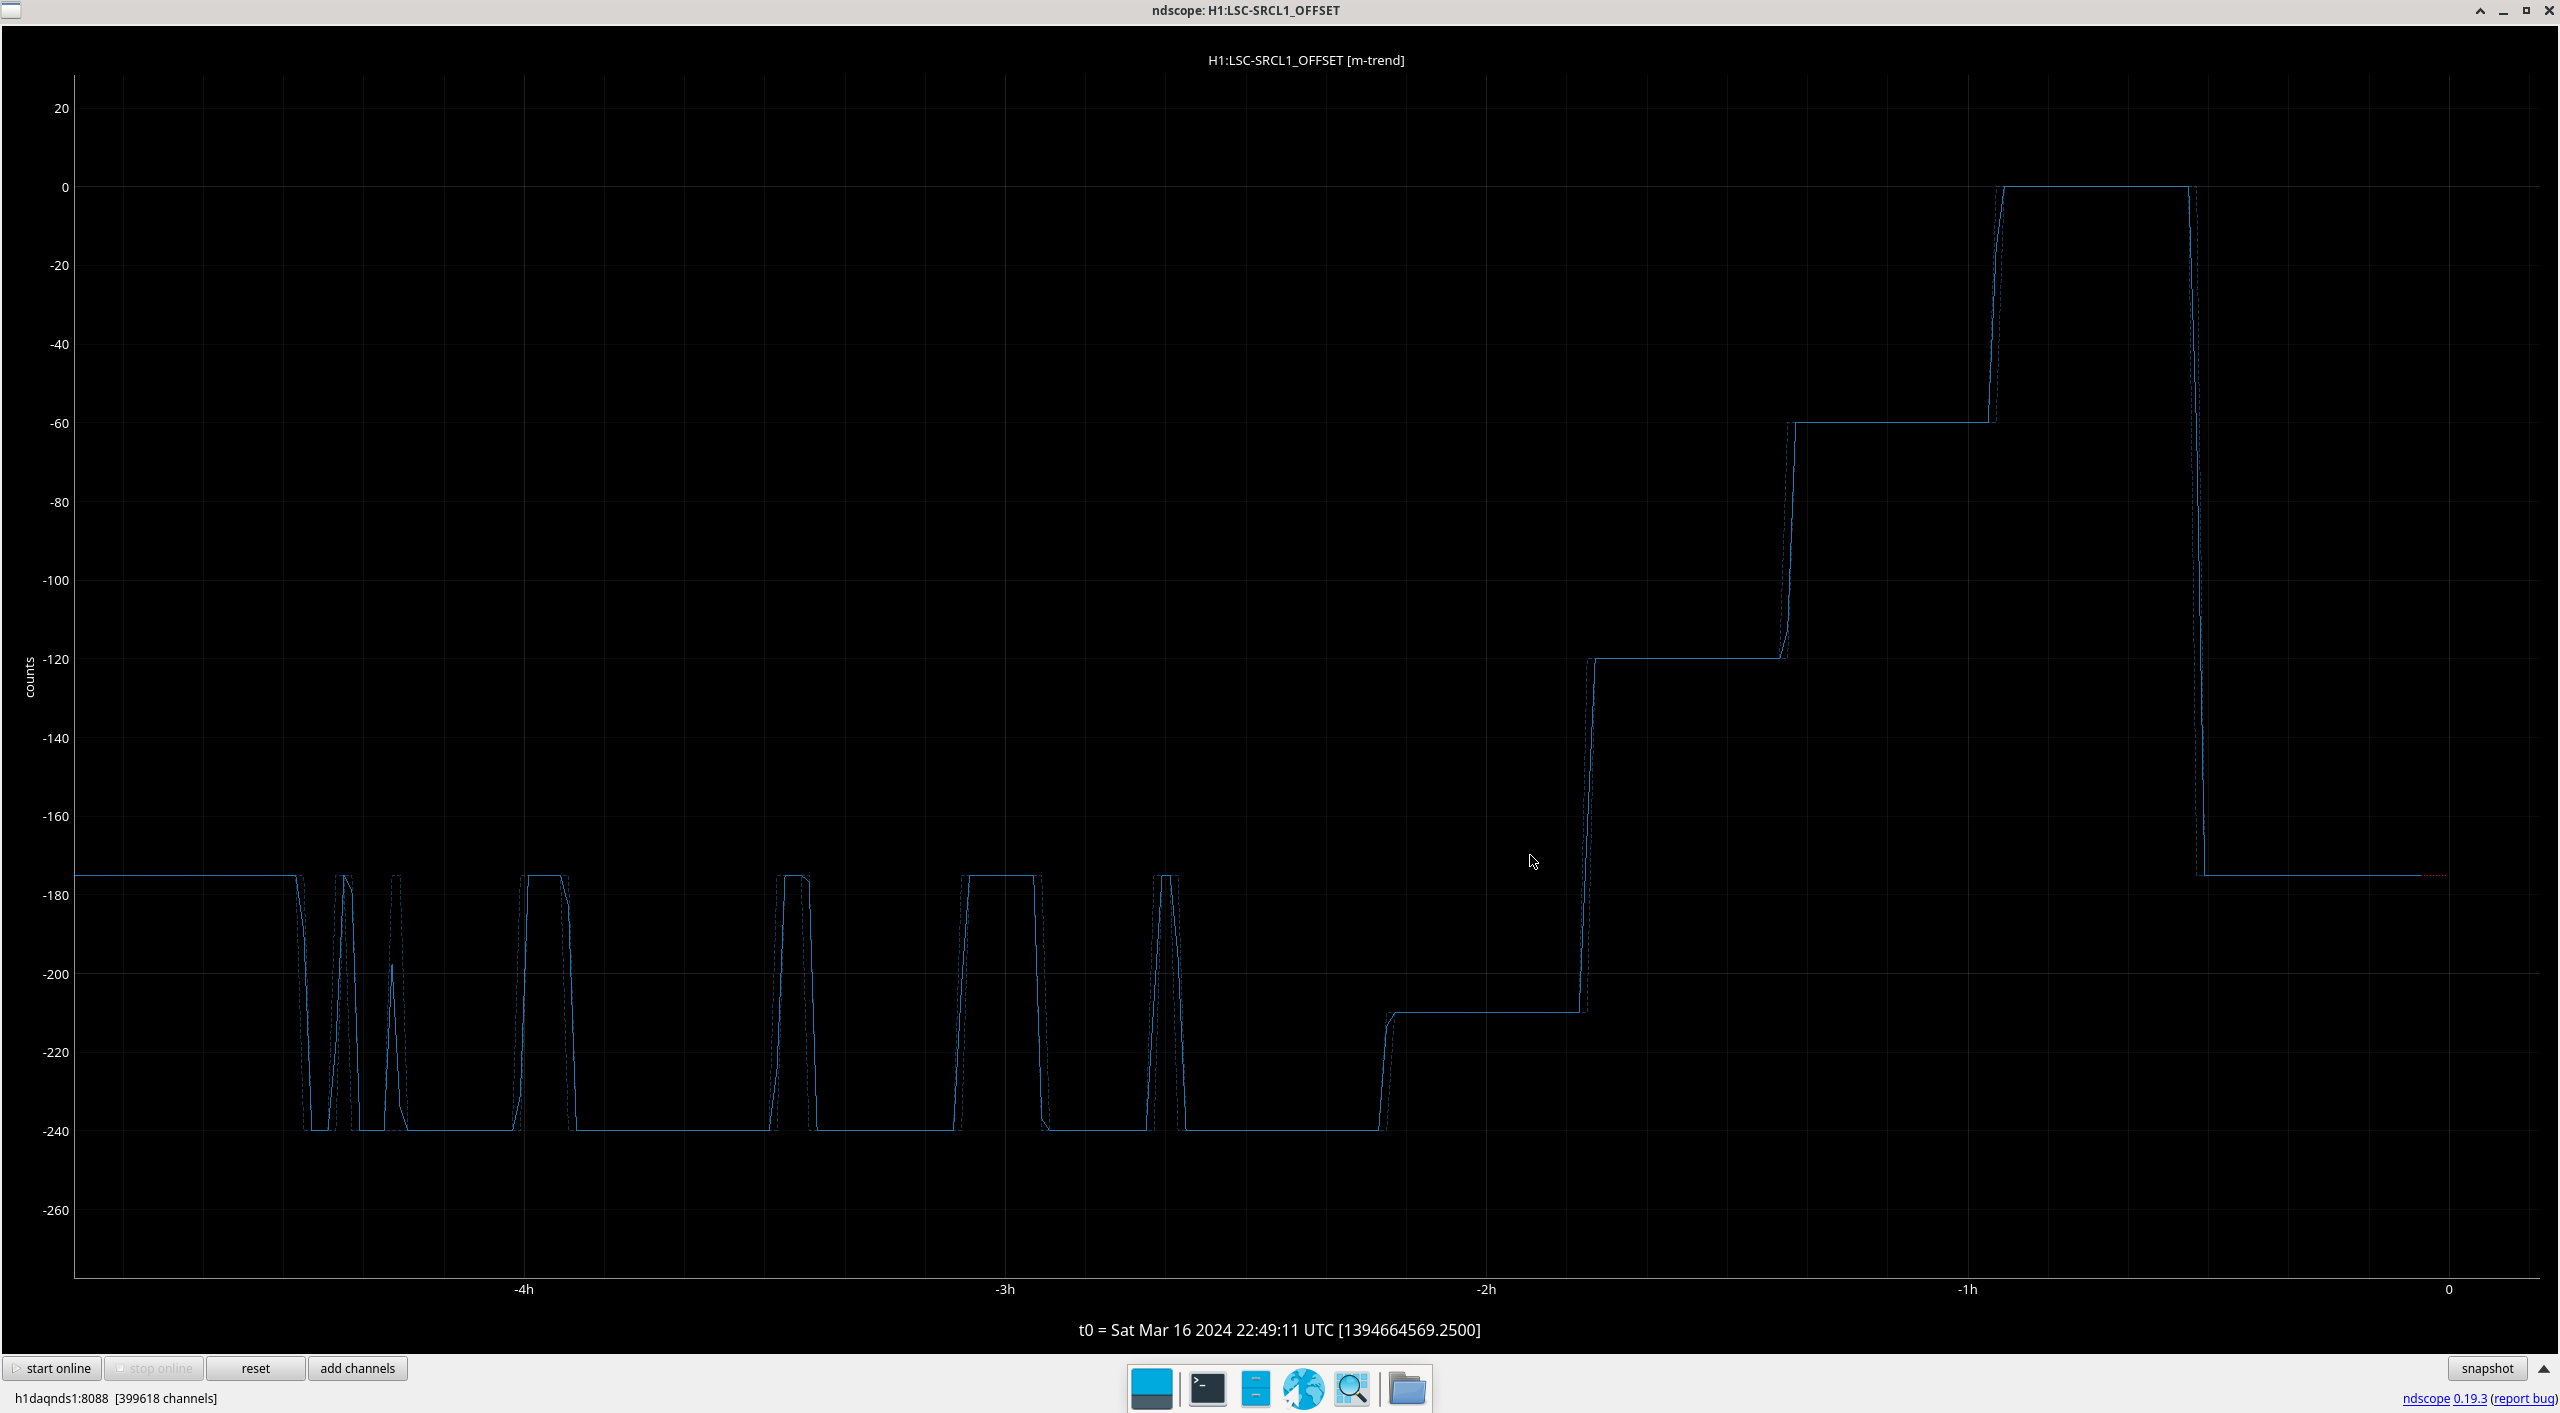
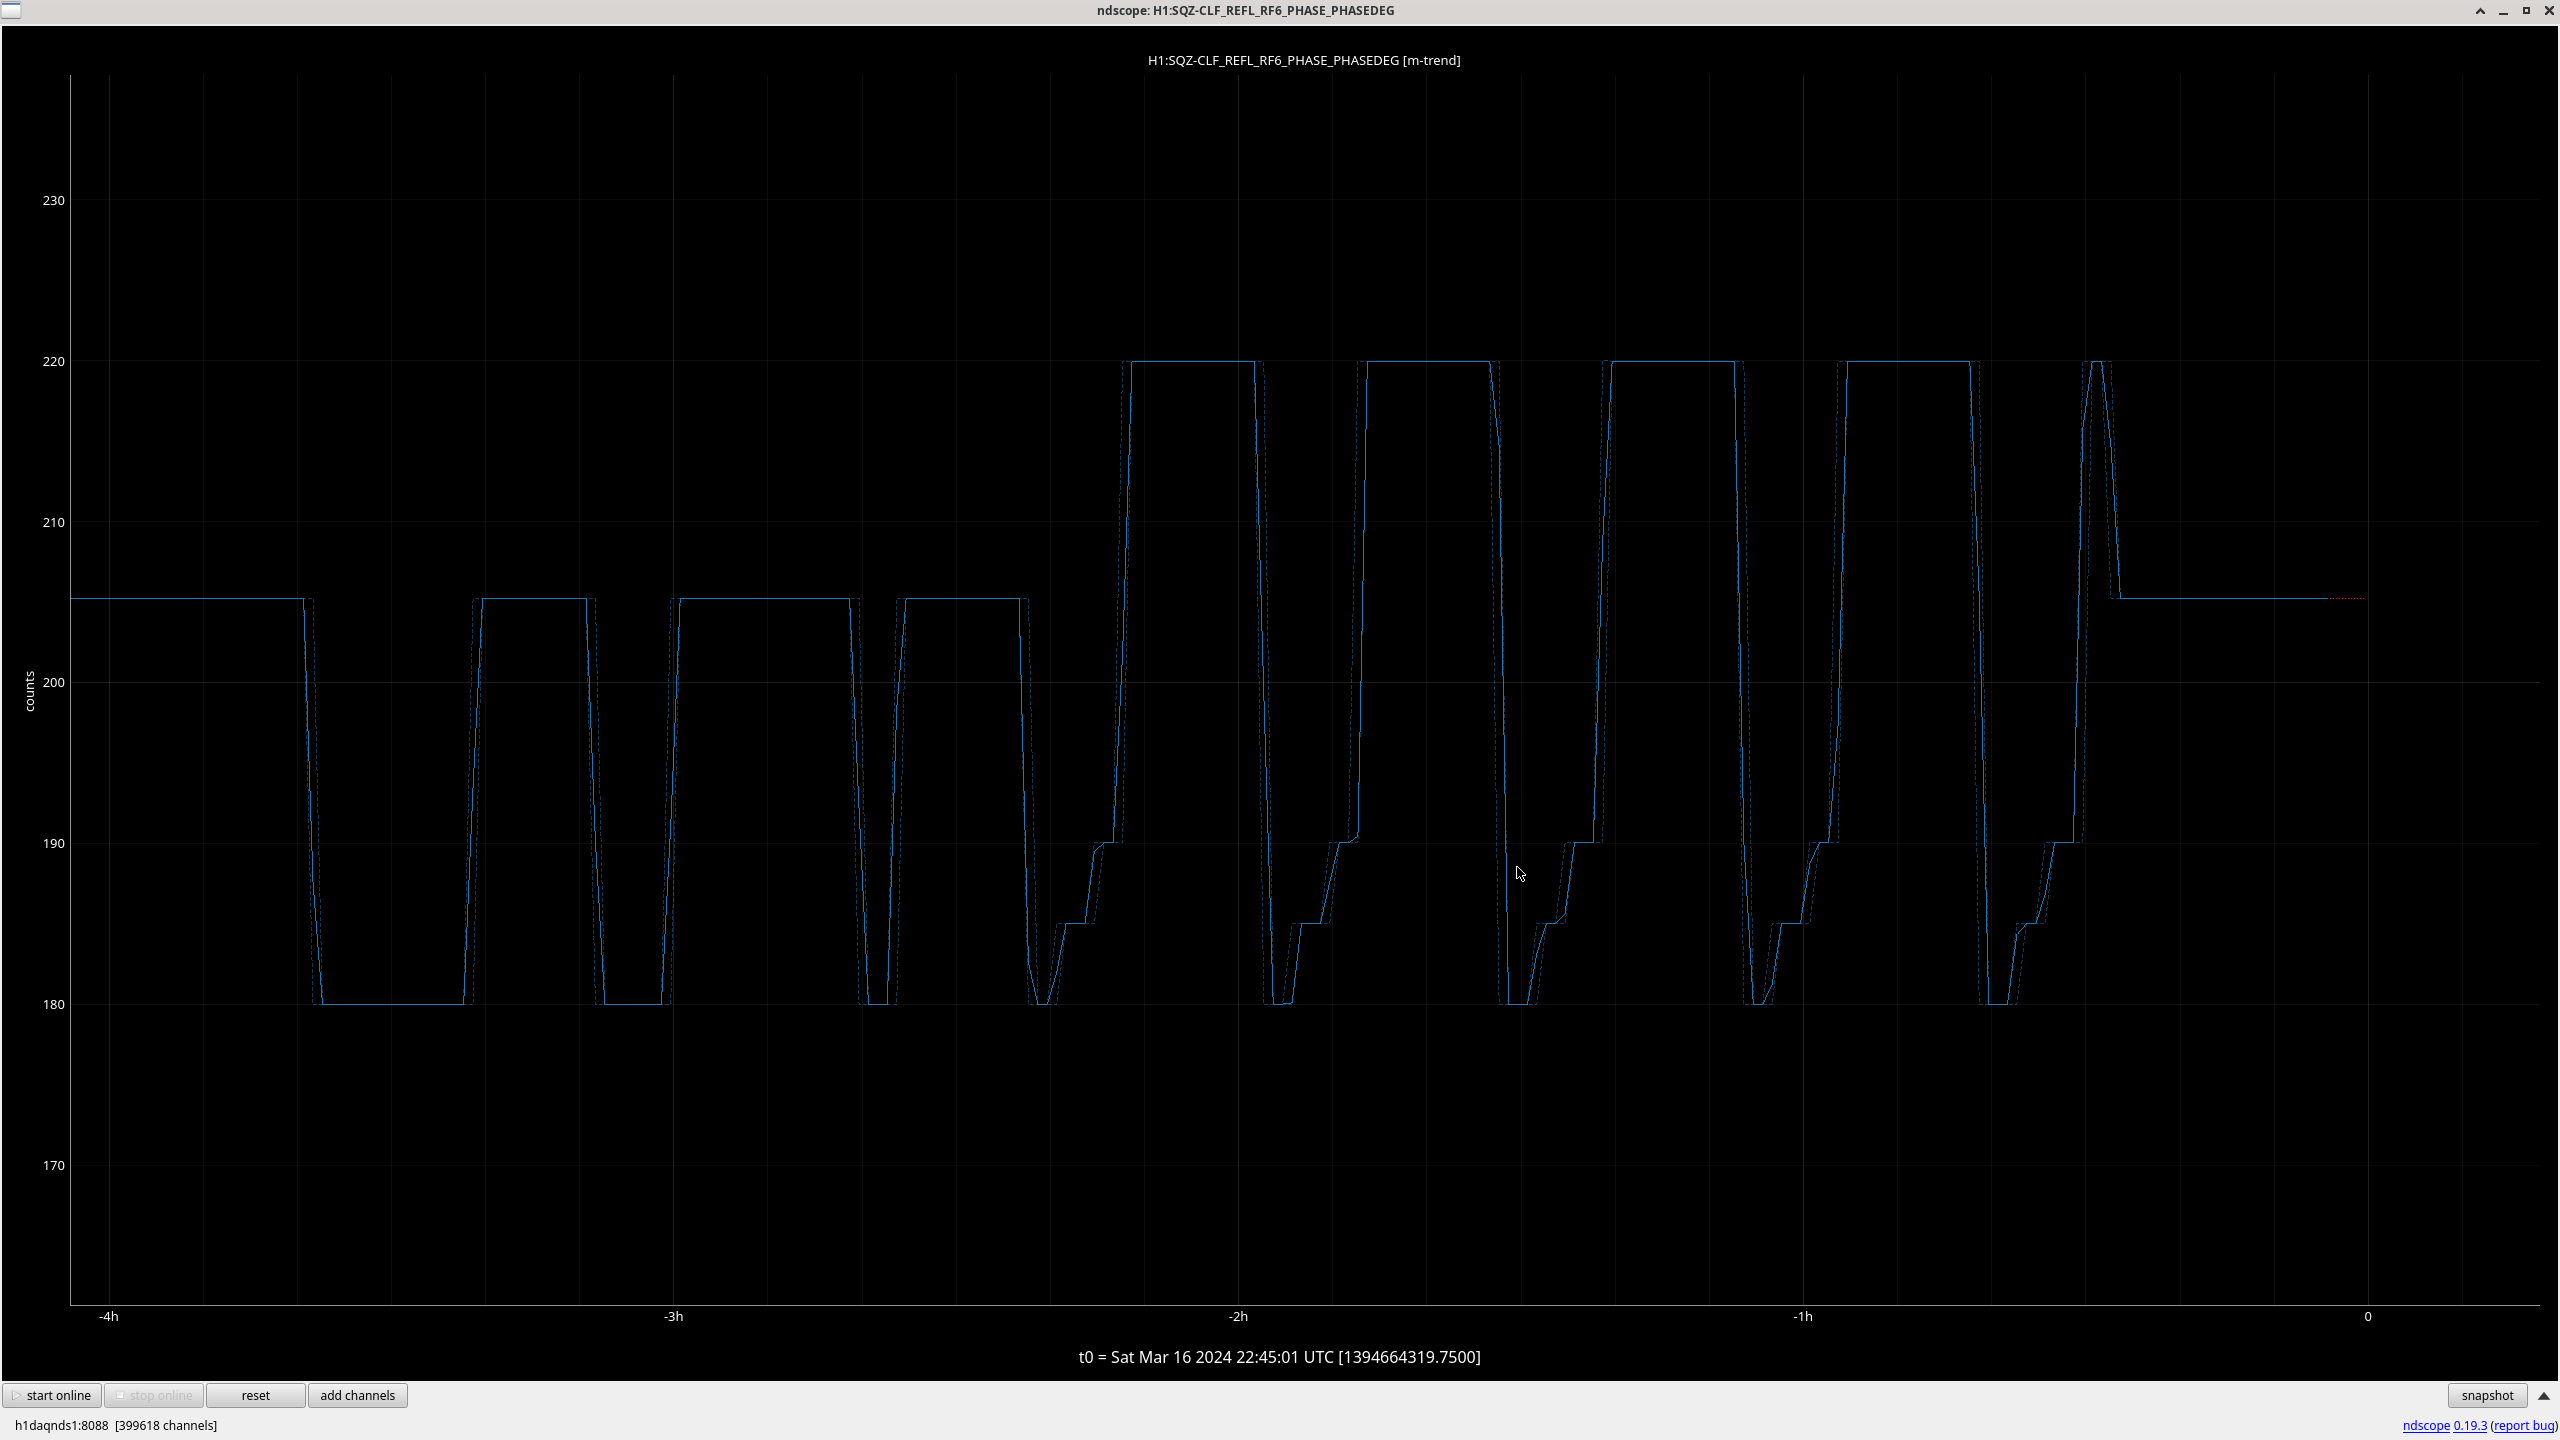
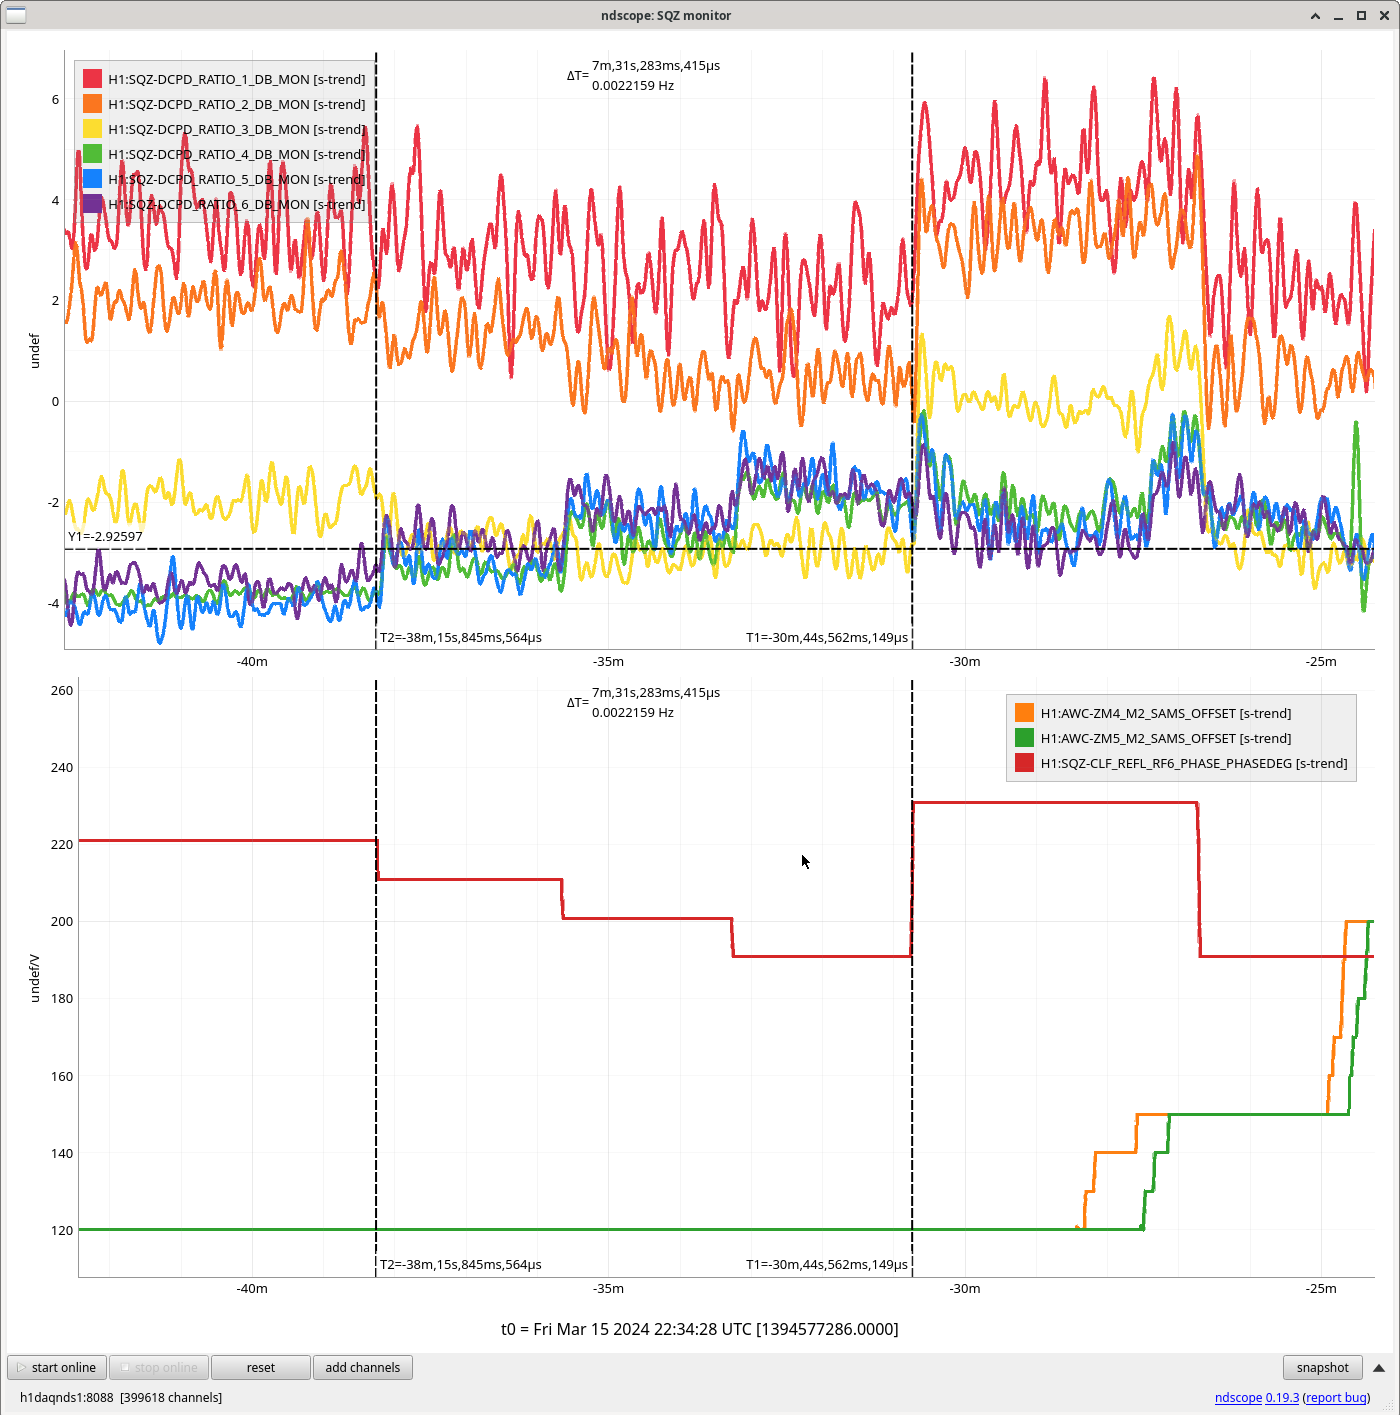
Screenshots show trends of both the SRC Offset and the SQZ Phase over the course of the test.
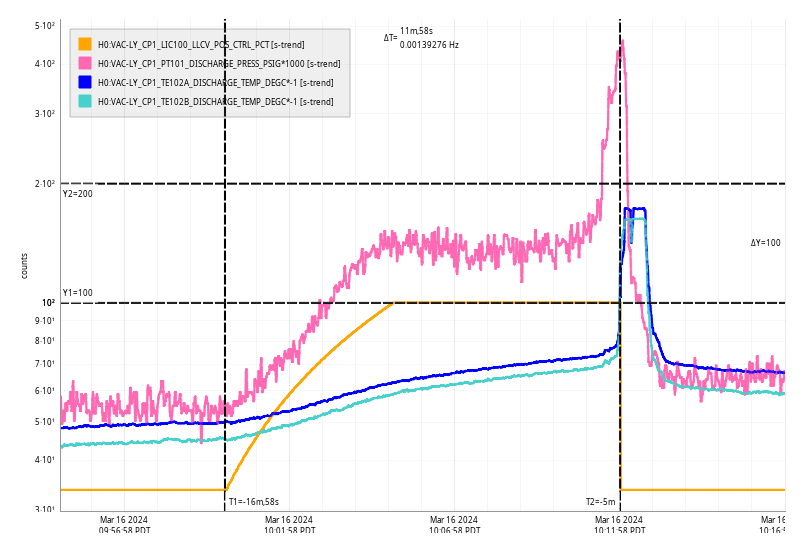
Sat Mar 16 10:11:58 2024 INFO: Fill completed in 11min 54secs
Louis, Ibrahim
Both ran without successfully without lockloss.
Approximate Broadband Start Time: 16:00 UTC
Simulines Start Time GPS: 1394641120
Simulines End Time GPS: 1394642411
Files Written:
2024-03-16 16:39:53,184 | INFO | File written out to: /ligo/groups/cal/H1/measurements/DARMOLG_SS/DARMOLG_SS_20240316T161823Z.hdf5
2024-03-16 16:39:53,191 | INFO | File written out to: /ligo/groups/cal/H1/measurements/PCALY2DARM_SS/PCALY2DARM_SS_20240316T161823Z.hdf5
2024-03-16 16:39:53,196 | INFO | File written out to: /ligo/groups/cal/H1/measurements/SUSETMX_L1_SS/SUSETMX_L1_SS_20240316T161823Z.hdf5
2024-03-16 16:39:53,201 | INFO | File written out to: /ligo/groups/cal/H1/measurements/SUSETMX_L2_SS/SUSETMX_L2_SS_20240316T161823Z.hdf5
2024-03-16 16:39:53,205 | INFO | File written out to: /ligo/groups/cal/H1/measurements/SUSETMX_L3_SS/SUSETMX_L3_SS_20240316T161823Z.hdf5
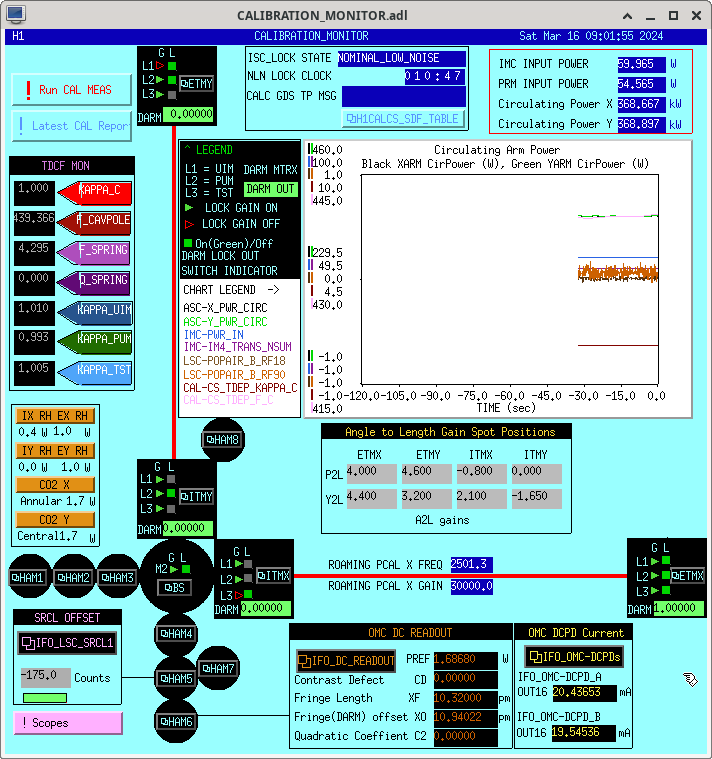
IFO Calibration Screen and H1 Calibration Report are attached
DARM Offset Test:
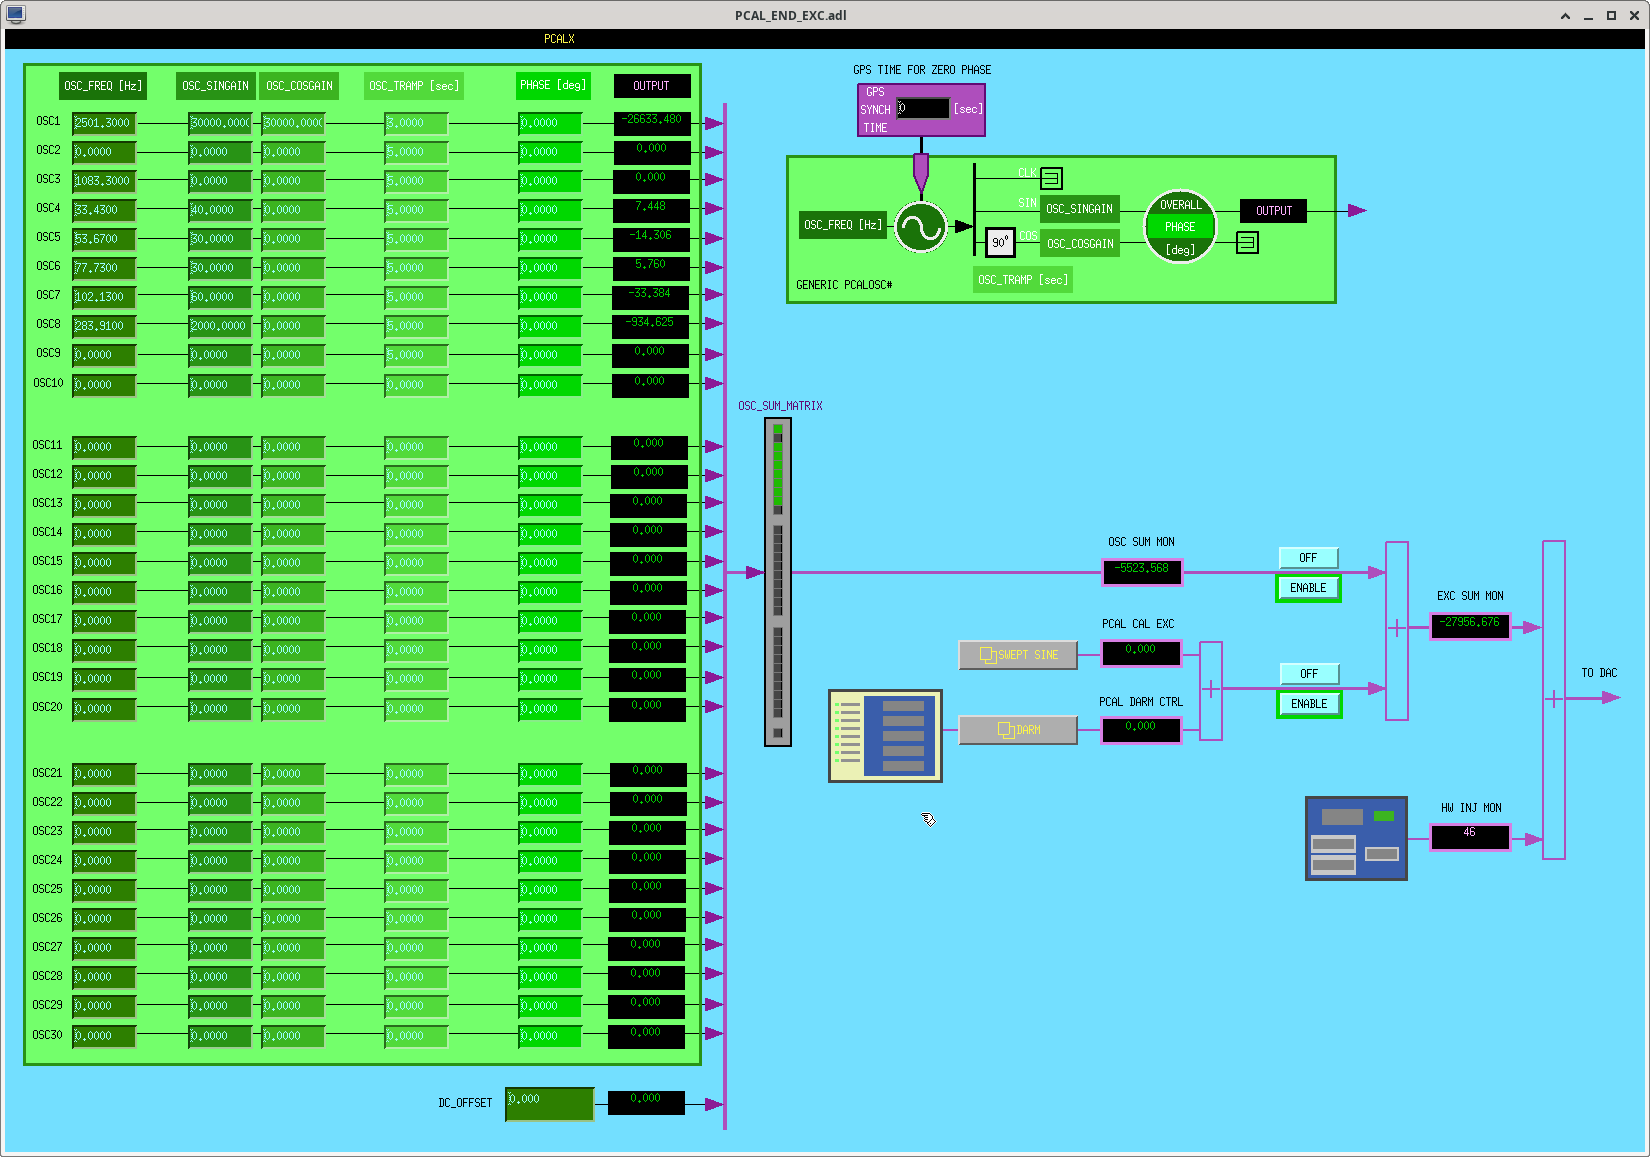
Test was run without issues and upon checking the PCAL X and Y Excitation screens, the only differences I can see before vs. after are in the OSC_TRAMP Times:
PCALX: OSC TRAMP (sec) OSC1 was 3 and went to 5
PCALY: OSC TRAMP (sec) OSC1-9 were 10 and went to 5.
I reverted these to their before values - everything else is the same (screenshots below).
I accidentally placed the analysis for this test as a comment on the wrong alog. Thanks Vicky for pointing this out!
See here for the optical gain and DARM offset plots.
I added a plot showing the loss ( inverse of the slope of attached graph) between the input of HAM 6 (AS port) and the DCPDs as in this entry.
This loss term is 1/1.247 = 0.802 with 653.7 mW of light insensitive to DARM at the AS port.
TITLE: 03/16 Day Shift: 15:00-23:00 UTC (08:00-16:00 PST), all times posted in UTC
STATE of H1: Commissioning
OUTGOING OPERATOR: None
CURRENT ENVIRONMENT:
SEI_ENV state: CALM
Wind: 1mph Gusts, 0mph 5min avg
Primary useism: 0.02 μm/s
Secondary useism: 0.23 μm/s
QUICK SUMMARY:
IFO is in NLN and COMISSIONING (9hr 44 min lock)
Other:
EX Pressure EX_X5_PT526 MOD1 PRESS TORR is showing a yellow alert on the vacuum alarm handler - will investigate.
*H1:PEM-CS_DUST_PSL101 - dust counts did not change, please investigate - showing same alert as yesterday.
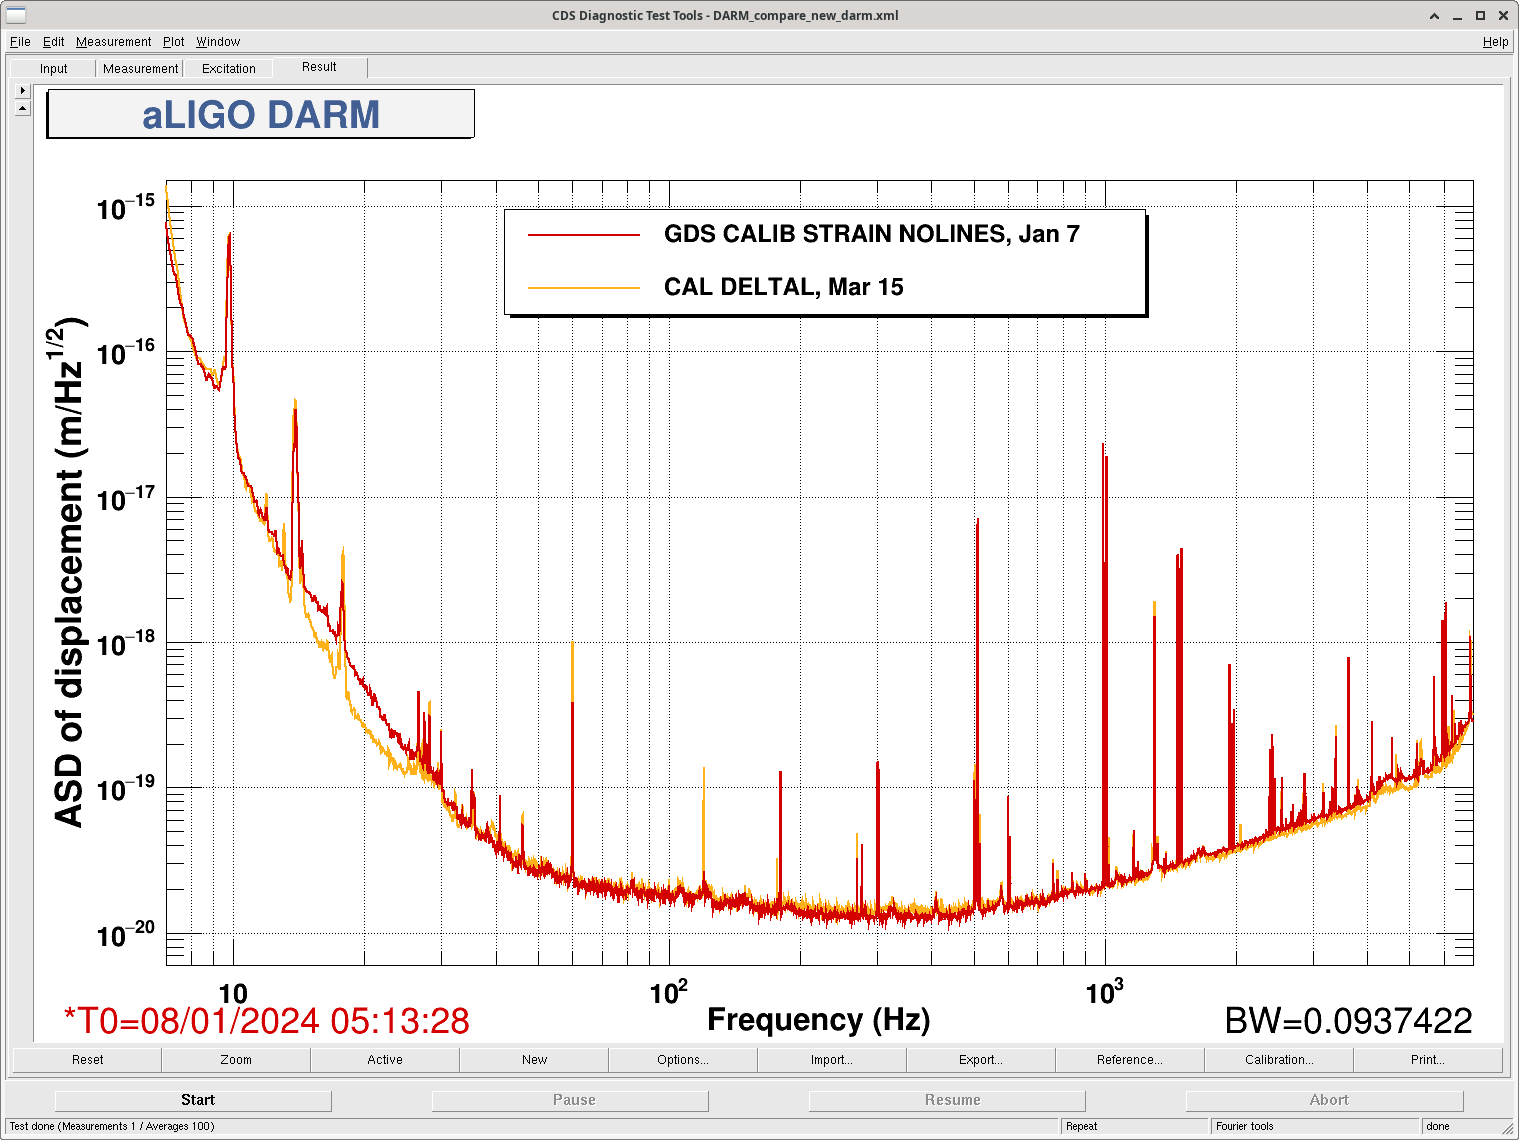
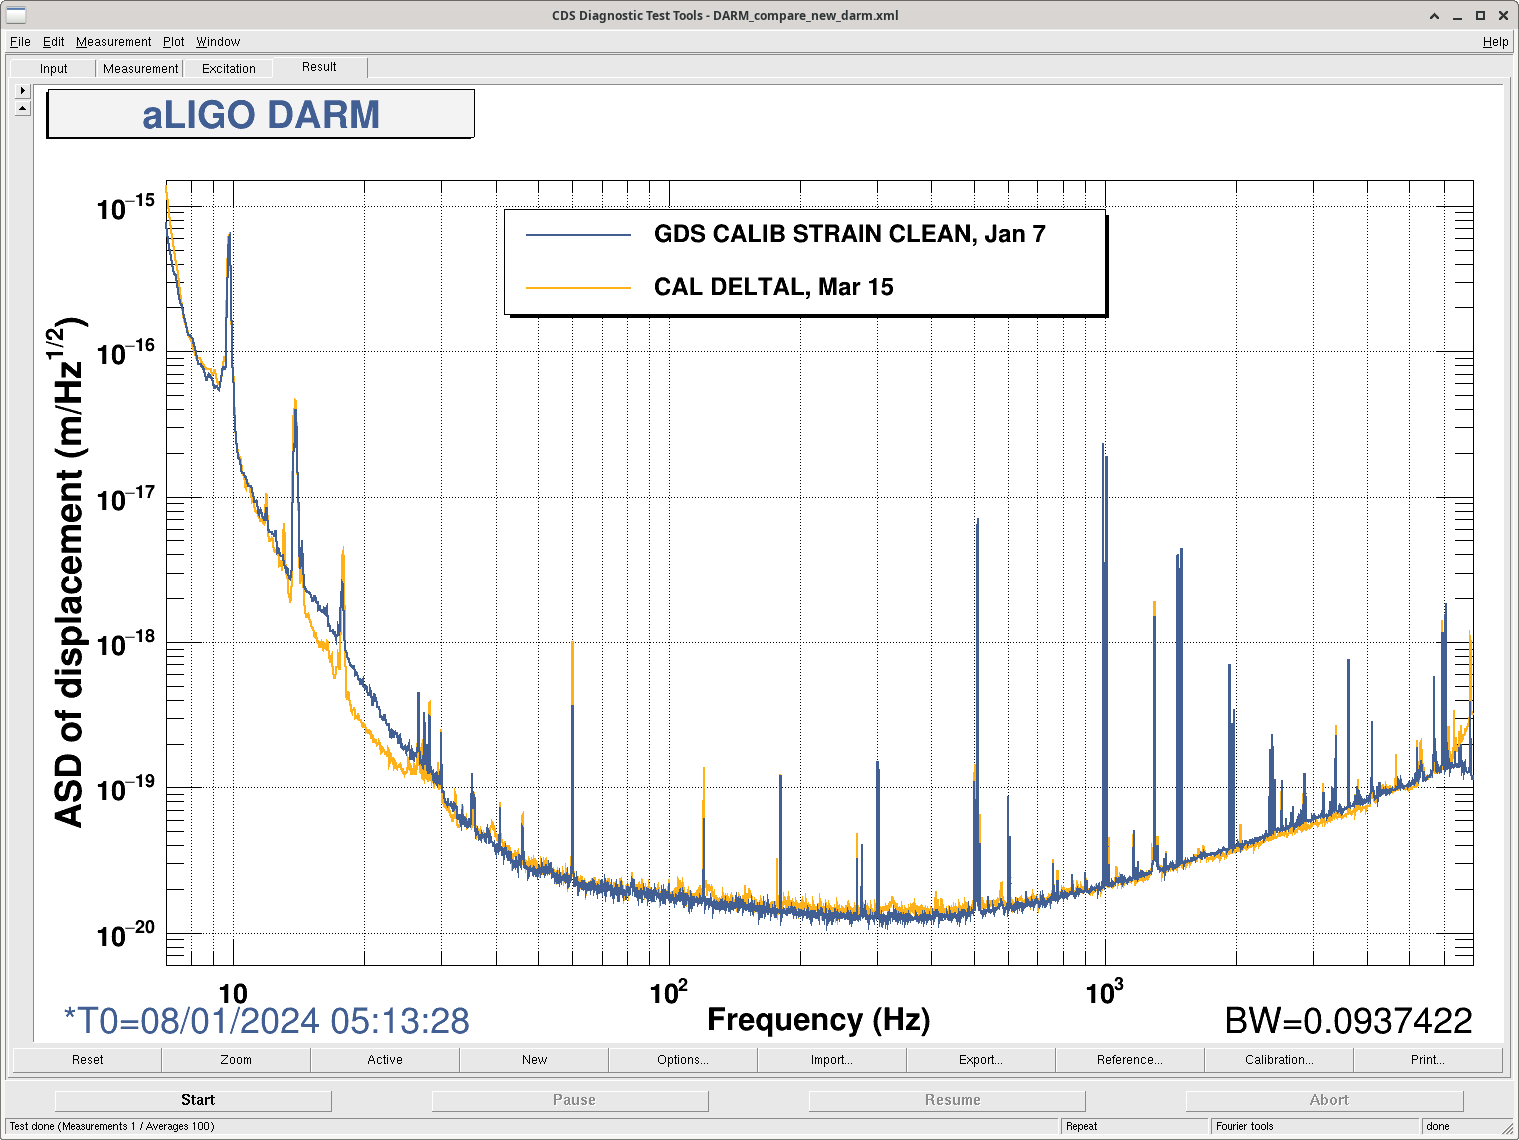
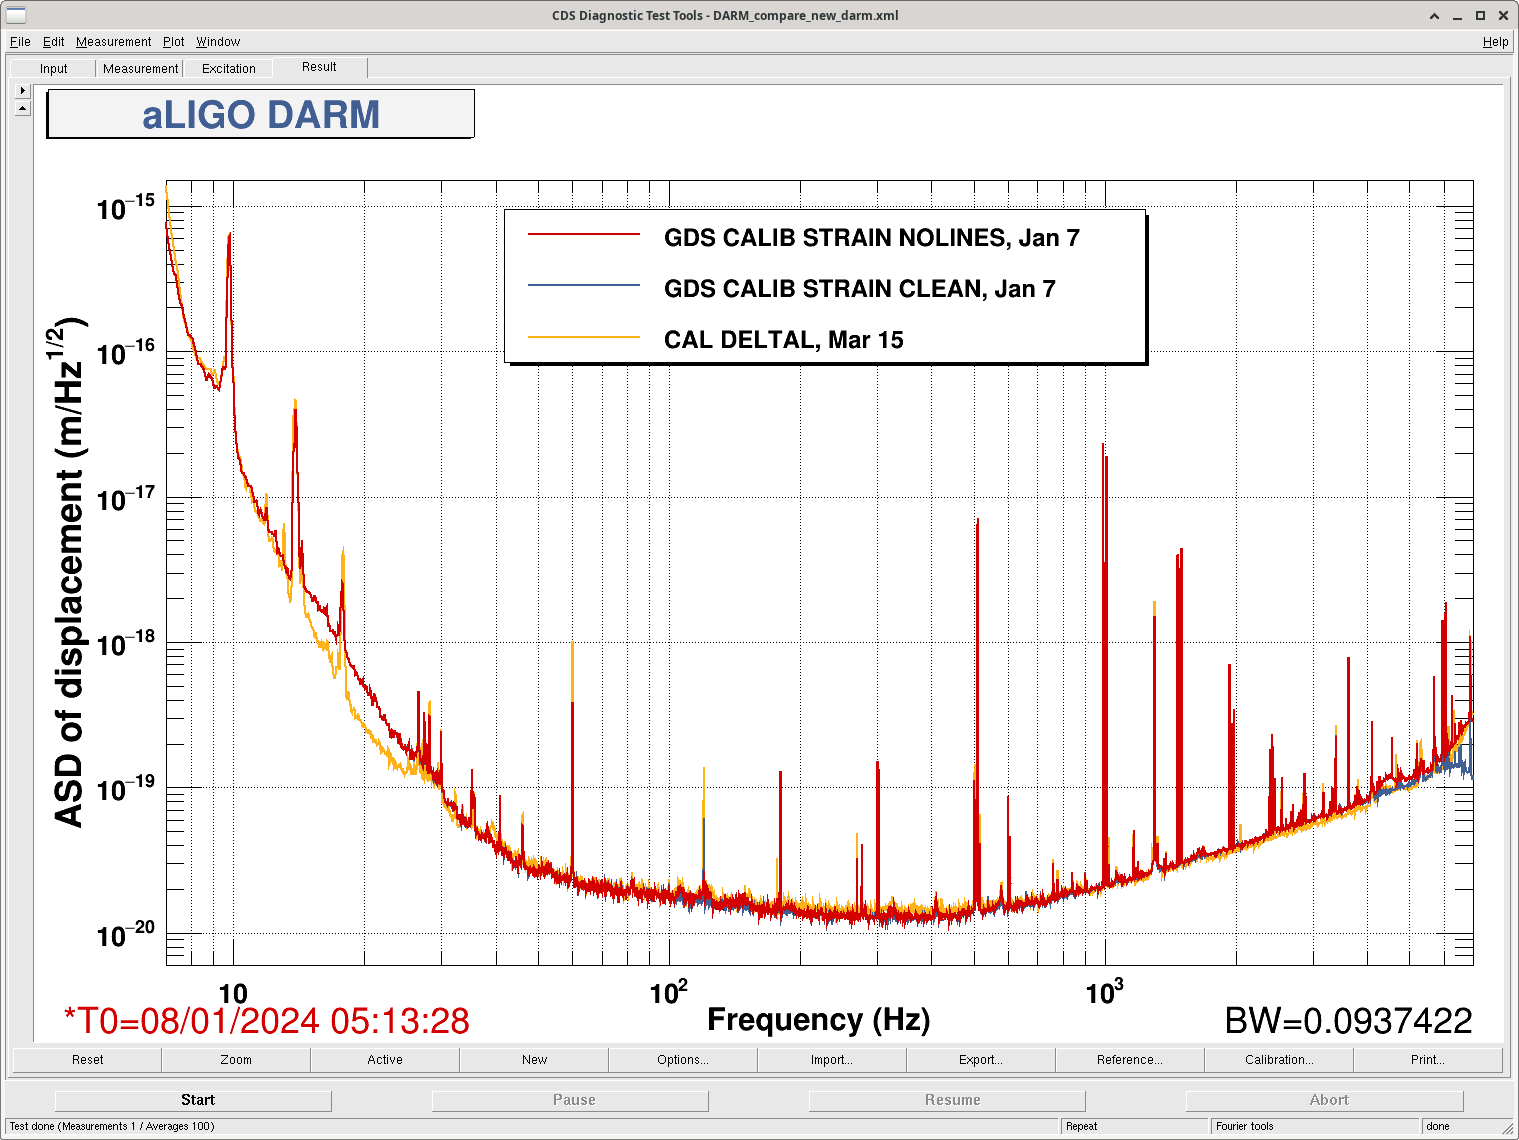
The squeezers performed some optimization of the squeezing today (76426), and we have our New DARM control implemented (76420). The calibration has been updated (76406), so I think we have a reliable look at our current sensitivity. Our current range is just above 150 Mpc, going between 151 and 156 on the sensmon range. This is lower than our best O4a range. However, looking at a comparison from a good O4a time, you can see pretty well where we are missing sensitivity.
I have attached three plots, comparing the CAL_DELTAL_EXTERNAL trace that is calibrated and with no cal lines on from today, to GDS CALIB STRAIN NOLINES and CLEAN taken on Jan 7 when we had close to 160 Mpc. I made a plot each to compare DELTAL/NOLINES and DELTAL/CLEAN and all three together, so the differences are more evident.
Clearly the low frequency range has a big improvement, which I think is mostly attributable to the new DARM. It's also much more stationary (76341). Great work! There is an unfortunate peaky structure around 25-30 Hz; this was present in O4a too and I think we are just revealing more of it with the improvement. There's a chance these are triple suspension bounce modes (70778). There appears to be some extra peaks and noise between 40-50 Hz.
The jitter noise appears to have gotten worse around 100 Hz, and this is especially evident in the GDS CLEAN comparison because a large portion of what is subtracted in CLEAN during O4a was jitter noise. It is now worse and also unsubtracted at the moment. Also, it appears we have lost some sensitivity from 200-500 Hz, which I think we can attribute to squeezing not being exactly tuned for that region.
Meanwhile, the squeezing improvements are incredibly significant at 2 kHz and above, where the squeezing team says they are reaching 5 dB of squeezing! This is fantastic, but given the loss at 300 Hz, I wonder if it's possible to optimize for the bucket (just making this suggestion based on what I've heard from the sqz team in the past).
Some additional notes for further commissioning work:
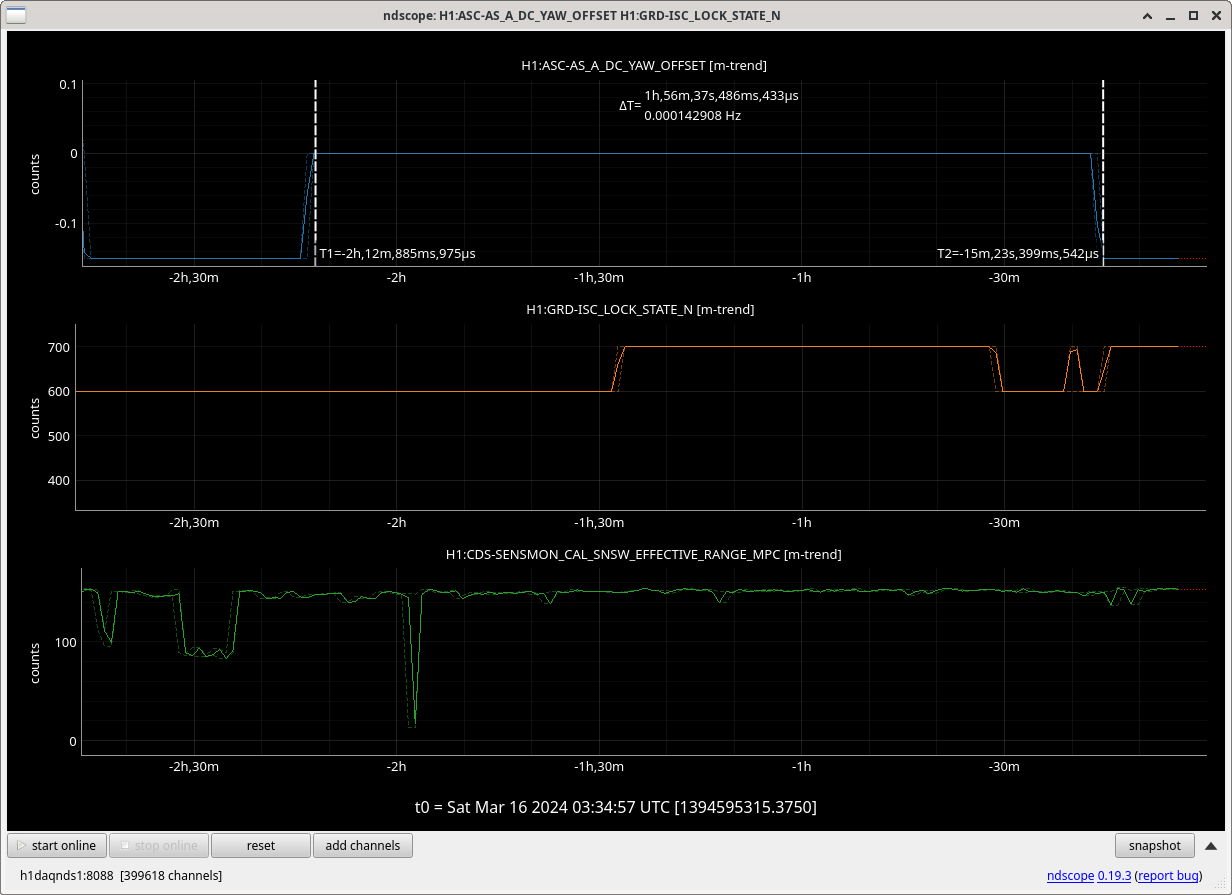
I turned off the AS A WFS yaw offset for the squeezers. I then turned it on to compare DARM sensitivity. There may be a small low frequency improvement with it on, but I see no change at mid and high frequency. I will leave it on overnight. If we lose lock, the offset will turn off and stay off.
Off: 1394587398
On: 1394594390
Georgia, Trent
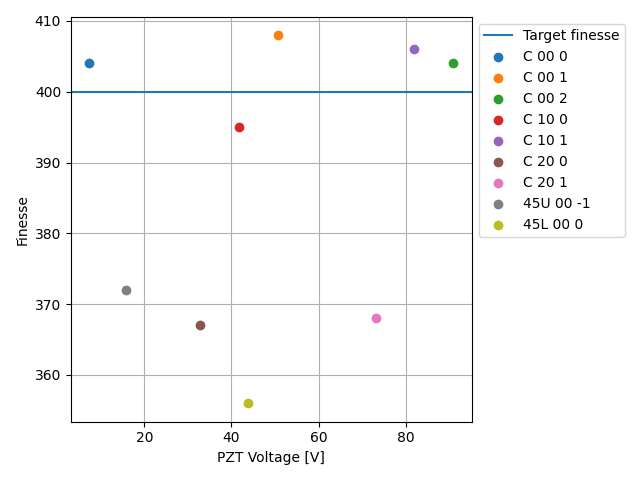
To get the finesse of the omc as a function of the pzt voltage (in order to double check the pzt voltage calibration). OMCscan.py has shortcoming in that it doesn't like when there are more than three carrier 00 peaks so to get three carrier 00 peaks that were included in my initial scan I had to seperate the data into two "bins". I had the GPS time 1393542033 with a duration of 80 to get the first two peaks and the GPS time 1393542063 with a duration of 60 to get the second and third peaks. The links of the GPS times are the corresponding pzt calibrations. The links in the finesse are the zoomed in plots for the corresponsing peaks. To get the plots we ran OMCscan.py and fit_peak_w_args.py
| Field | Mode | q | Finesse | PZT Voltage [V] |
| Carrier | 00 | 0 | 404 | 7.3 |
| 1 | 408 | 50.6 | ||
| 2 | 404 | 91.0 | ||
| 10 | 0 | 395 | 41.8 | |
| 1 | 406 | 82.0 | ||
| 20 | 0 | 367 | 32.7 | |
| 1 | 368 | 73.1 | ||
| 45 upper | 00 | -1 | 372 | 15.7 |
| 45 lower | 00 | 0 | 356 | 43.7 |
Sweeps from /ligo/gitcommon/psl_measurements/templates: IMC OLG UGF 69 kHz CARM OLG UGF 17 kHz
(Jordan V., Gerardo M.)
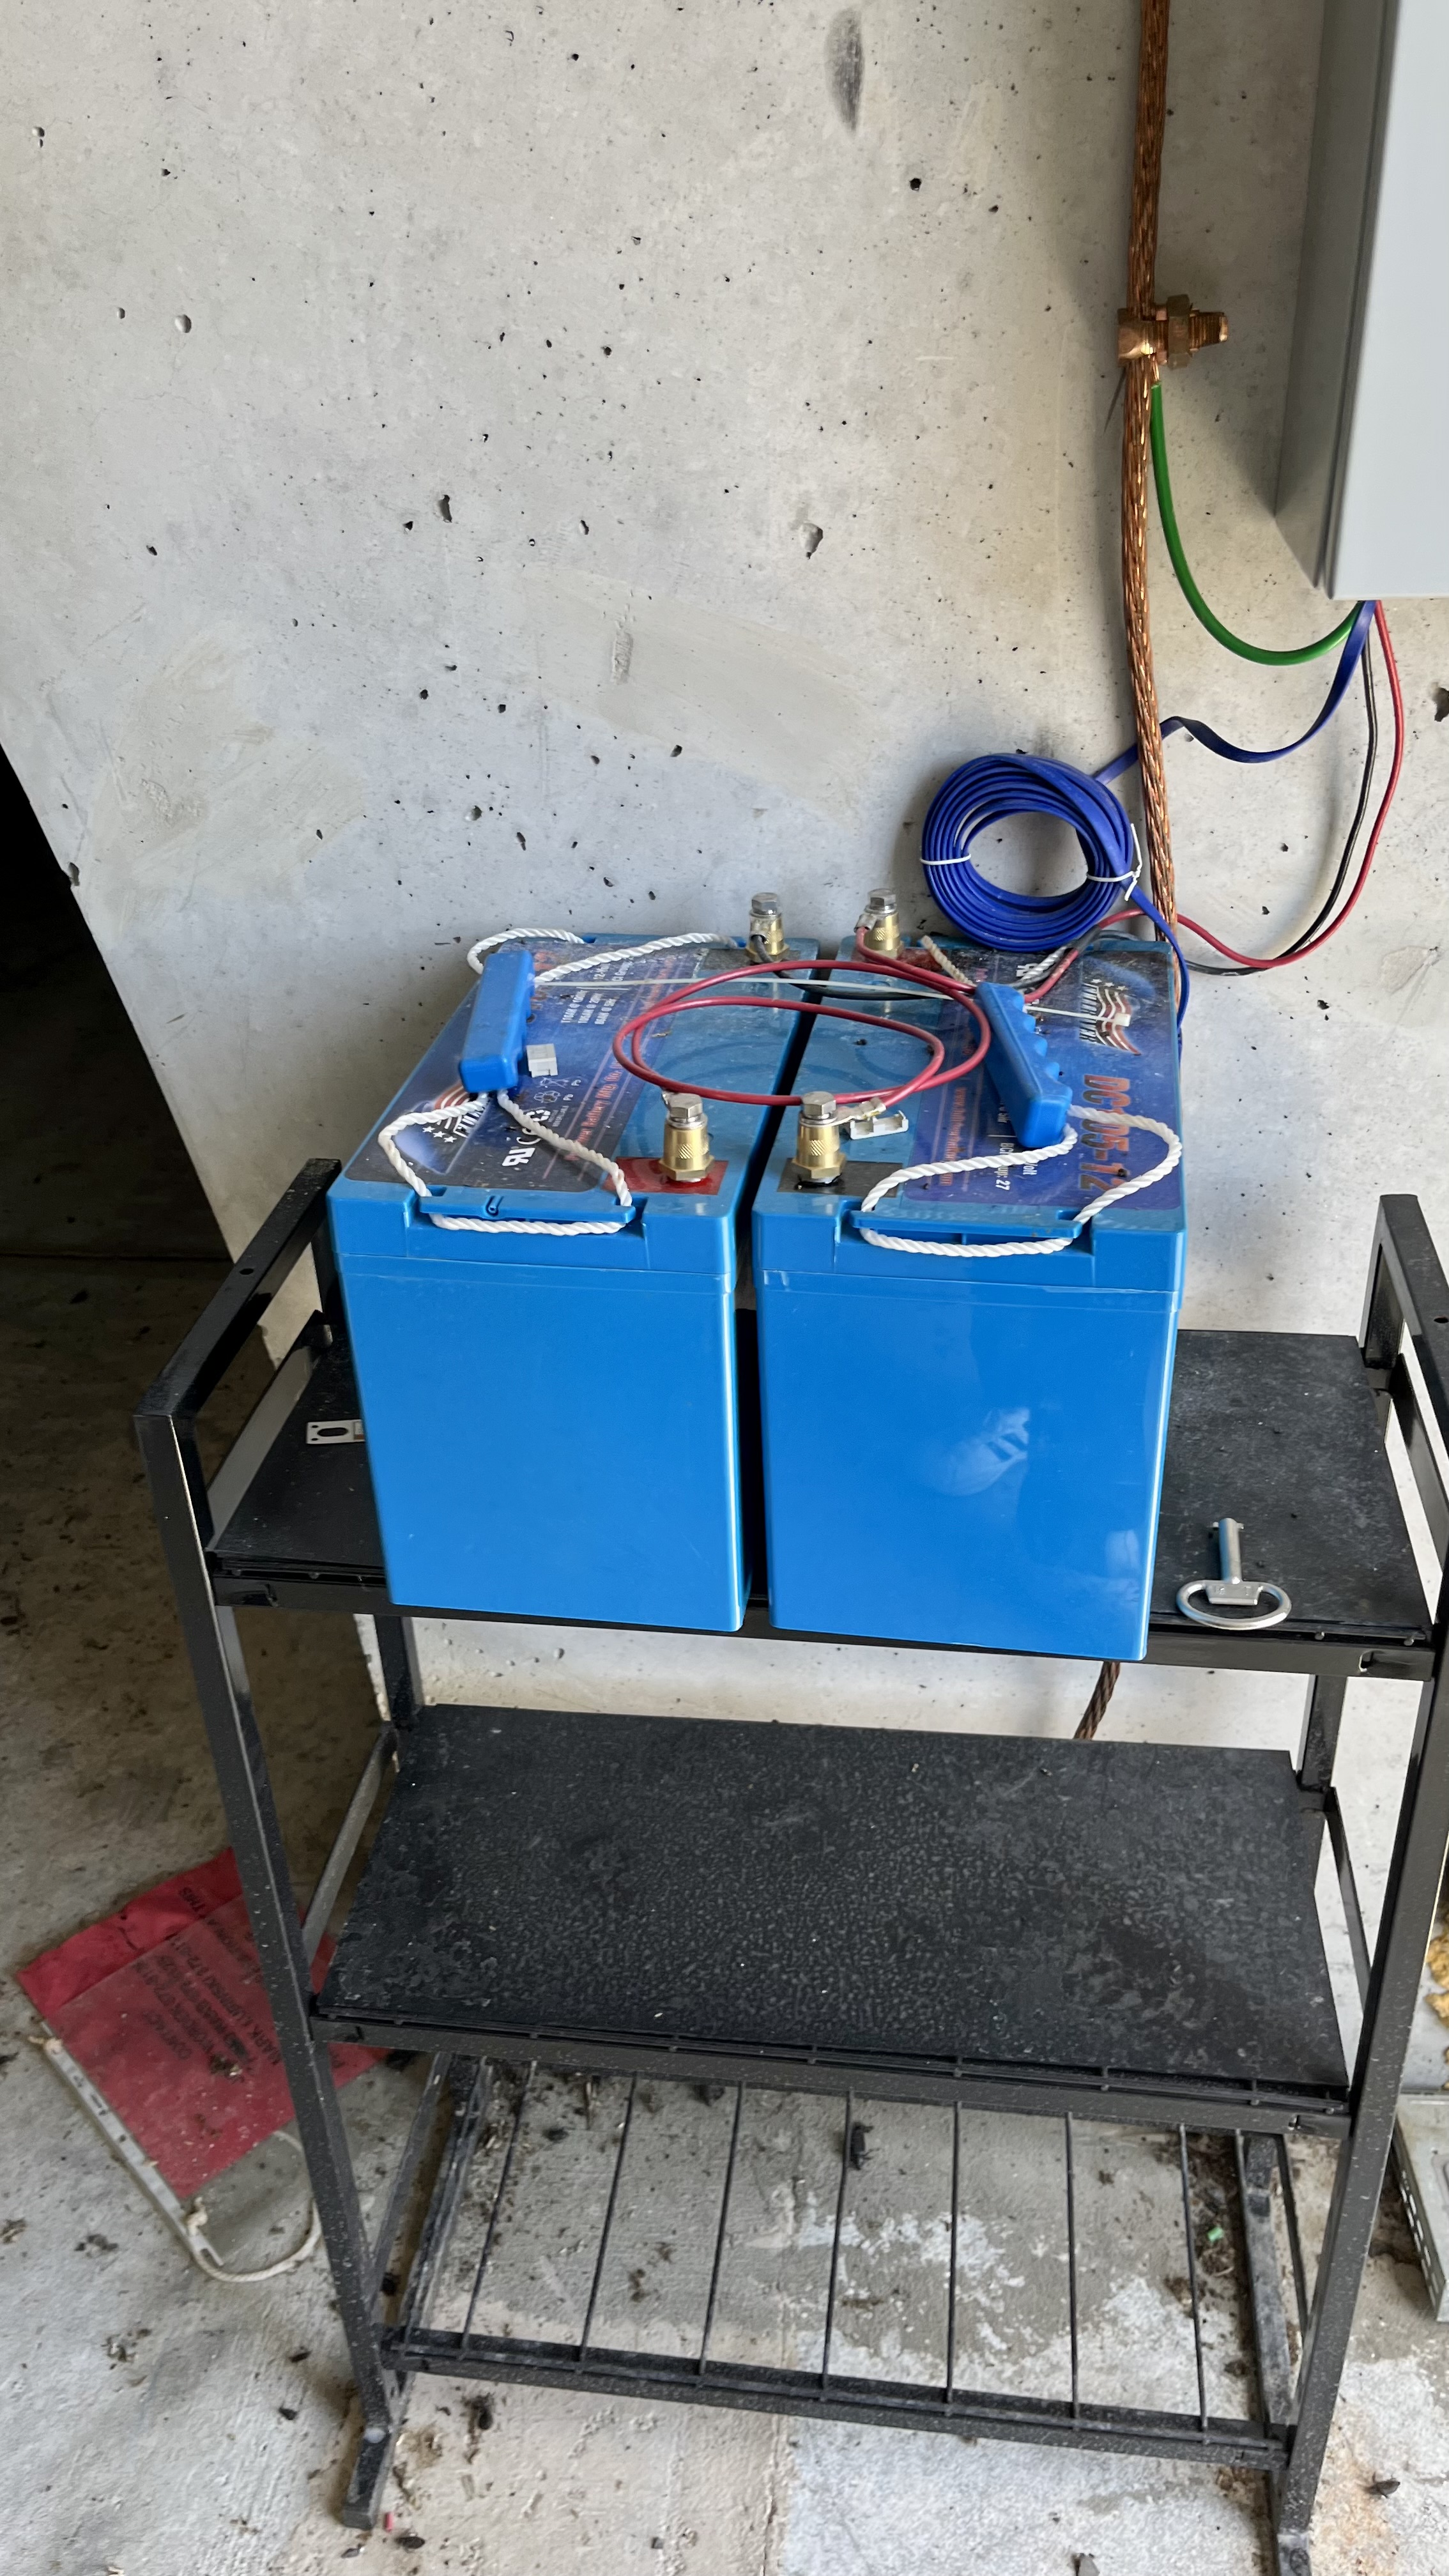
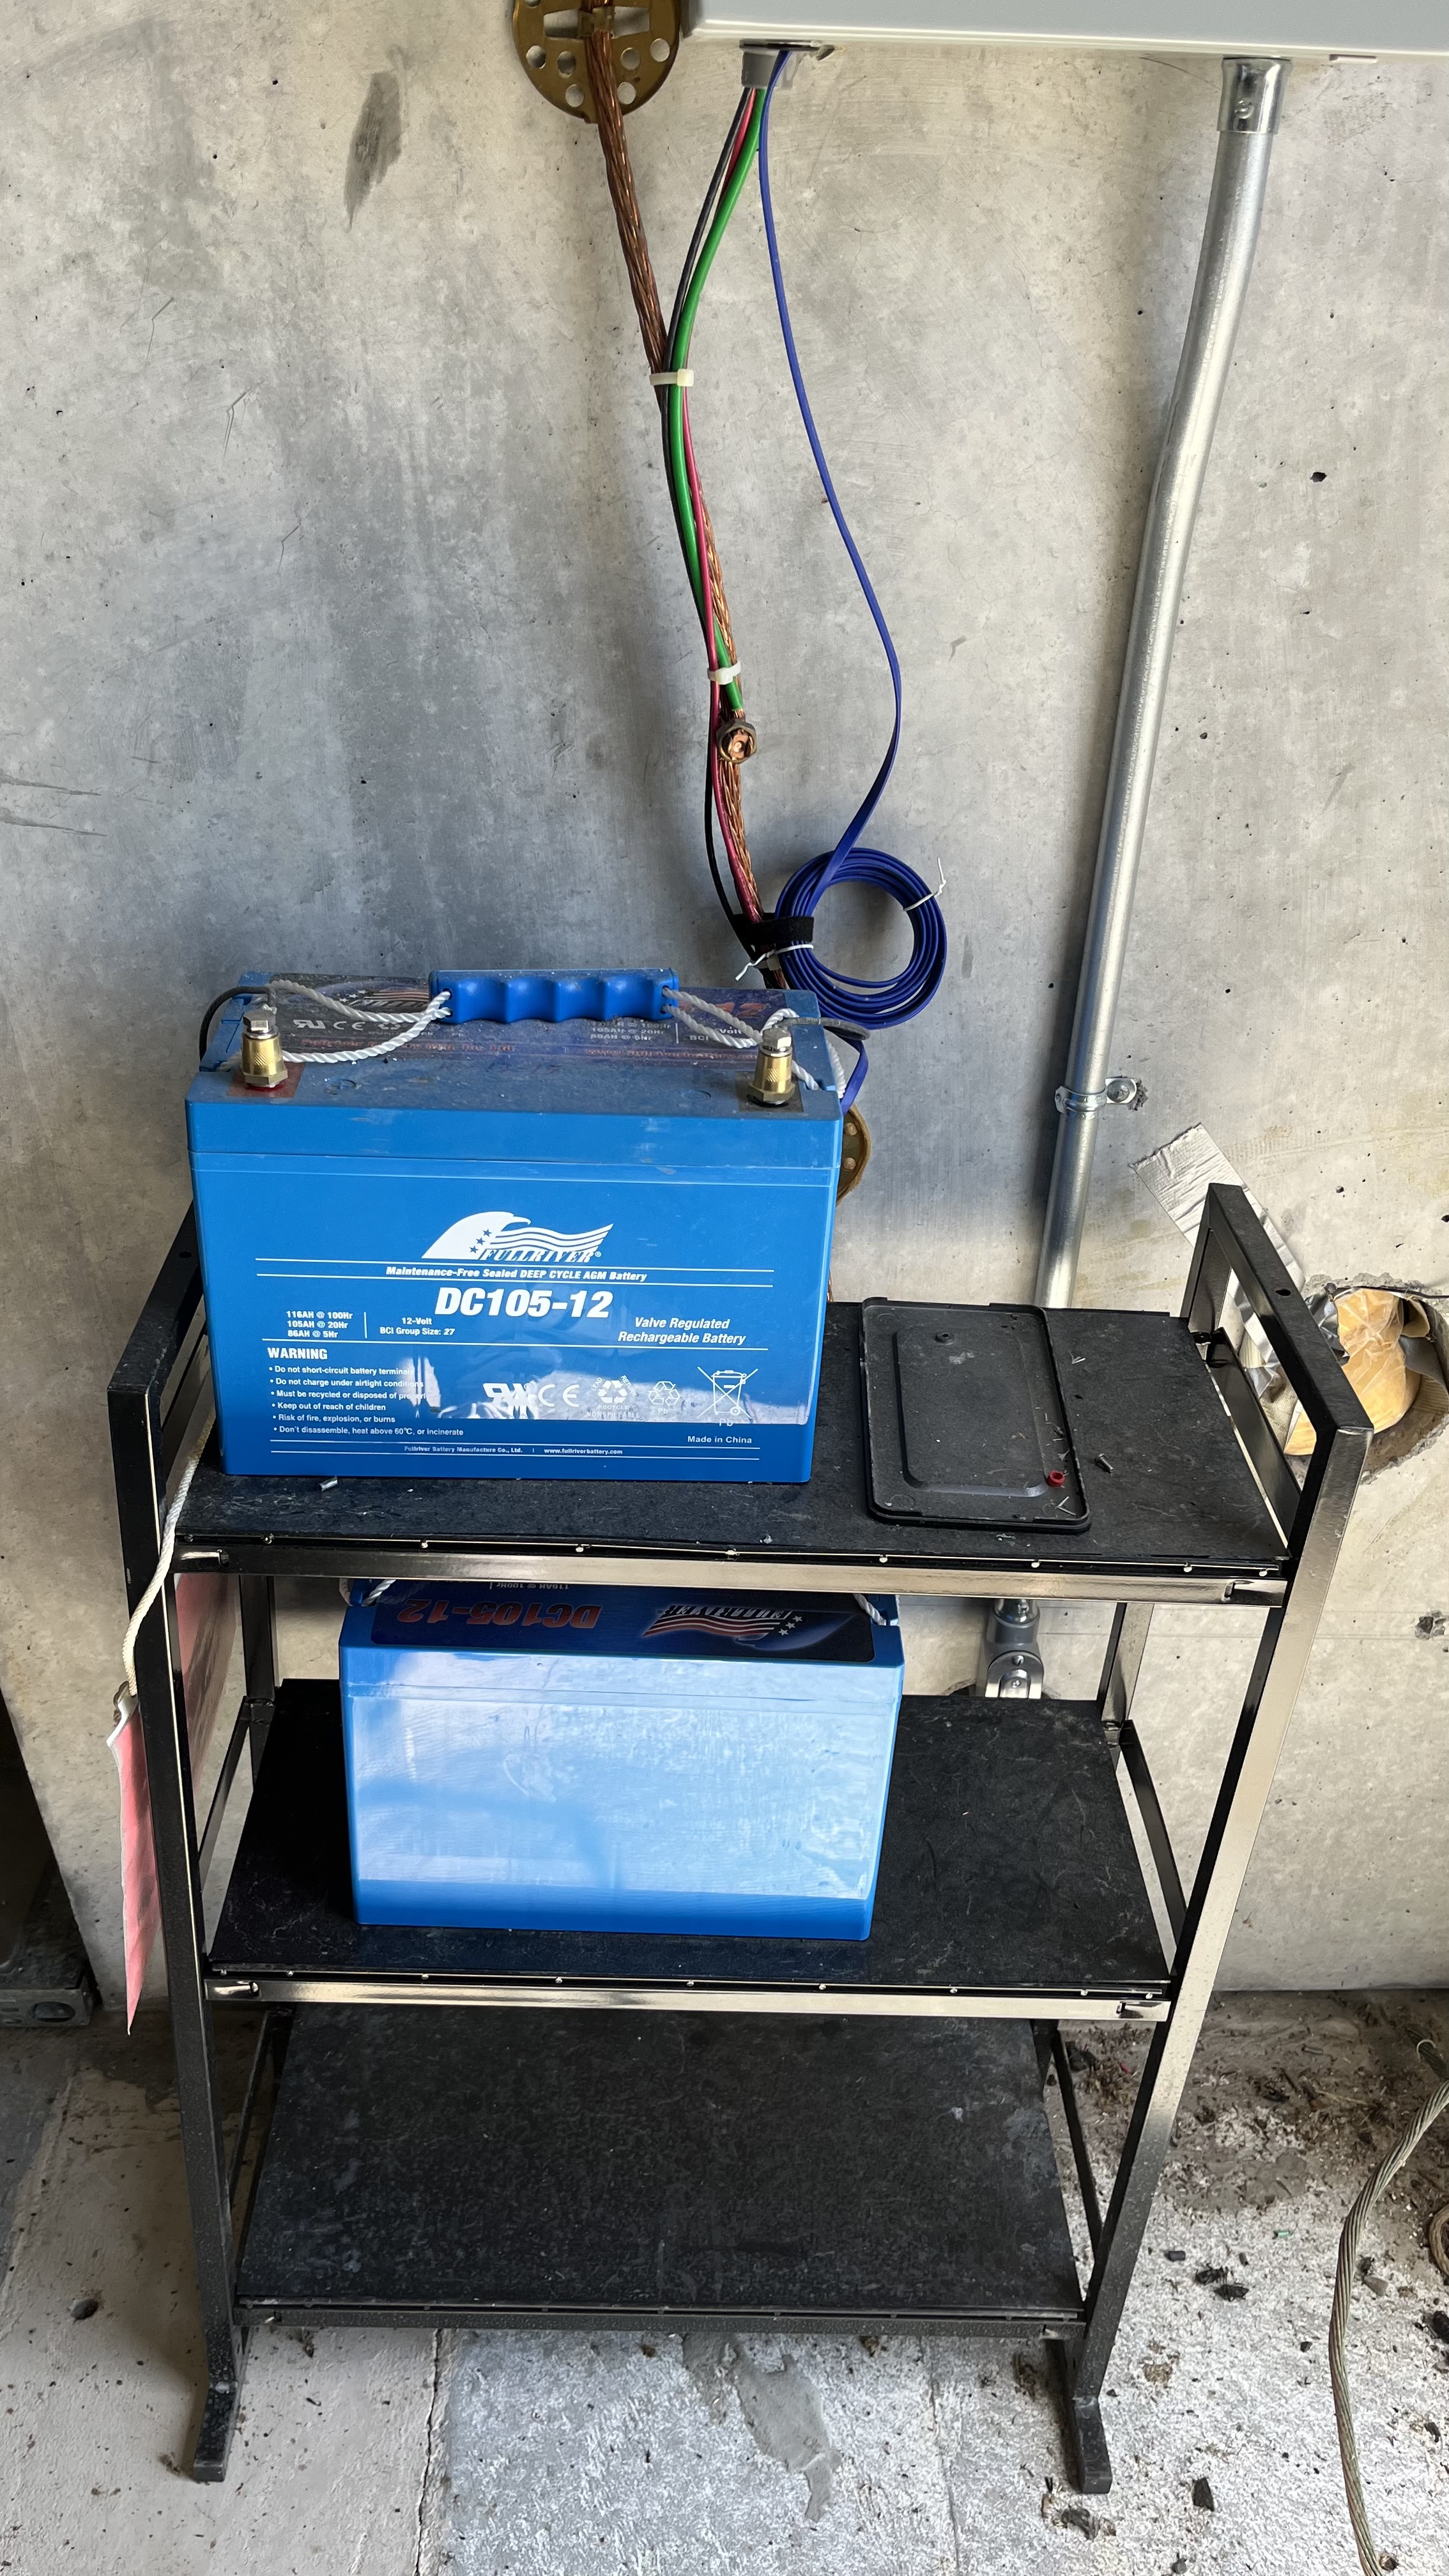
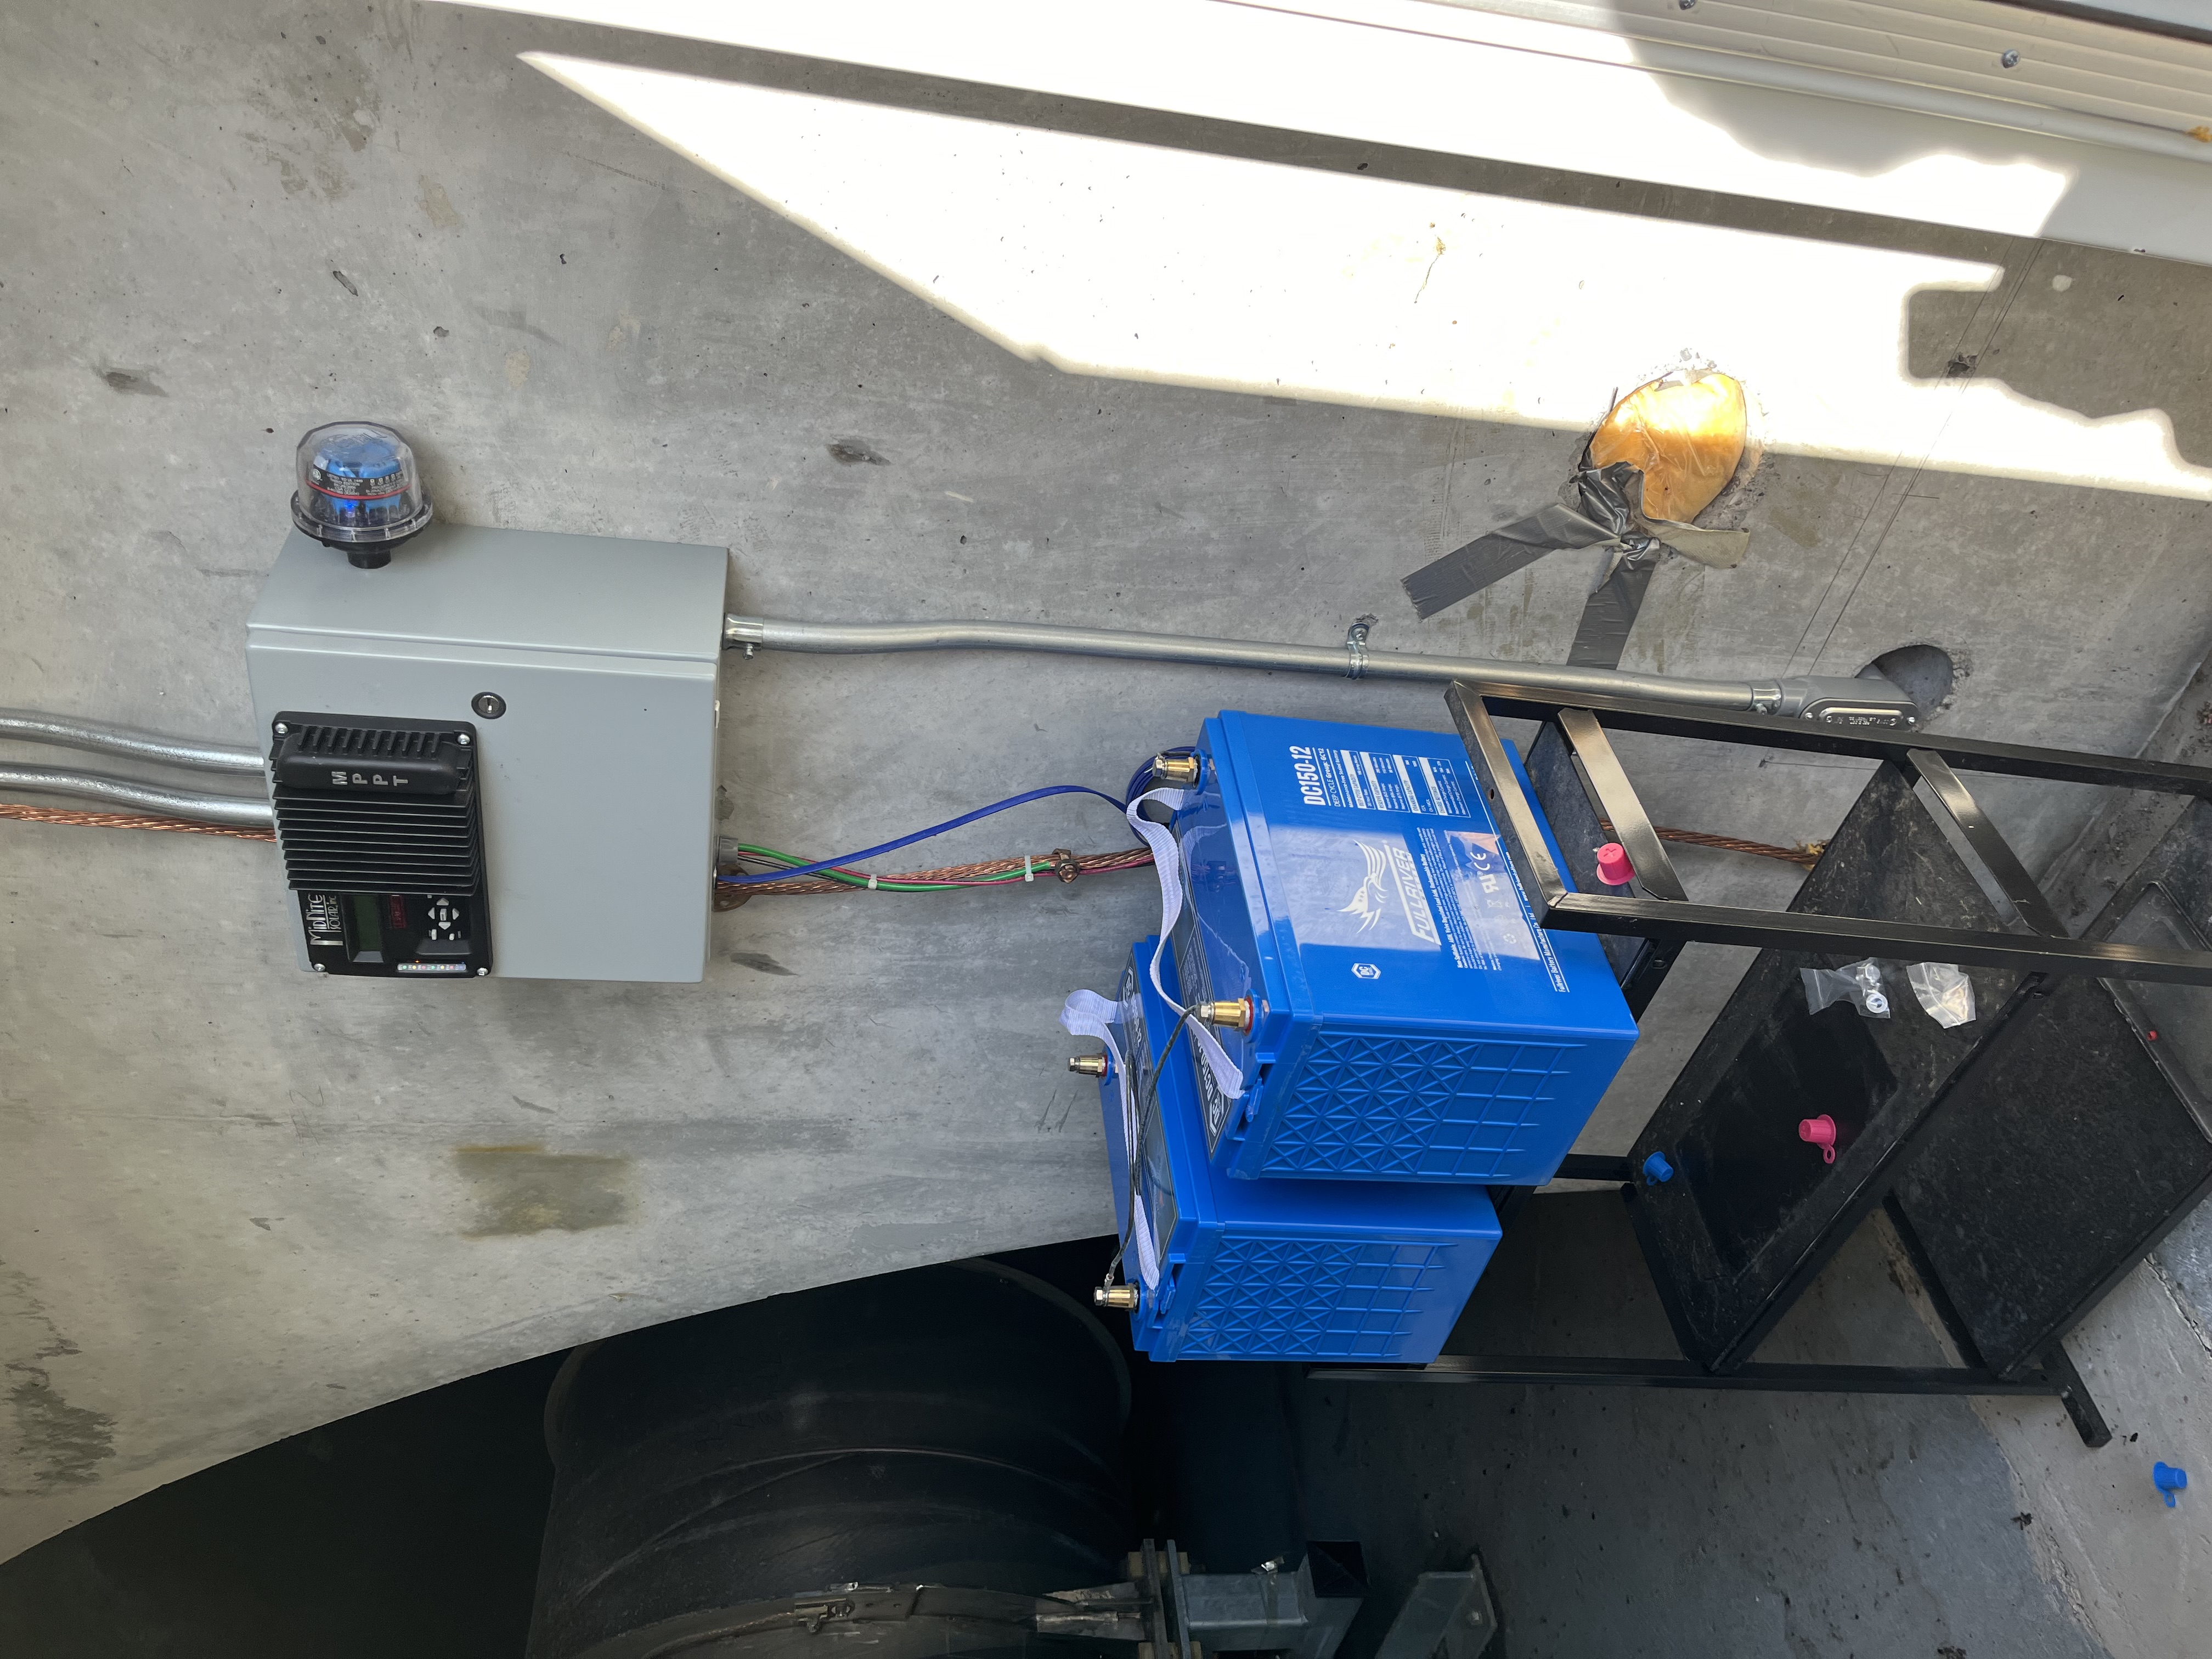
Late entry. Removed the old batteries for both stations, and installed new batteries with a larger capacity.
Both stations were tested after replacing the batteries, and the solar panel controllers were noted as charging the new batteries. No issues noted with either station.
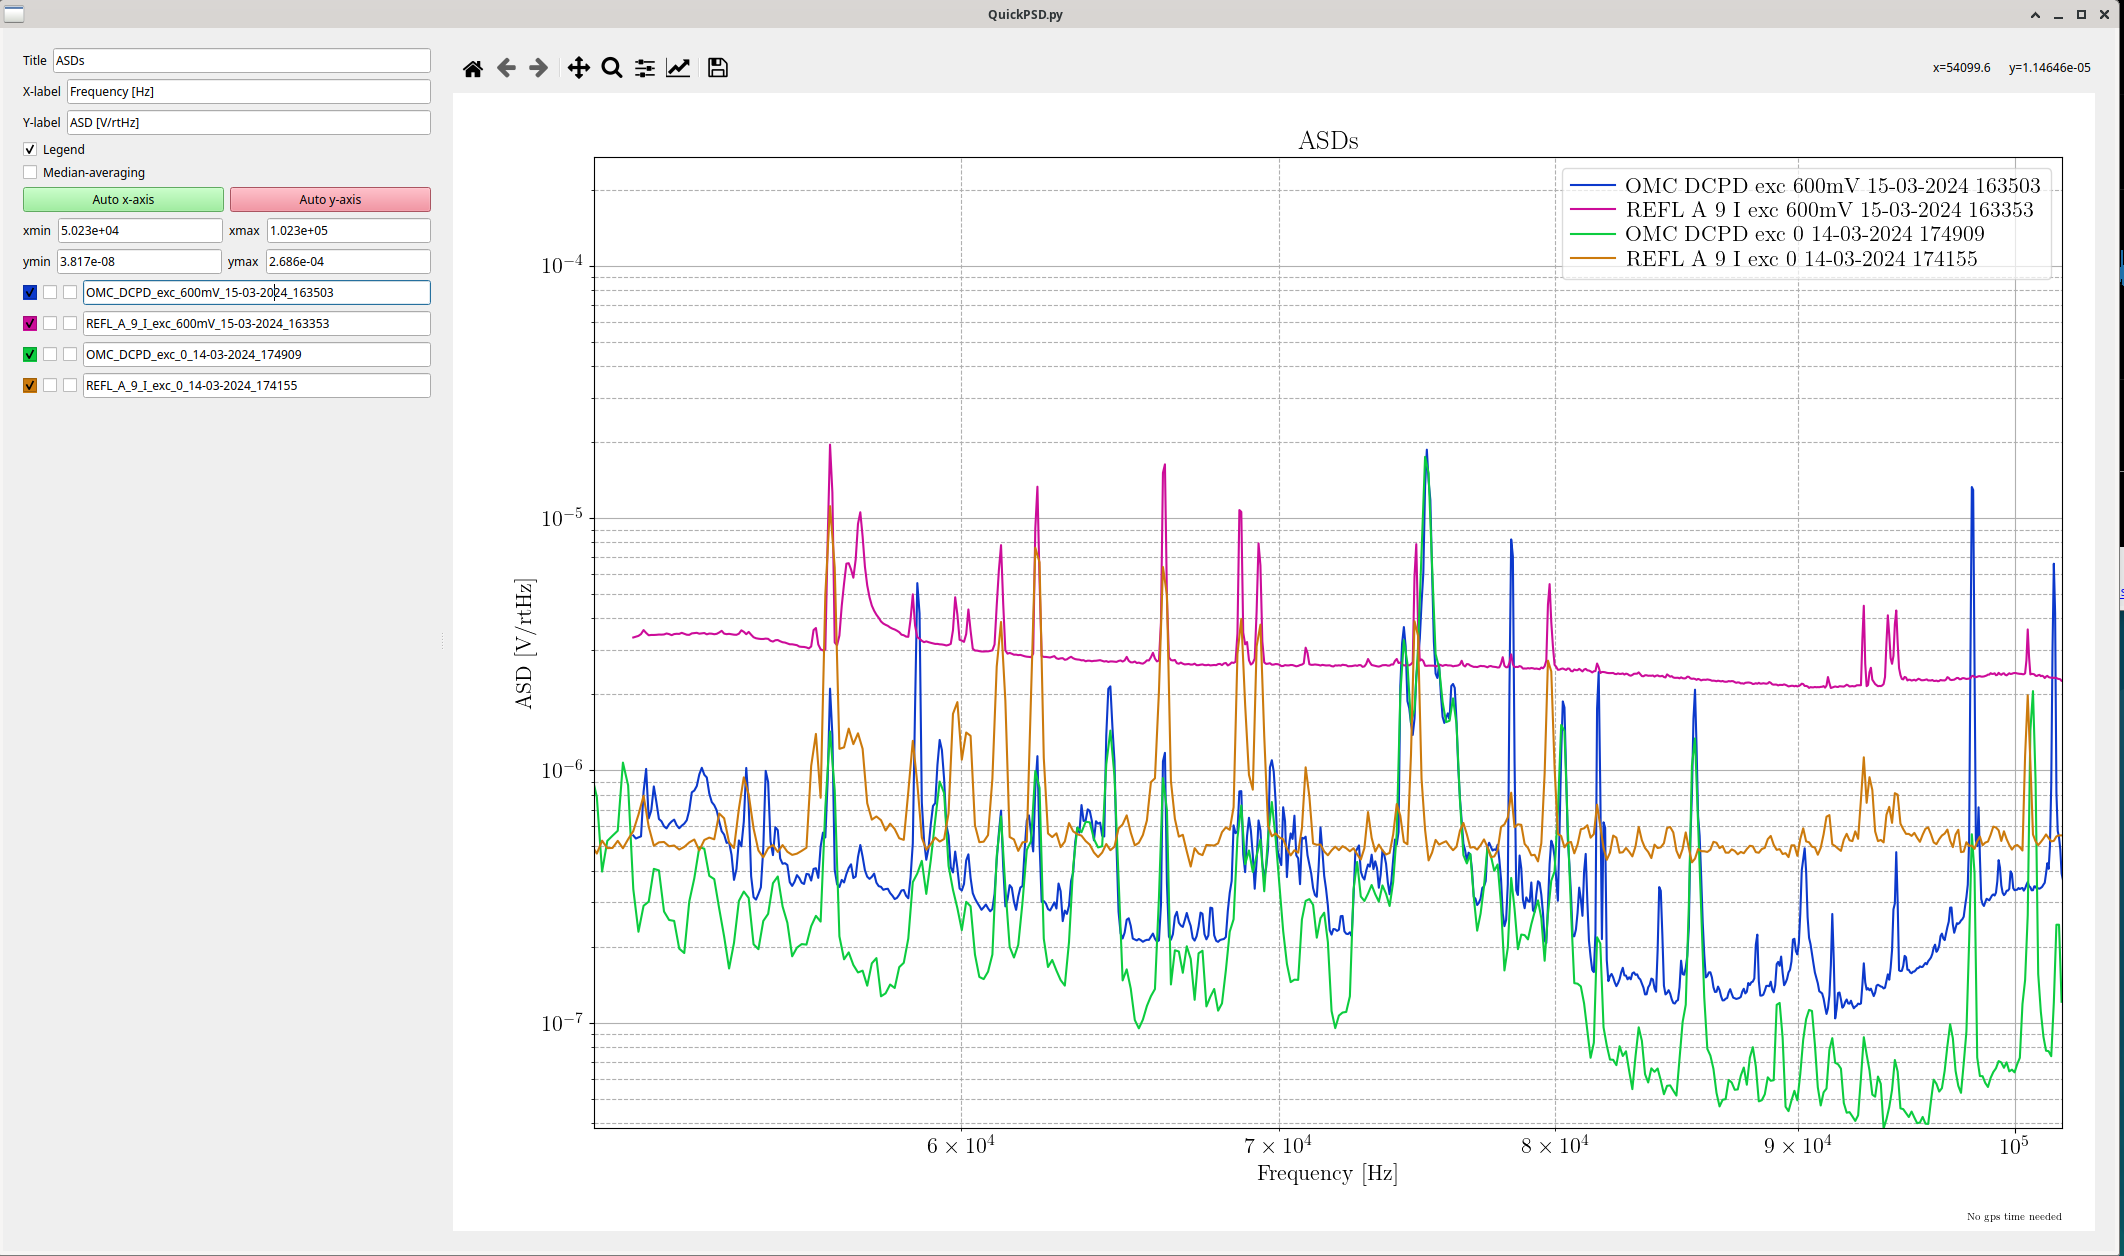
Graeme, Matt, Craig Using our setup from yesterday (alog 76397), we injected into the common mode board and measured a CARM to DARM transfer function. Matt will post plots, comparisons, and measurement times later. I am posting the data now, it lives in/ligo/gitcommon/psl_measurements/data/carm_to_darm_tfs/. Just to clarify what these measurements are, we injected a 600 mV broadband white noise injection from 51.2 kHz to 102.4 kHz frequency span into the common mode board excitation point. We measured out at the REFL A 9 QMON at the PSL racks (which is actually REFL A 9 I used for frequency feedback) and out of the OMC DCPD whitening chassis A+ terminal, patched over to the PSL racks as described in alog 76397. We saw a significant rise in the REFL A 9 QMON noise as we injected more (Matt's plots to come), but very little increase in the OMC DCPD noise. We had around 5e-3 coherence between the two at best. We took 10000 averages, so we believe that anything above 1e-4 is "well-resolved". We did not have time to try injecting between 1 kHz and 51.2 kHz before we lost lock, or to try looking atOMC DCPD A / EXCWe were not injecting at the time of the lockloss. We left the SR785 out there but not plugged in to anything on the racks so we can relock peacefully. EDIT: We went back out, got some data betwen 1 kHz and 52 kHz, and then unplugged everything, including the SR785 and the HAM6 OMC DCPD A+ whitening chassis cable. We didn't unplug the patch panel connection.
I've also attached my notes of the measurement process, displaying port connections as well as injection times and so on.
| Measurement | Span | Injection Times | Excitation Amp | Data / Plots |
|---|---|---|---|---|
| IMC OLG Transfer Function | 10kHz-102kHz |
2024/03/15 15:17 - 15:41 PST (MC Common Mode Servo Common Path Exc A) |
100mV | |
| CARM Measurement | 10kHz-102kHz |
2024/03/15 15:43 - 15:47 PST (IFO Common Mode Servo Common Path Exc A) |
100mV | |
| CARM to DARM Measurements | 50kHz-100kHz |
2024/03/15 16:17 - 16:36 PST (IFO Common Mode Servo Common Path Exc A) |
600mV | Without_Exc_Vs_Exc_CARM_to_DARM |
| CARM to DARM Measurements | 1kHz - 52kHz |
2024/03/15 15:54 - 18:00 PST (IFO Common Mode Servo Common Path Exc A) |
300mV |
OMC_DCPD/REFL9I Coherence CARM to DARM transfer func. OMC_DCPD & REFL9I PSDs OMC_DCPD/REFL9I CSDs |
| OMC DCPD excitation | 1kHz - 52kHz |
2024/03/15 18:13 - 18:16 PST (IFO Common Mode Servo Common Path Exc A) |
300mV |
OMC_DCPD vs. Excitation Coherence OMC_DCPD vs Excitation Transfer Func. OMC_DCPD, PSD with Excitation |
| Loop Suppression to CARM | 1kHz - 52kHz |
2024/03/15 18:24 - 18:32 PST (IFO Common Mode Servo Common Path Exc A) |
300mV |
Jennie W, Craig C.
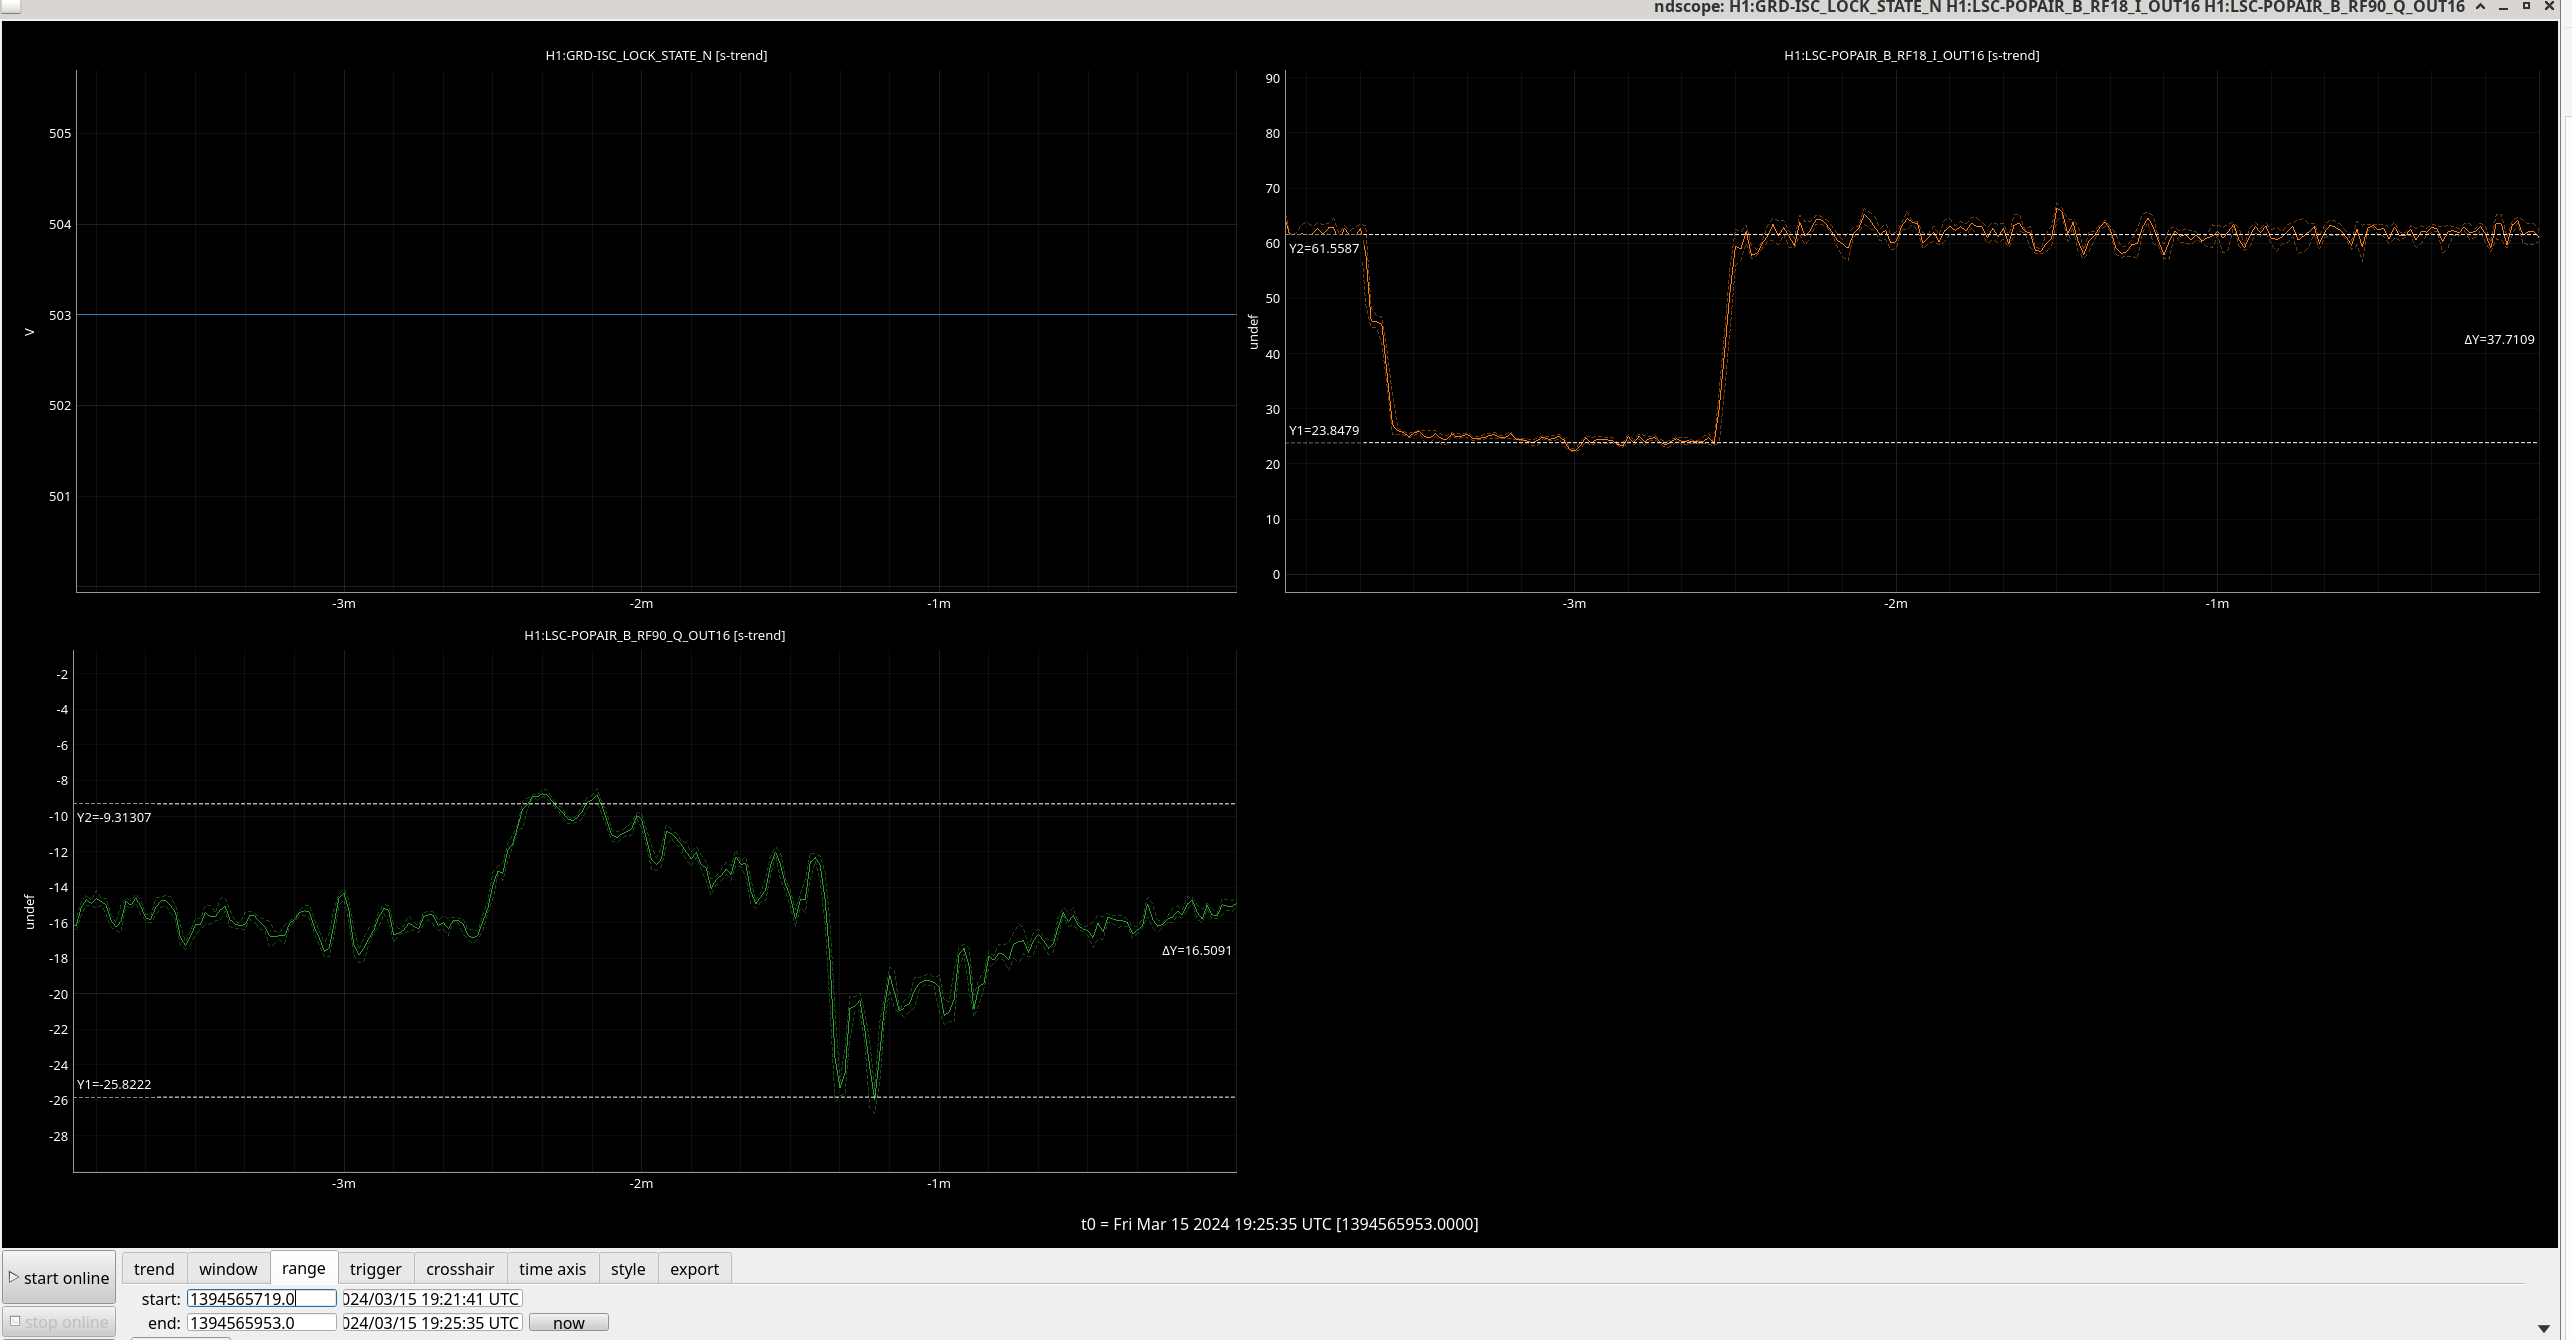
We paused the IFO at state 503 (CHECK_VIOLINS_BEFORE_POWERUP) and took another test where we looked at the power on POPAIR B RF18 and 90 while changing first the 9 and the 45 MHz modulation depths.
The times series of the two PDs readouts we care about and the guardian is the first image. the second image shows all the PDs in one document.
Results are:
| Channels | 9 MHz | 45 MHz | Carrier |
|---|---|---|---|
| H1:IMC-PWR_IN_OUT16 | 0.026 | 0.058 | 0.916 |
| H1:IMC-IM4_TRANS_NSUM_OUT16 | 0.026 | 0.058 | 0.917 |
| H1:LSC-REFL_A_LF_OUT16 | 0.055 | 0.111 | 0.834 |
| H1:LSC-REFL_B_LF_OUT16 | 0.055 | 0.111 | 0.835 |
| H1:LSC-POP_A_LF_OUT16 | 0.032 | 0.026 | 0.942 |
| H1:ASC-POP_A_NSUM_OUT16 | 0.033 | 0.026 | 0.941 |
| H1:ASC-POP_B_NSUM_OUT16 | 0.032 | 0.027 | 0.941 |
| H1:ASC-AS_C_NSUM_OUT16 | 0.189 | 0.499 | 0.312 |
| H1:ASC-OMC_A_NSUM_OUT16 | 0.180 | 0.521 | 0.299 |
| H1:ASC-OMC_B_NSUM_OUT16 | 0.183 | 0.501 | 0.316 |
| H1:ASC-X_TR_A_NSUM_OUT16 | 0.004 | 0.005 | 0.991 |
| H1:ASC-X_TR_B_NSUM_OUT16 | 0.004 | 0.005 | 0.991 |
| H1:ASC-Y_TR_A_NSUM_OUT16 | -0.018 | 0.026 | 0.992 |
| H1:ASC-Y_TR_B_NSUM_OUT16 | -0.017 | 0.026 | 0.991 |
Sideband and carrier powers at each diode
H1:IMC-PWR_IN_OUT16 9 power = 0.051 W
H1:IMC-PWR_IN_OUT16 45 power = 0.117 W
H1:IMC-PWR_IN_OUT16 carrier power = 1.834 W
H1:IMC-PWR_IN_OUT16 total DC power = 2.003 W
H1:IMC-IM4_TRANS_NSUM_OUT16 9 power = 0.047 W
H1:IMC-IM4_TRANS_NSUM_OUT16 45 power = 0.105 W
H1:IMC-IM4_TRANS_NSUM_OUT16 carrier power = 1.668 W
H1:IMC-IM4_TRANS_NSUM_OUT16 total DC power = 1.819 W
H1:LSC-REFL_A_LF_OUT16 9 power = 0.014 mW
H1:LSC-REFL_A_LF_OUT16 45 power = 0.028 mW
H1:LSC-REFL_A_LF_OUT16 carrier power = 0.210 mW
H1:LSC-REFL_A_LF_OUT16 total DC power = 0.252 mW
H1:LSC-REFL_B_LF_OUT16 9 power = 0.013 mW
H1:LSC-REFL_B_LF_OUT16 45 power = 0.026 mW
H1:LSC-REFL_B_LF_OUT16 carrier power = 0.193 mW
H1:LSC-REFL_B_LF_OUT16 total DC power = 0.231 mW
H1:LSC-POP_A_LF_OUT16 9 power = 34.865 uW
H1:LSC-POP_A_LF_OUT16 45 power = 28.588 uW
H1:LSC-POP_A_LF_OUT16 carrier power = 1027.882 uW
H1:LSC-POP_A_LF_OUT16 total DC power = 1091.334 uW
H1:ASC-POP_A_NSUM_OUT16 9 power = 8.372 cts
H1:ASC-POP_A_NSUM_OUT16 45 power = 6.709 cts
H1:ASC-POP_A_NSUM_OUT16 carrier power = 241.335 cts
H1:ASC-POP_A_NSUM_OUT16 total DC power = 256.416 cts
H1:ASC-POP_B_NSUM_OUT16 9 power = 7.685 cts
H1:ASC-POP_B_NSUM_OUT16 45 power = 6.310 cts
H1:ASC-POP_B_NSUM_OUT16 carrier power = 222.705 cts
H1:ASC-POP_B_NSUM_OUT16 total DC power = 236.701 cts
H1:ASC-AS_C_NSUM_OUT16 9 power = 0.019 W
H1:ASC-AS_C_NSUM_OUT16 45 power = 0.051 W
H1:ASC-AS_C_NSUM_OUT16 carrier power = 0.032 W
H1:ASC-AS_C_NSUM_OUT16 total DC power = 0.101 W
H1:ASC-OMC_A_NSUM_OUT16 9 power = 0.020 W
H1:ASC-OMC_A_NSUM_OUT16 45 power = 0.057 W
H1:ASC-OMC_A_NSUM_OUT16 carrier power = 0.032 W
H1:ASC-OMC_A_NSUM_OUT16 total DC power = 0.109 W
H1:ASC-OMC_B_NSUM_OUT16 9 power = 0.018 W
H1:ASC-OMC_B_NSUM_OUT16 45 power = 0.049 W
H1:ASC-OMC_B_NSUM_OUT16 carrier power = 0.031 W
H1:ASC-OMC_B_NSUM_OUT16 total DC power = 0.097 W
H1:ASC-X_TR_A_NSUM_OUT16 9 power = 45.016 W
H1:ASC-X_TR_A_NSUM_OUT16 45 power = 52.783 W
H1:ASC-X_TR_A_NSUM_OUT16 carrier power = 10961.375 W
H1:ASC-X_TR_A_NSUM_OUT16 total DC power = 11059.174 W
H1:ASC-X_TR_B_NSUM_OUT16 9 power = 57.131 W
H1:ASC-X_TR_B_NSUM_OUT16 45 power = 66.290 W
H1:ASC-X_TR_B_NSUM_OUT16 carrier power = 14355.521 W
H1:ASC-X_TR_B_NSUM_OUT16 total DC power = 14478.941 W
H1:ASC-Y_TR_A_NSUM_OUT16 9 power = -258.850 W
H1:ASC-Y_TR_A_NSUM_OUT16 45 power = 380.017 W
H1:ASC-Y_TR_A_NSUM_OUT16 carrier power = 14506.812 W
H1:ASC-Y_TR_A_NSUM_OUT16 total DC power = 14627.979 W
H1:ASC-Y_TR_B_NSUM_OUT16 9 power = -267.817 W
H1:ASC-Y_TR_B_NSUM_OUT16 45 power = 403.885 W
H1:ASC-Y_TR_B_NSUM_OUT16 carrier power = 15432.447 W
H1:ASC-Y_TR_B_NSUM_OUT16 total DC power = 15568.516 W
Power-recycling gains for sidebands and carrier
9 MHz PRG = 70.9
45 MHz PRG = 25.9
Carrier PRG = 58.4
Reflection ratios for sidebands and carrier
9 MHz reflection ratio = 0.176
45 MHz reflection ratio = 0.159
Carrier reflection ratio = 0.075
To run test make sure corner POP beam diverter is unshuttered (which it is in this guardian state) then run labutils/mod_depth_up_down_test/code/measure.py, then find the csv file with the correct GPS time in ../data and copy the start and stop times for the mod-depth changes into mod_depth_analysis.py and run this file.
The level on POP90 in the nominal blue region is not in a steady state which means we did not wait long enough at 2W when the measurement finished to get a good estimate of the nominal power on the diode before the IFO started powering up to 10W in the next guardian state.
Dhruva, Naoki, Sheila, Trent, Camilla
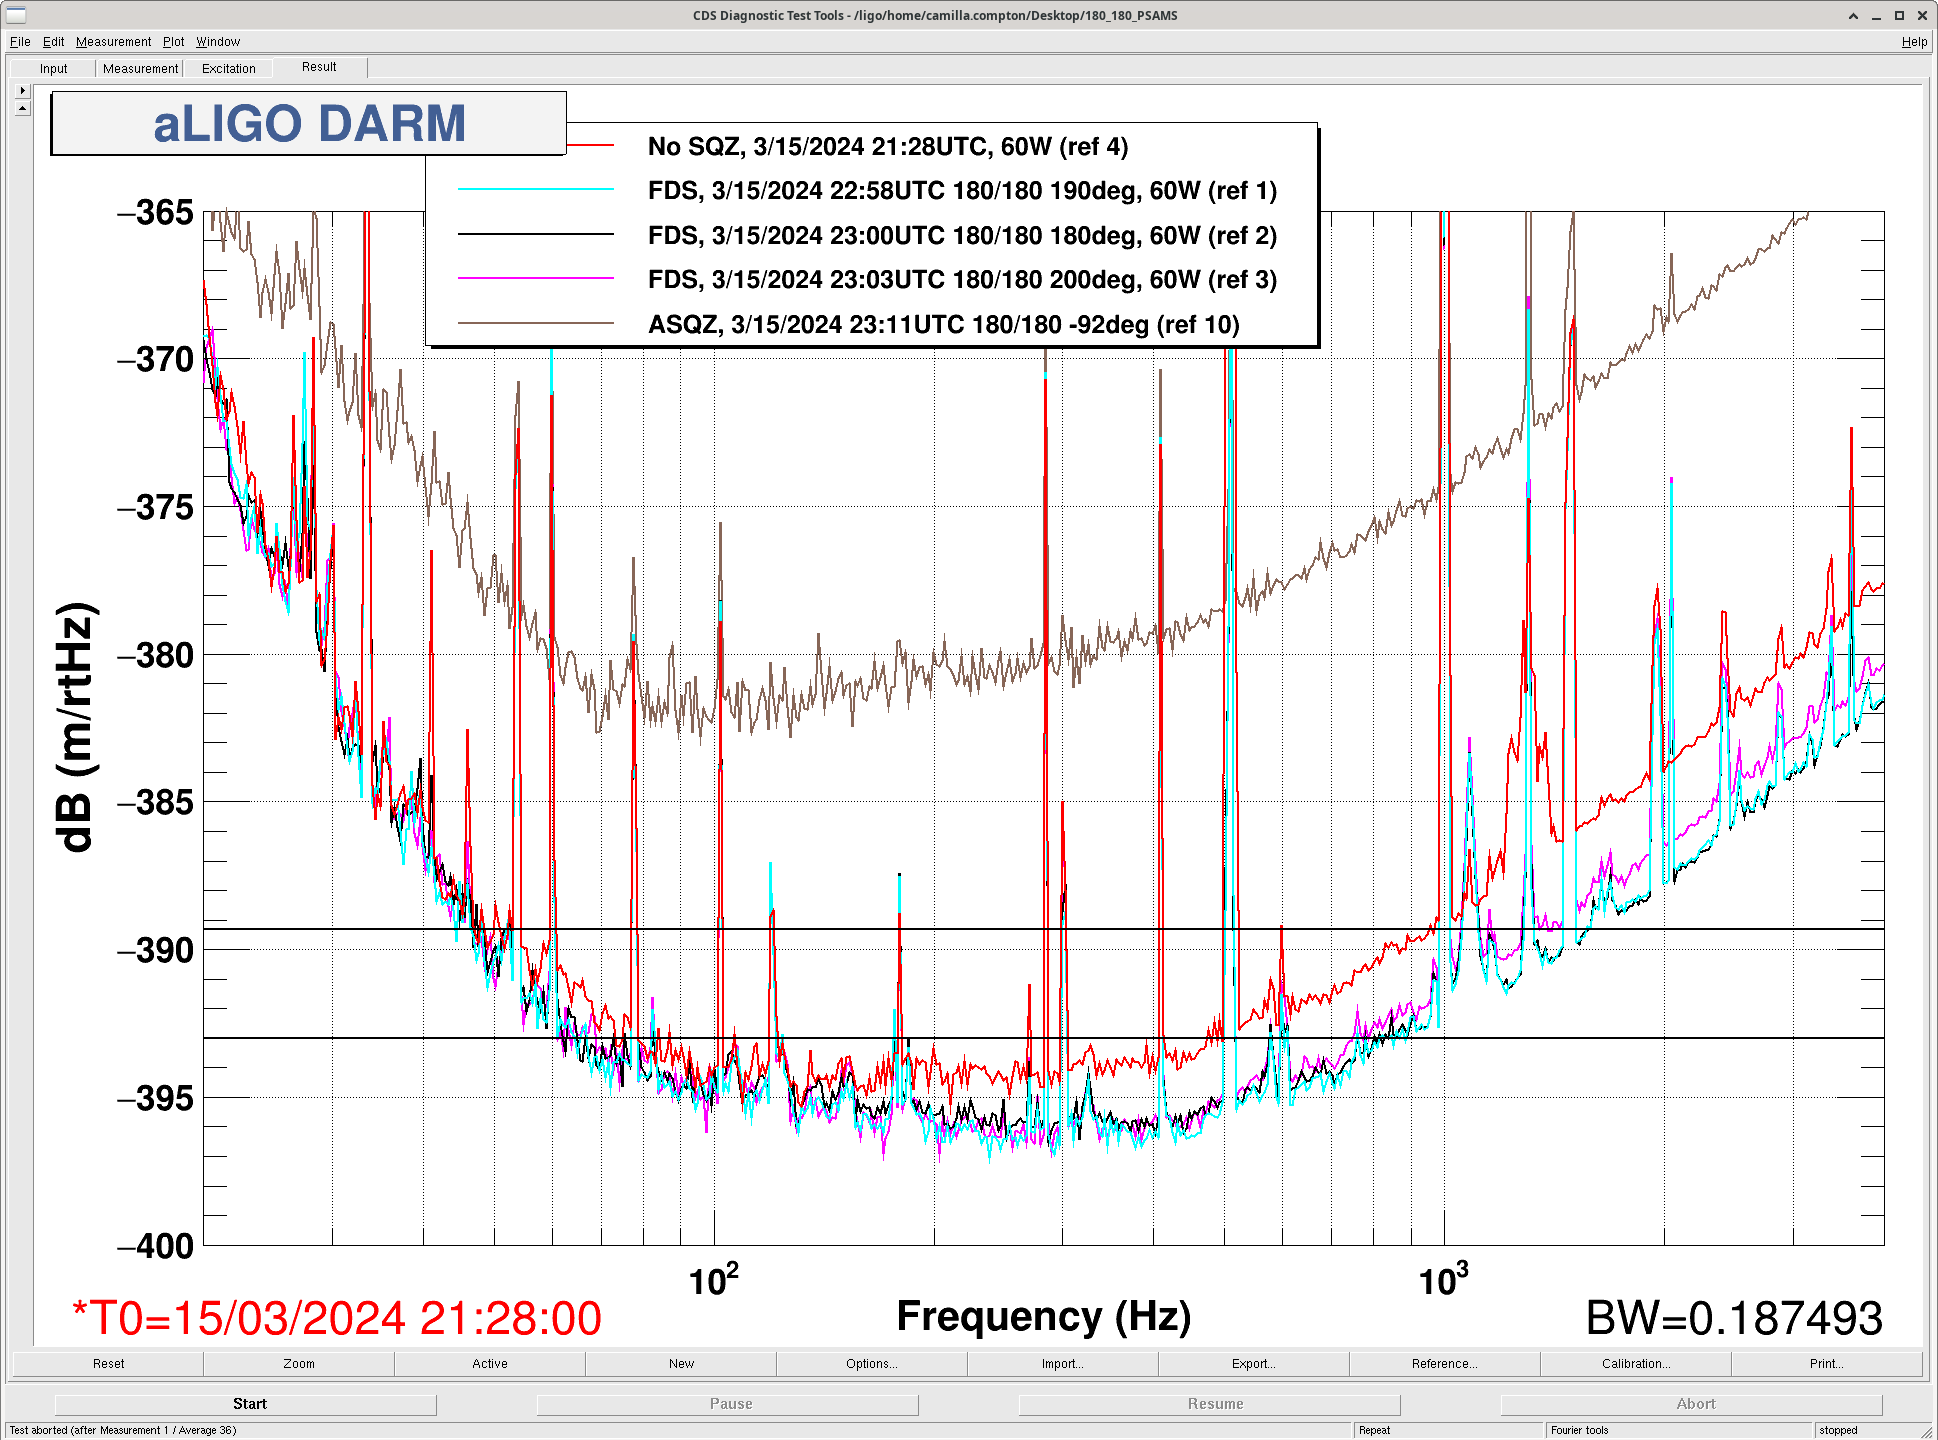
This afternoon we tried some SQZ optimization, left SQZ ASC on while squeezing.
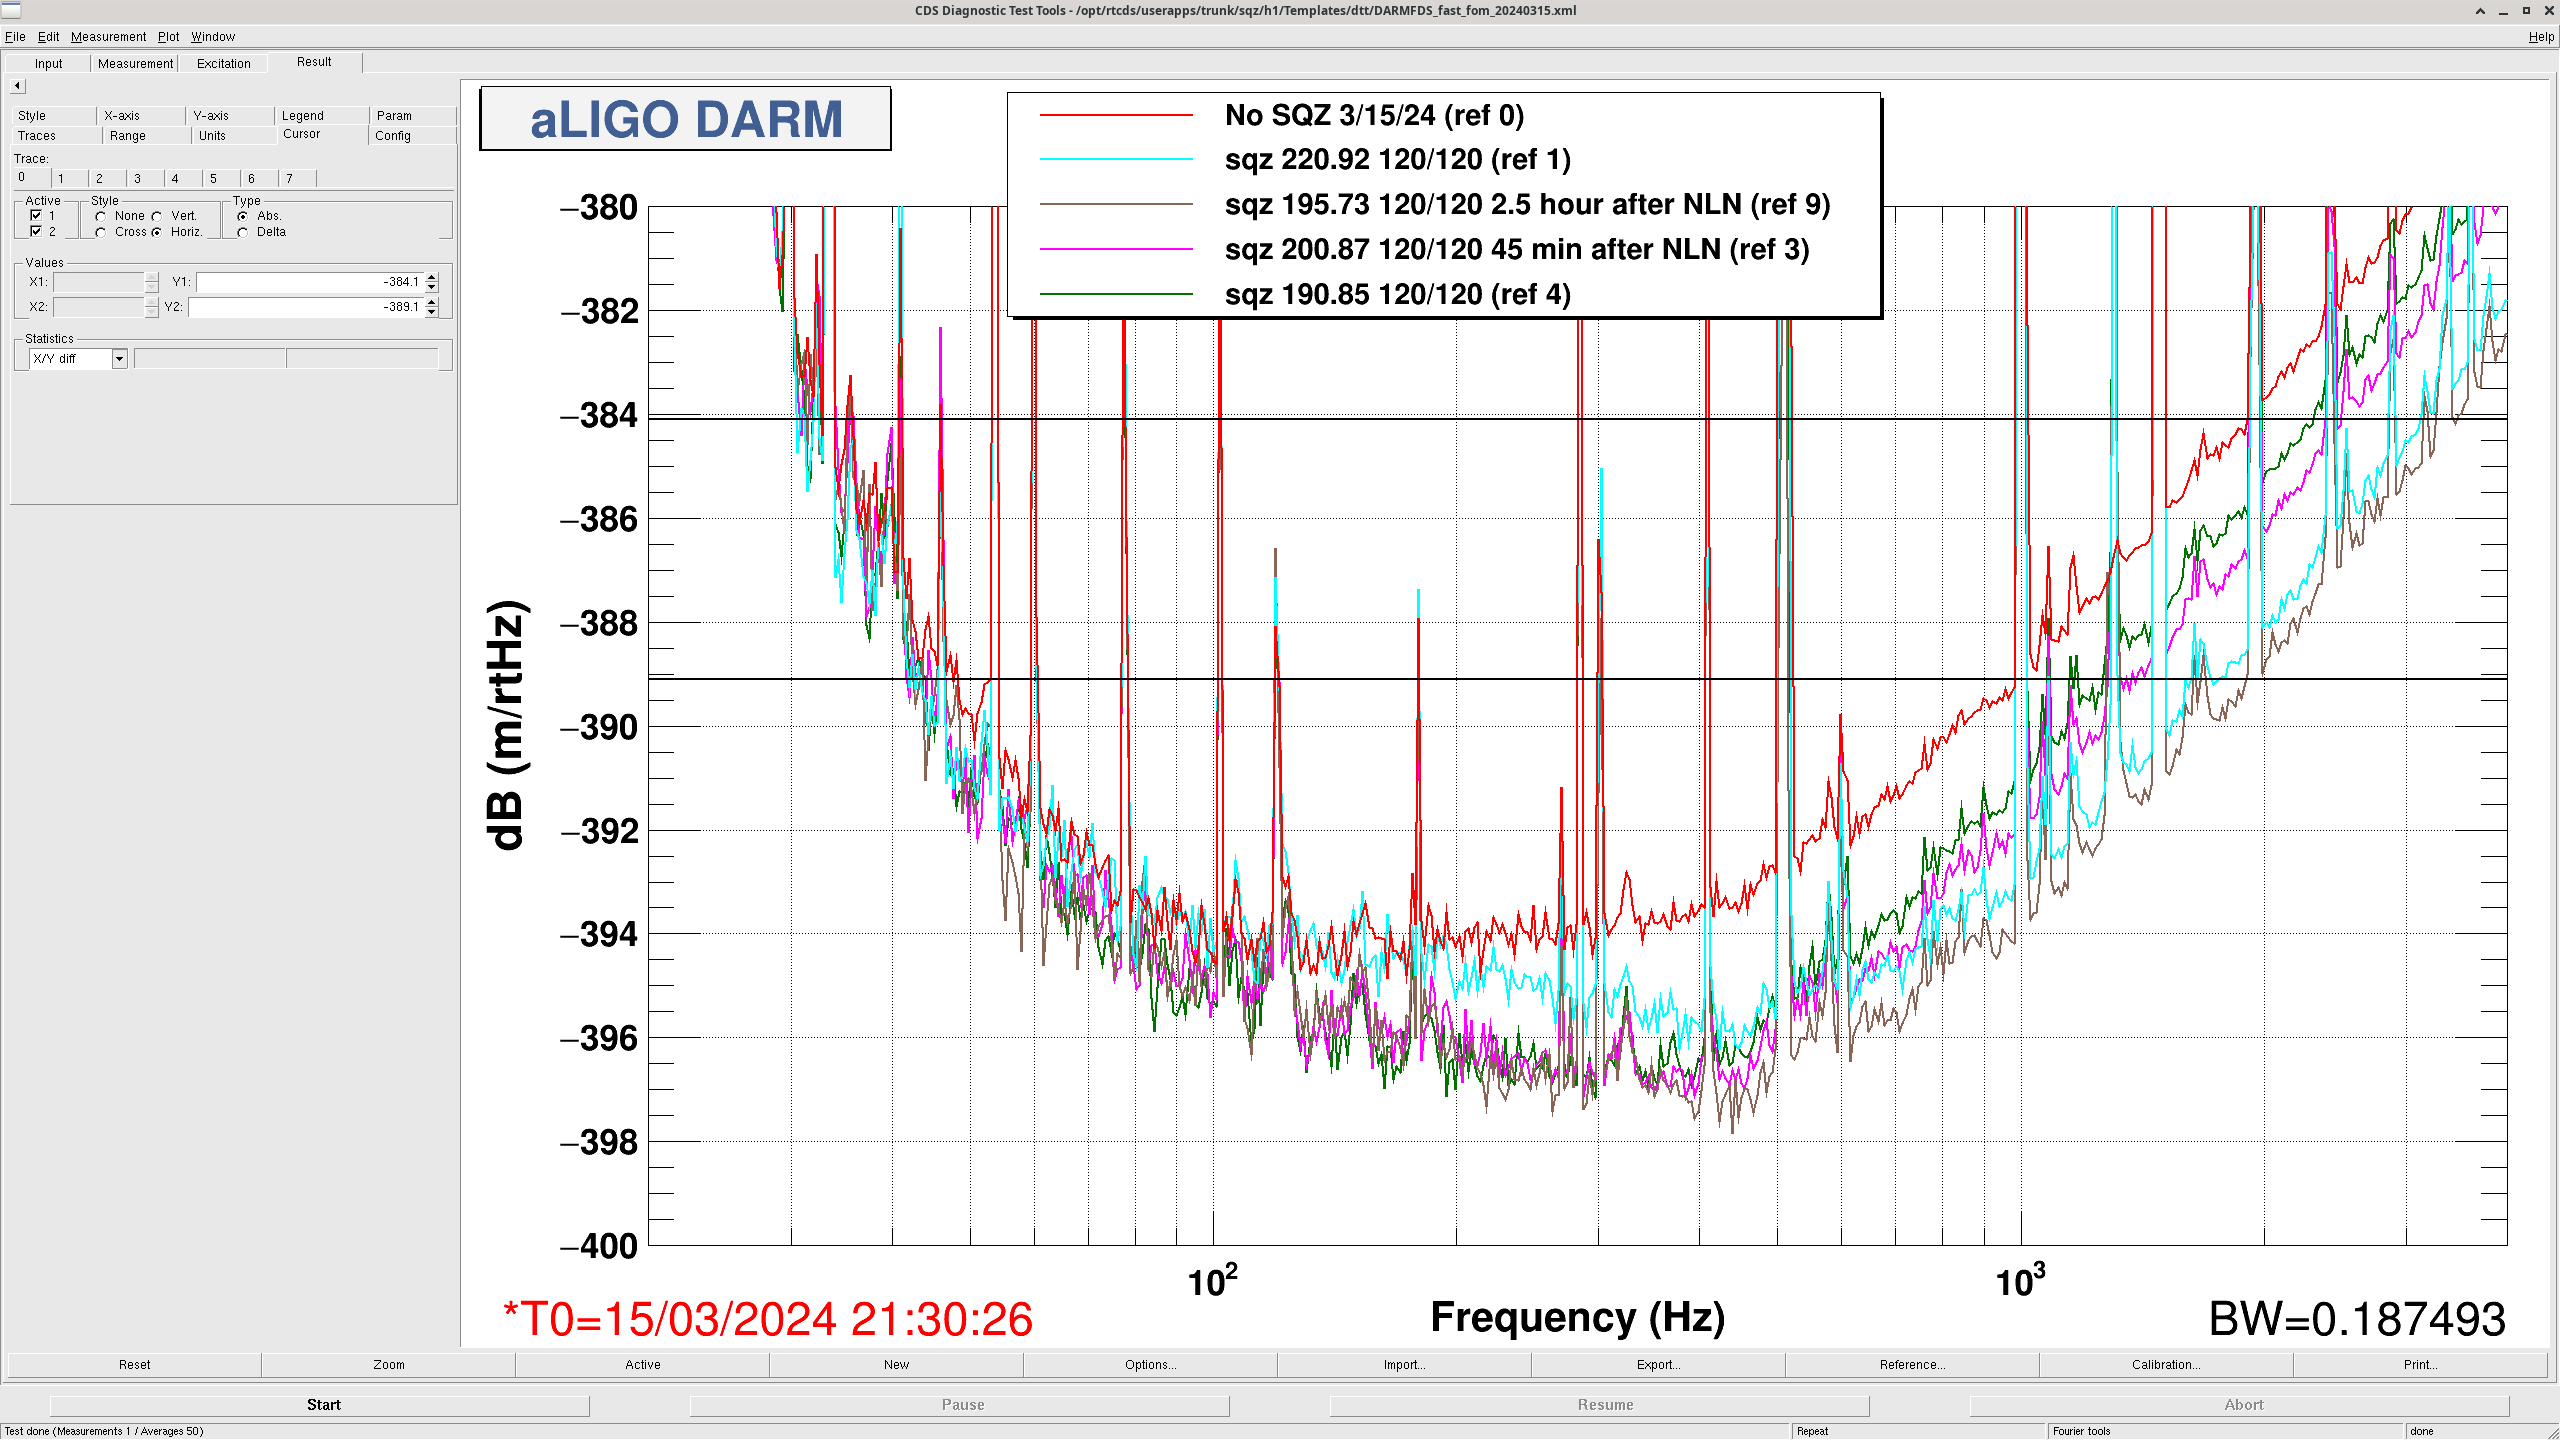
Edit: Going back to 120/120 after the IFO has been locked for 2.5 hours we see a lot less frequency dependent rotation. The rest of the team is continuing PSAMS optimization now.
Dhruva measured is NLG is 17. sqzparams.opo_grTrans_setpoint_uW is at 80uW, giving us 21.4 SHG Launch. OPO temperature optimized during this measurement.
| BLRMS Number | Frequency (Hz) |
| 1 Red | 75 - 90 |
| 2 Orange | 120 - 150 |
| 3 Yellow | 300 - 400 |
| 4 Green | 700 - 1750 |
| 5 Blue | 1650 - 1750 |
| 6 Purple | 4600 - 4750 |
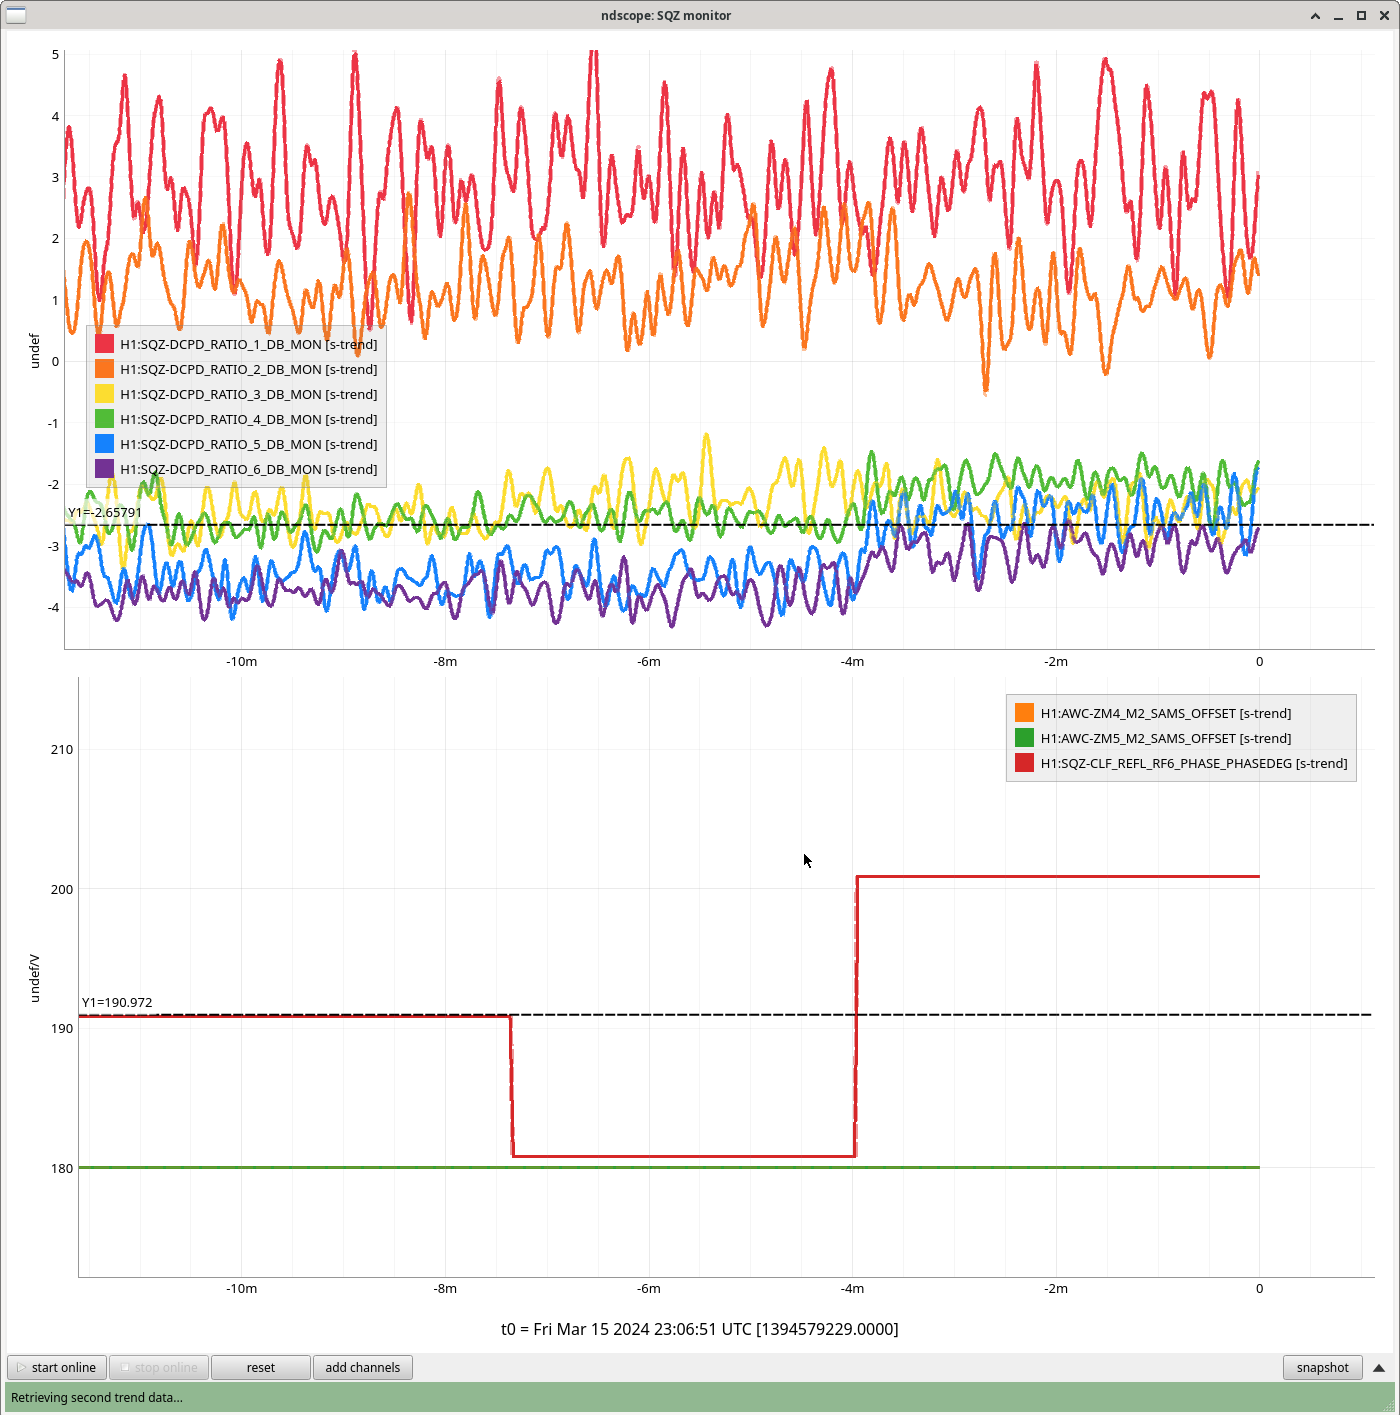
The first attachment shows the DARM with 120/120 PSAMS and different sqz angle. After 45 min NLN, we changed sqz angle from 220 deg to 190 deg. The 220 deg is good for high frequency, but bad around 100 Hz and vice versa for 190 deg. However, after 2.5 hours NLN, the squeezing at high frequency got much better and reached 5dB squeezing. This would indicate the squeezing angle rotation by thermalization of SRCL detuning.
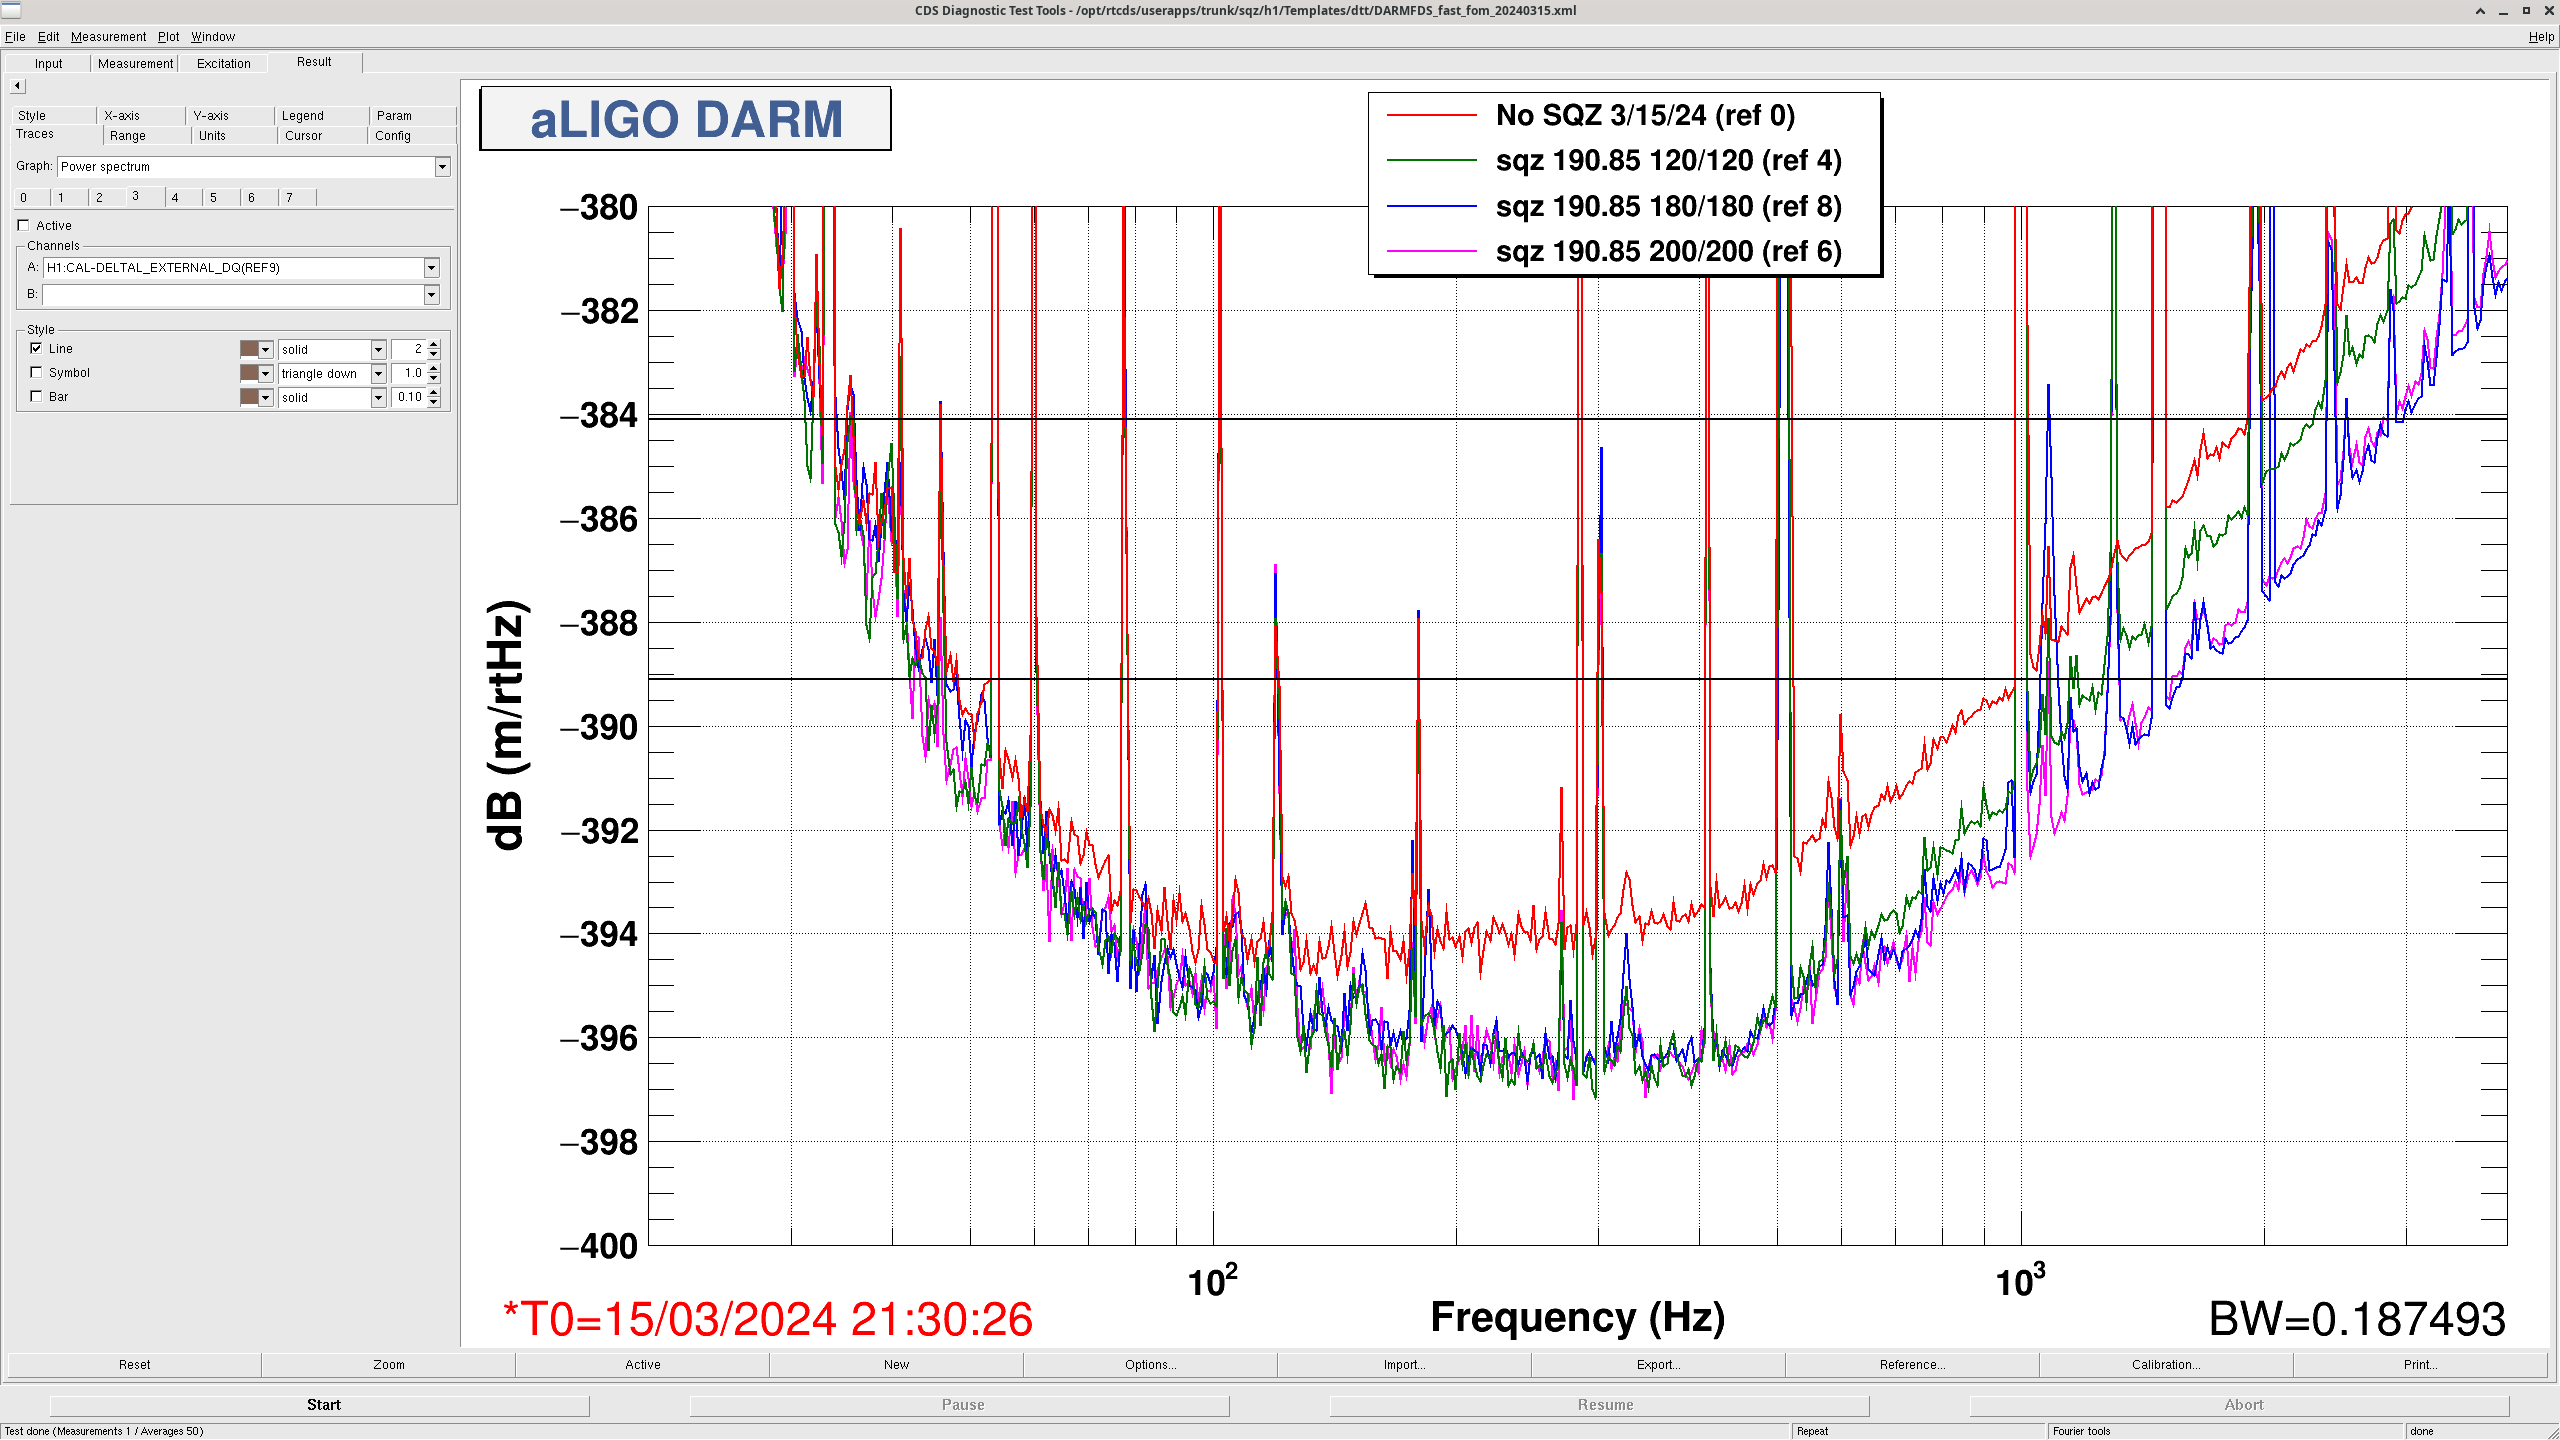
The second attachment shows the DARM with 190deg sqz angle and different PSAMS. The 180/180 PSAMS gave flat squeezing after 45 min NLN, but we found that the sqz became flat with 120/120 PSAMS after 2.5 hour NLN so we set PSAMS at 120/120.
TITLE: 03/15 Day Shift: 15:00-23:00 UTC (08:00-16:00 PST), all times posted in UTC
STATE of H1: Commissioning
INCOMING OPERATOR: None
SHIFT SUMMARY:
IFO is in NLN and COMISSIONING
Control Room Operation Log 03/15
———————————————————— Shift begin to Nominal Low Noise
15:42 UTC - NLN
16:30 UTC - Erik rebooting Nuc29 due to it flipping on and off - successful
———————————————————— Nominal Low Noise to Lockloss/Lock Attempt 1
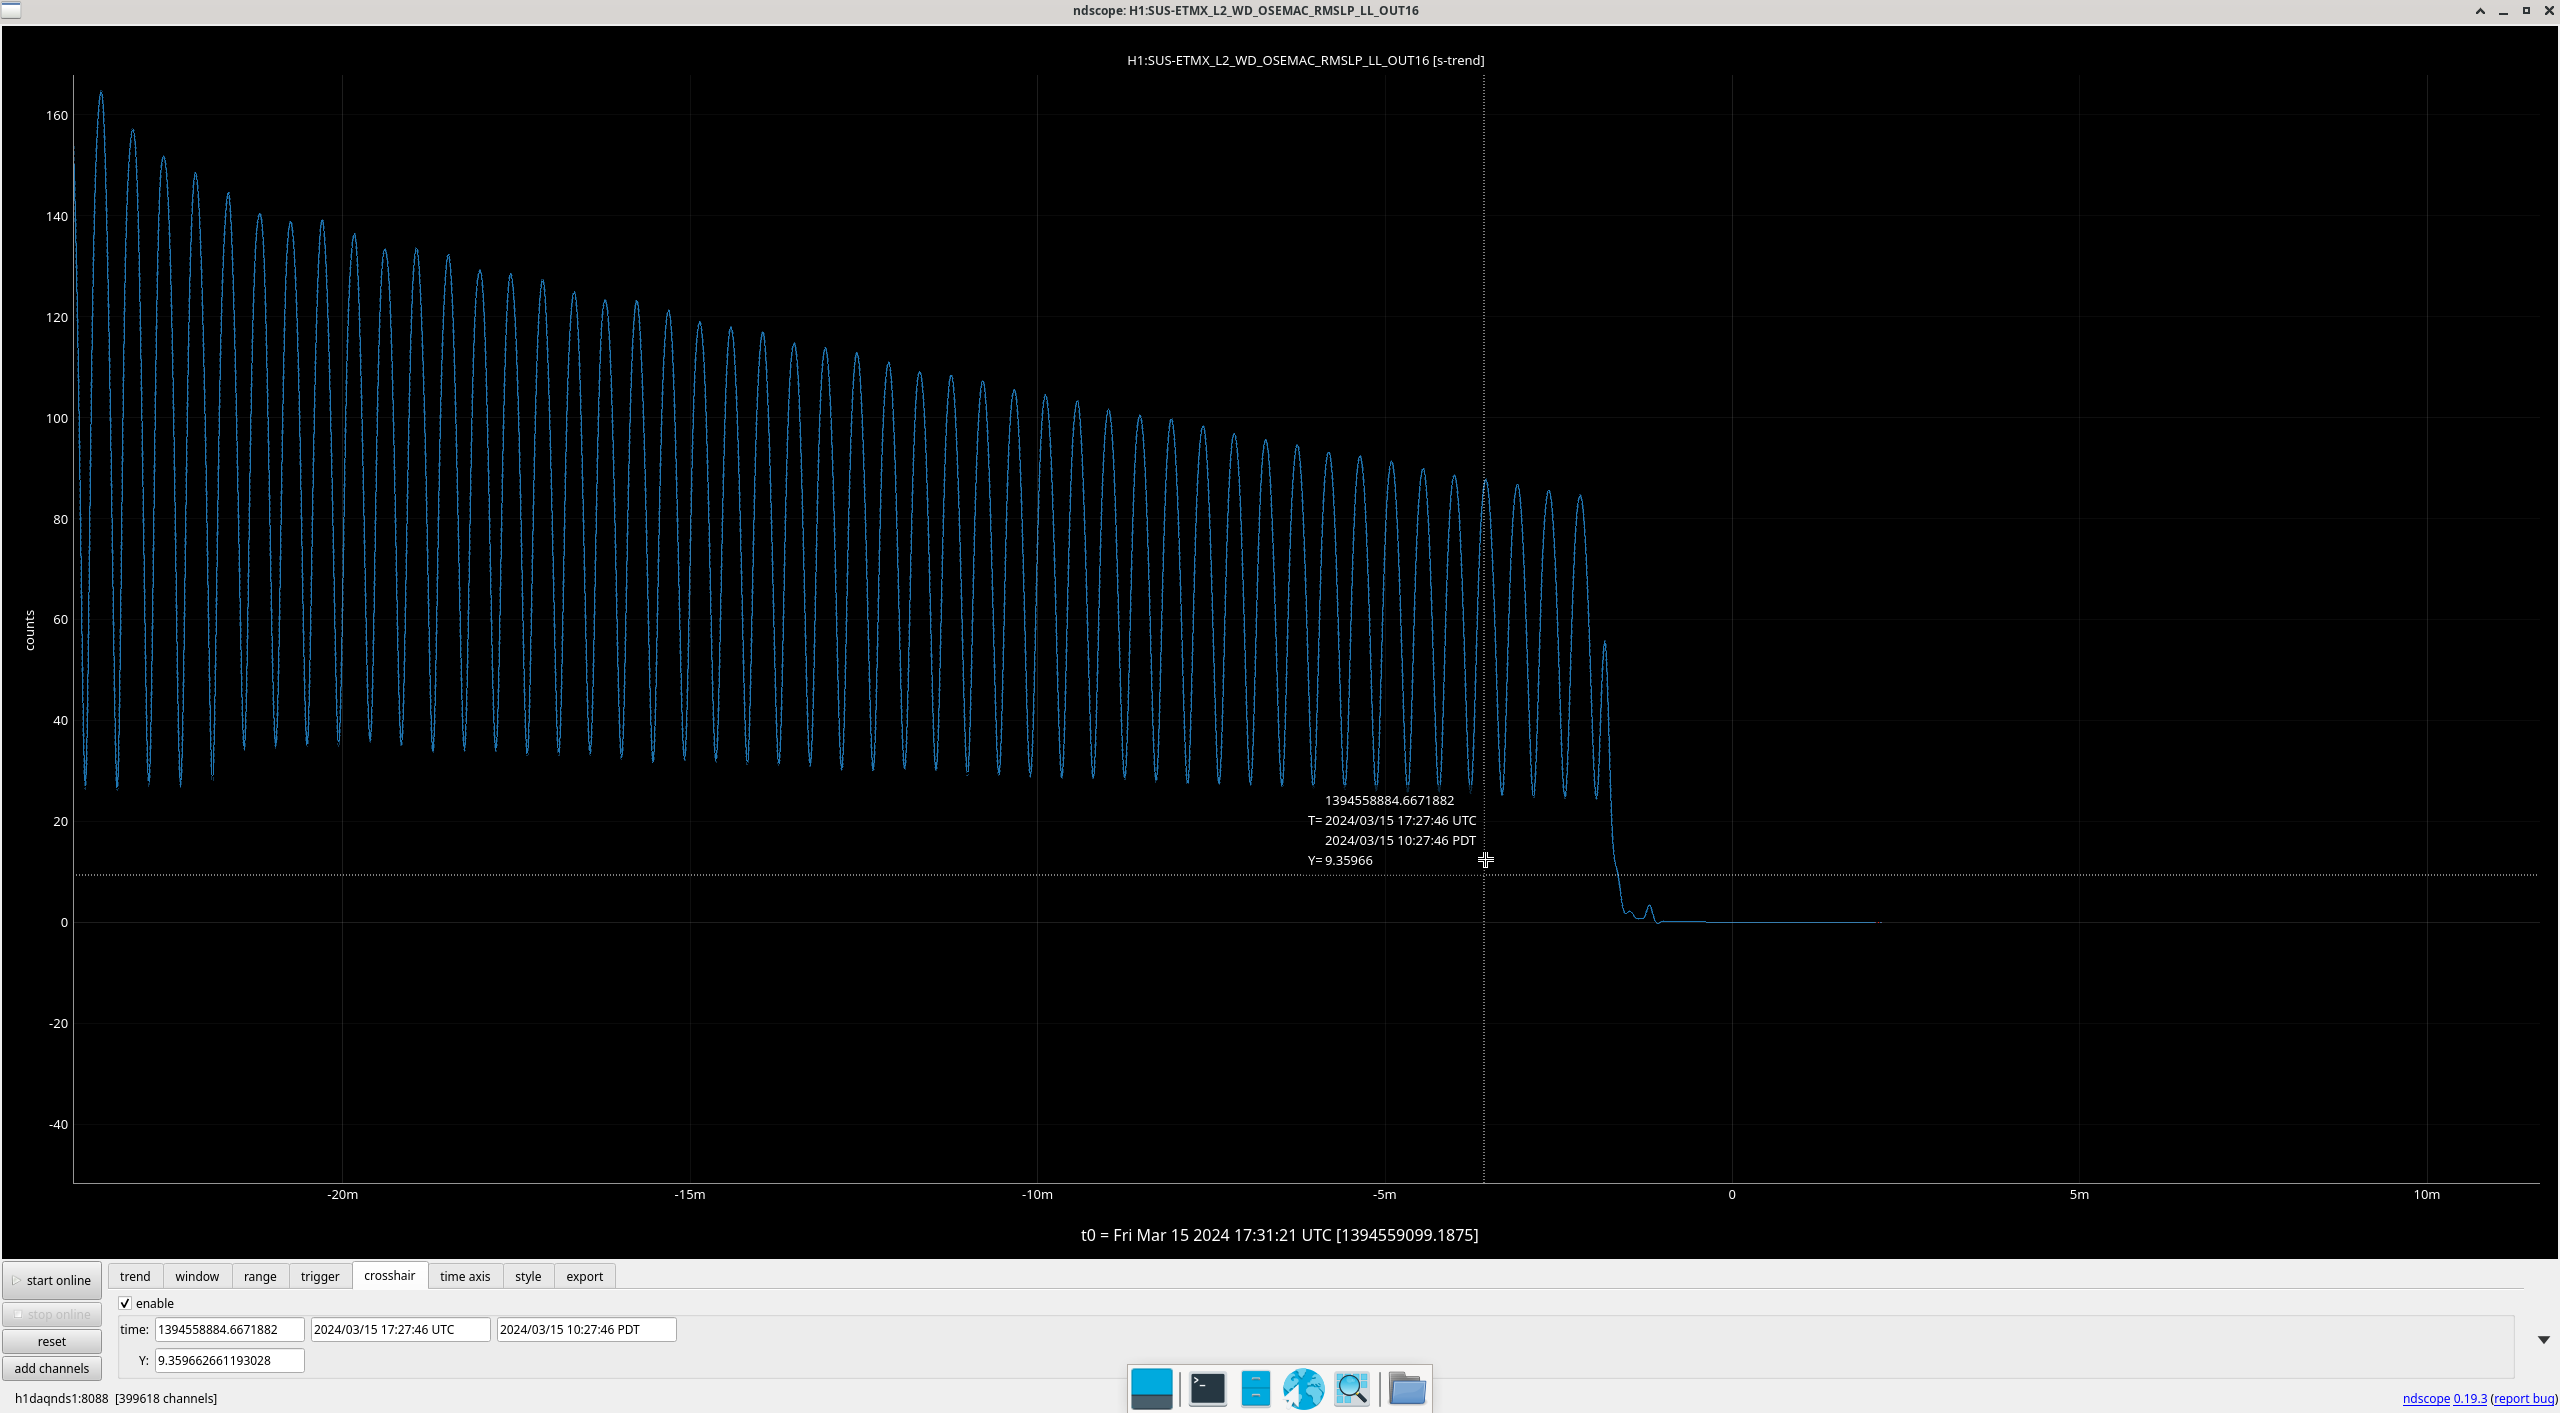
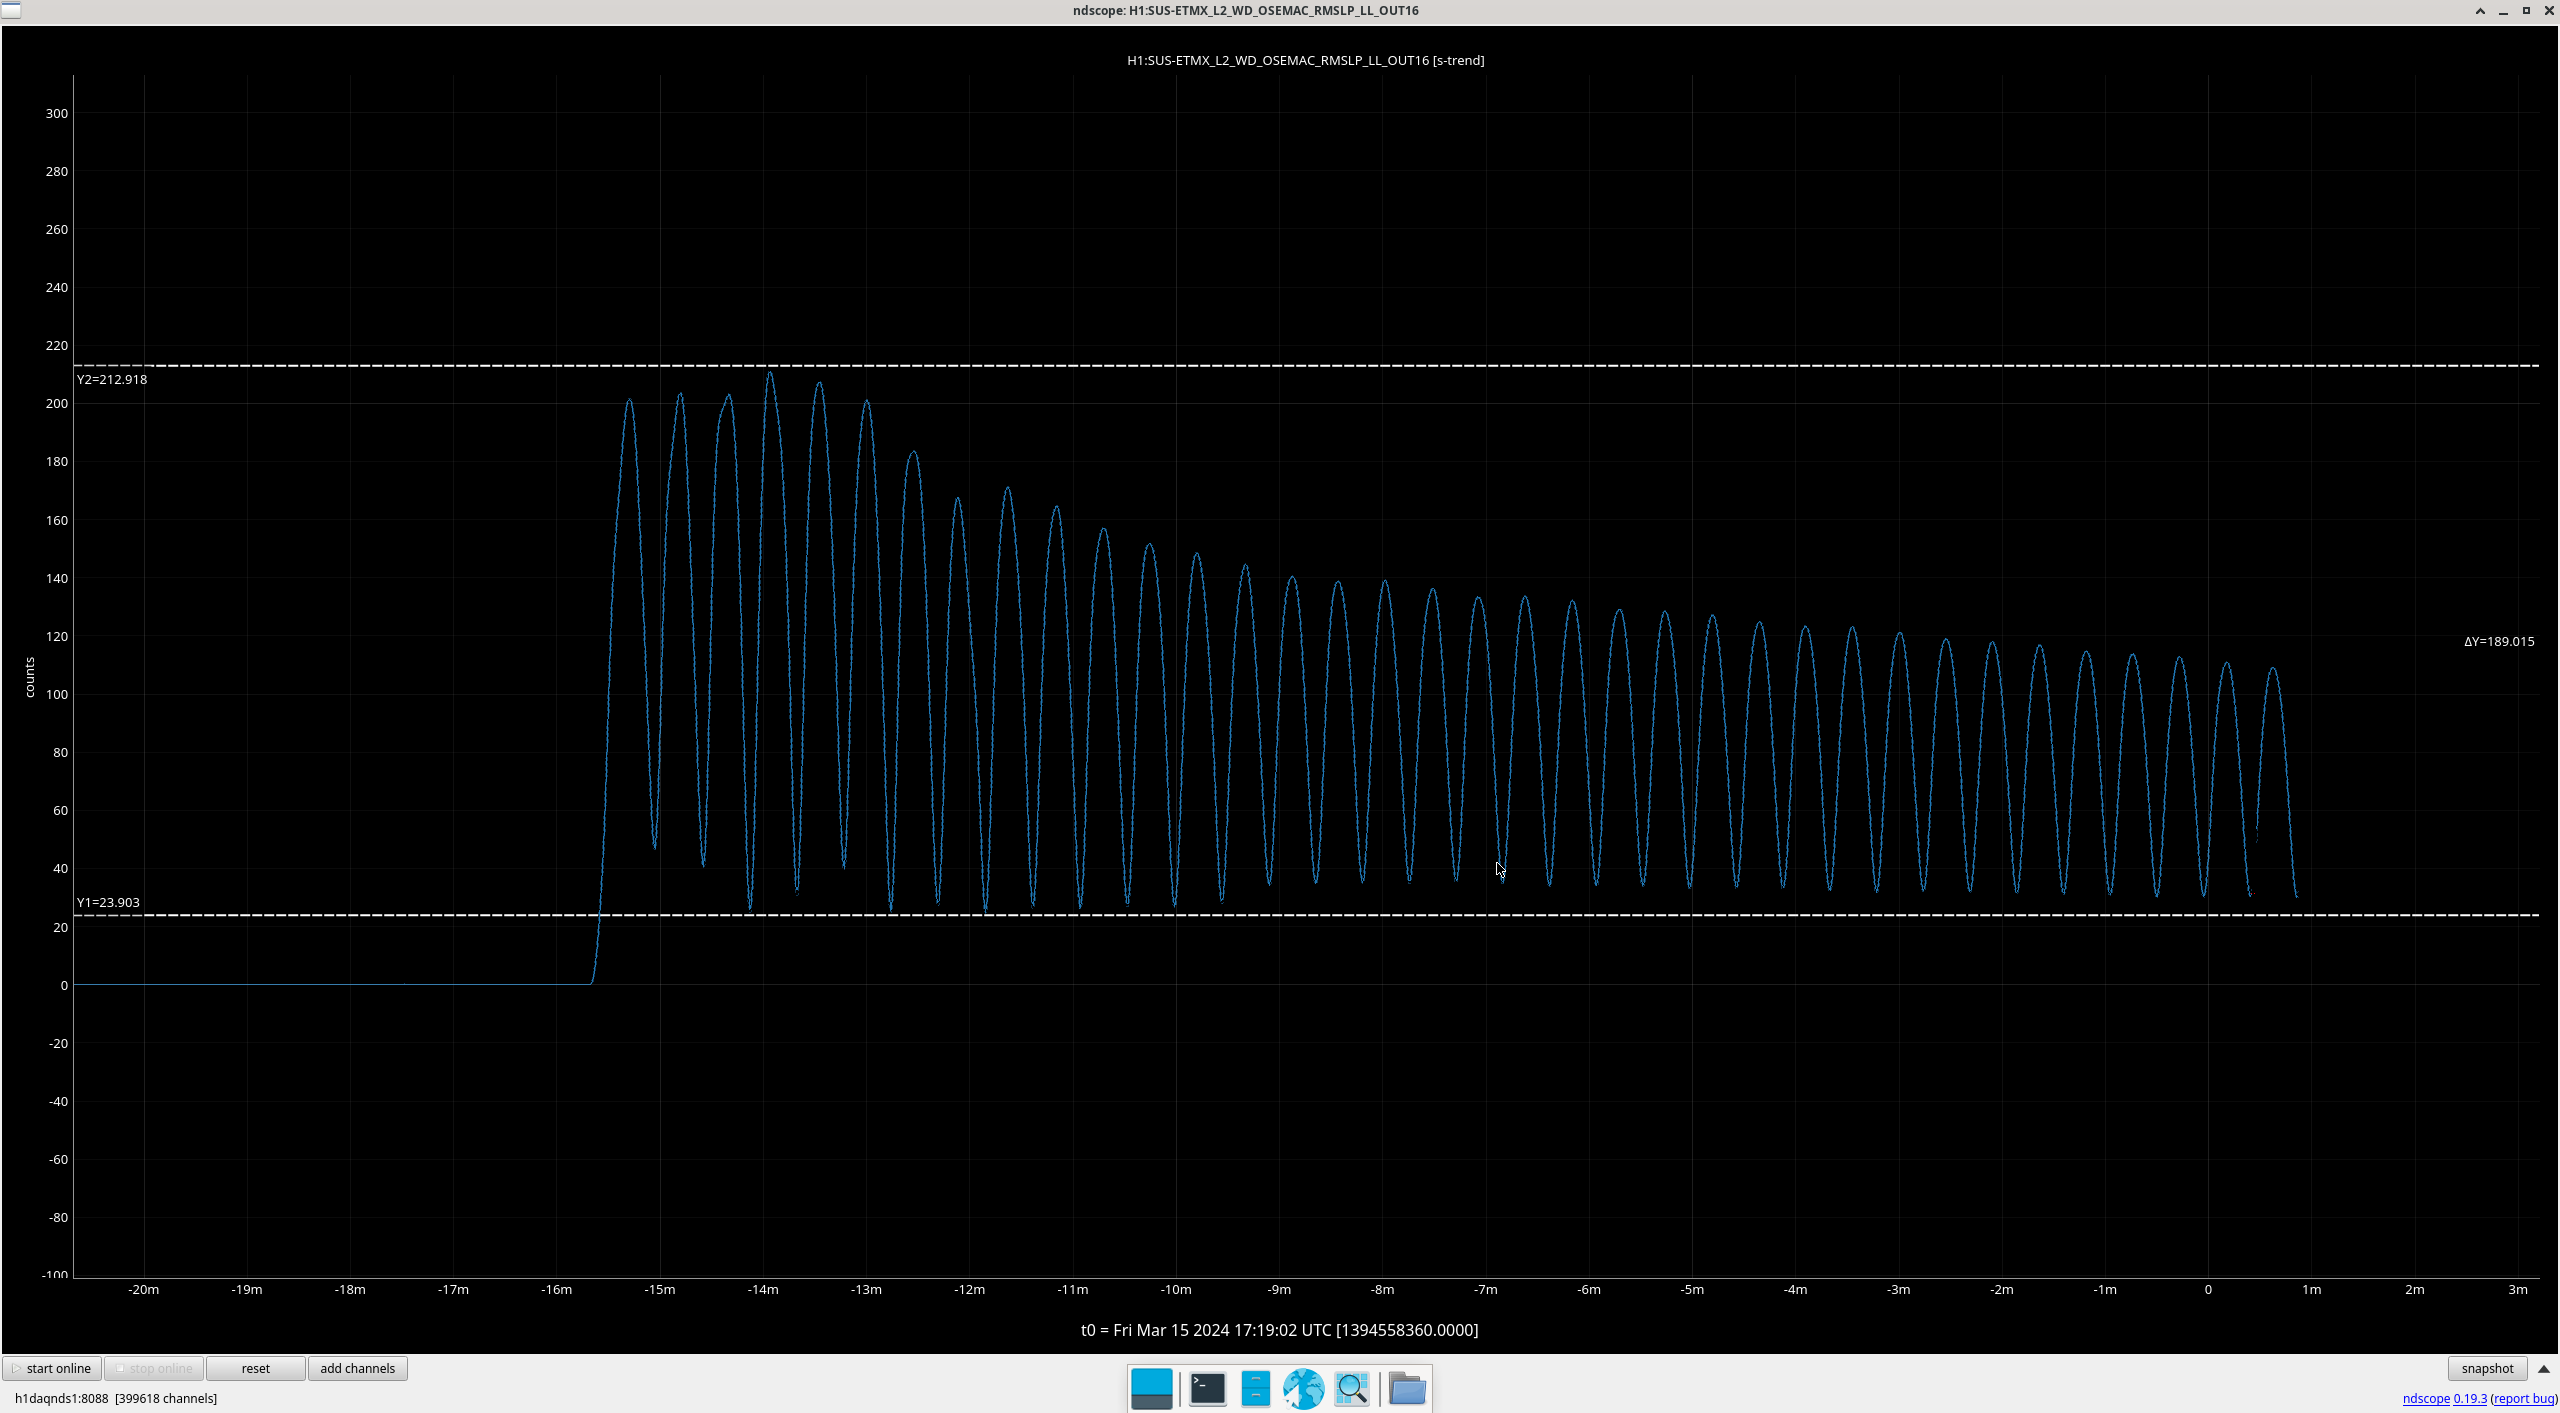
17:03 UTC - Lockloss ISI EX Stage 1, 2, SUS EX, SUS TMSX WD tripped due to commissioning (known reason)
17:34 - Resetting WDs reset - Counts got to 136 for LL AC on L2.
17:36 - Started locking - stopping at Damp Bounce for some commissioning tests (Jennie and Craig)
17:55 - Guardian restarted with NEW_DARM being the new (nominal) DARM.
18:02 - BS touched by Georgia in order to improve BS - but went into MICH_FRINGES before much movement
18:05 - Lockloss at CHECK_MICH_FRINGES - relocking now.
18:07 - Pointed out by TJ, and trended to confirm - the ALS X TRX is much lower than the last few lock attempts. It was hovering around 1.2 yesterday and is maxing at 0.7 today despite a high comm beat note (~6). This might warrant an initial alignment if the current lock attempt fails.
18:25 - BS moved by Georgia to acquire PRMI - success
18:26 - DRMI Locked
18:32 - Lockloss DRMI
———————————————————— Lock Attempt 1 to Init Align
18:32 - Initial Alignment Started
18:40 - Initial Alignment Strangeness - while ALS locked for both arms, the WFs took a while to offload, keeping us in this state for longer than expected - alogged by Camilla (alog 76423)
18:47 - ALSX Transmission values are back to what they were yesterday - around 1.2. Expecting this to fix DRMI locking issues.
19:02 - Initial Alignment Complete - requested CHECK_VIOLINS_BEFORE_POWERUP for Jennie/Craig to run their tests.
———————————————————— Init Align to Lock Attempt 2
19:21 - Reached CHECK_VIOLINS_BEFORE_POWERUP for Jennie to take her measurements.
19:26 - Tests done, NLN requested
19:29 - HAM7 WD Tripped - potentially due to SQZ work - requested pre-squeeze state - ADS_TO_CAMERAS. Camilla letting Naoki and Nutsinee know - checking WD now.
19:34 - WD reset successfully.
19:40/1 - Requested and reached TRANSITION_FROM_ETMX for commissioning work.
19:54 - Lockloss - DRMI unlocked (reason not immediately apparent)
———————————————————— Lockloss to Lock Attempt 3
20:30 - Lockloss - DRMI unlocked at LOWNOISE_ASC (Alenna caused via changes made in that state)
20:47 - Gerardo informed the control room that the computing room across from the control room had a loud fan and that the back wall was vibrating - informed facilities and Tyler is investigating. Nothing was wrong according to Tyler and Eric.
21:18 - Locked and in NOMINAL_LOW_NOISE
———————————————————— Nominal Low Noise to Shift End
22:38 - Craig Running CARM Injection Tests
22:48 - Craig’s Tests done - preparing for future injections
LOG:
| Start Time | System | Name | Location | Lazer_Haz | Task | Time End |
|---|---|---|---|---|---|---|
| 17:25 | VAC | Jordan, Gerardo | LVEA | N | Cart Transport | 17:39 |
| 18:28 | FAC | Tyler | MY | N | Roof inspection | 19:28 |
| 19:11 | SQZ | Daniel, Nutsinee, Naoki | LVEA | N | Switch | 19:41 |
| 19:41 | CDS | Erik, Marc | EX | N | Environmental Protection Procurement (jacket) | 20:05 |
| 20:01 | SQZ | Nutsinee | LVEA | N | Quick Measurement | 20:06 |
| 22:12 | PSL | Craig, Matthew, Graeme | LVEA | N | CARM Injection Preparation | 23:12 |
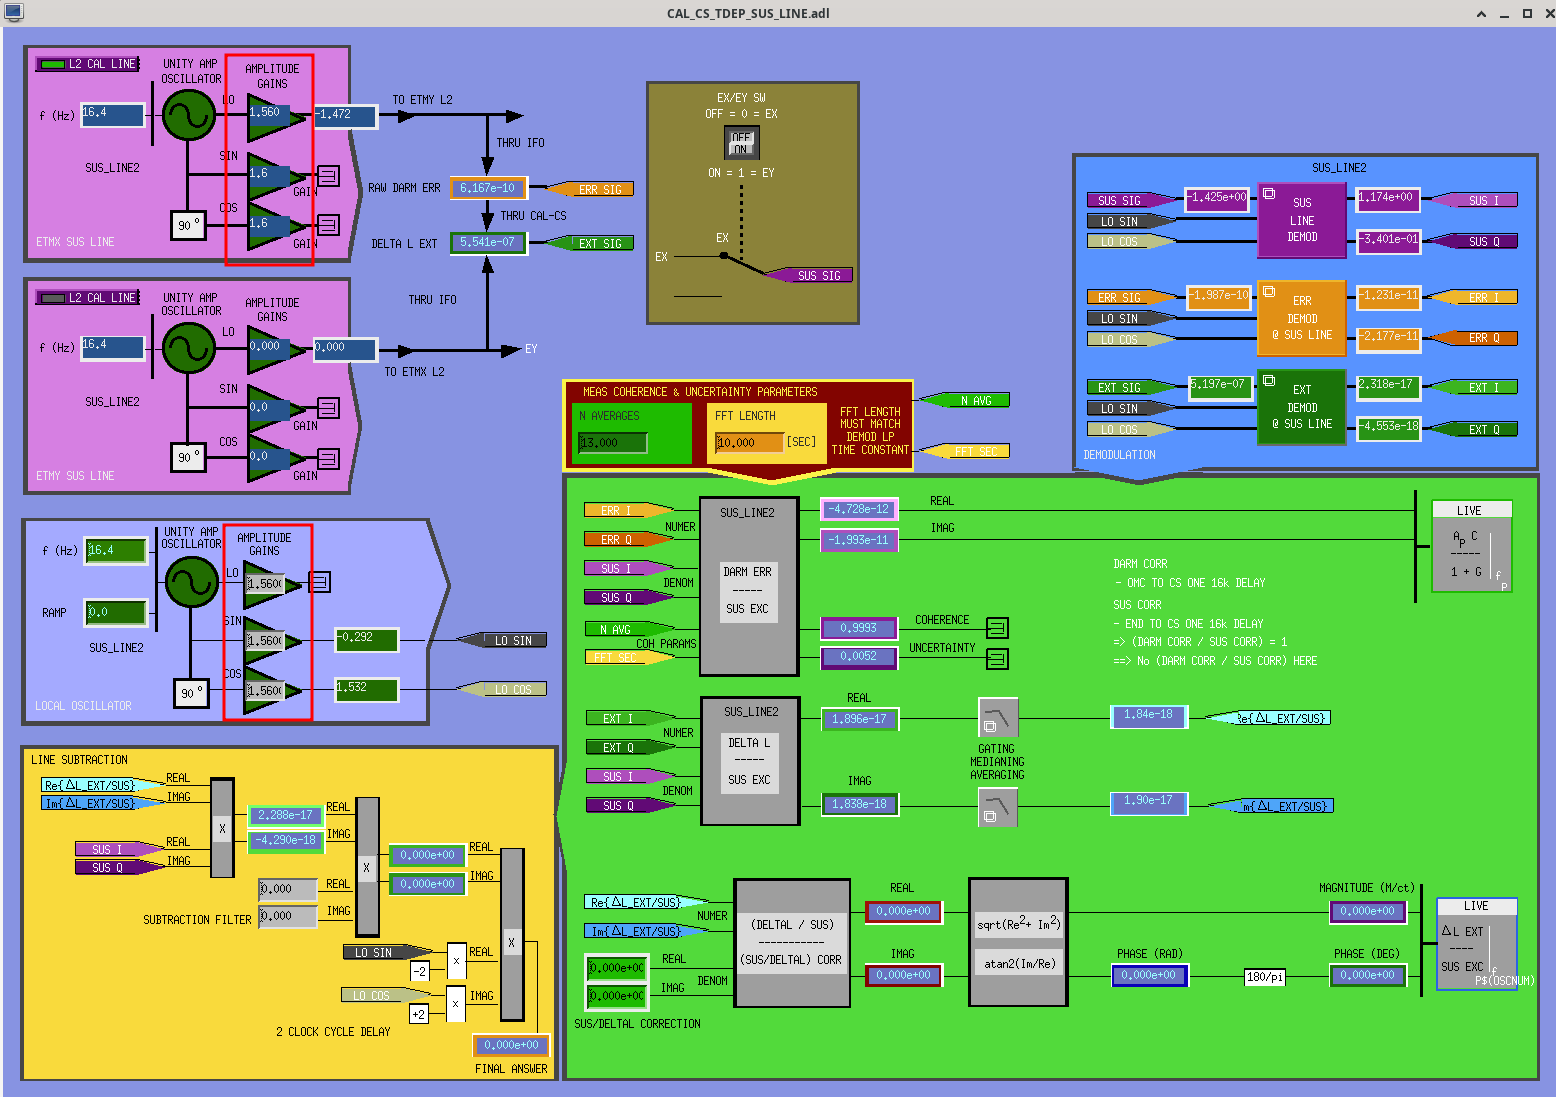
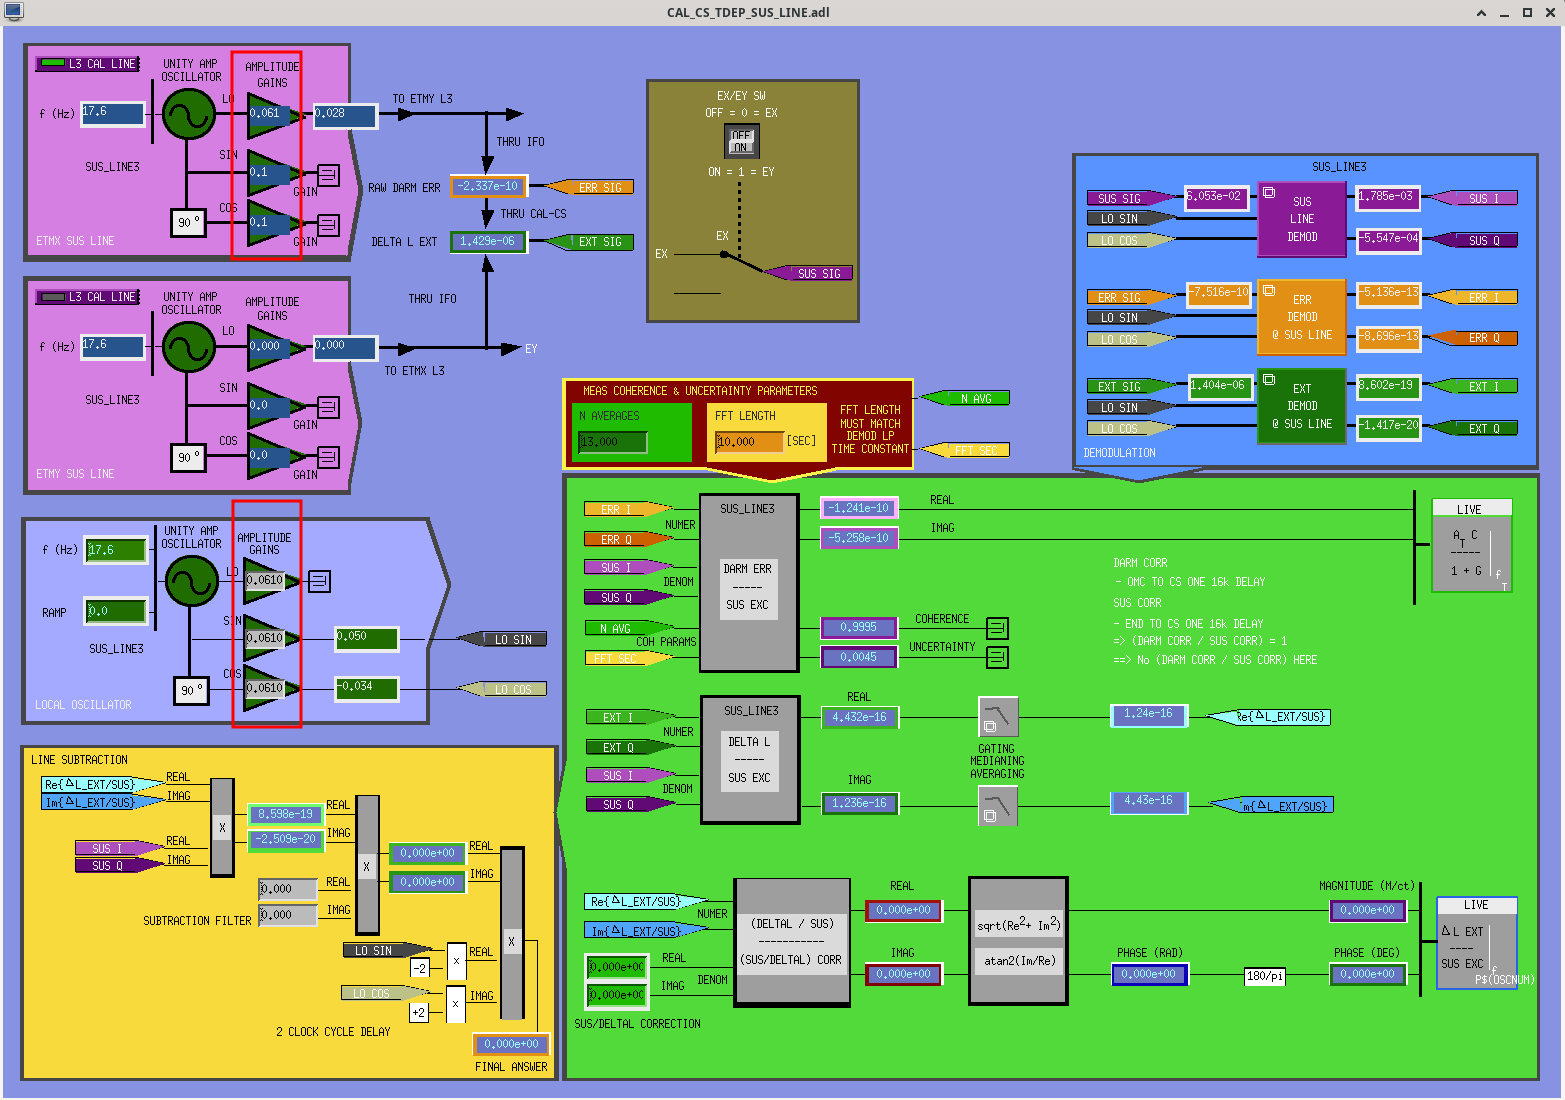
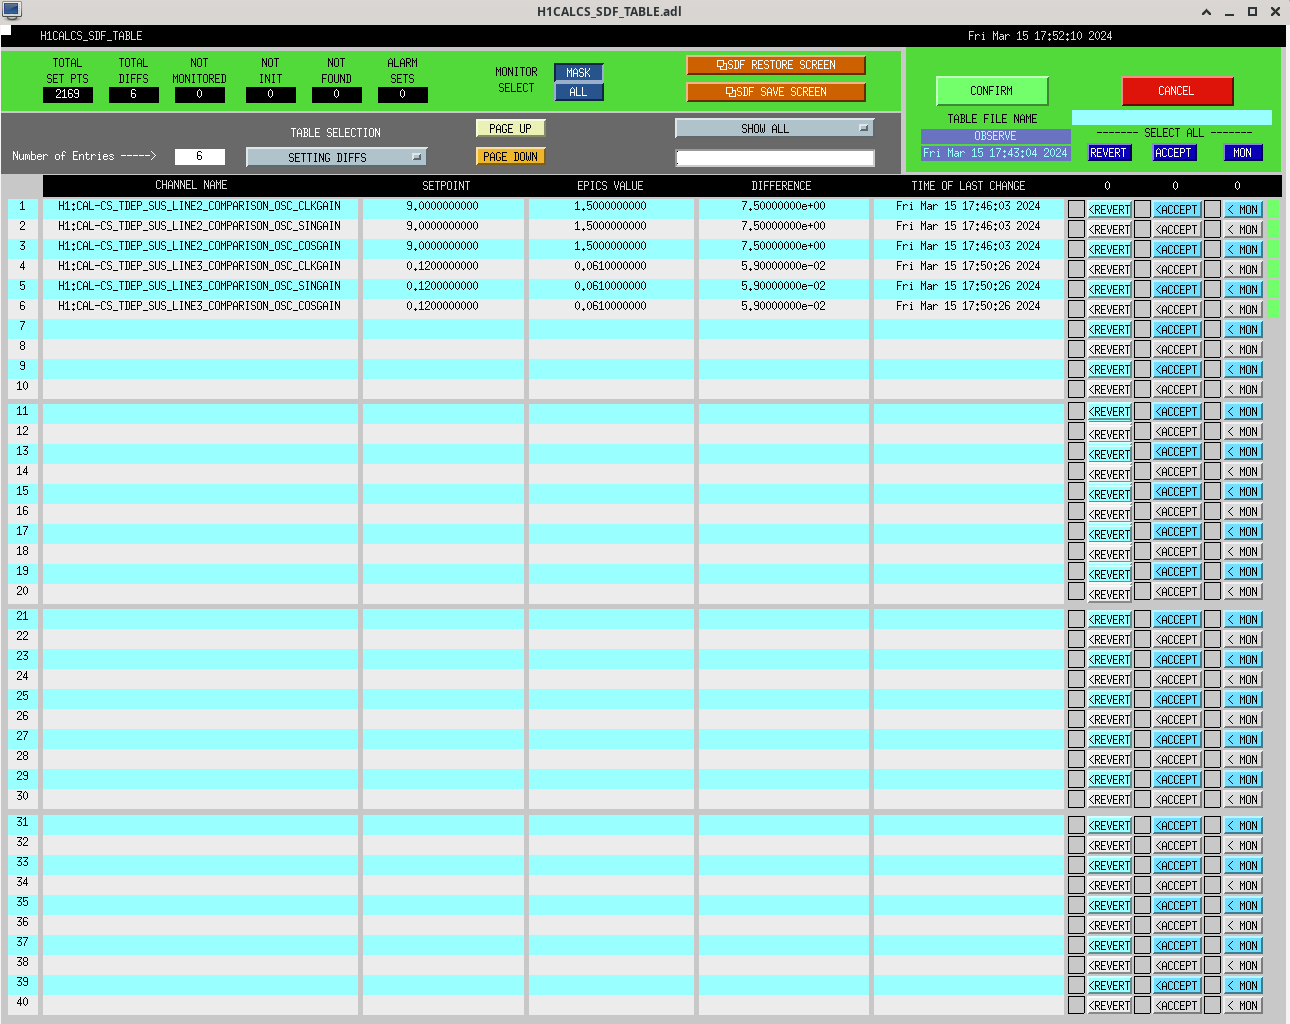
[Elenna, Louis] We reduced the amplitudes of the L2 and L3 SUS calibration lines. Both lines were way too loud after moving to the new DARM loop offloading configuration. The settings we ended up on are below: Line | Freq | Gain | DELTA_L/SUS_EXC uncertainty L2 | 16.4 Hz | 1.5 | 0.0058 L3 | 17.6 Hz | 0.061 | .0046 For each step I changed all of the following channels: H1:SUS-ETMX_L2_CAL_LINE_CLKGAIN, H1:SUS-ETMX_L2_CAL_LINE_SINGAIN, H1:SUS-ETMX_L2_CAL_LINE_COSGAIN, H1:CAL-CS_TDEP_SUS_LINE2_COMPARISON_OSC_CLKGAIN, H1:CAL-CS_TDEP_SUS_LINE2_COMPARISON_OSC_SINGAIN, H1:CAL-CS_TDEP_SUS_LINE2_COMPARISON_OSC_COSGAIN I'm attaching the CAL-CS SUS Line screens for both lines. Red boxes highlight the gains that we adjusted.
With the offset on the AS_A WFS centering, that should lower DHARD_Y coupling to DARM:
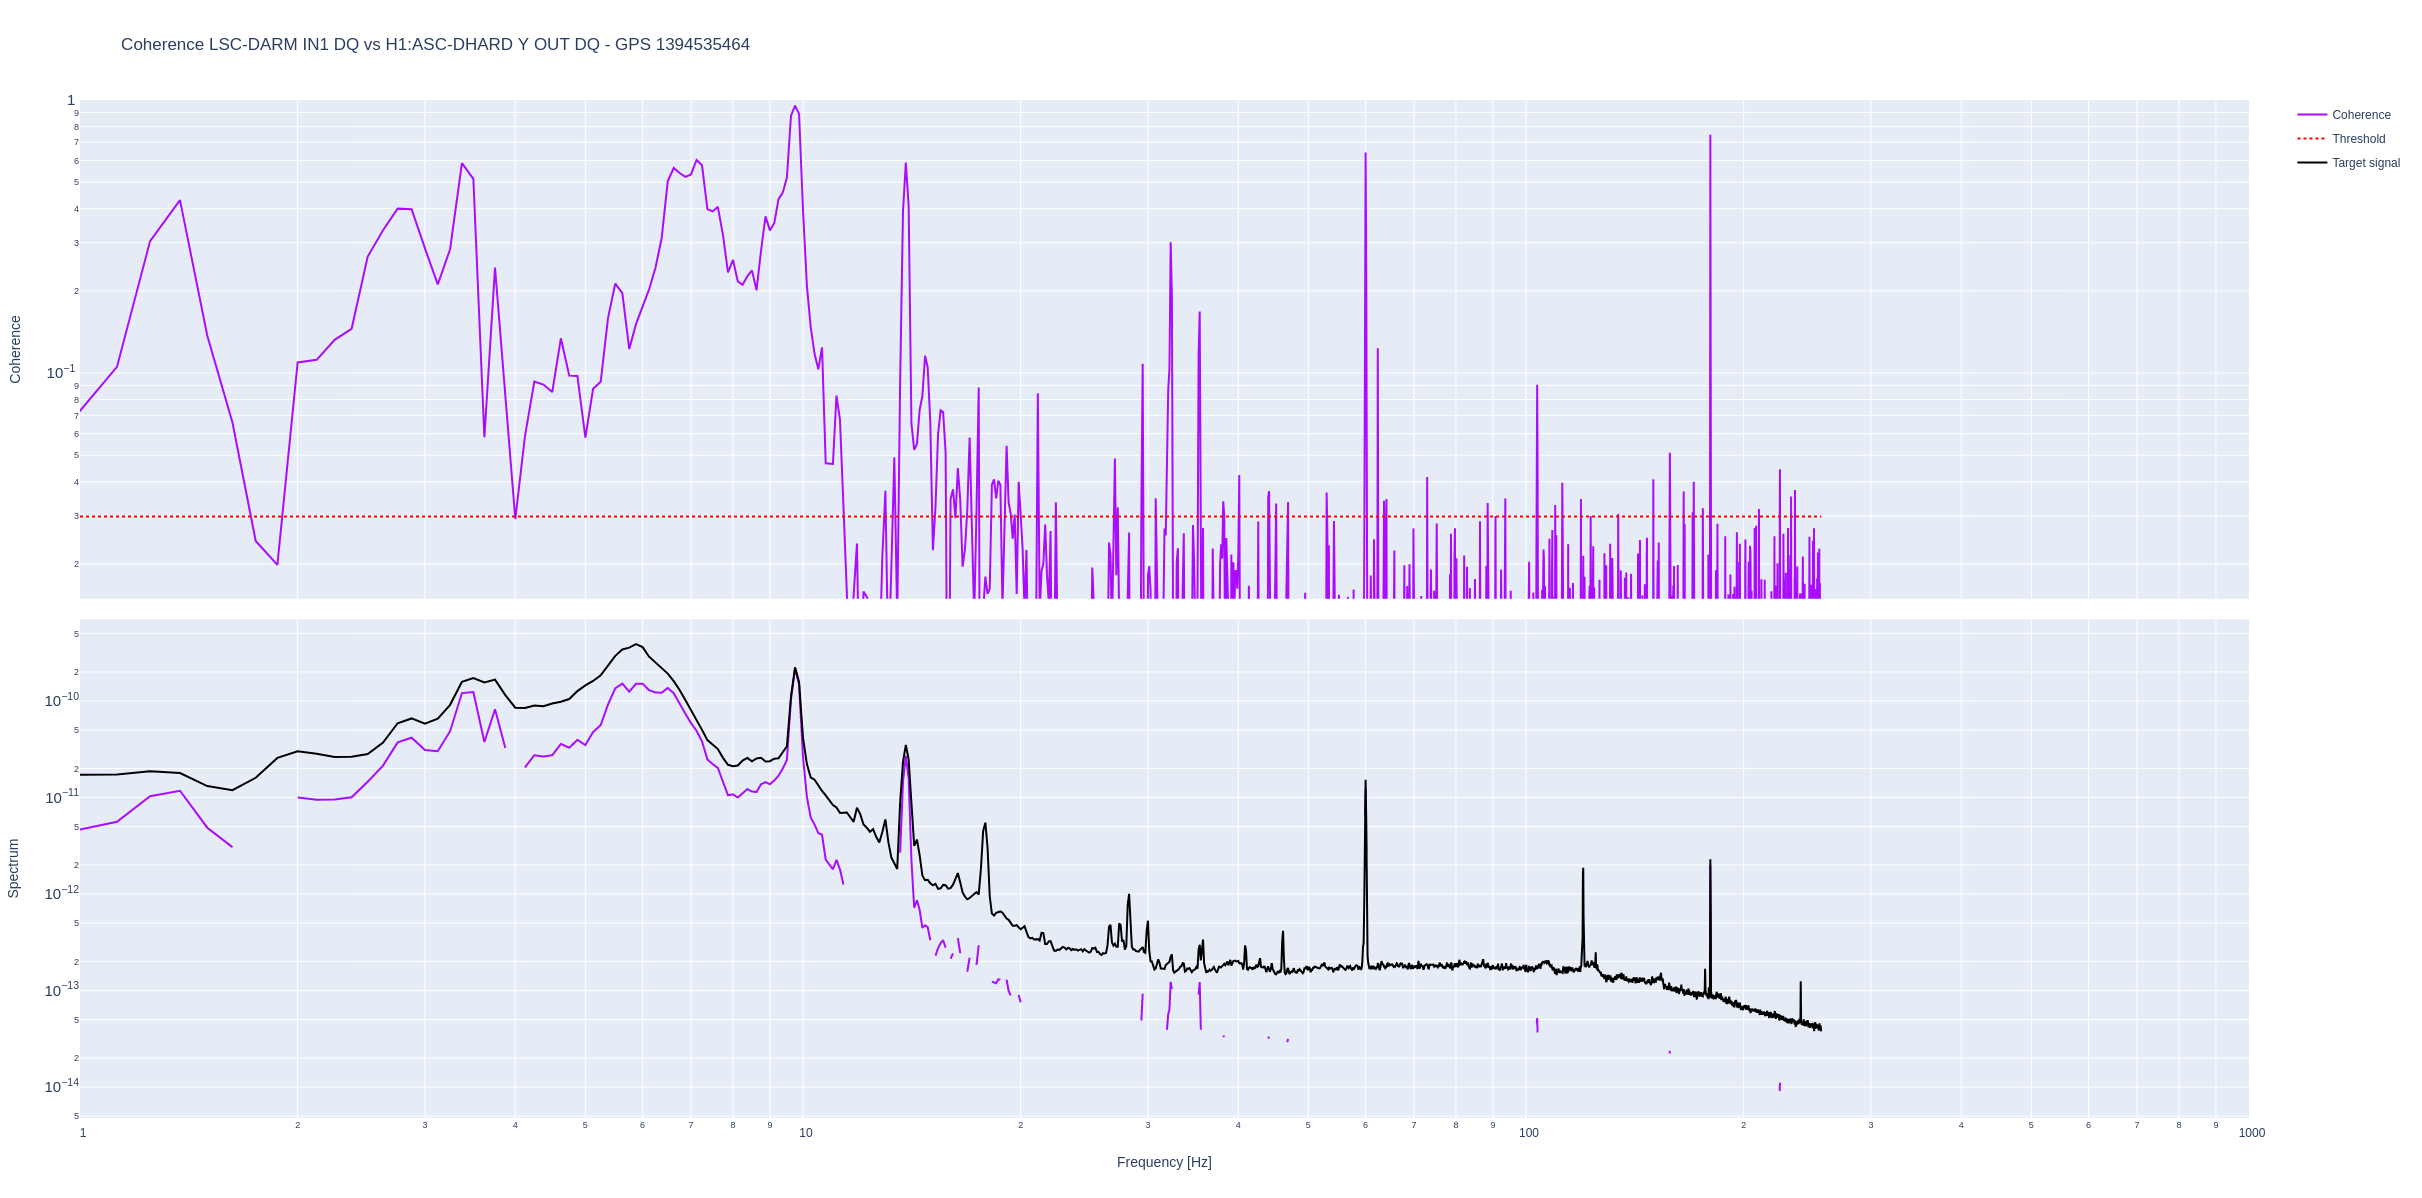
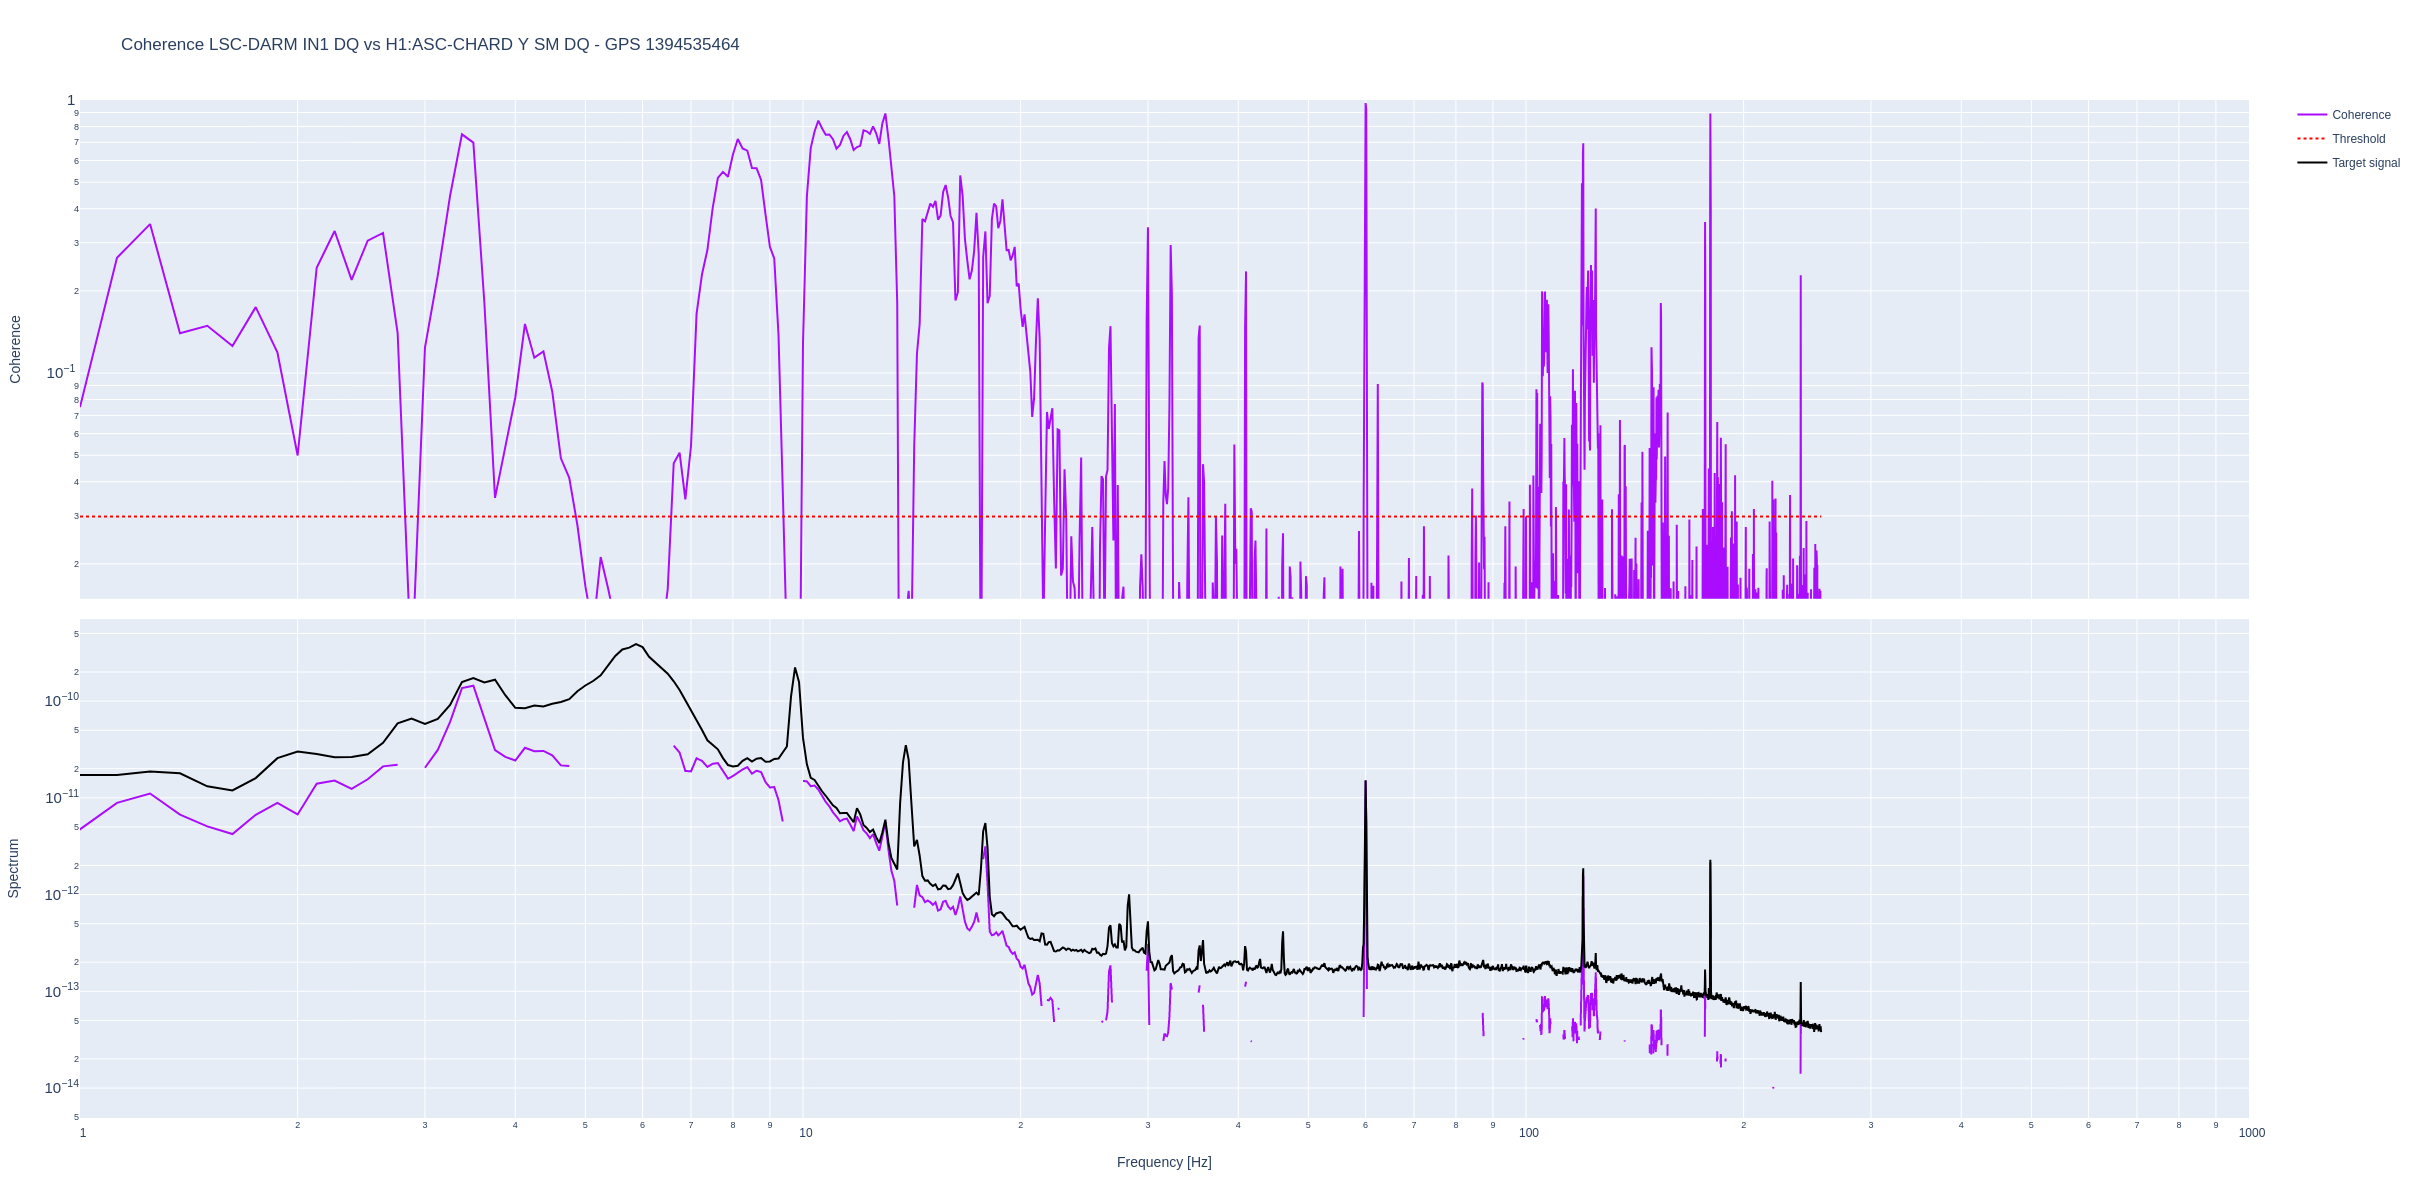
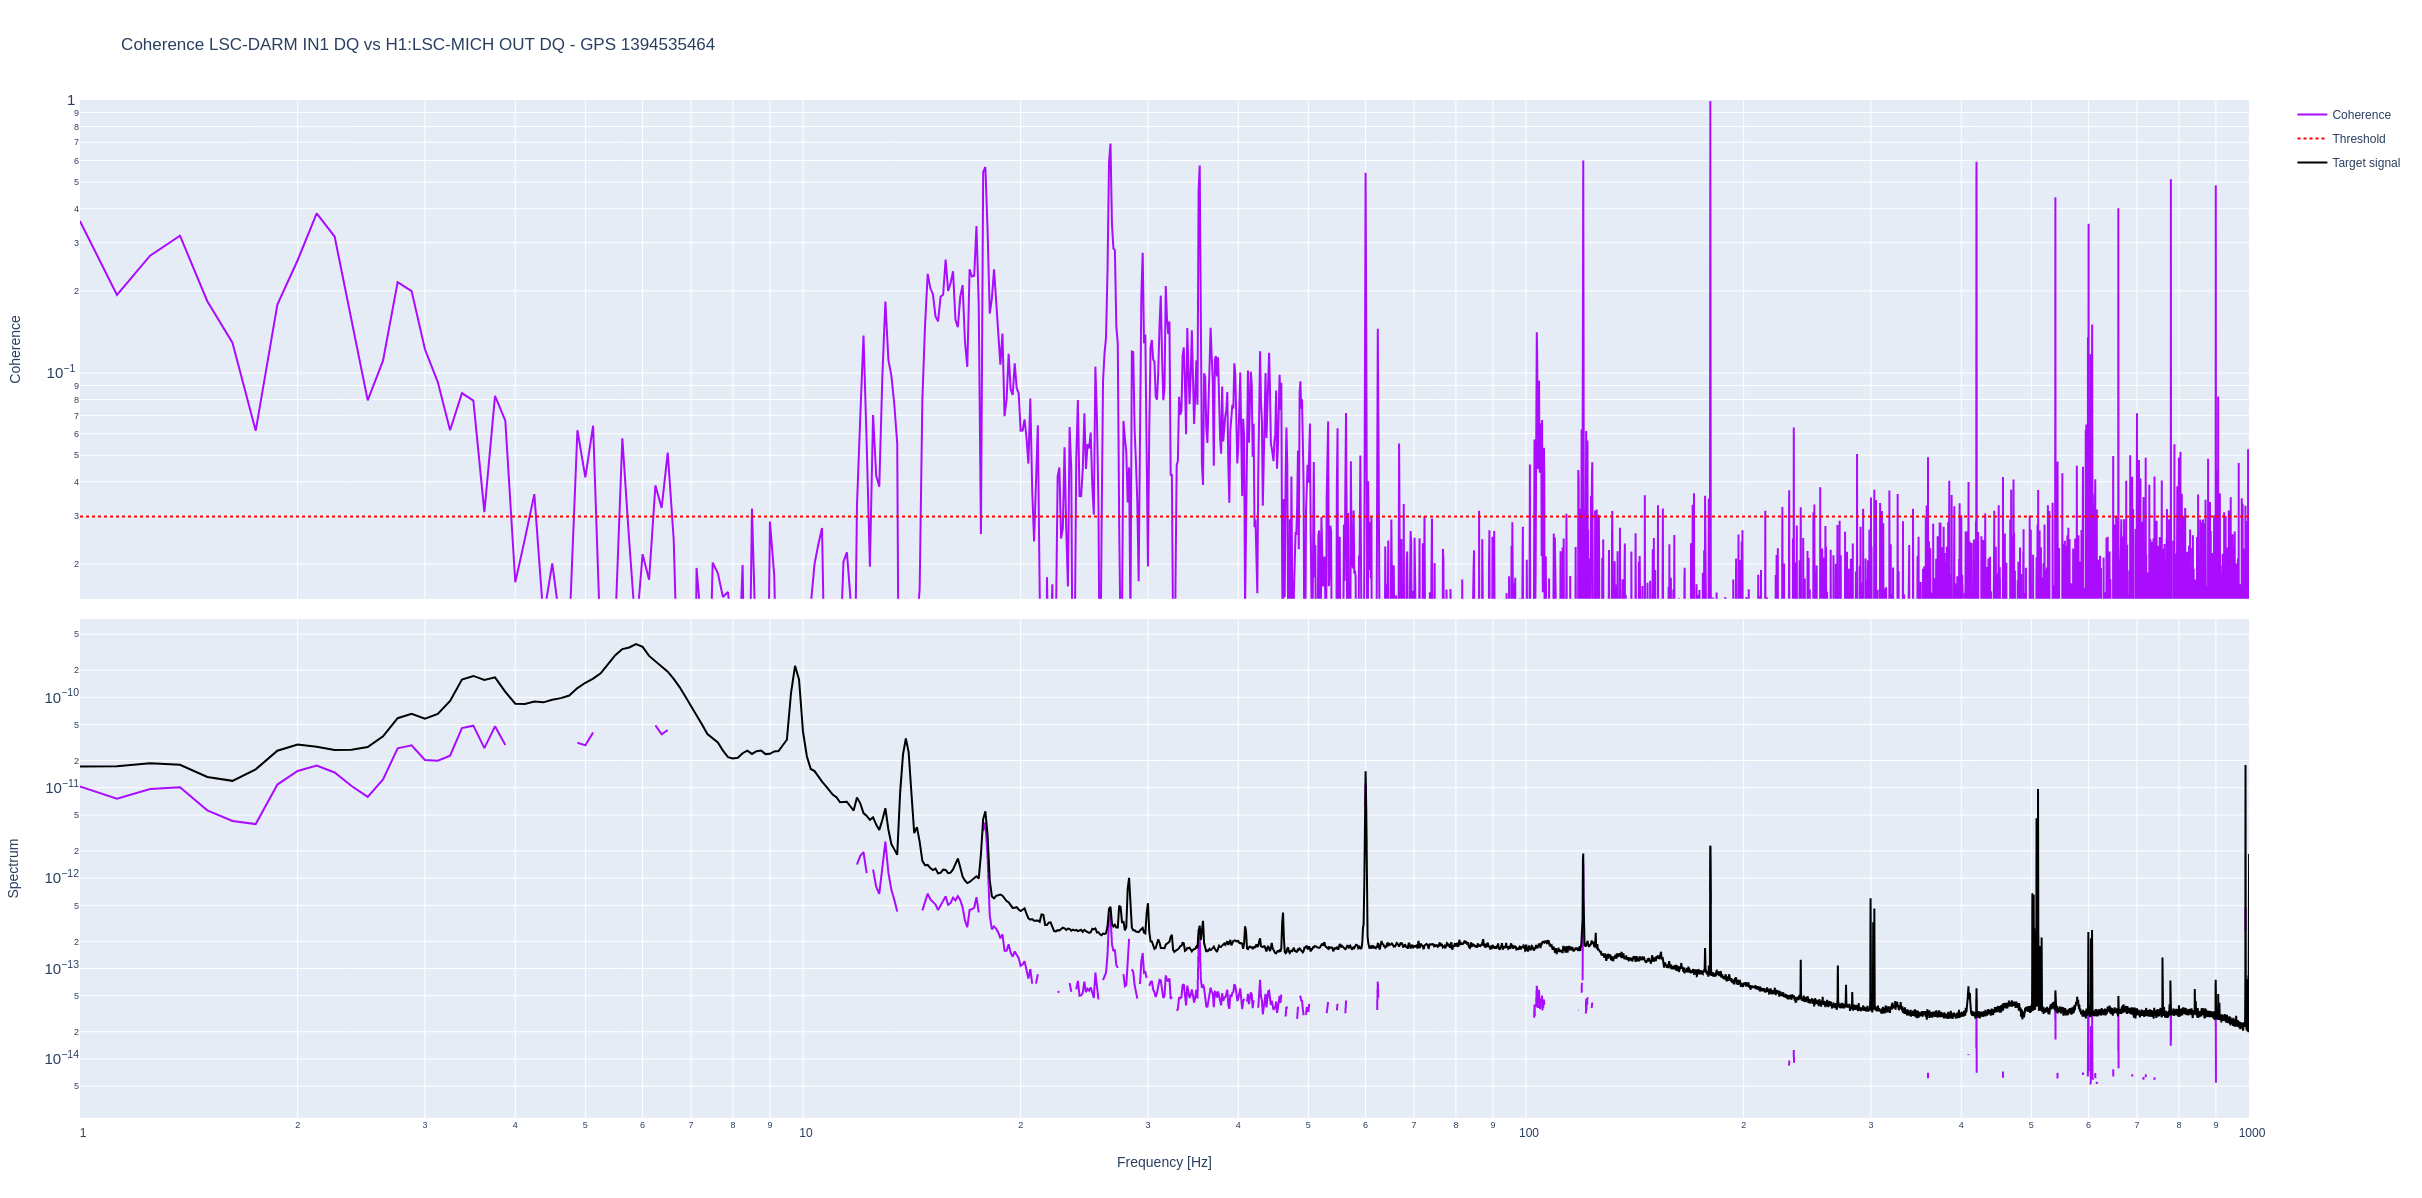
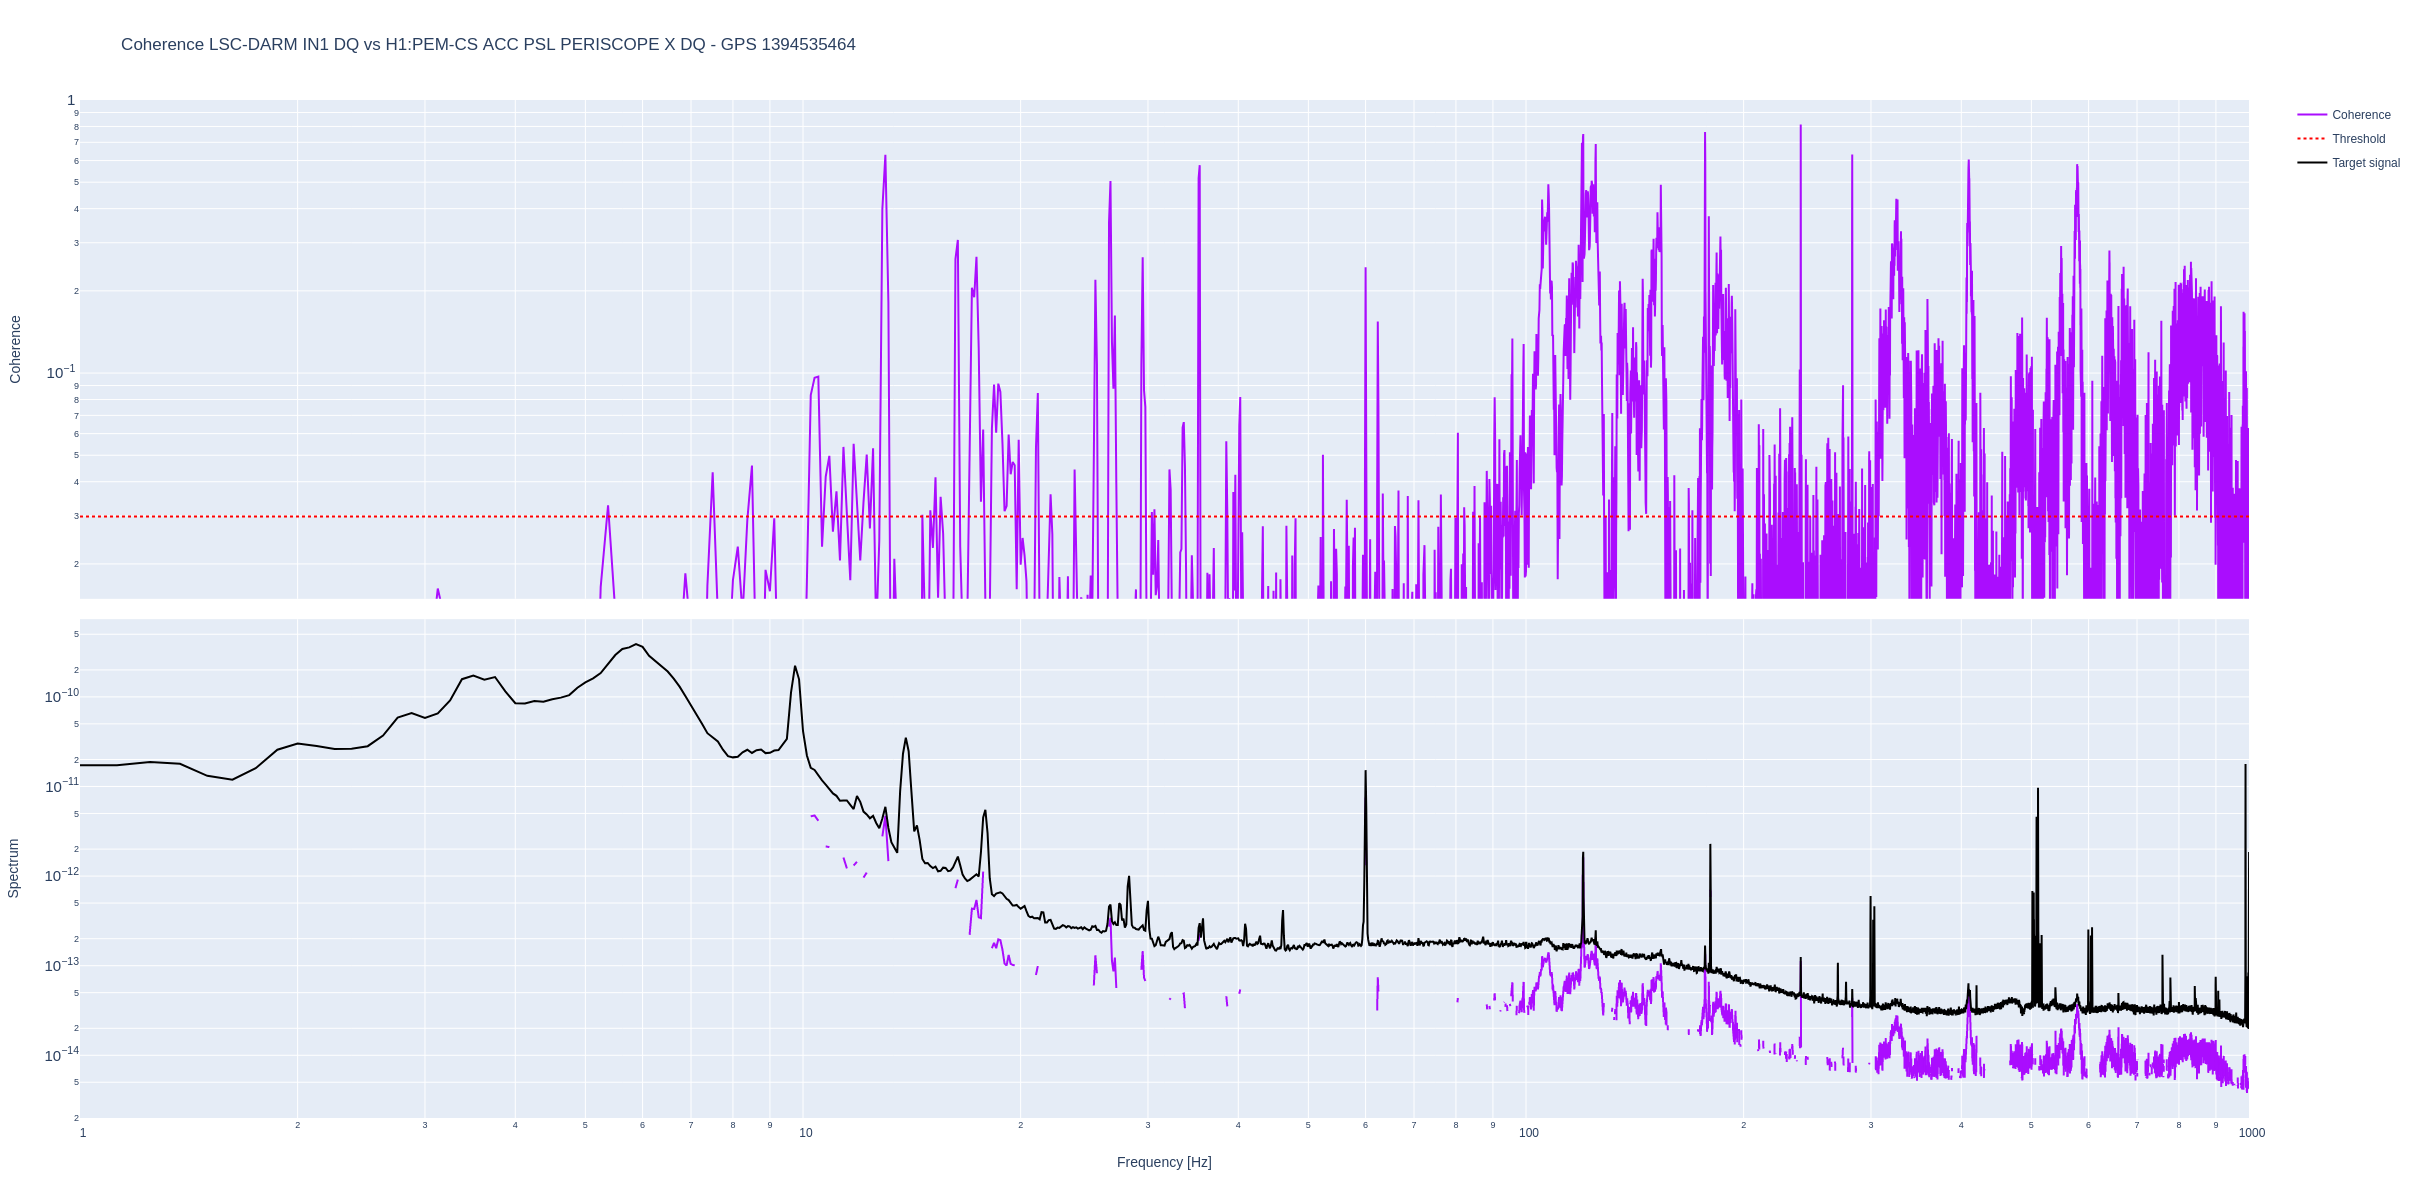
https://ldas-jobs.ligo-wa.caltech.edu/~gabriele.vajente/bruco_1394535464_DARM
Indeed, DHARD_Y coherence with DARM is much lower. Interestingly, now CHARD_Y coherence seems higher.
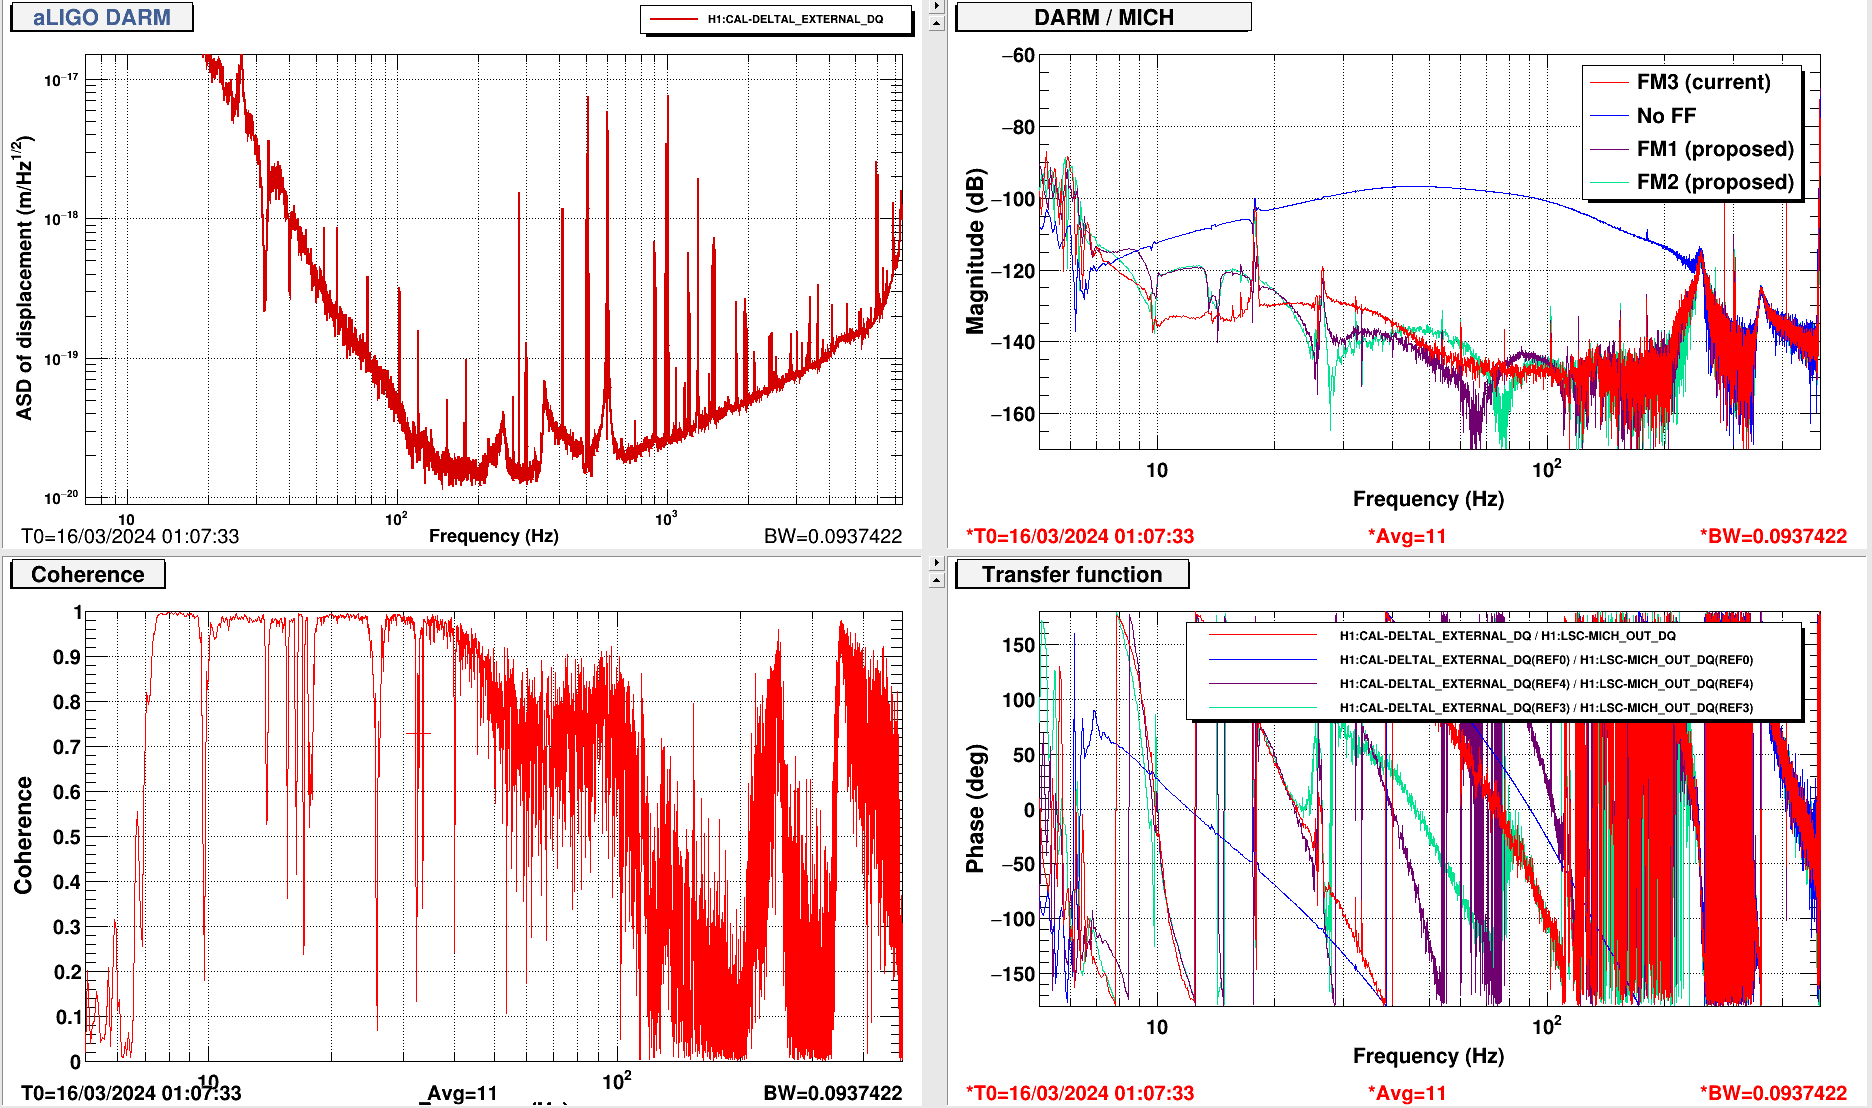
In other news, there is some coherence with MICH, but hopefully the retuned FF filter will help with that.
Coherence with input jitter witness is also large, see for example the PSL periscope
[Trent, Georgia]
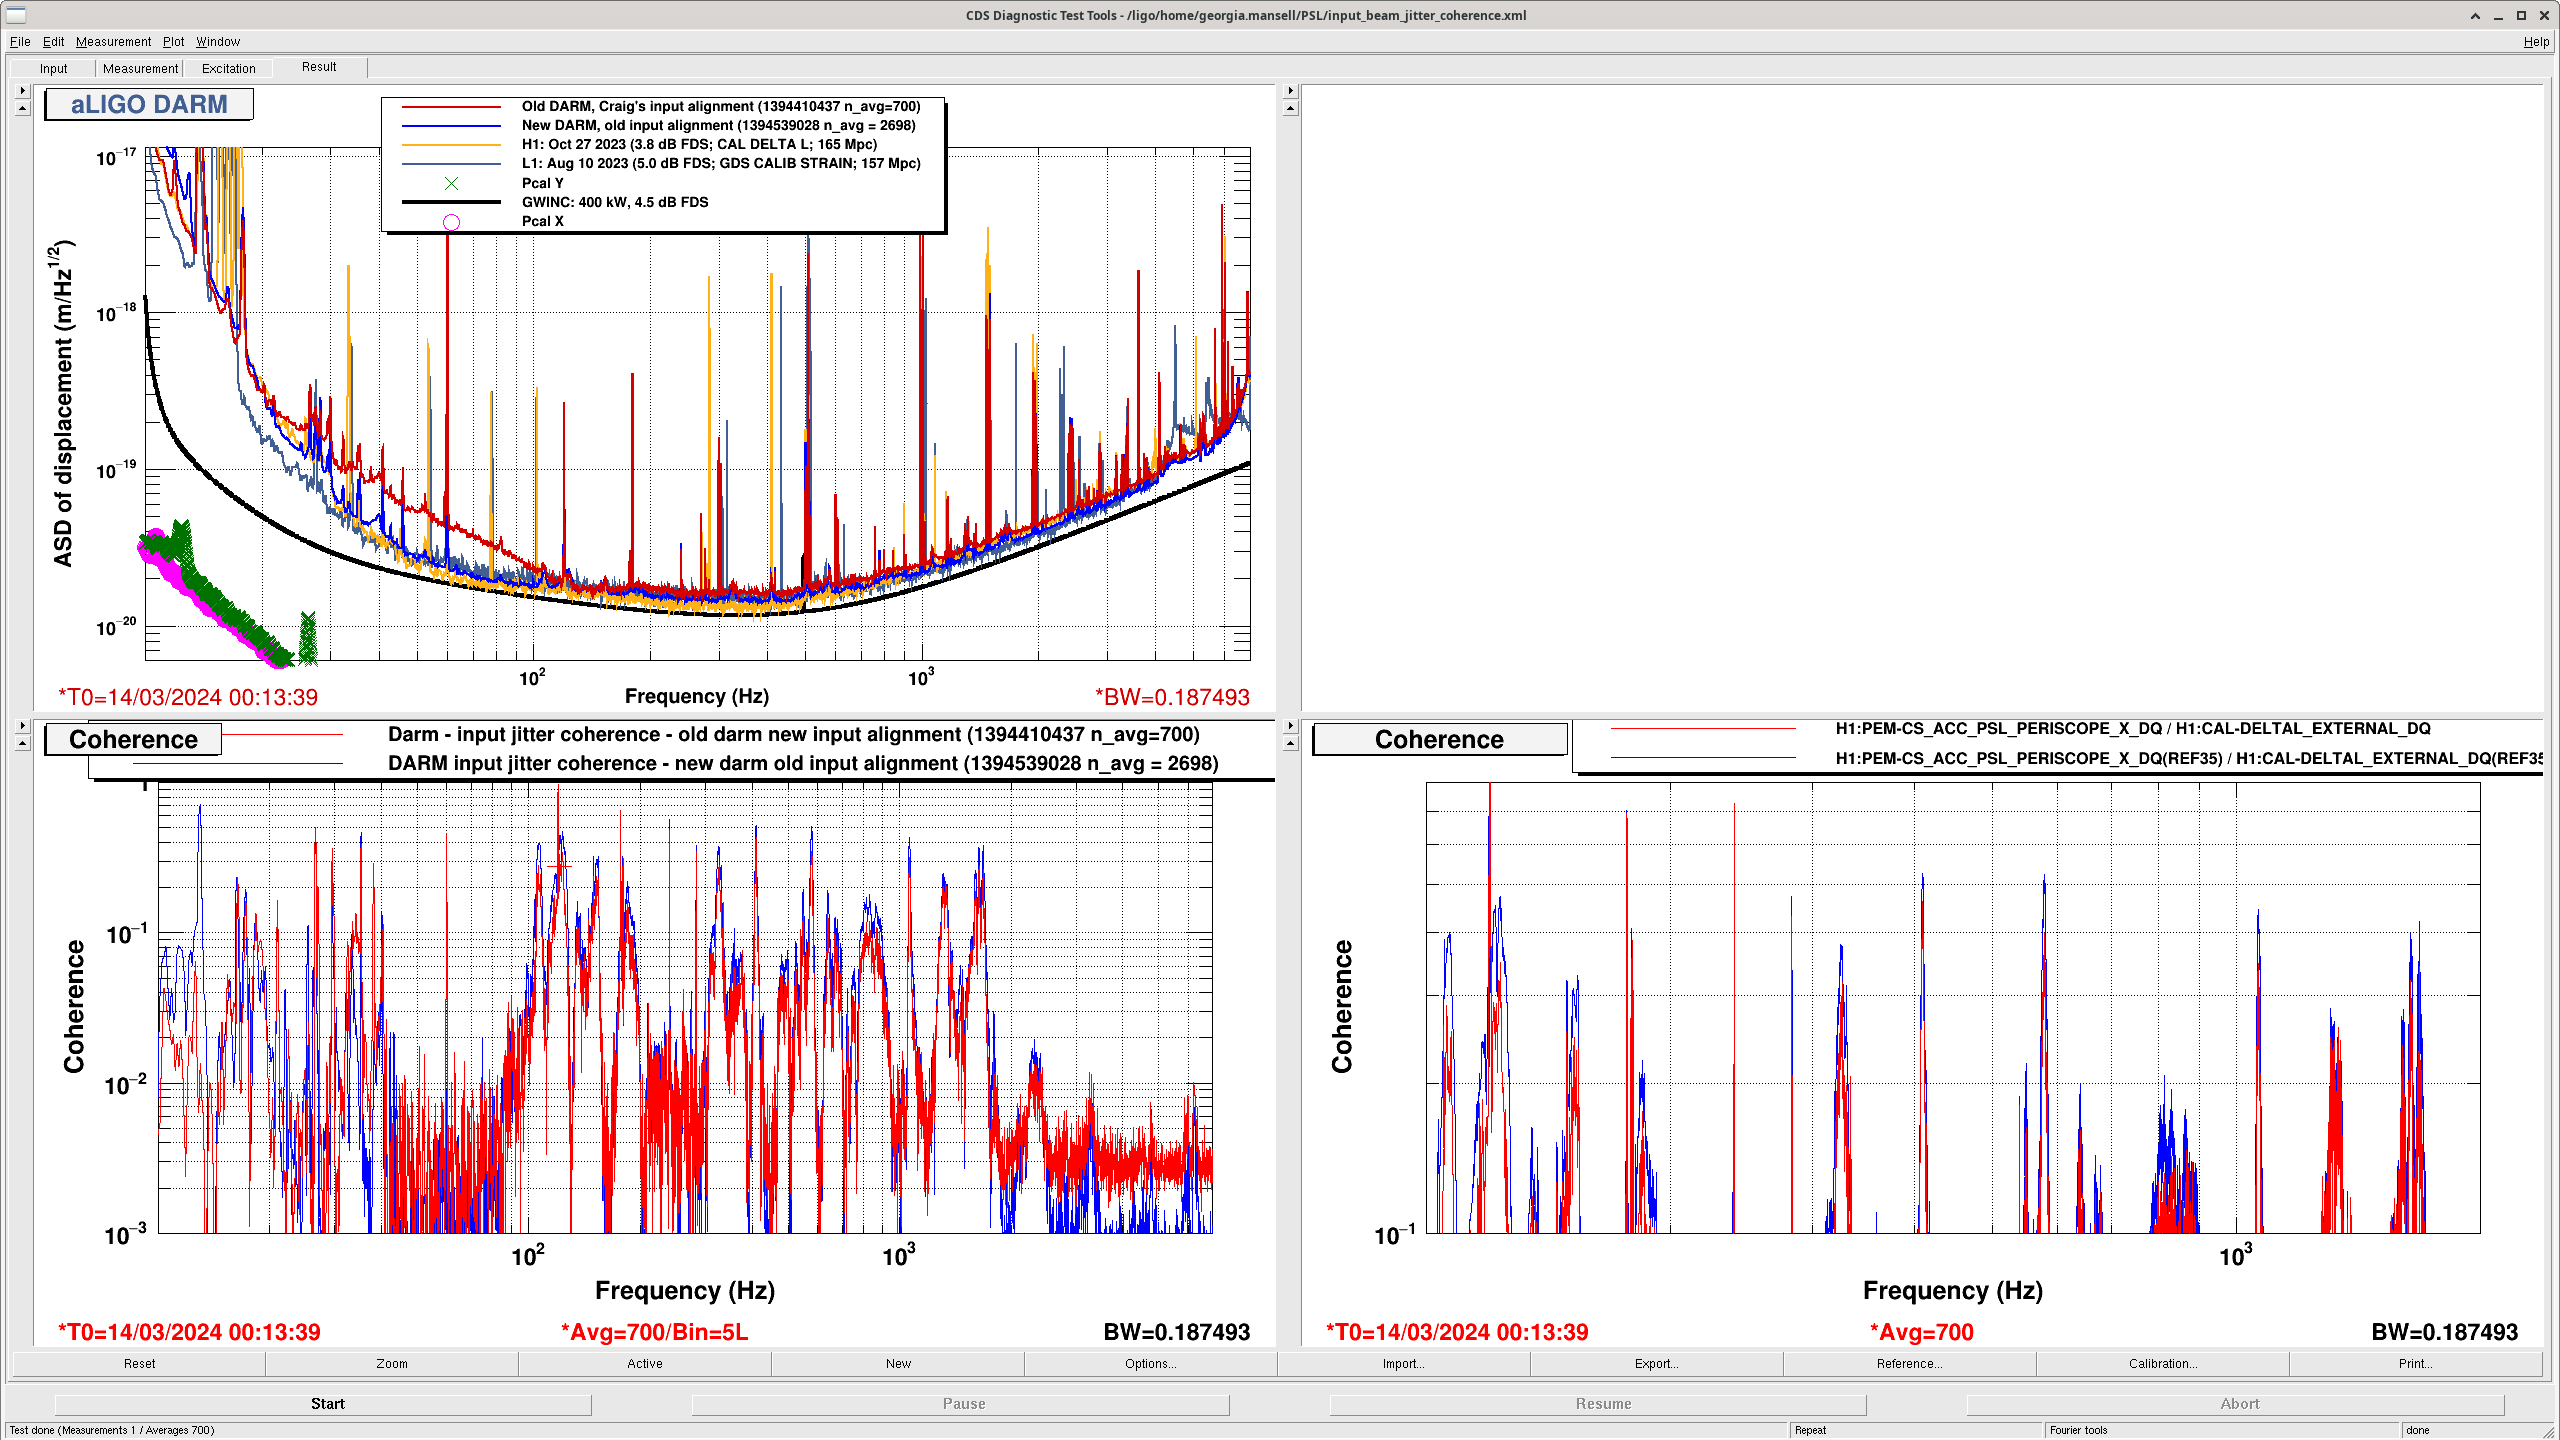
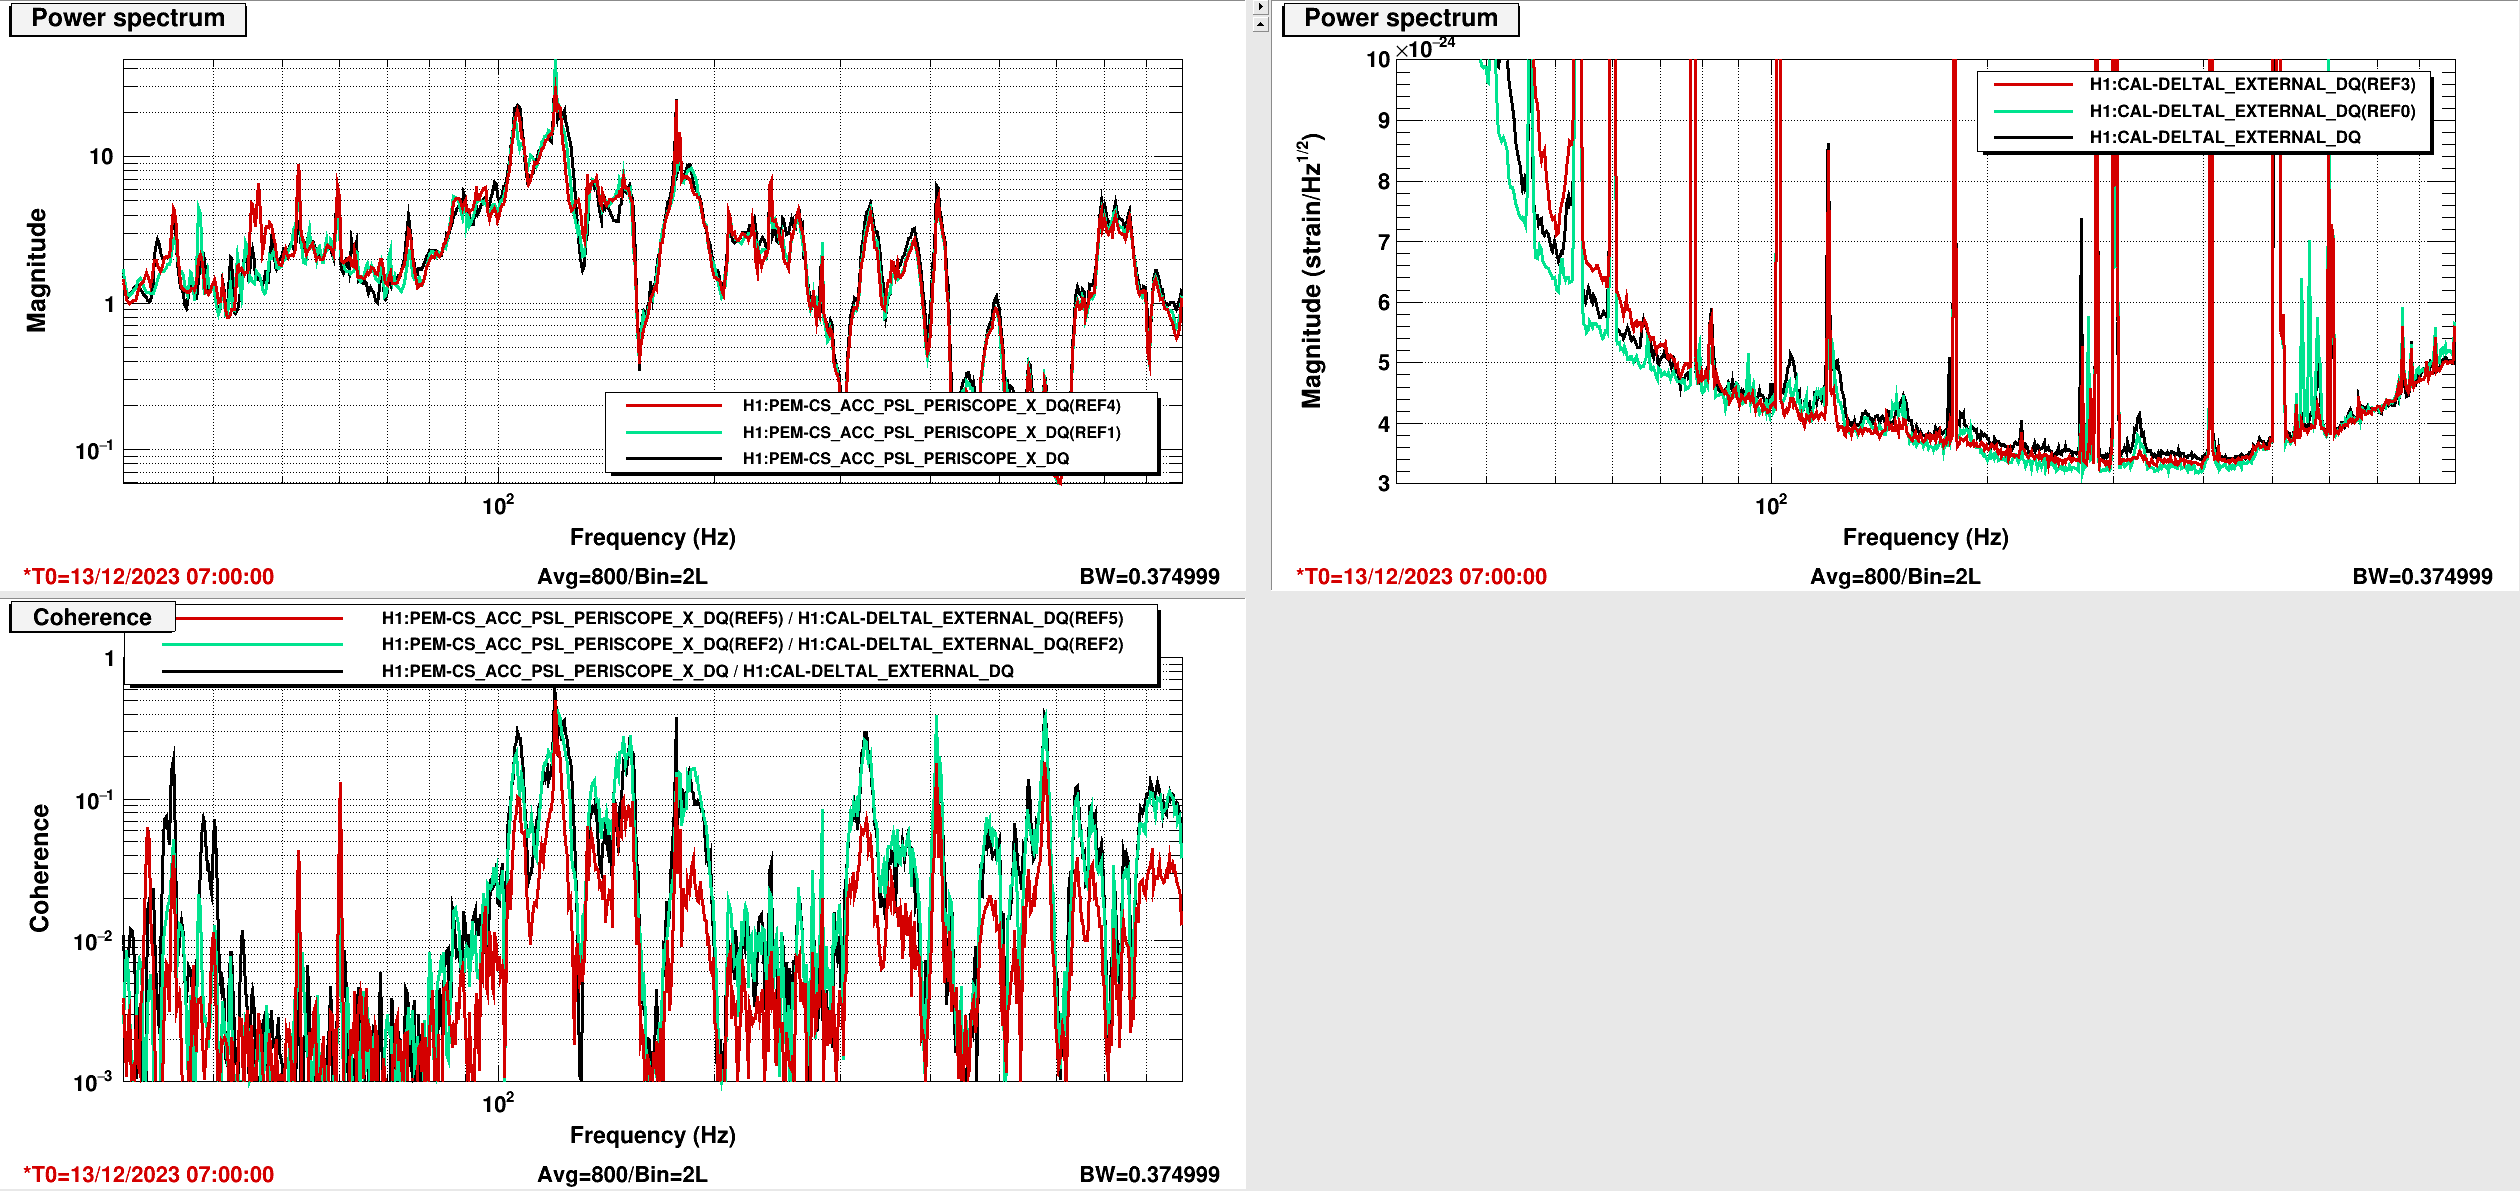
We were curious if the coherence between DARM and the PSL periscope accelerometer was improved with Craig's Wednesday night input alignment. Though there wasn't much time without glitches or excitations during this lock, we got a 700 averages with 75% overlap bw 0.1Hz. In the attached plot, top is DARM ASD, bottom is coherence with the PSL periscope accelerometer (witness sensor for jitter), and right plot is zoomed in on some of the jitter peaks. It looks pretty convincing that for the resonances above 100Hz, the coherence was lower with the new input (and full IFO) alignment on Wendesday.
According to some of the sensors in HAM2 and HAM3, we might have walked the input pointing further in PIT than the O4A alignment, so maybe there is an IM1 and IM3 alignment somewhere in between the two times in the attached plot that has even lower input jitter coherence.
Attachment shows DARM × PSL acceleration coherence on 13 Dec (red), 11 Jan (turquoise), and 16 Mar (black). There is no significant difference between the latter two.
OM2 was hot on 13 Dec and cold on the latter two.
[Louis, Gabriele]
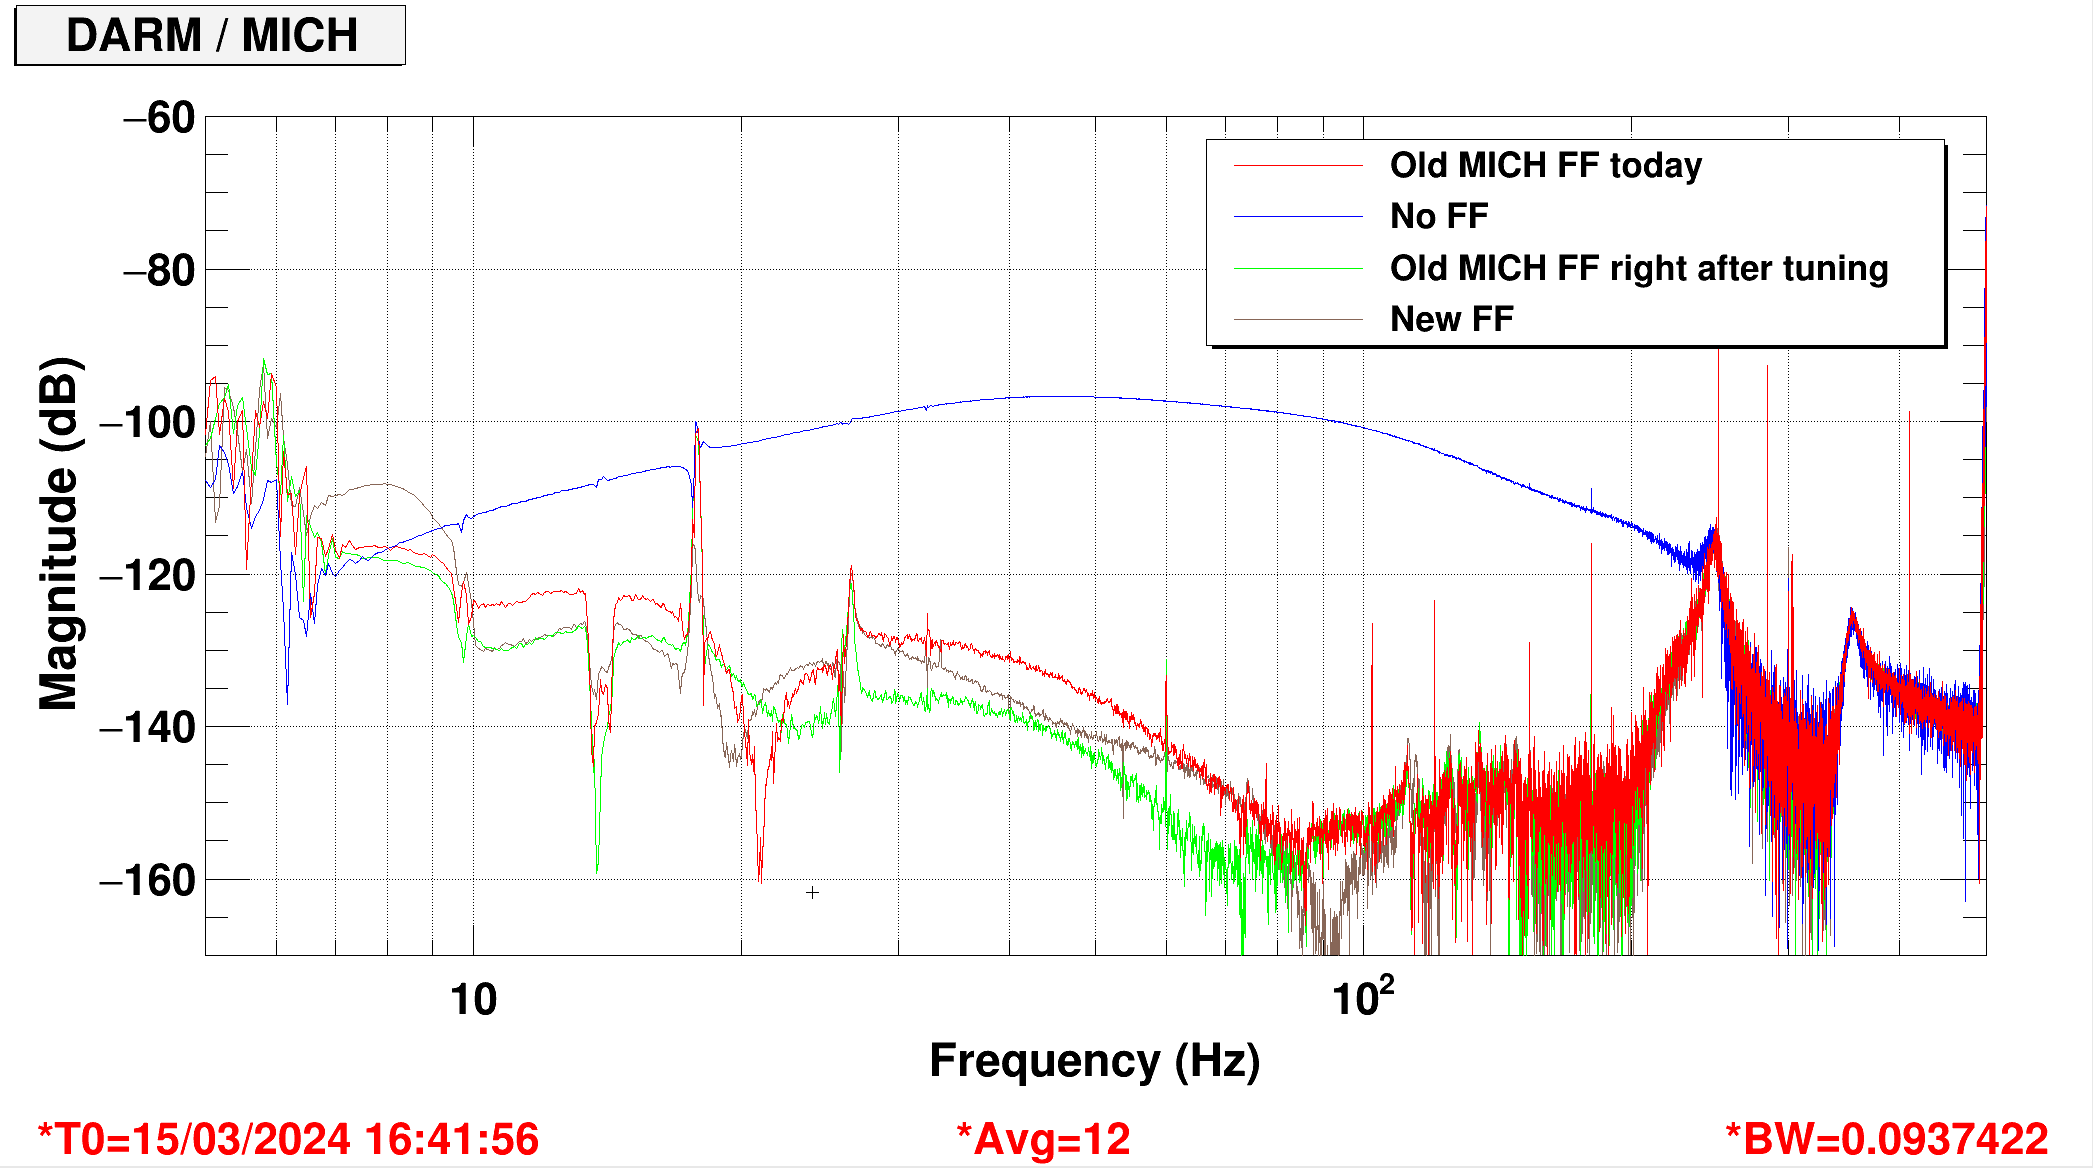
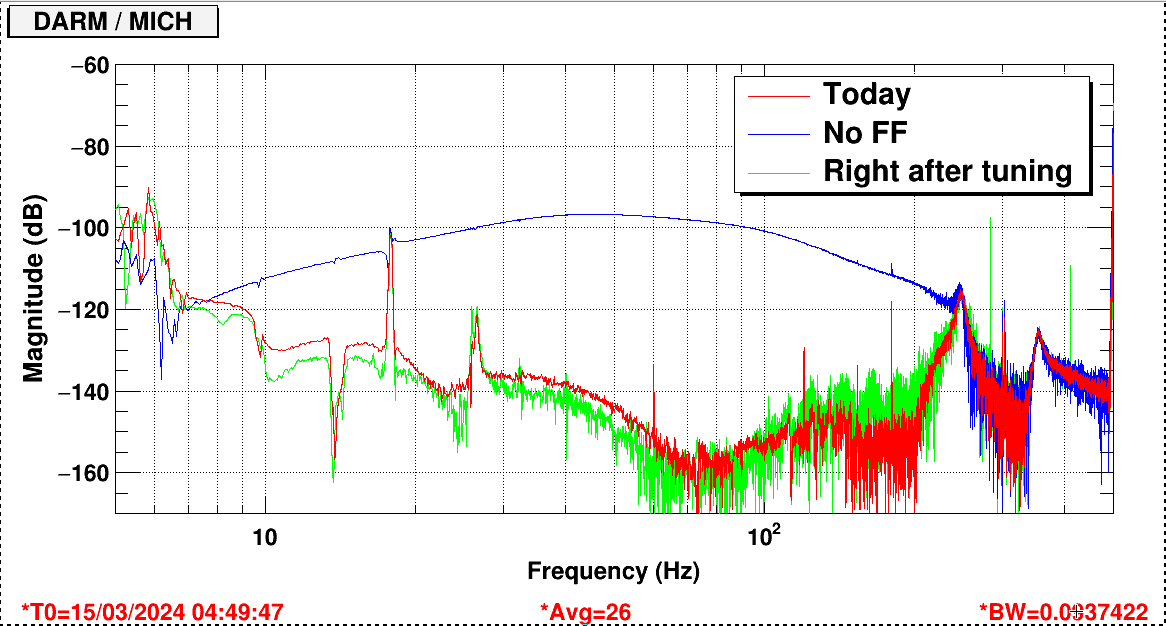
We did again the noise injections for retuning the MICH FF, analysis and fit will follow tomorrow.
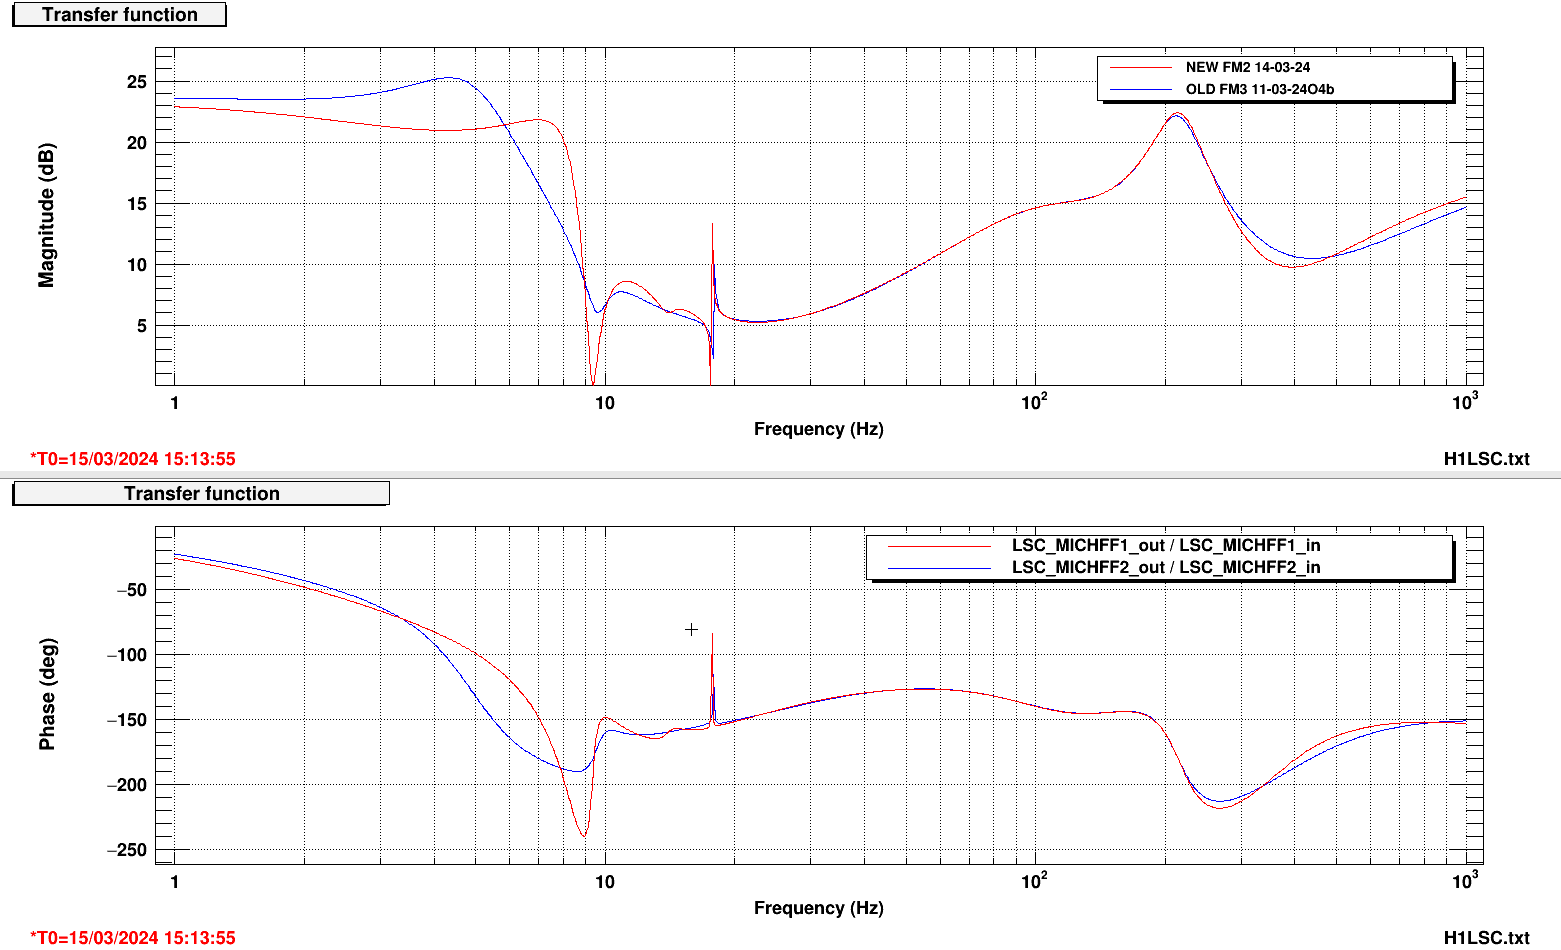
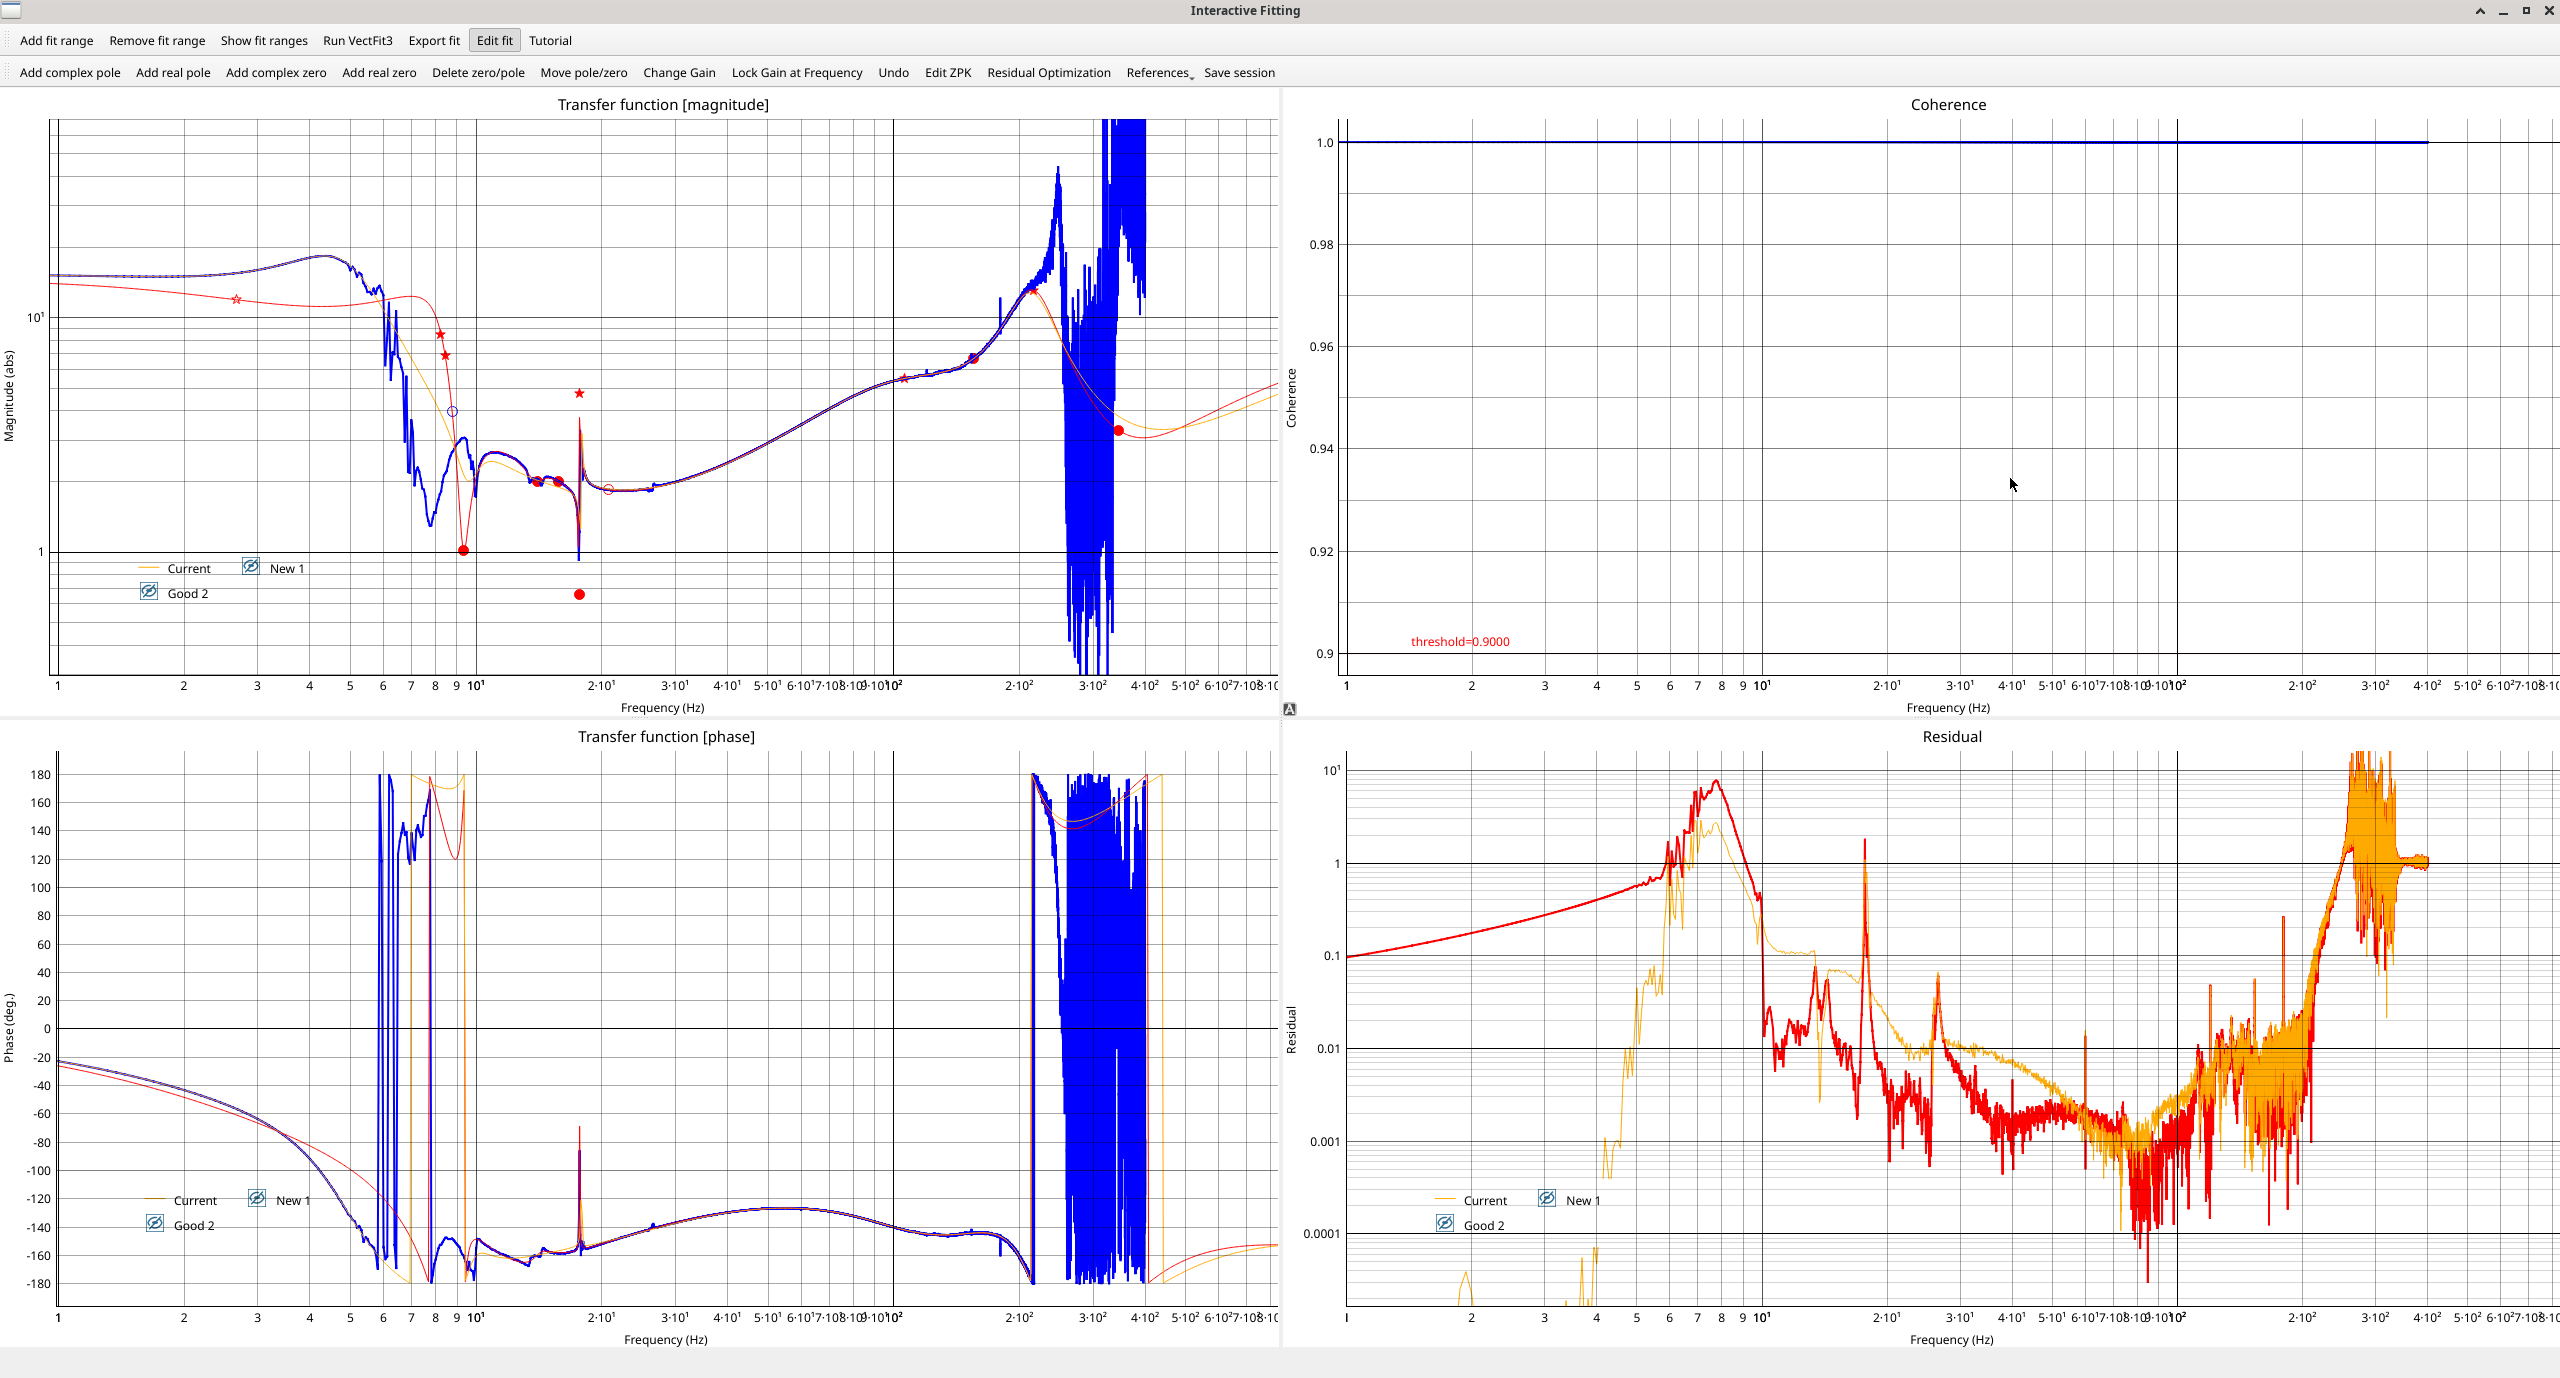
New fit done, loaded into FM2, not tested yet.
We tested the new FF, and it didn't perform as well as expected. However
We therefore used the measurement to fit another MICH FF, we'll test it soon
Gabriele created two new filters in FM1 and FM2 to try out in DARM. Currently, we are using FM3. I ran an injection using the current filter, and then for each of Gabriele's new filters. Overall, if we want the most suppression 10-20 Hz, we should go with the current, FM3. If we want to do better 20-40 Hz, we can choose one of the new filters. FM2 is worse from 40-70 Hz, but I'm not sure how much that matters. FM1 will inject a few dB more noise than the others from 7-10 Hz, again, not sure how much that matters. I am staying with FM3 pending some evaluation.
[Louis, Gabriele]
The DHARD_Y to DARM coupling always showed two regimes: a steep coupling below 20-30 Hz, and a flatter coupling above 20-30 Hz. We've been able to change the flatter coupling above 20-30 Hz by changing the ITMT Y2L coefficient.
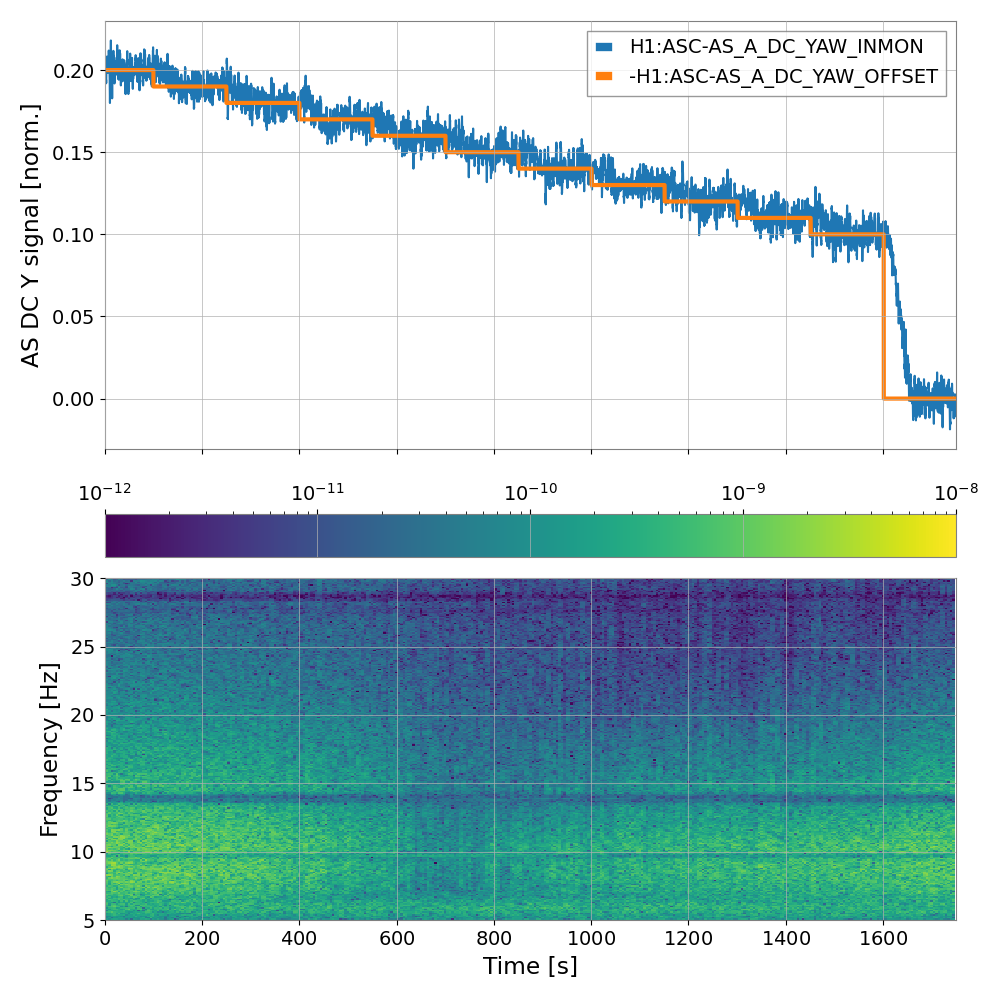
Today we confirmed a suspicion: the steep low frequency coupling is due to length to angle coupling at the AS WFS. We changed the beam position on the WFS by adding an offset to the WFS centering (H1:ASC-AS_A_DC_YAW_OFFSET) and saw a change in the DHARD_Y to DARM coupling.
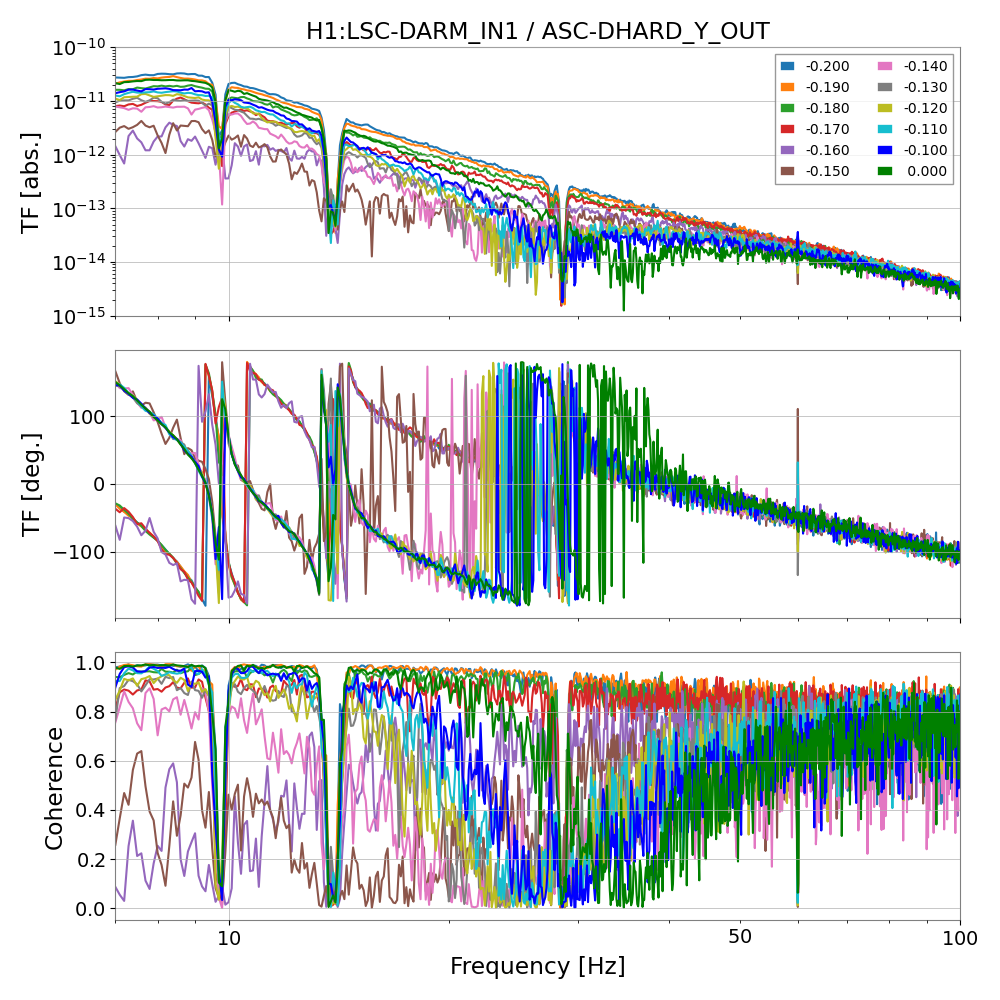
A value close to -0.14 gives the minimum coupling below 20 Hz. we now have two independent knobs to minimize the DHARD_Y to DARM coupling at all frequencies.
Incidentally, the higher frequency couping is now lower than yesterday, with the same ITMY Y2L coefficient of -1.65
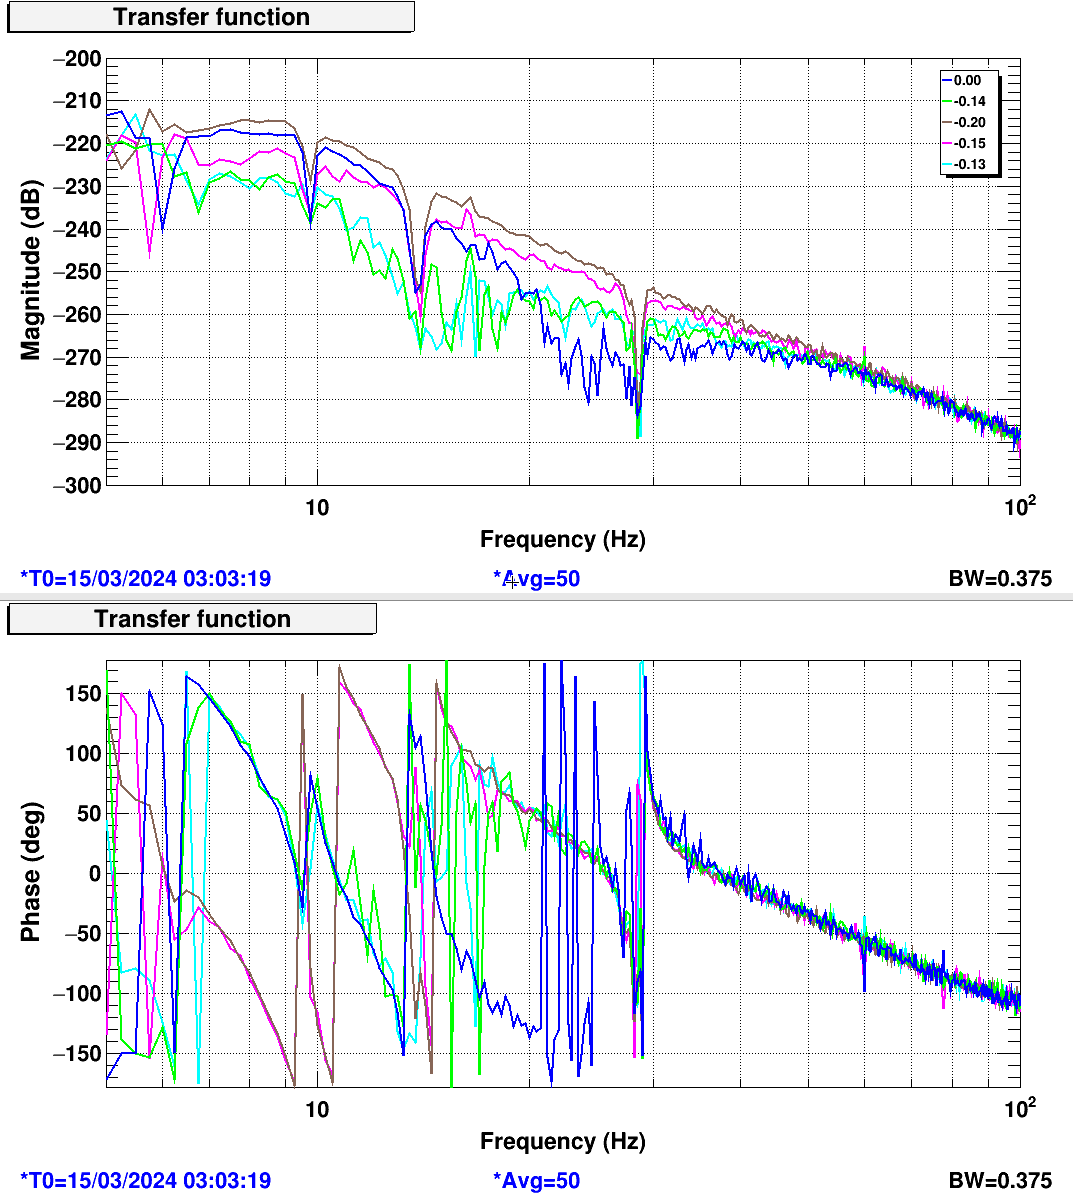
We did a scan of the AS_A_WFS Y centering from -0.2 to -0.1 in steps of 0.01, an analysis will follow tomorrow:
-0.200: 1394510627 - 1394510727
-0.190: 1394510777 - 1394510877
-0.180: 1394510927 - 1394511027
-0.170: 1394511077 - 1394511177
-0.160: 1394511227 - 1394511327
-0.150: 1394511377 - 1394511477
-0.140: 1394511527 - 1394511627
-0.130: 1394511677 - 1394511777
-0.120: 1394511827 - 1394511928
-0.110: 1394511978 - 1394512078
-0.100: 1394512128 - 1394512228
0.000: 1394512278 - 1394512378
We are leaving a value of -0.14 in the WFS offset
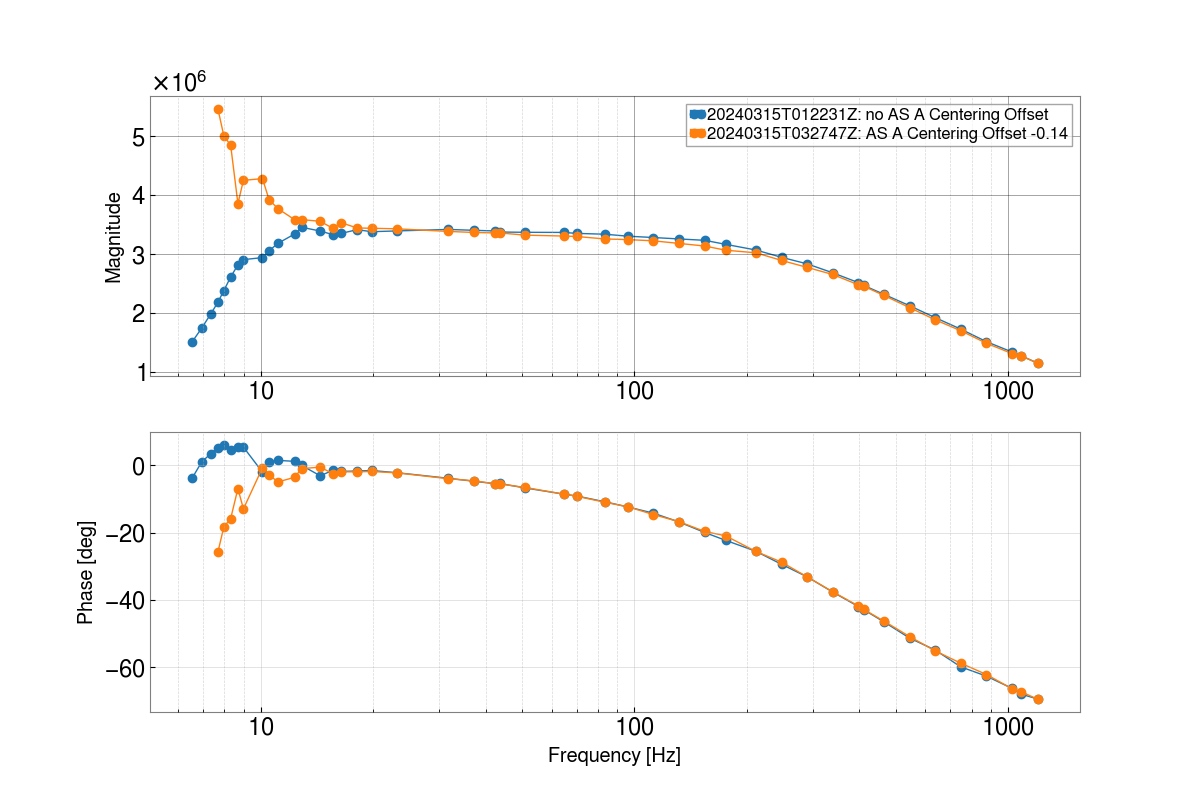
Attached is a comparison of the DARM sensing function with no AS A centering offset vs an offset of -0.14. With an AS A centering offset of -0.14, which we found to be the value that results in the minimum amount of coupling to DARM below 20Hz, the sensing function clearly shows optical spring-like characteristics. This brings to mind a few thoughts: 1. This supports the idea that coupling from the DHARD loop into DARM has a noticeable effect on the structure seen in the sensing function at low frequencies. We've been wondering about this for some time, so it's nice to finally have a direction to point in. 2. We tend to adjust the src detuning by constantly measuring the sensing function and trying to find an SRC offset that results in a flat sensing function at low frequencies. The fact that DHARD also couples with DARM in such a way that it can affect the shape of the sensing function at low frequencies begs the question: could we be in fact further detuning the src while intending to do the opposite due to confusion caused by the dhard coupling effects? 3. I recall being told that sometimes squeezing gets better with some level of detuning. If our only measure of SRC detuning is from measuring and inspecting the sensing function then this measurement hasn't been clean due to the DHARD coupling. lots to think about..
Here's a more detailed analysis of the AS WFC centering steps.
The first plot shows the steps in ASC-AS_A_DC_YAW_OFFSET compared with a DARM spectrogram, during a DHARD_Y injection. The spectrogram shows that there is minimum in the coupling of DHARD_Y to DARM around -0.15 / =0.16.
The second plot shows the transfer function from DHARD_Y to DARM for all values of the offset. A value of -0.15 gives the lowest coherence and the lowest coupling, so that seems to be the optimal value. One can notice how the transfer function phase flips sign as expected when one goes through the minimum coupling.
Changing the AS_A centering offset also moved SR2, SRM and BS.
I tried stepping the REFl WFS A and B DC offsets in yaw similarly to see if the CHARD Y coupling to DARM would change. In summary, I stepped between -0.2 and 0.2 for both WFS and saw no change.
Method: I set a 30 second ramp on the offsets because the DC centering loops are slow. I stepped first in steps of 0.01, and then 0.02. I injected a broadband CHARD Y injection and measured the transfer function to darm between 10-30 Hz. I saw no change in the coupling while I made these steps.
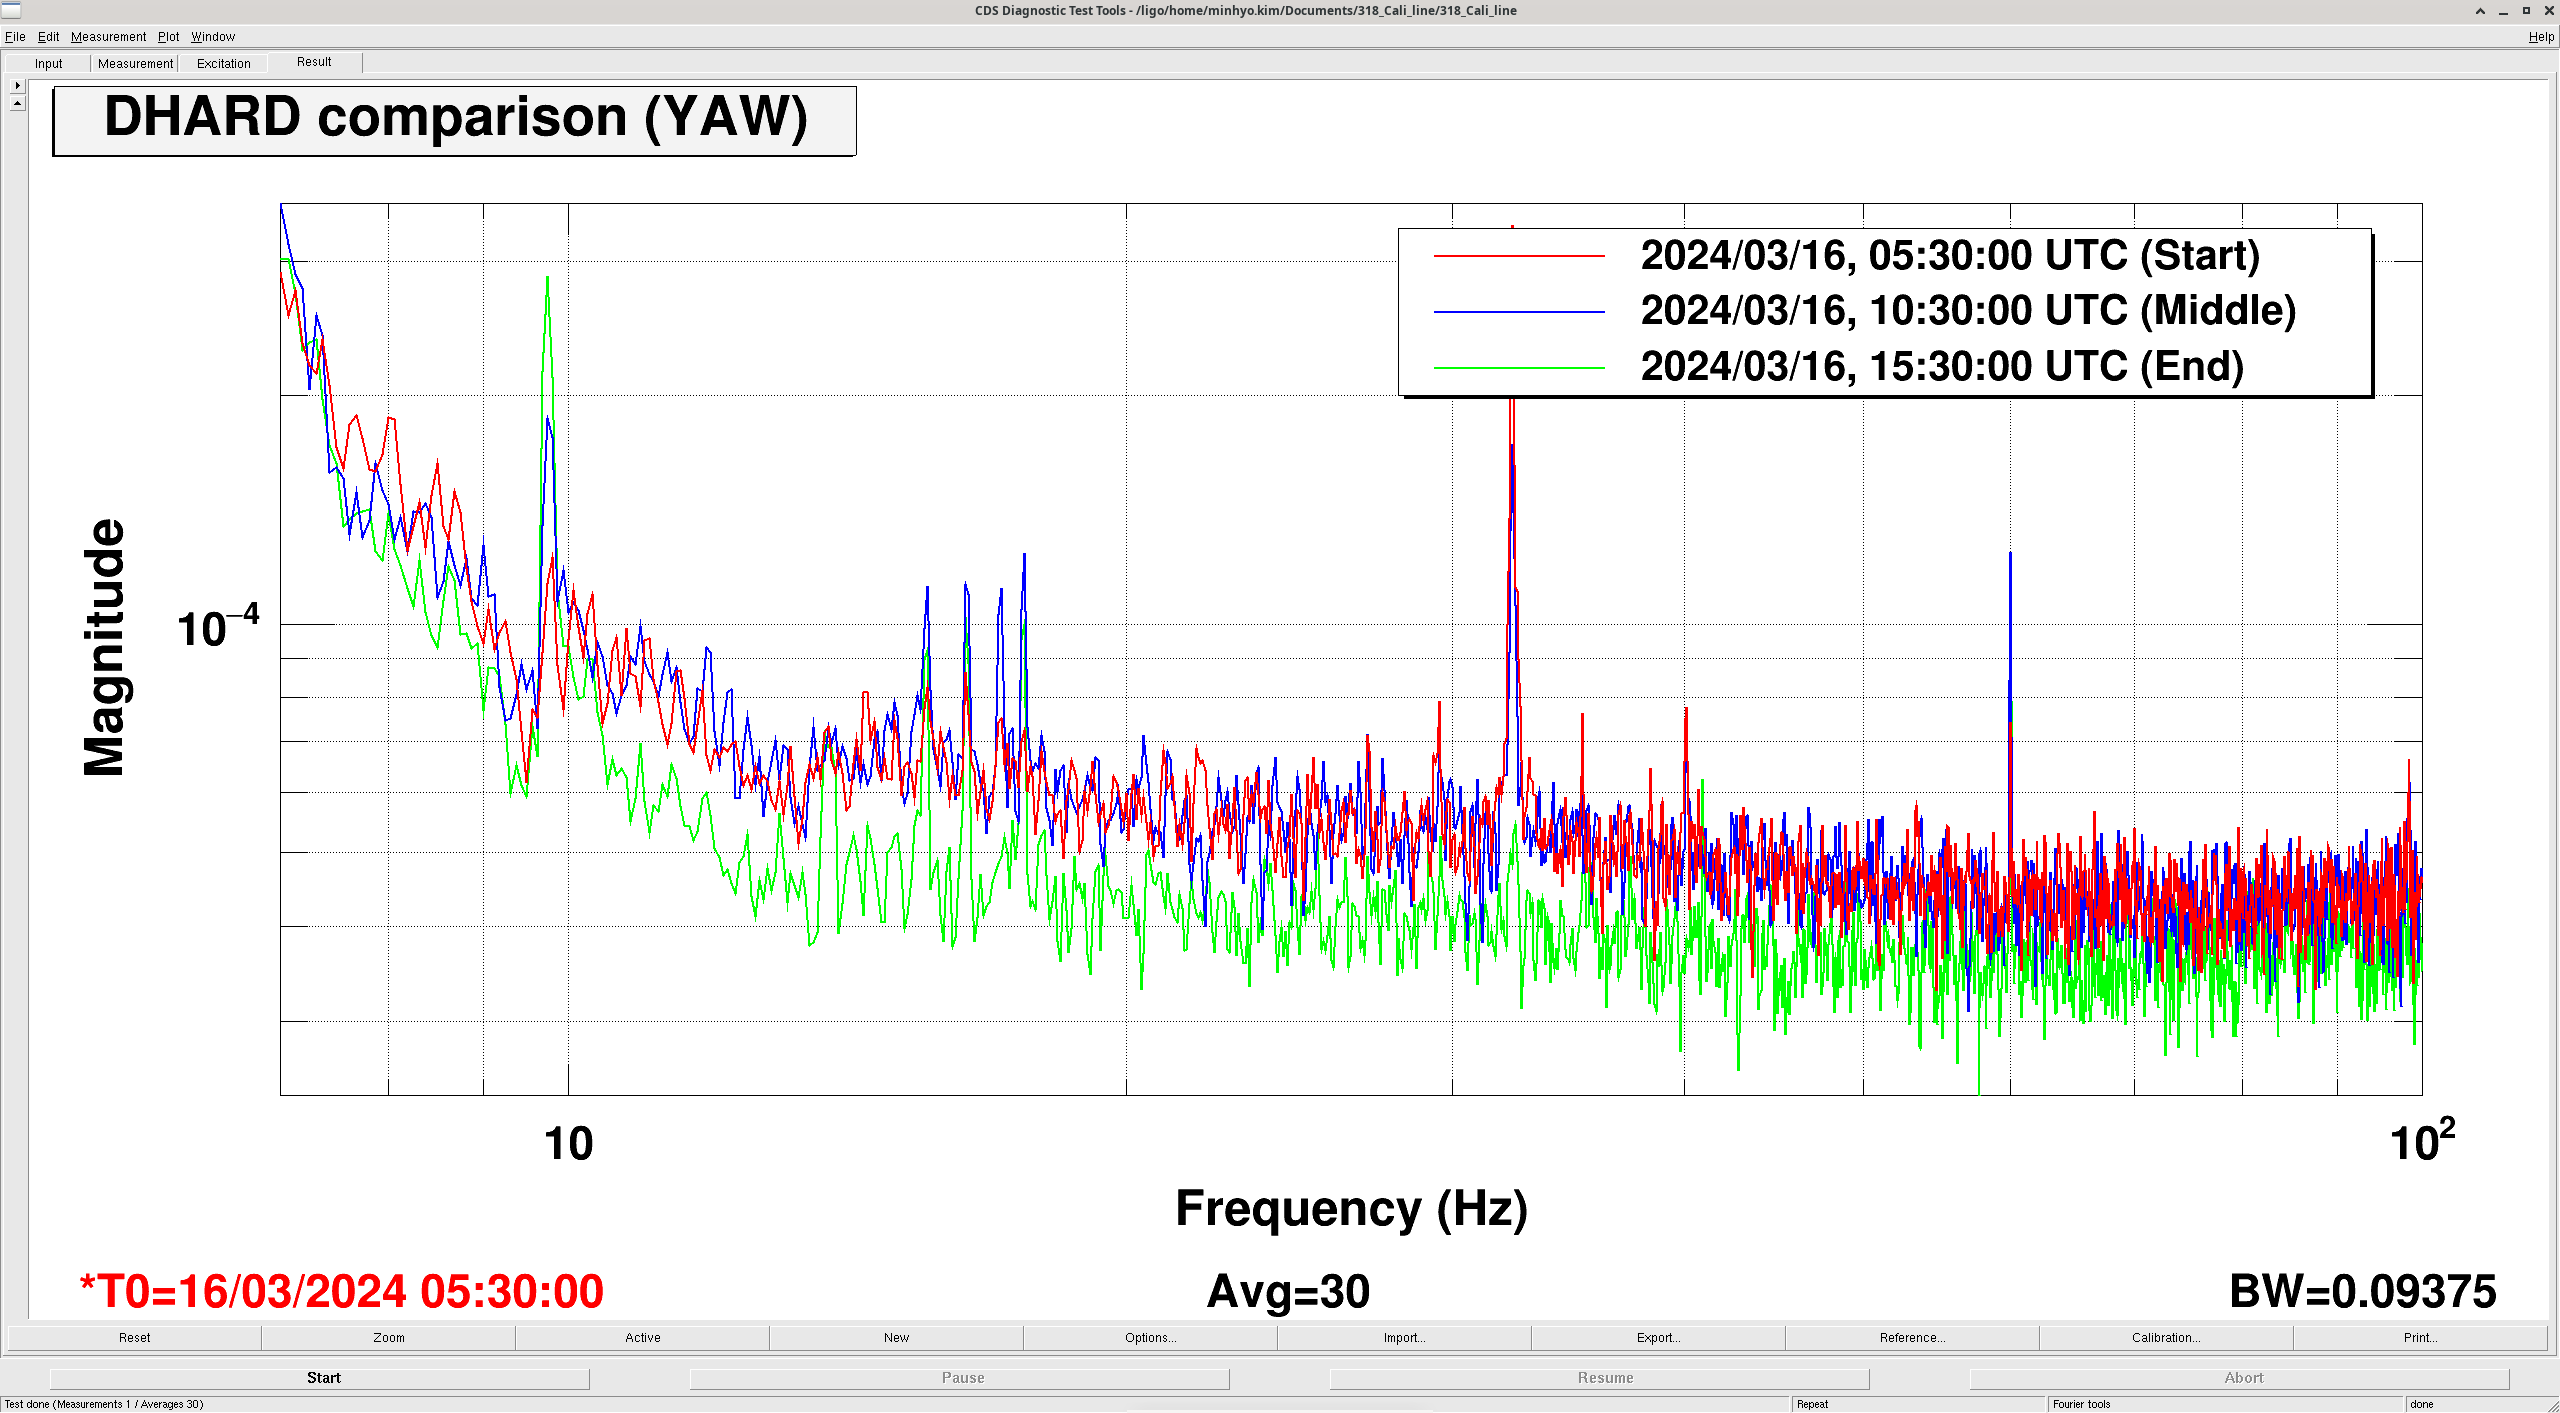
Before checking on the calibration change in DARM and DHARD, I check on the thermalisation effect with the coupling.
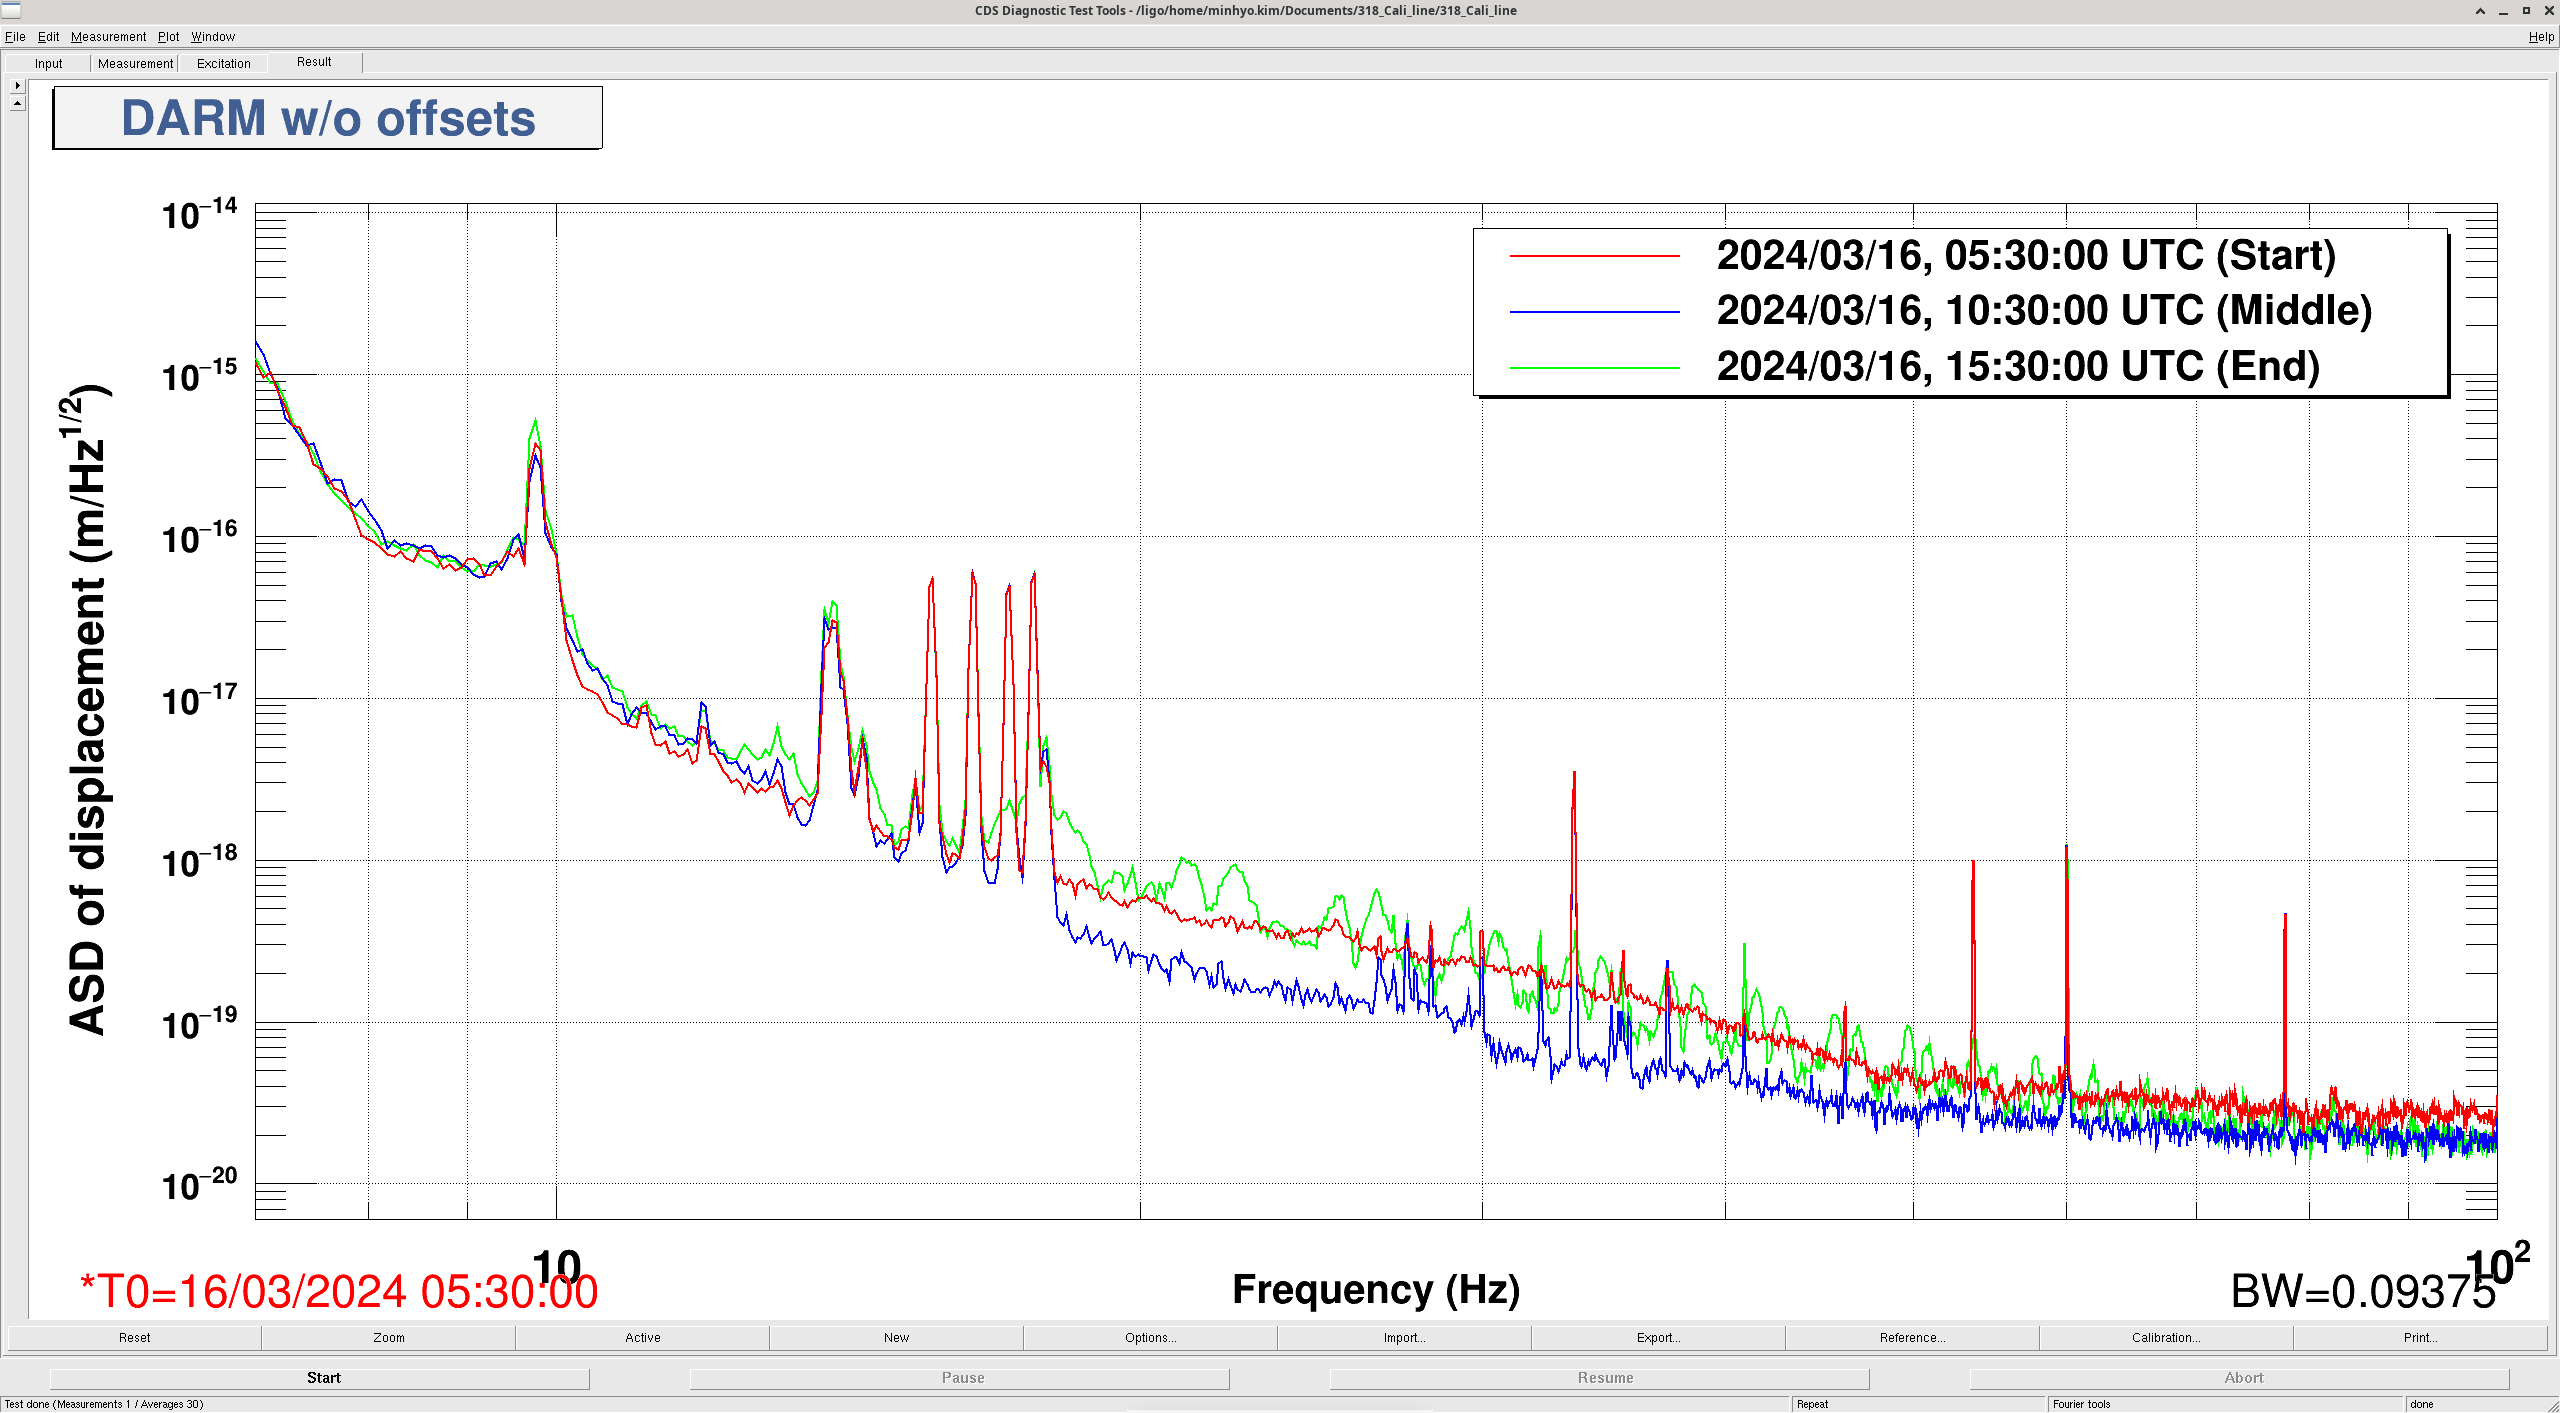
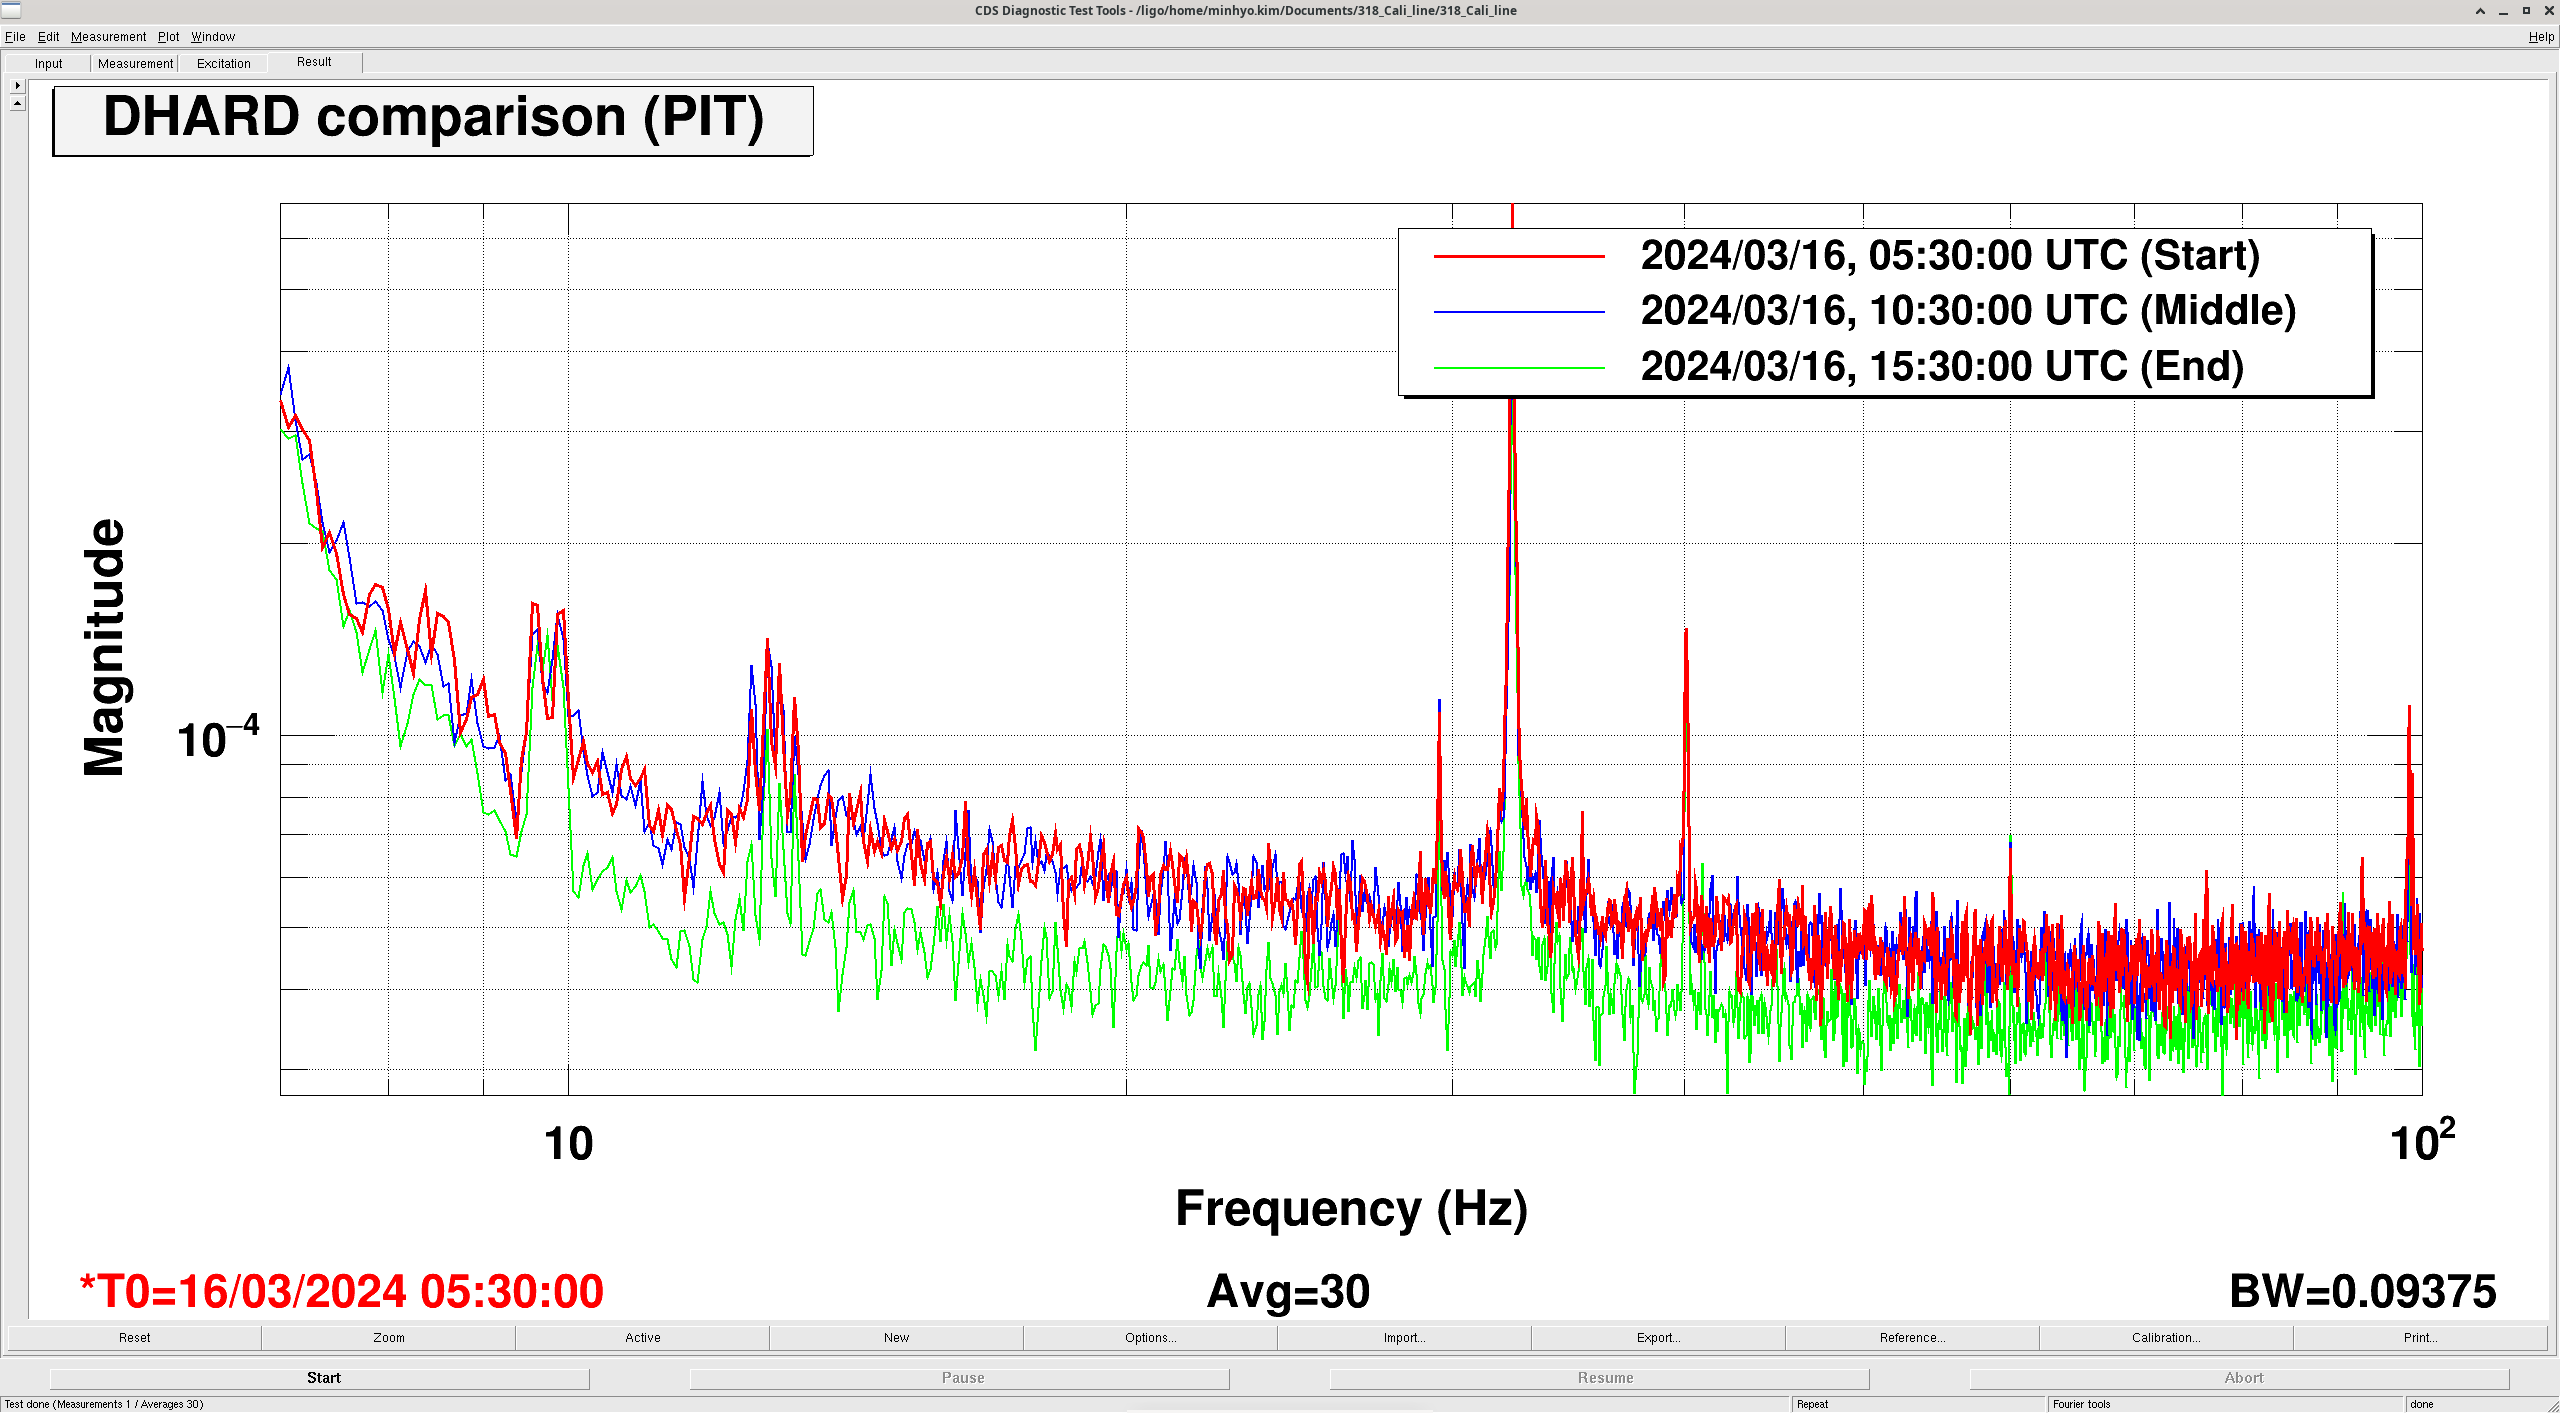
I chose long duration locking time (Mar. 16, 05:30:00 UTC ~ 15:30:00 UTC) without centering offset, and selected start, middle (10:30:00 UTC) and end time within the time window.
Three plots are; 1) DARM, 2) DHARD PIT, 3) DHARD YAW.
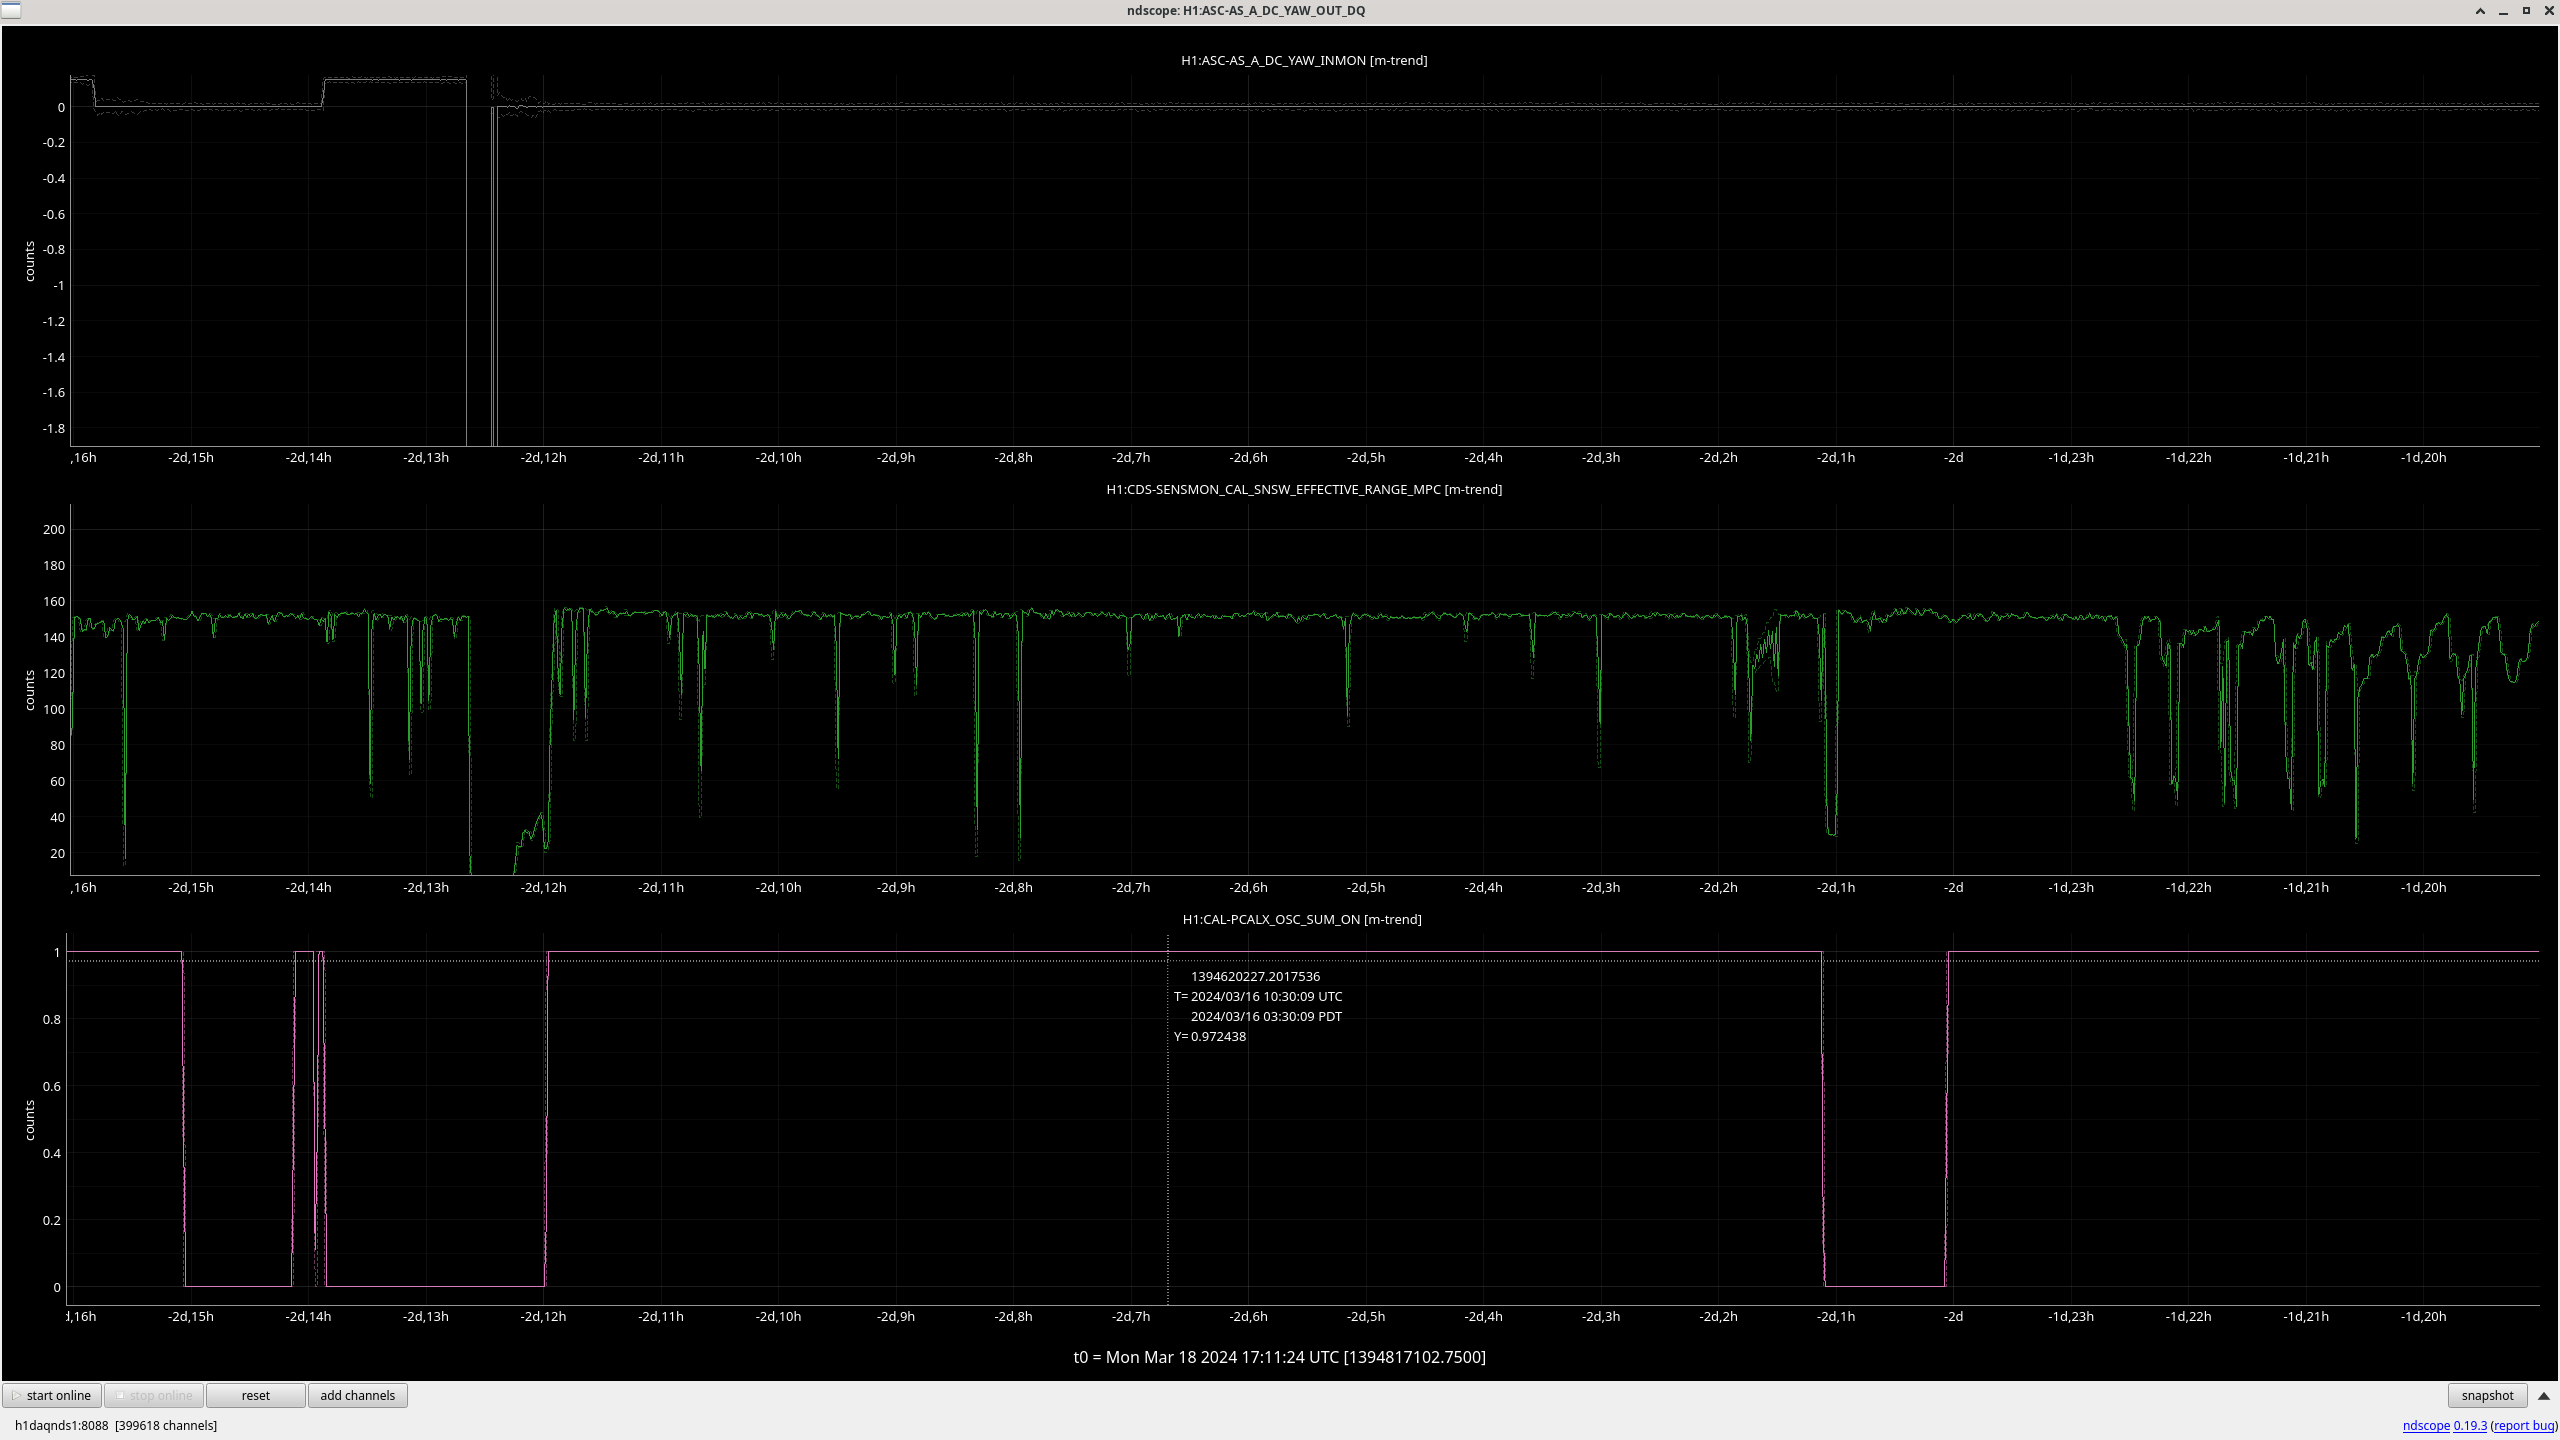
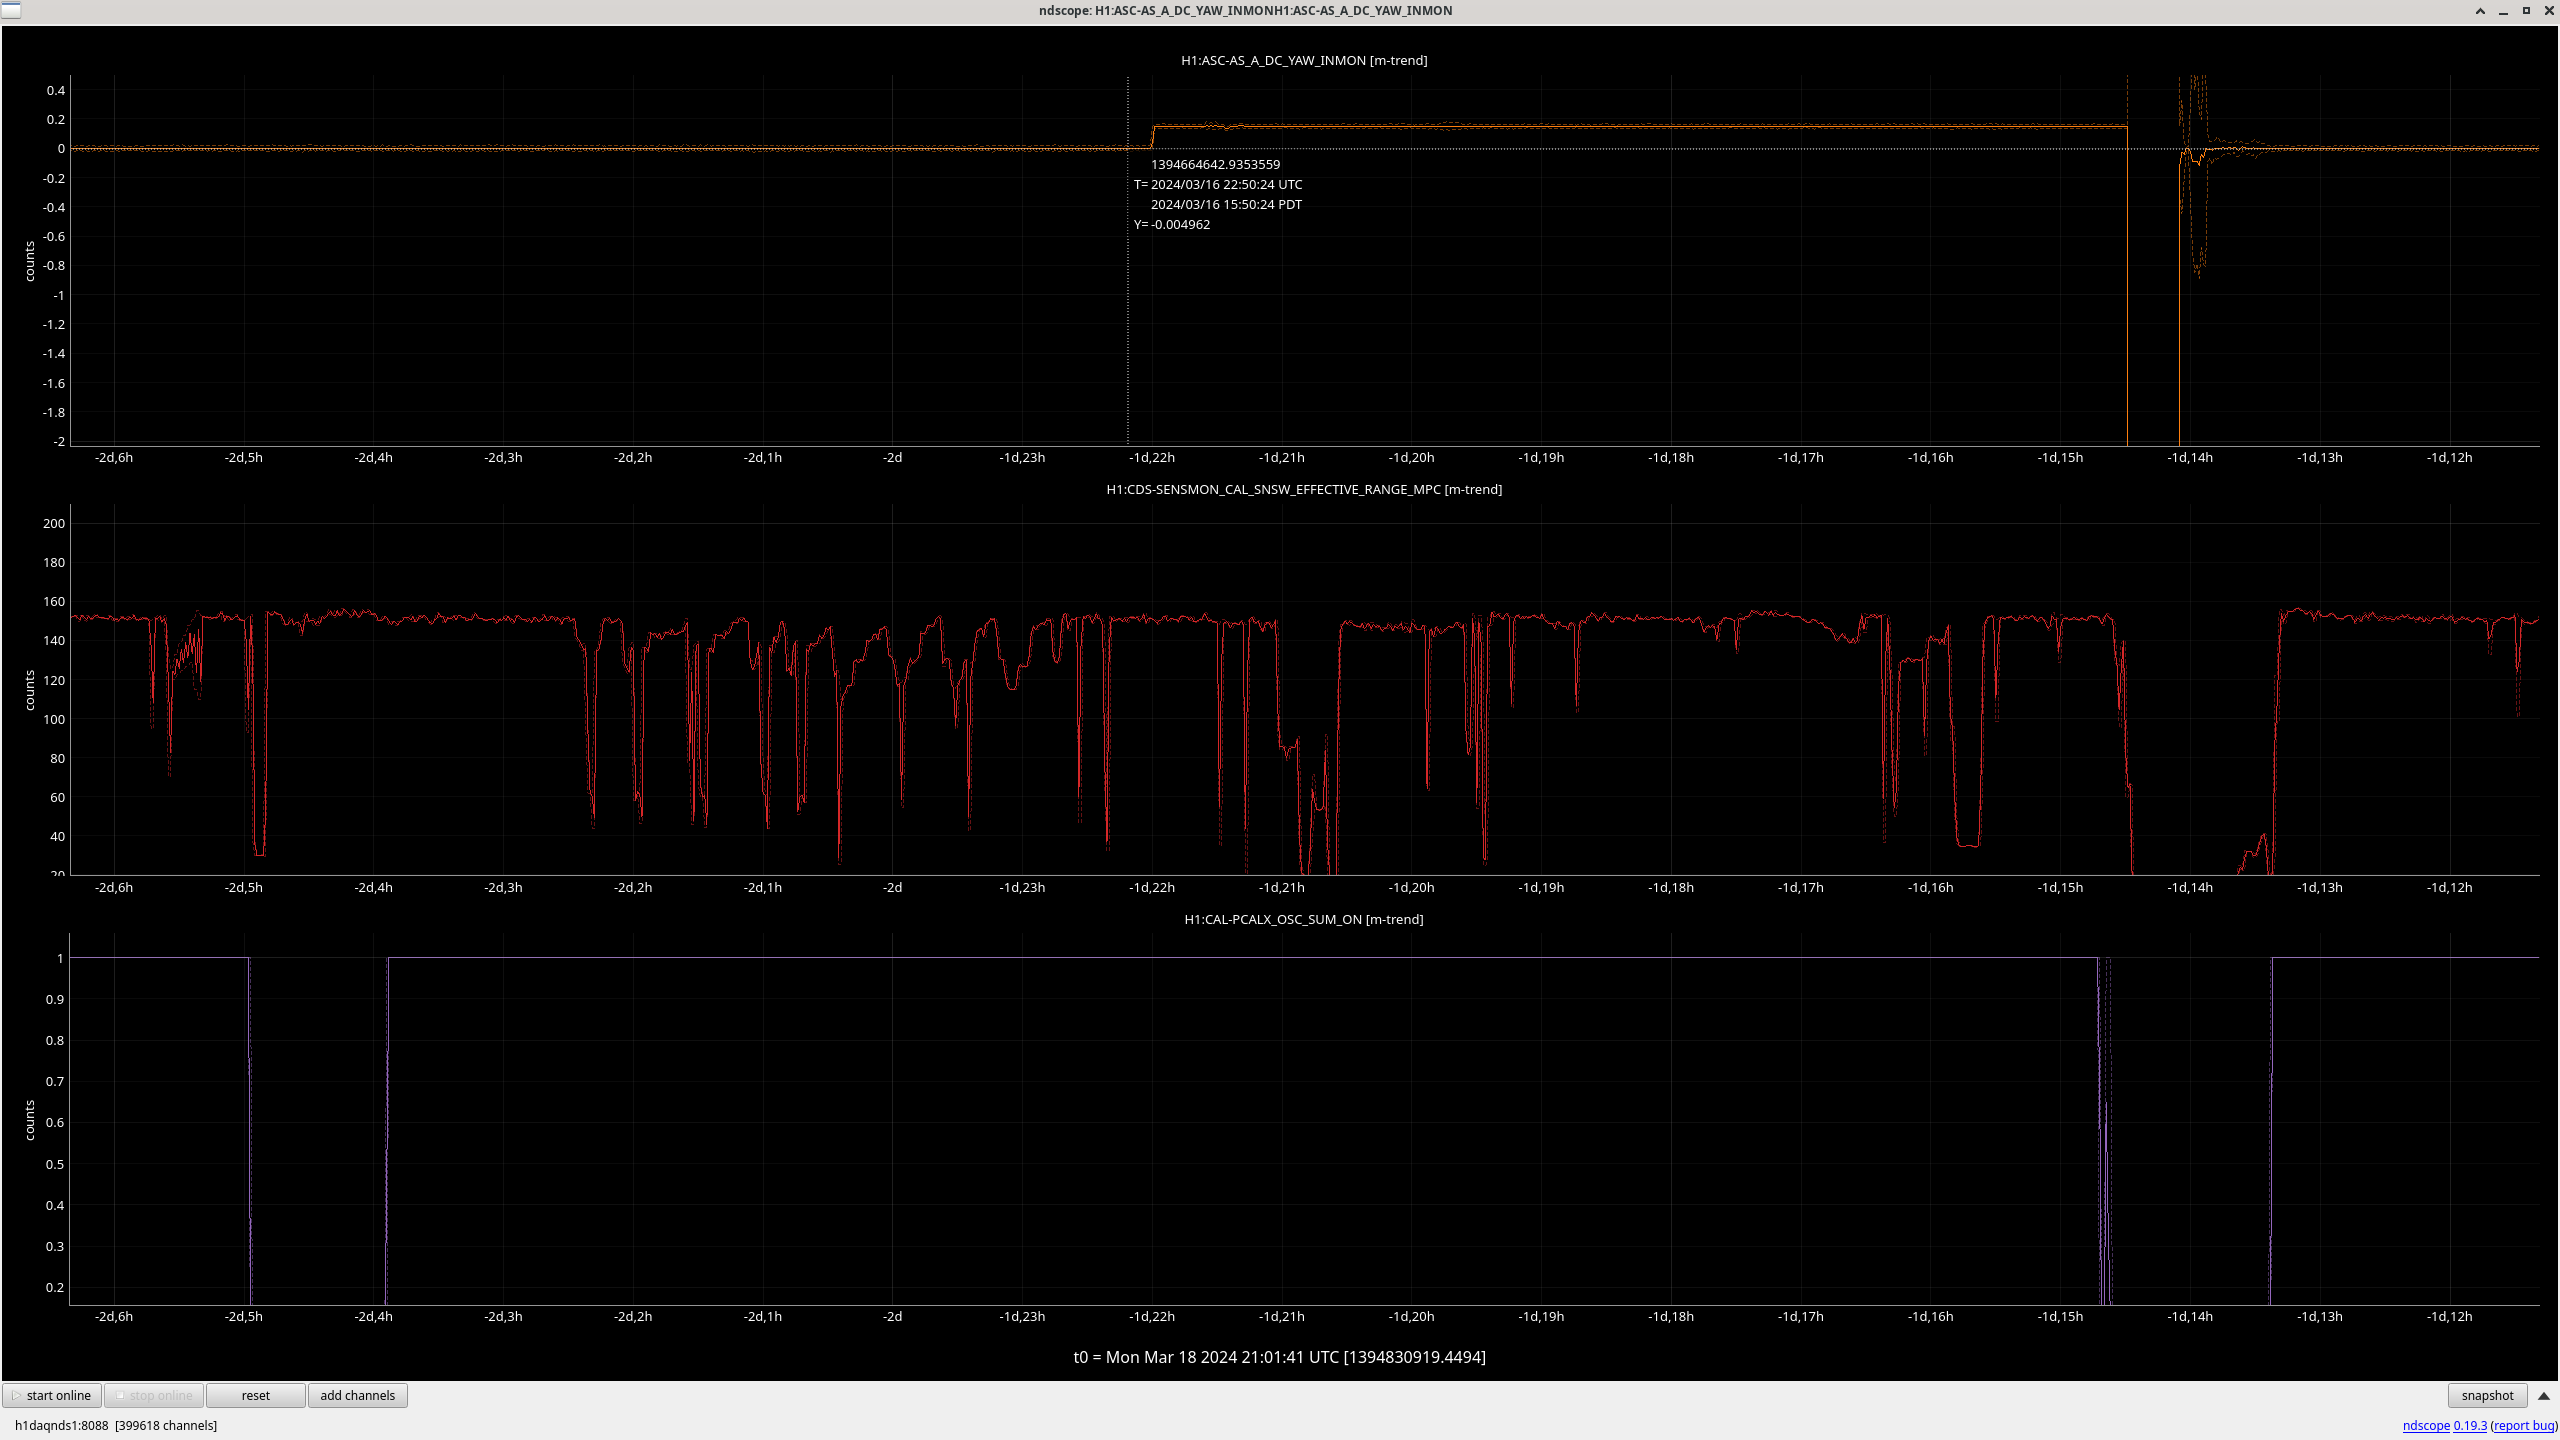
In addition, I included screenshot of ndscope to confirm the time window.
As the 'end' time data in all plots show different trend compare to the other times, it seems that the thermalisation affects DARM and DHARD.
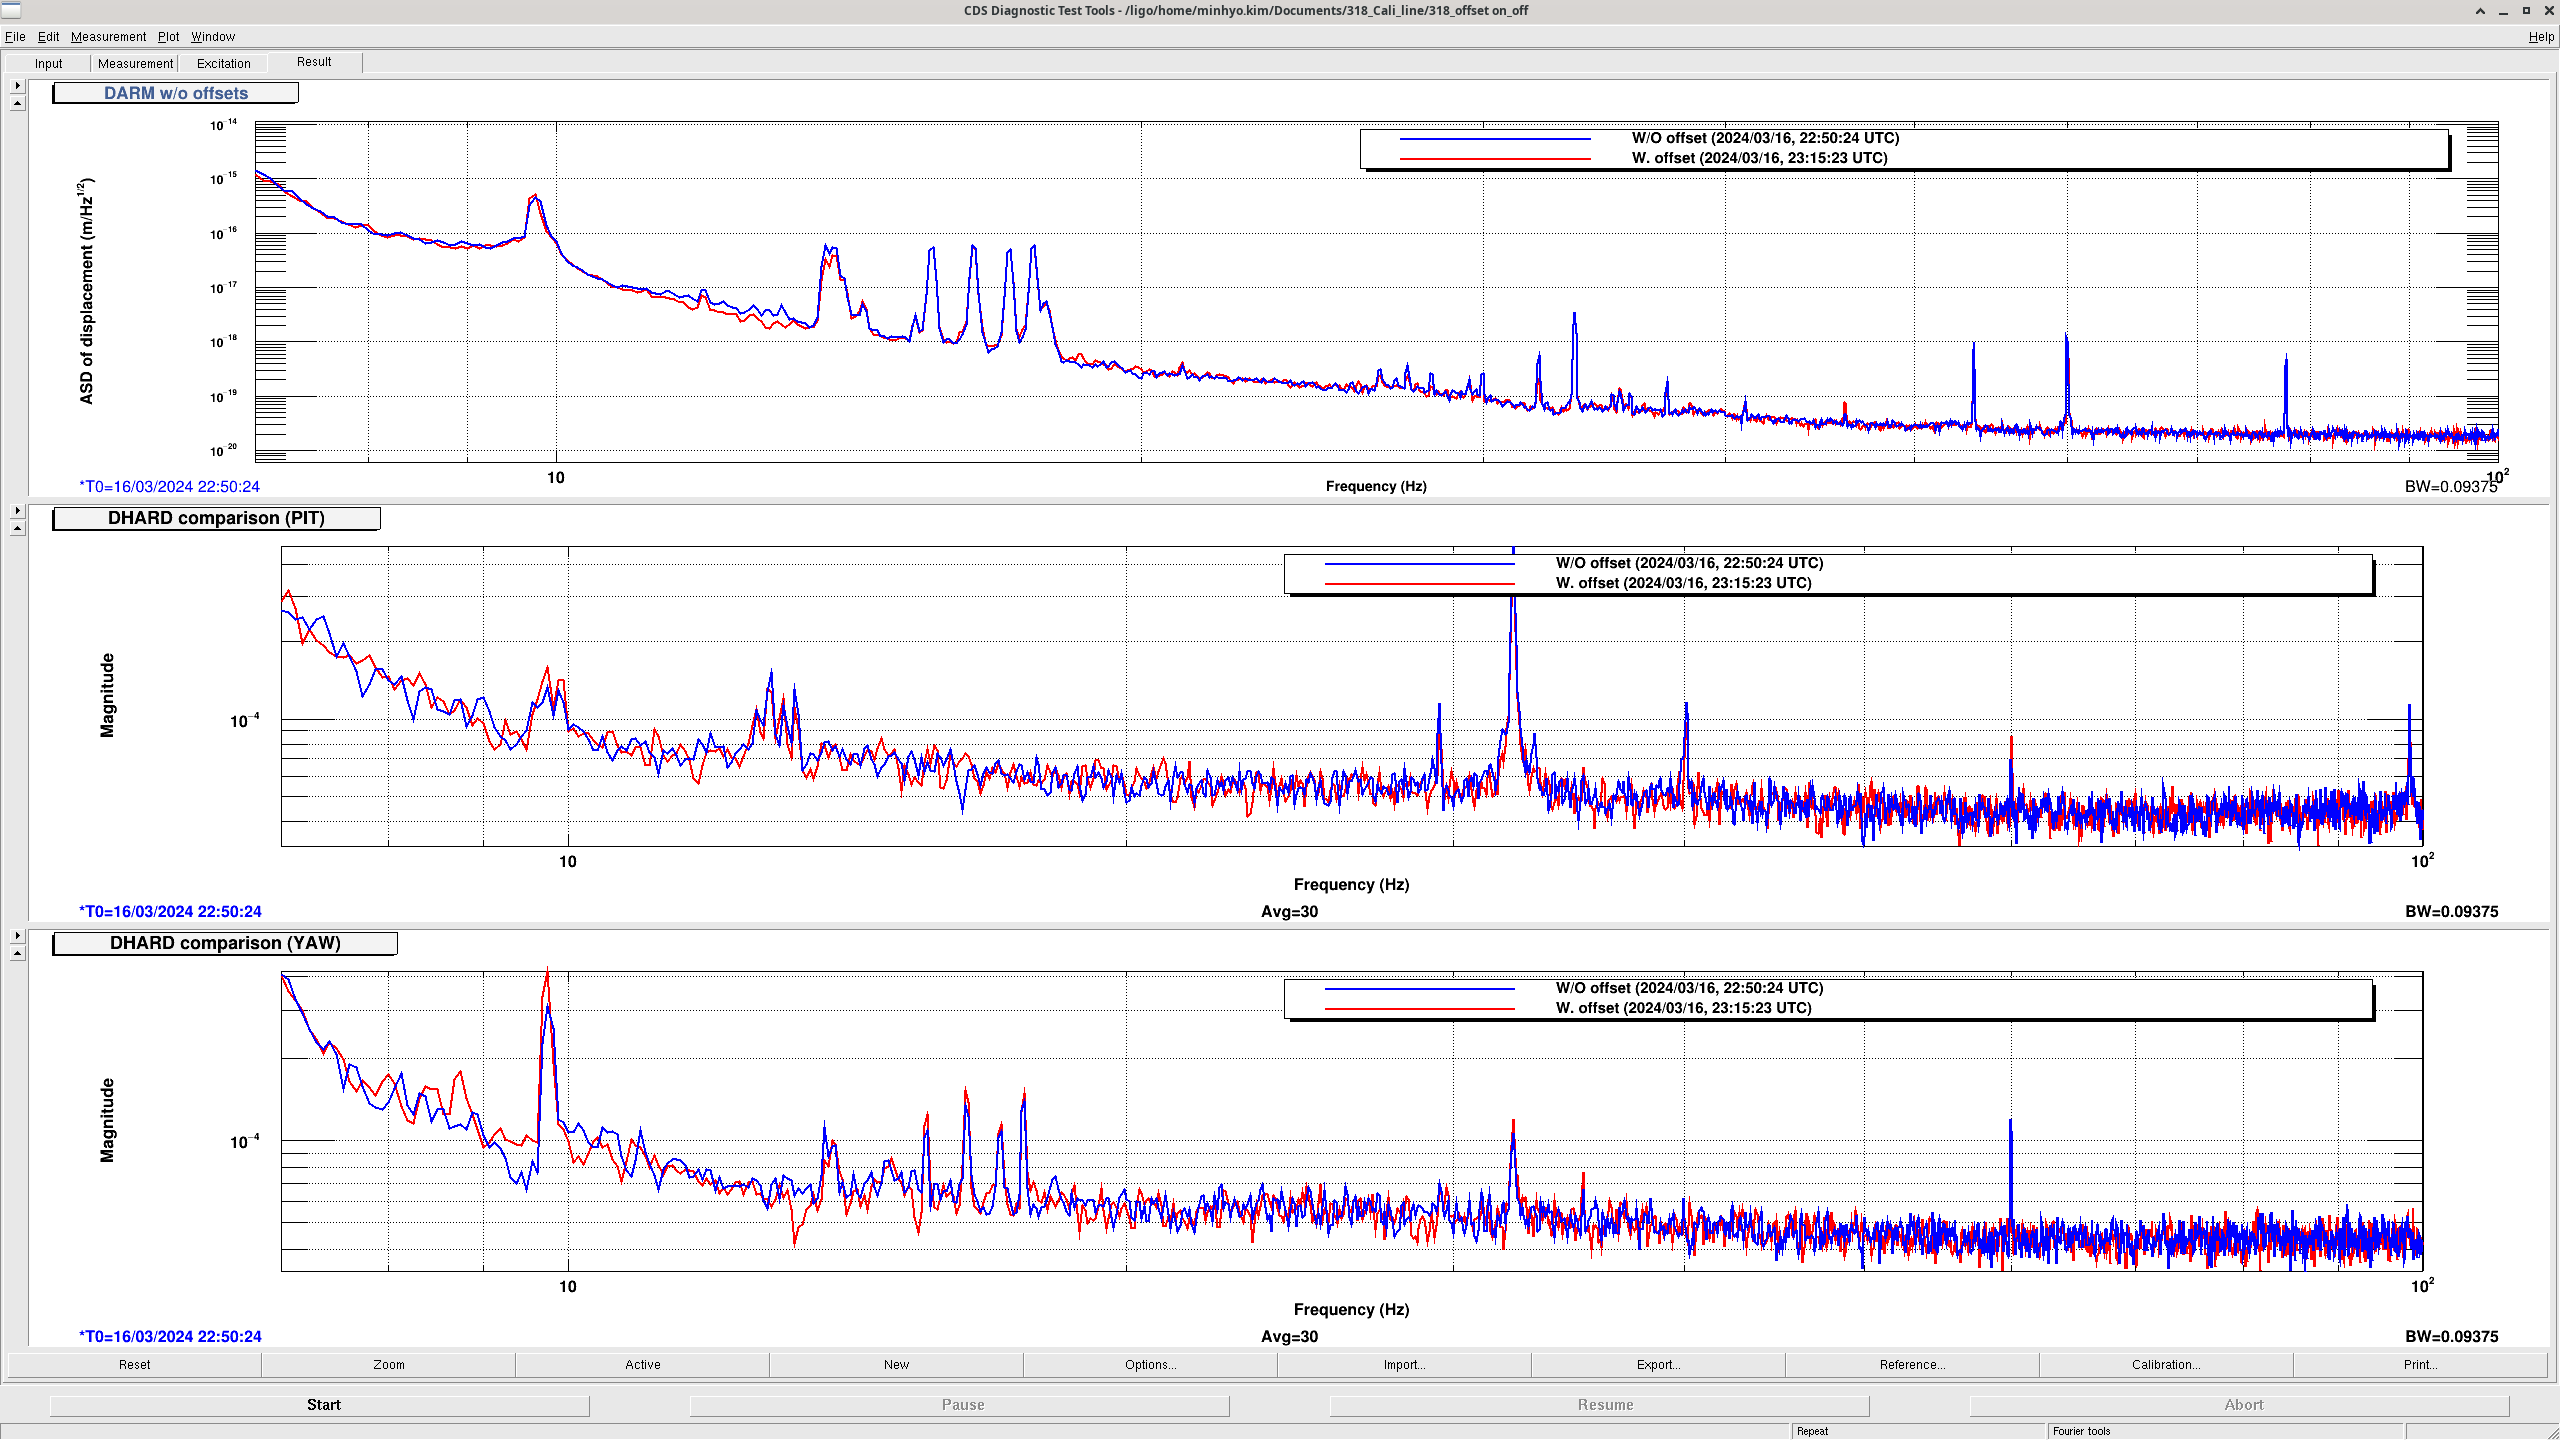
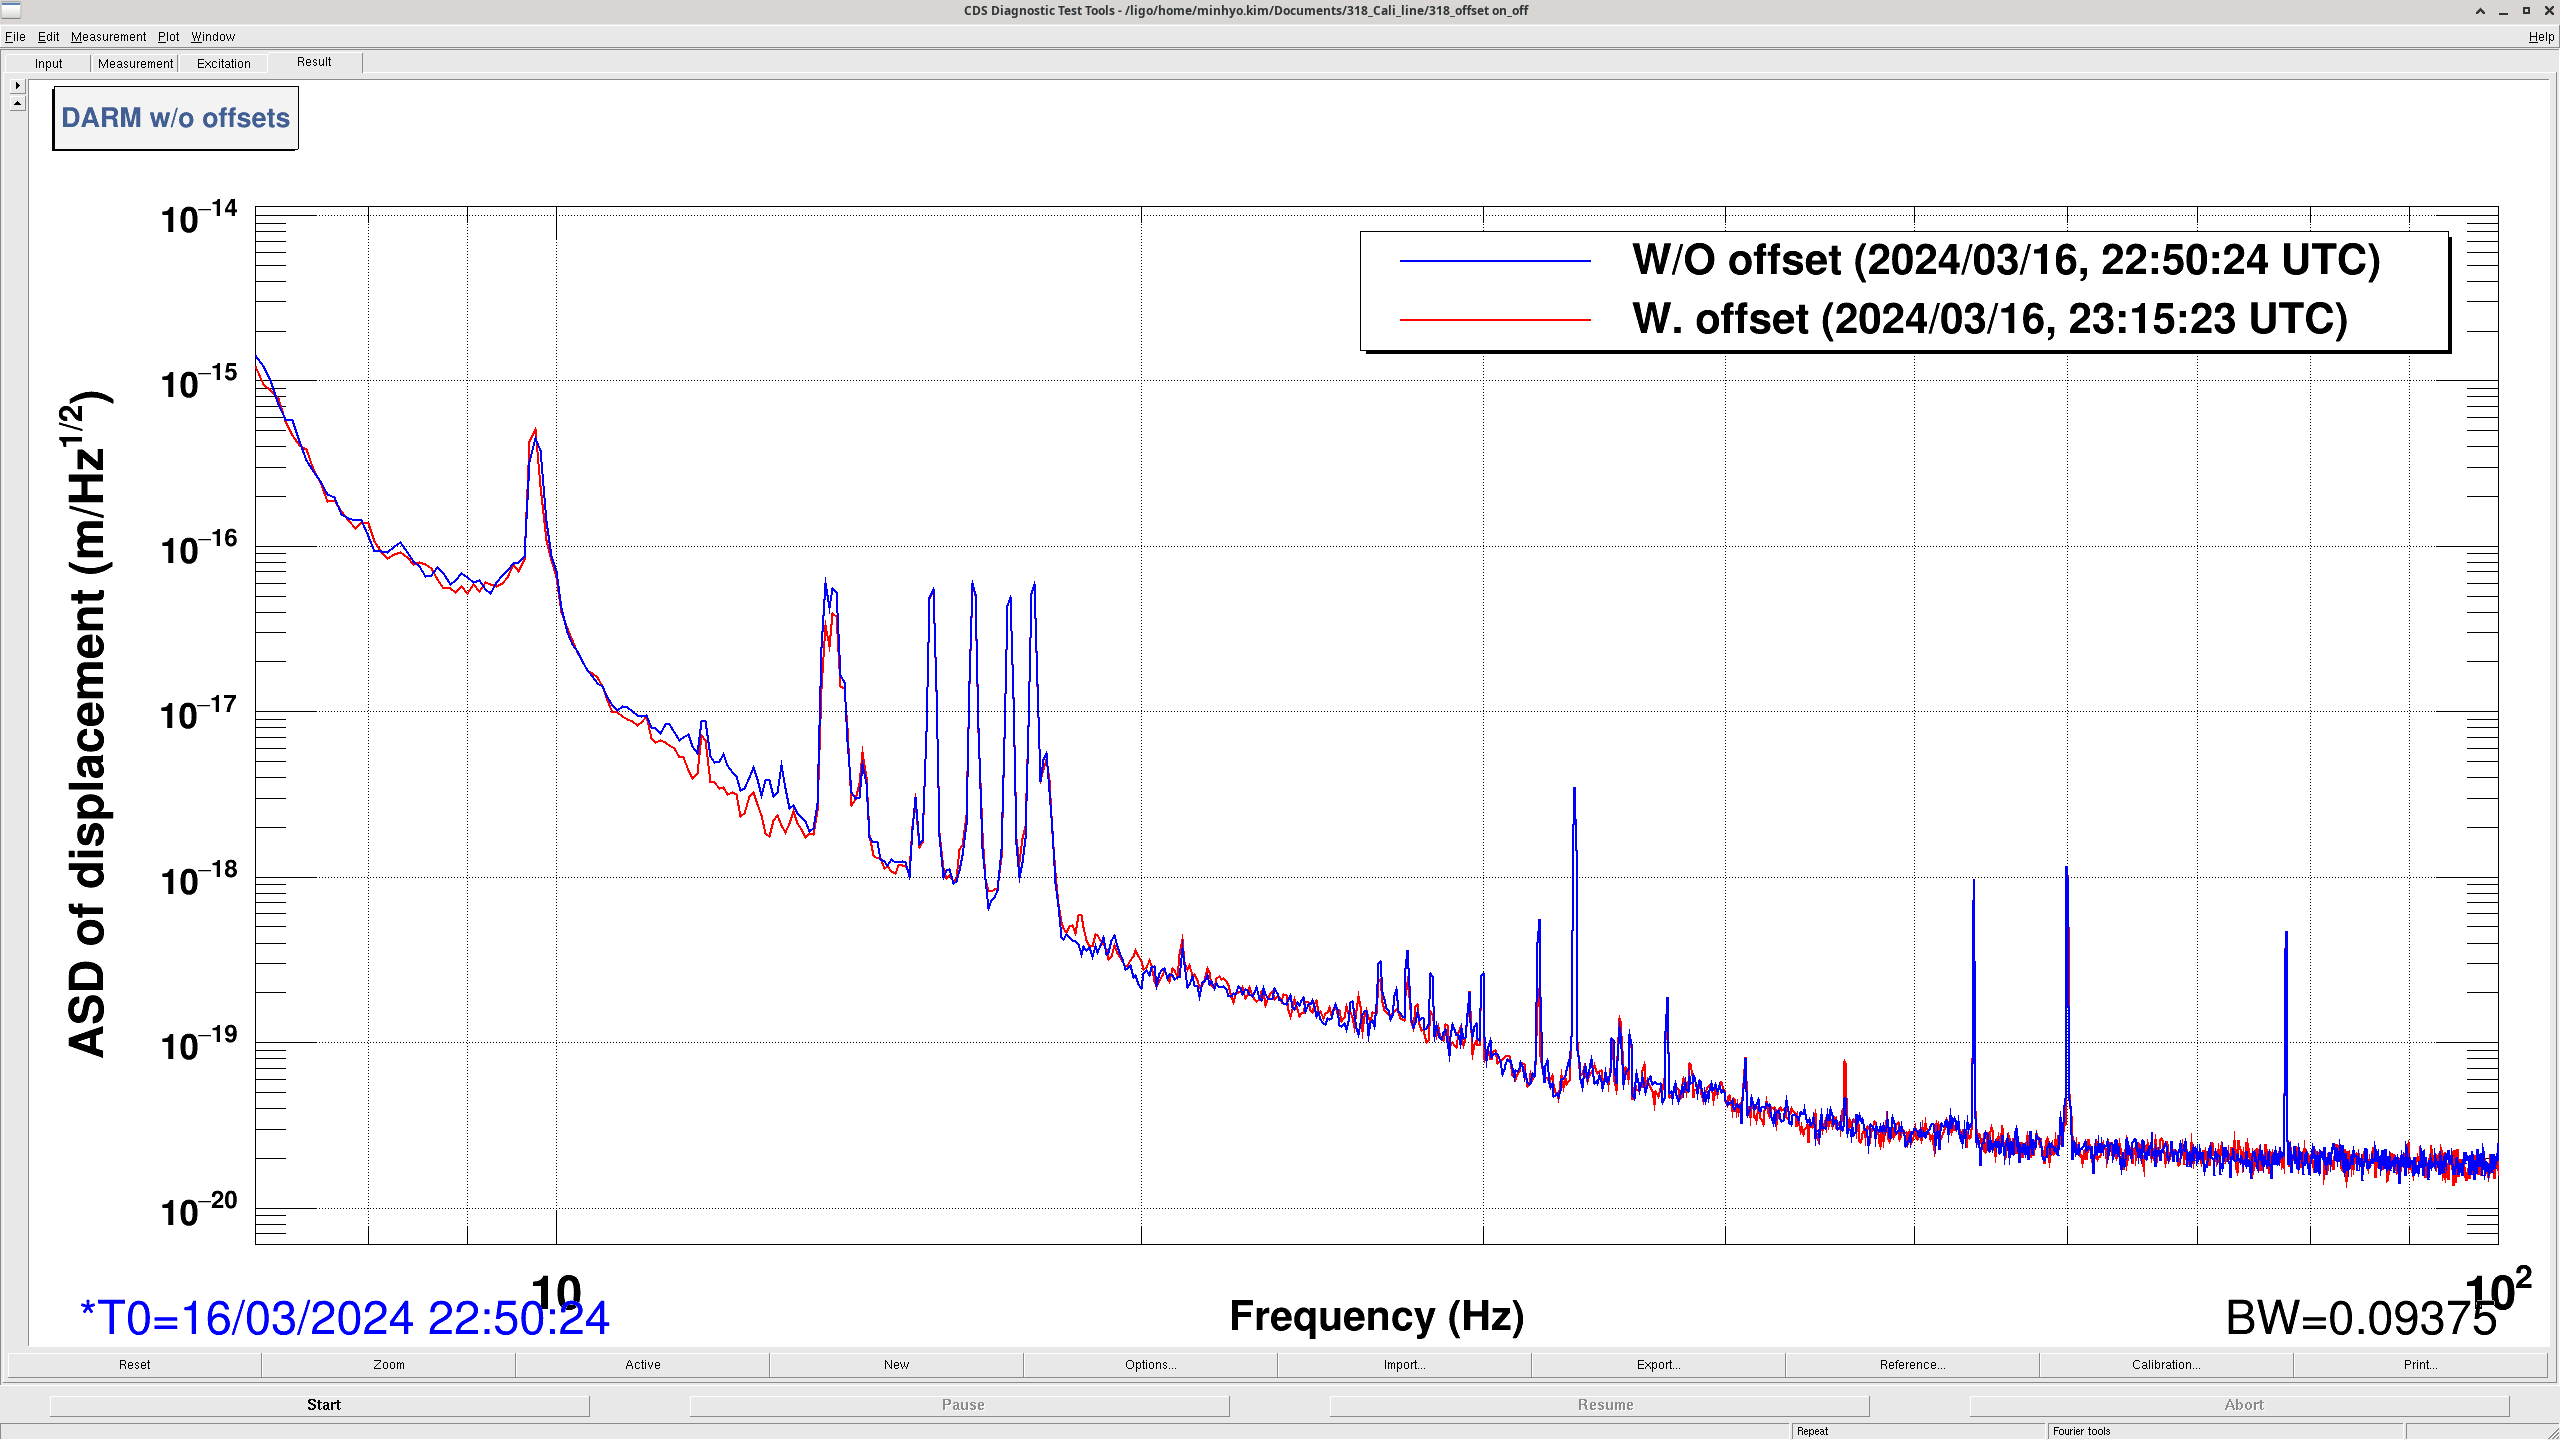
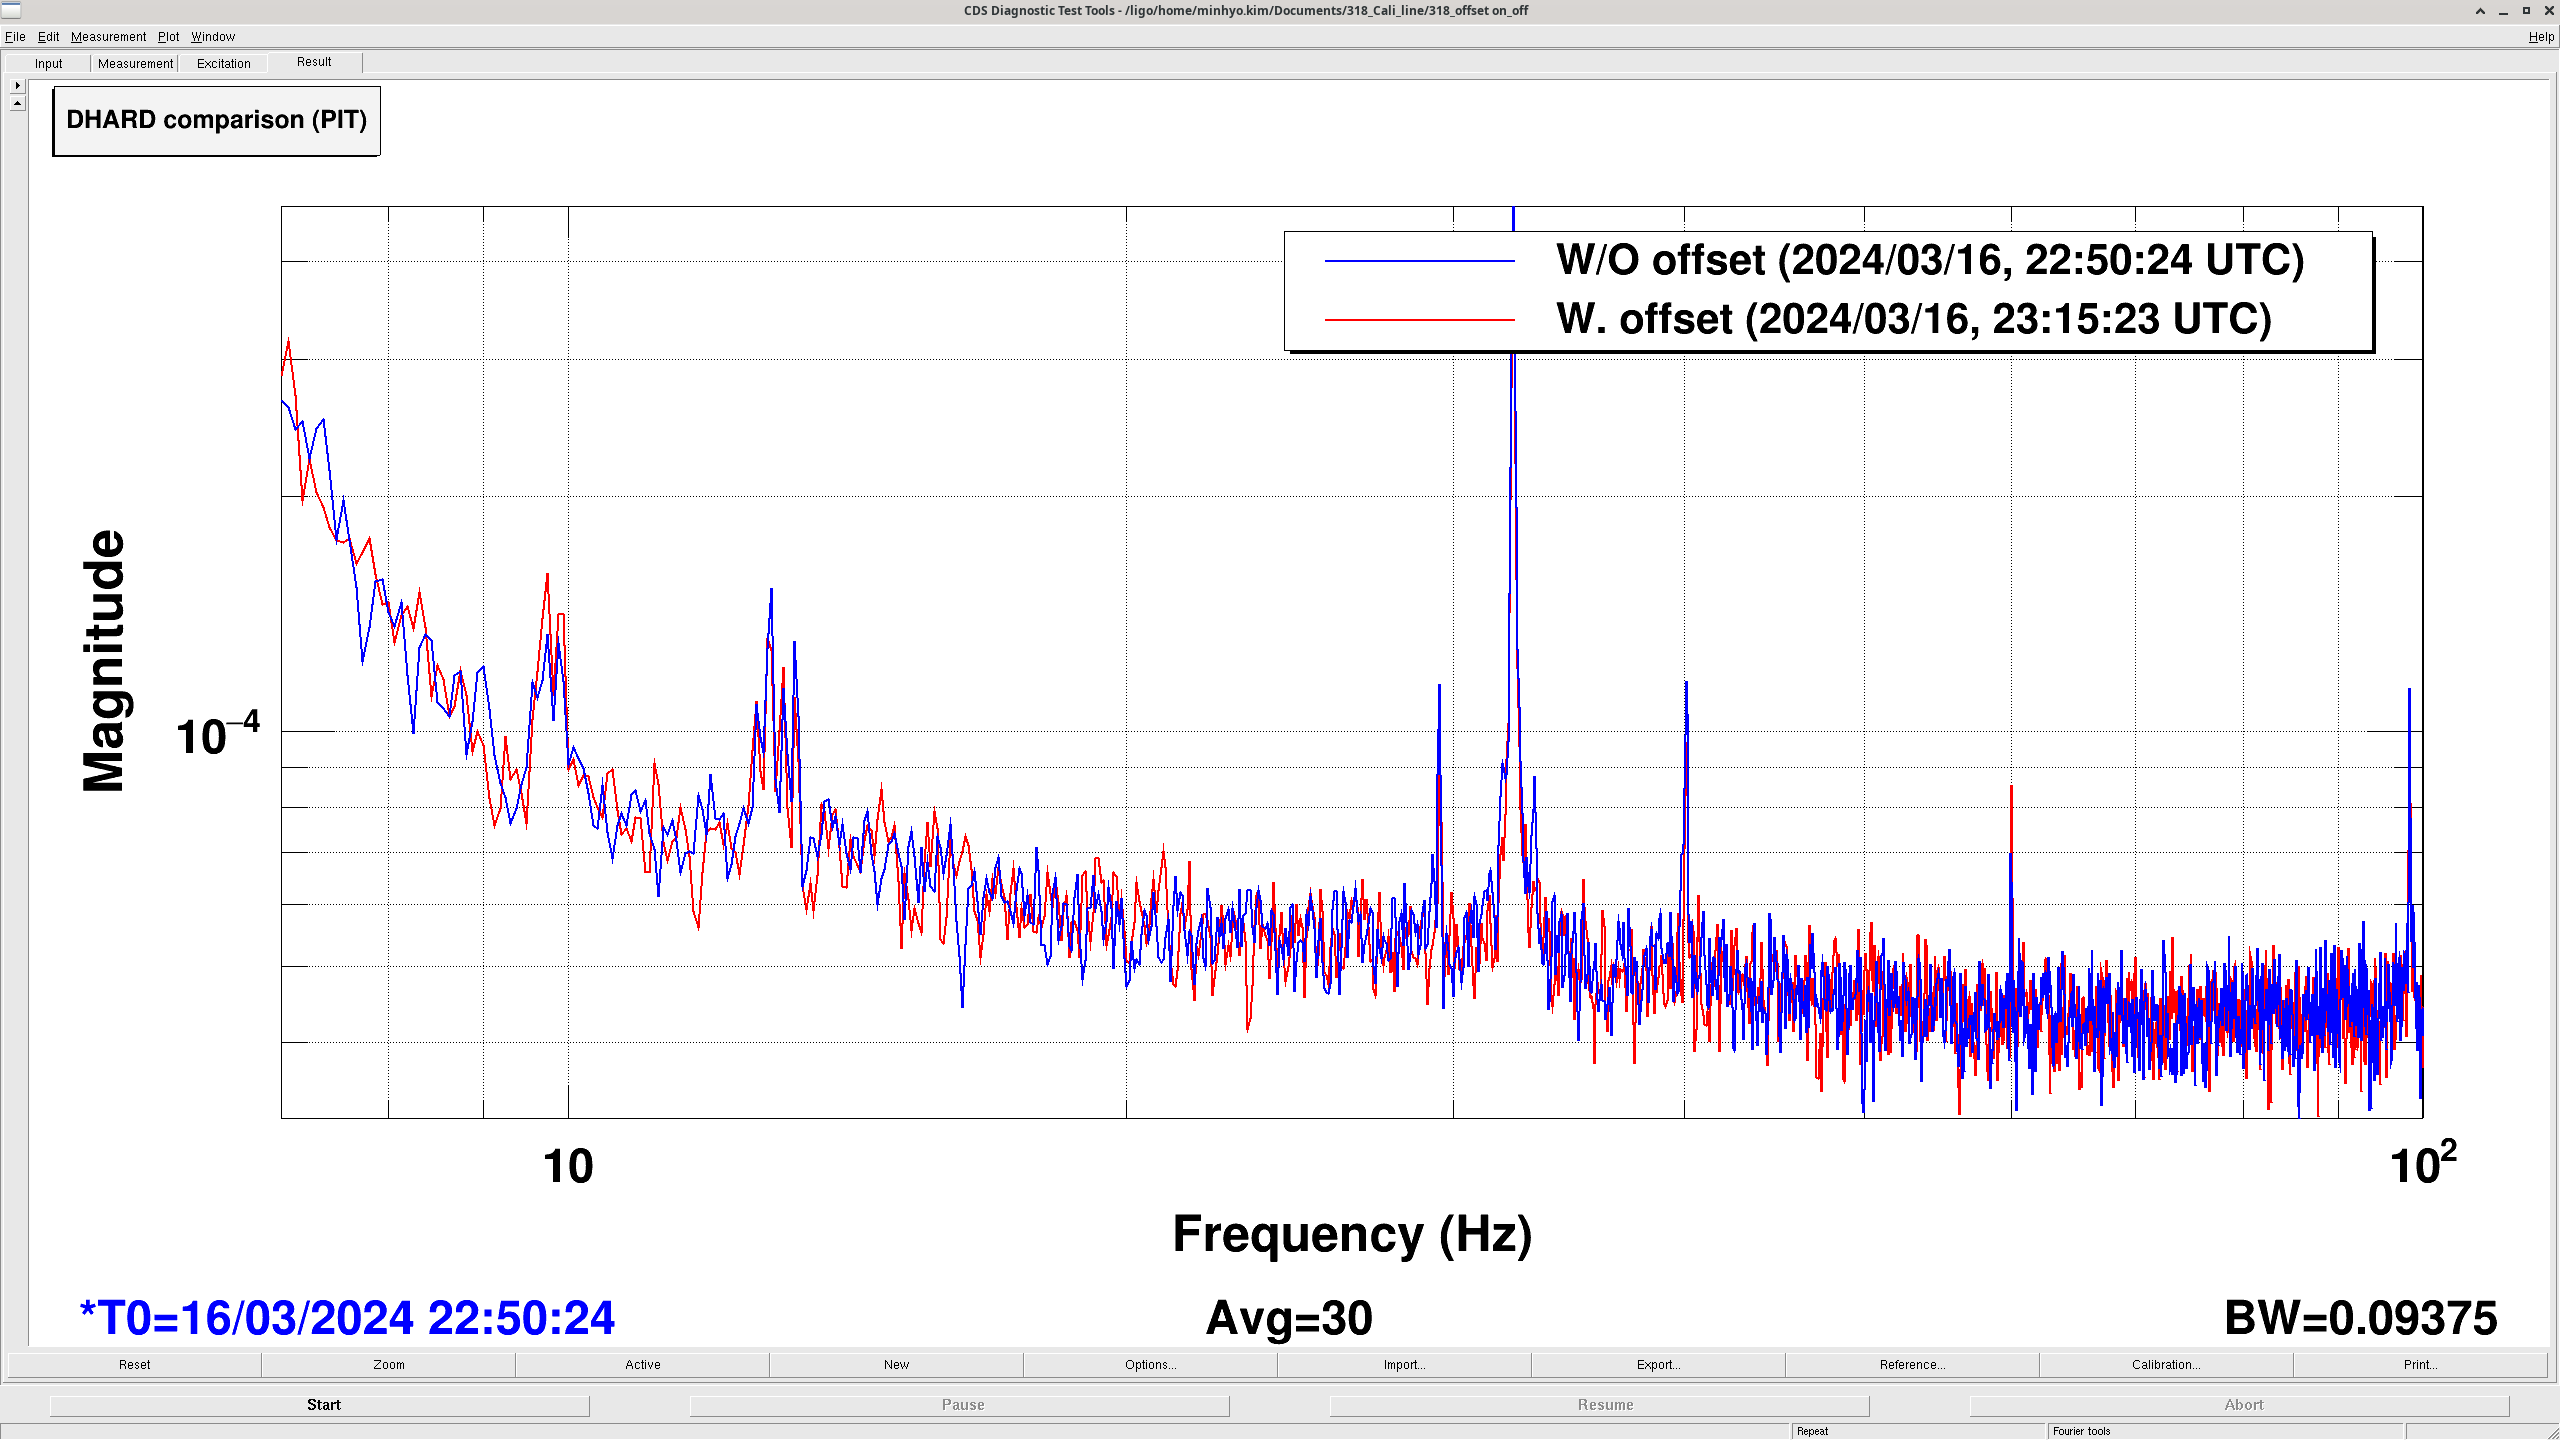
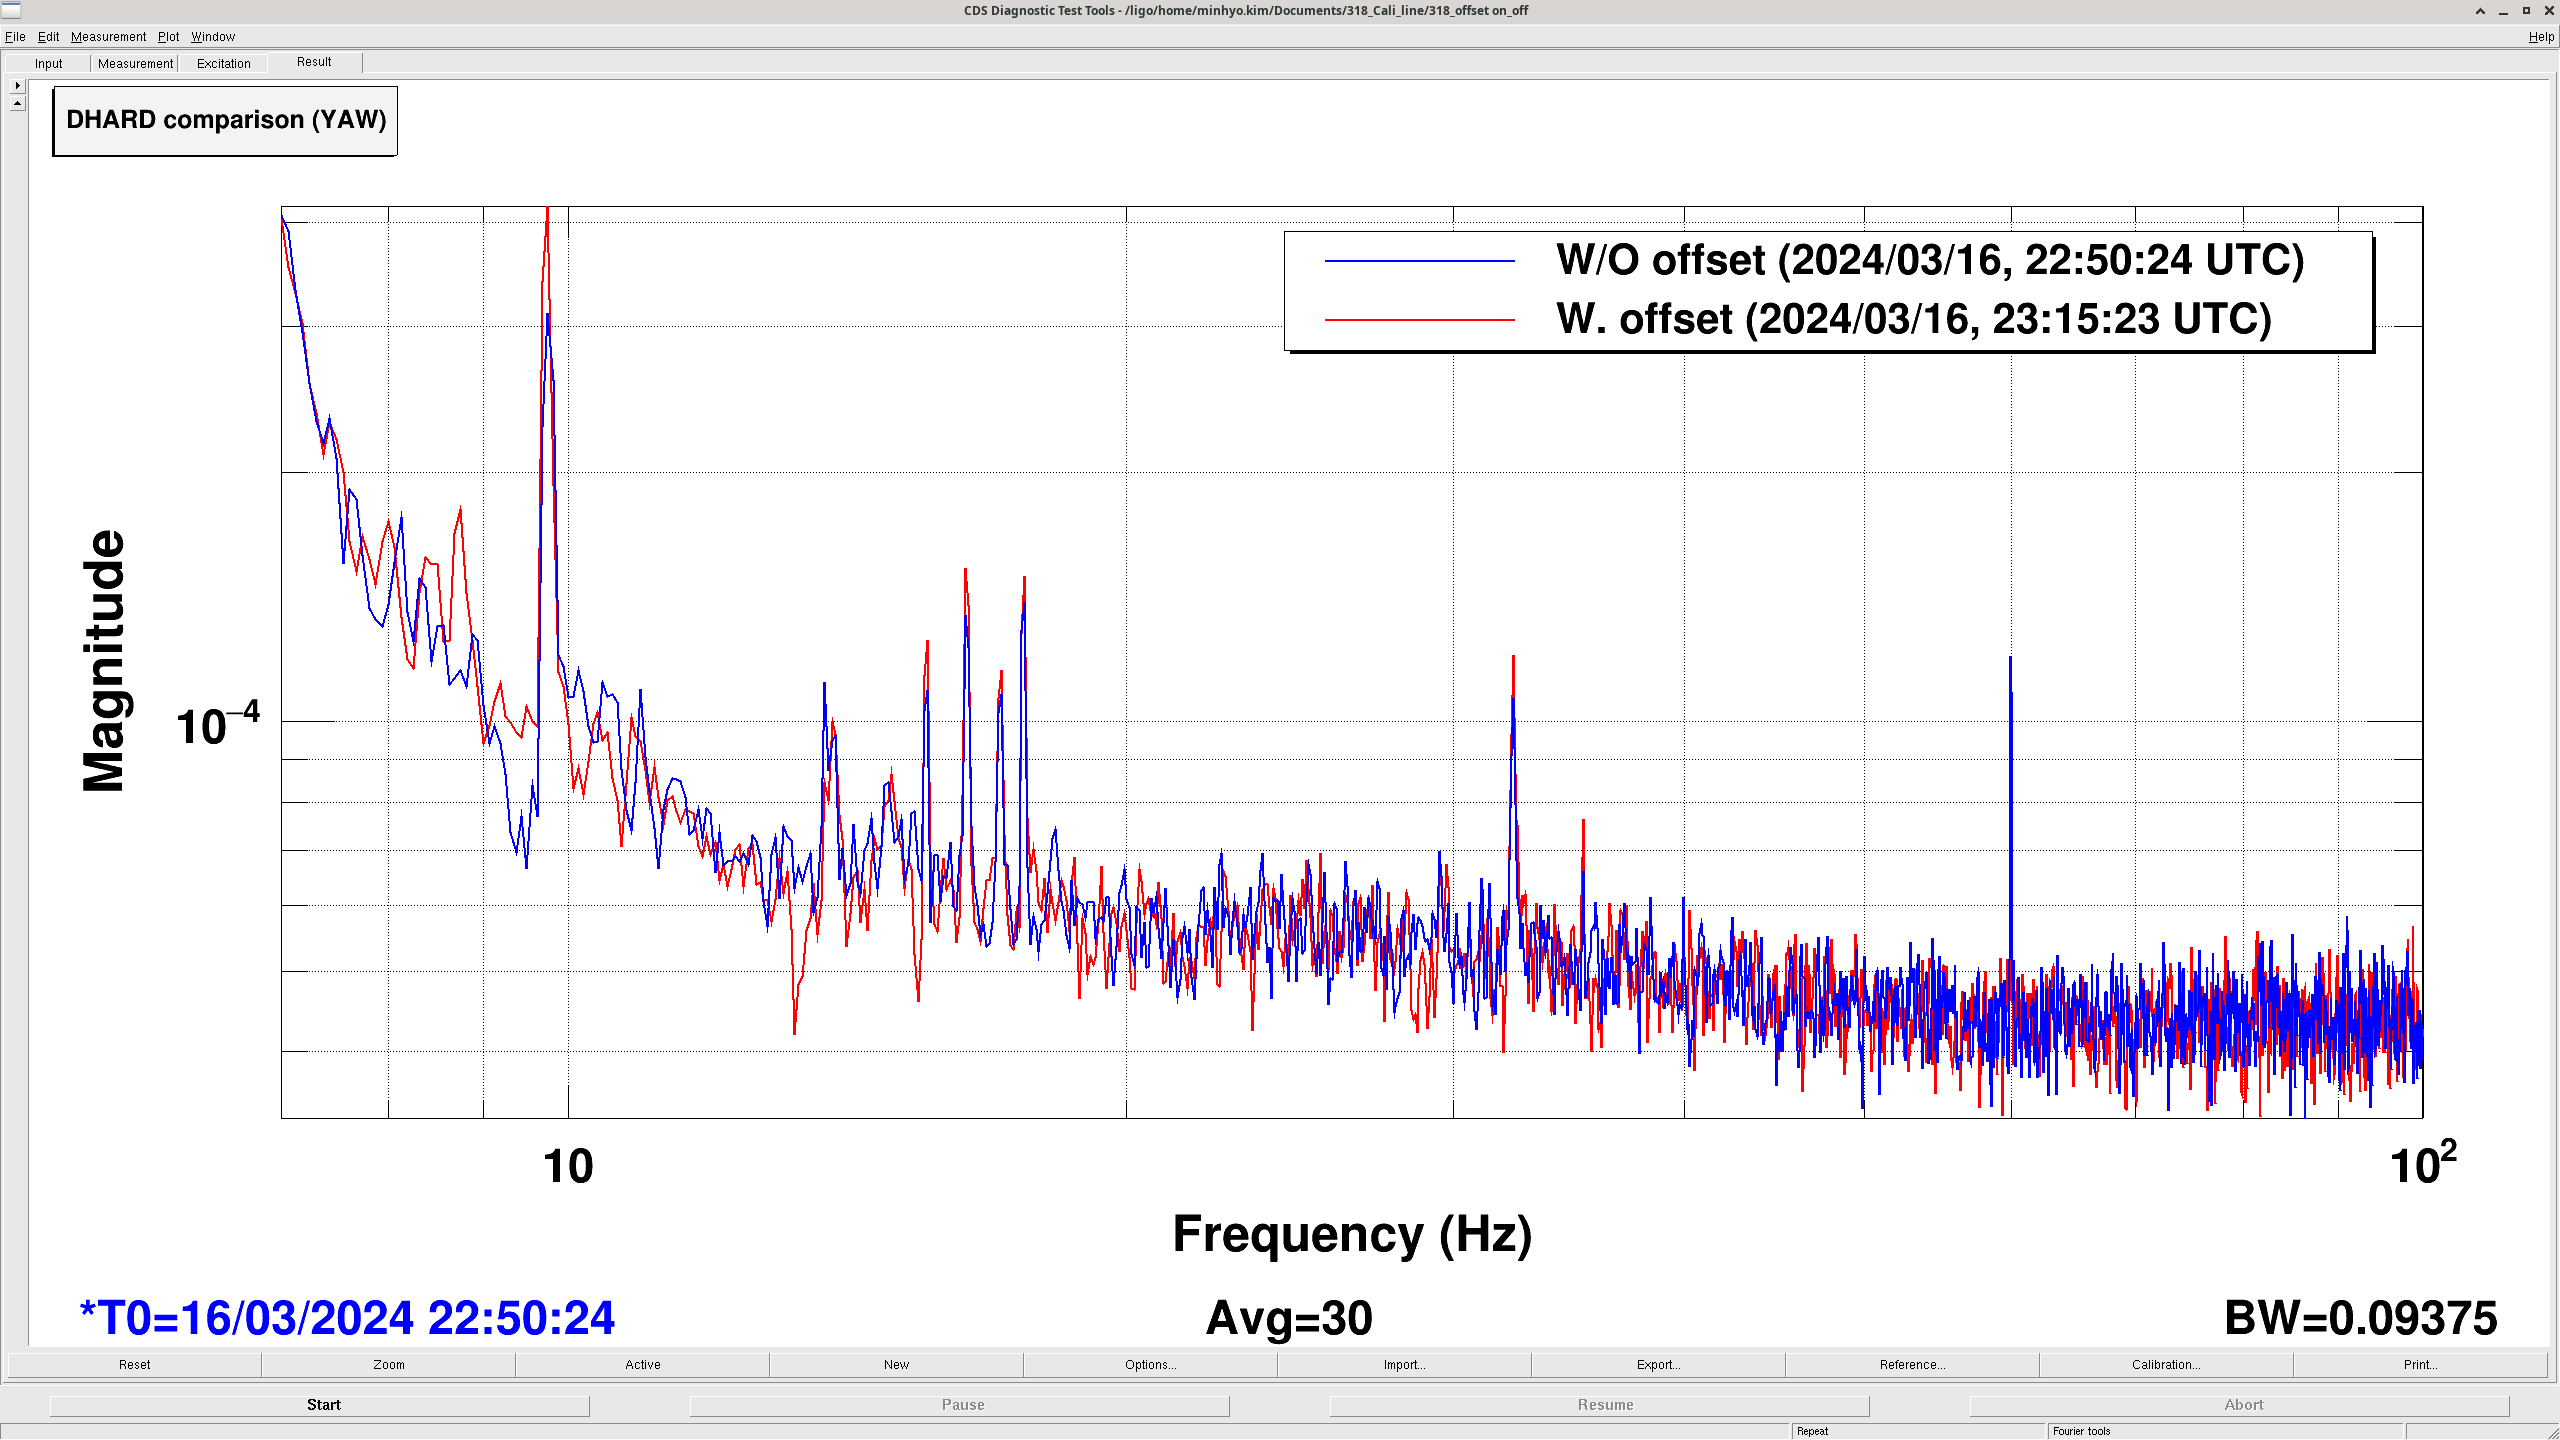
Checked on the calibration lines in DARM and DHARD with centering offset on/off conditions.
To minimize the thermalisation effect, time for the comparison were chosen within short time window.
Figures are; 1) Comparison altogether, 2) DARM comparison, 3) DHARD PIT, 4) DHARD YAW, 5) Screenshot of the ndscope around comparison time.
It can be confirmed that the peaks of calibration lines were same in DARM with and without the centering offset. However, for DHARD, only YAW showed calibration lines, and with different peak magnitude (lower in without offset).
Naoki, Dhruva, Nutsinee
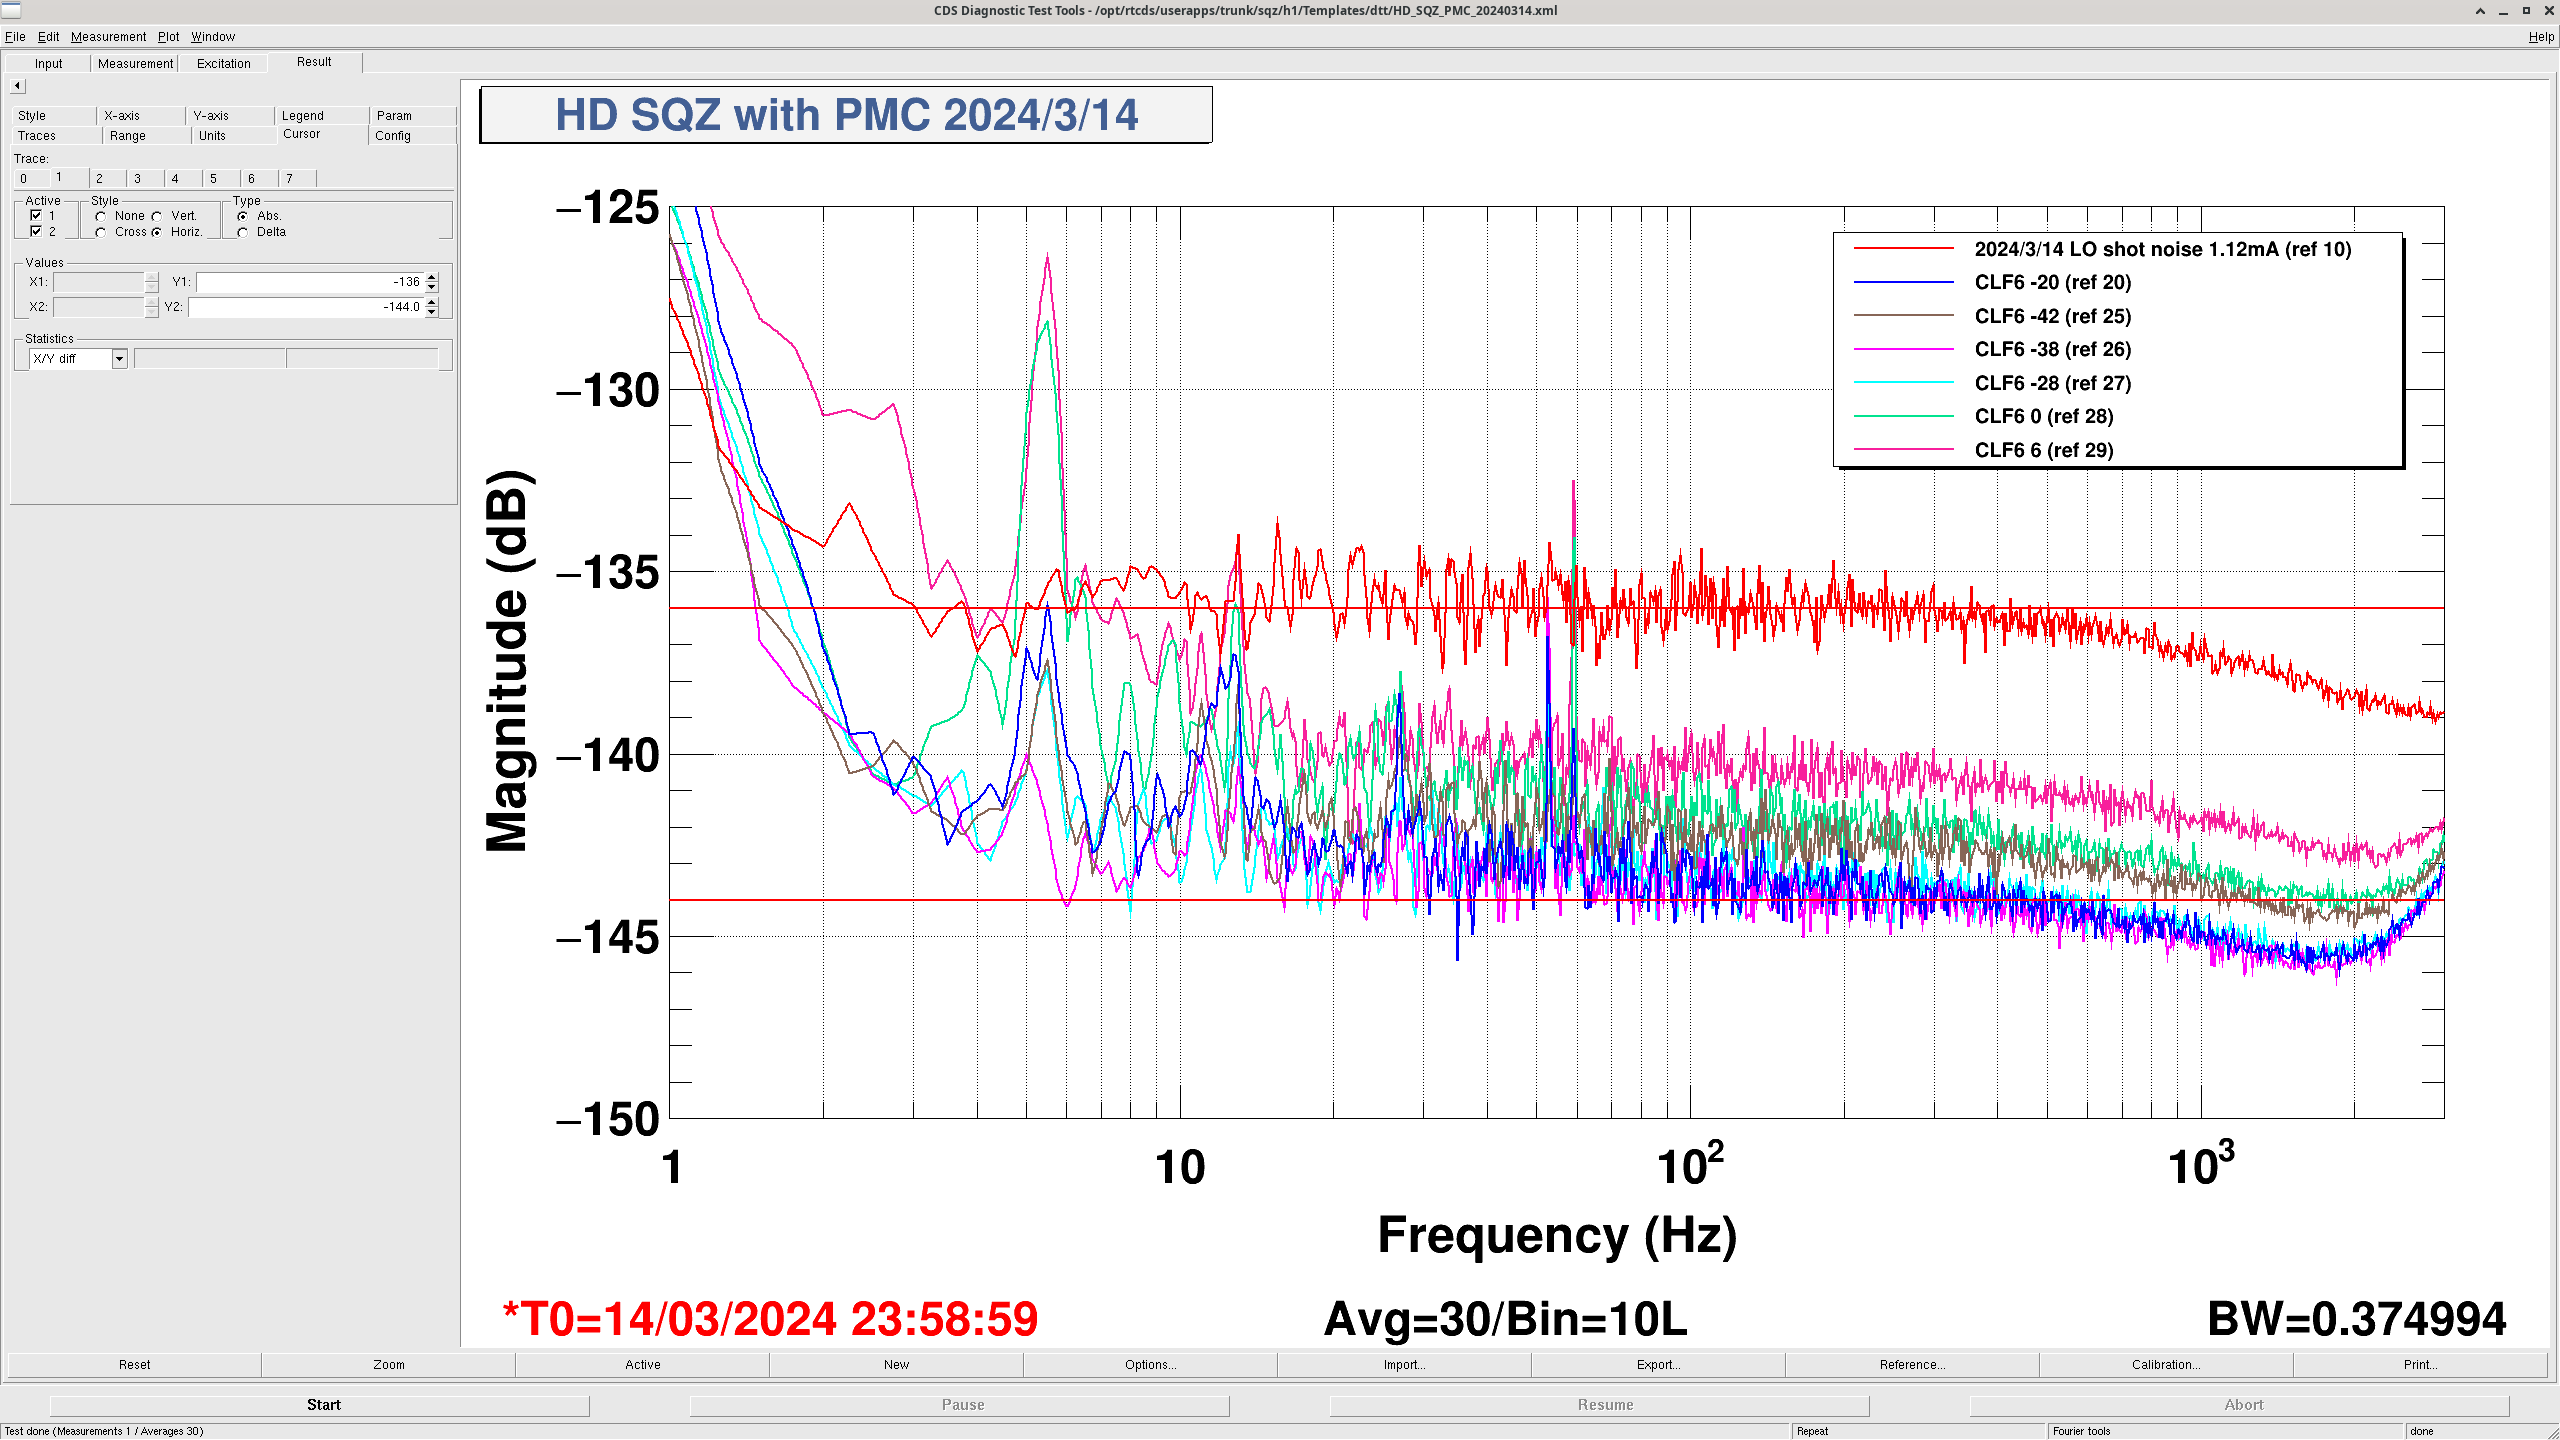
Yesterday we had only 3dB squeezing at IFO so we checked squeezing at homodyne. Although the visibility is good (98.5%), the squeezing was only 4.5dB at homodyne with 6dBm CLF6. We reduced the CLF power and recovered 8dB squeezing as shown in the attached figure.
The CLF6 was reduced from 6dBm to -42dBm and the 8dB squeezing was obtained with -38dBm CLF6. The CLF6 between -38 and -20 dBm gave similar squeezing so we set it at -24dBm, which is similar to O4a value and corresponds to 8uW CLF_REFL_LF_OUTPUT. The squeezing at IFO is recovered to 4.5dB with -24dBm CLF6.
Note that the LLO also saw the better squeezing at IFO with less CLF power in LLO70072.
We had 6.5dB squeezing at homodyne in 76040 and 4.5dB squeezing at IFO in 76226 with 6dBm CLF6 before. The question is why we lost squeezing at homodyne and IFO this week with same CLF power? The commissioning list in 76369 might give us a clue.
At high CLF power we have about 12 uW of light for CLF and RLF after the OPO. Each homodyne PD has 0.5 mW of power, or 1 mW total. This yields a CLF/RLF to LO ratio of 0.012. Using the equation Gamma^2/2 to get the modulation index, we obtain an estimate of 150 mrad for the maximum phase modulation. In reality, it will be somewhat smaller since some of the power will be in amplitude modulation. This will limit the maximum amount of achievable squeezing on the homodyne. But, this has no bearing on the DCPDs, since the CLF/RLF to LO ratio there is approximetaly 5000 times smaller.
A bit more details on this.
The power ratio between SB and CR of each sideband is approximated to be ~ (gamma/2)^2 where gamma is modulation depth in radian. Add the two sidebands together you get (gamma^2)/2.
A total power transmits through the OPO during high CLF case was 12uW. A total LO power hitting the HD was 1mW. So the phase noise contribution to HD sqz was
(gamma^2)/2 = 12uW/1mW
High CLF phase noise (gamma) at the homodyne = 154mrad (max)
A total power transmits through the OPO during low CLF case was 0.6 uW. A total LO power hitting the HD was 1mW. So the phase noise contribution to HD sqz was
Low CLF phase noise (gamma) at the homodyne = sqrt(2*0.6uW/1mW) = 35mrad (max)
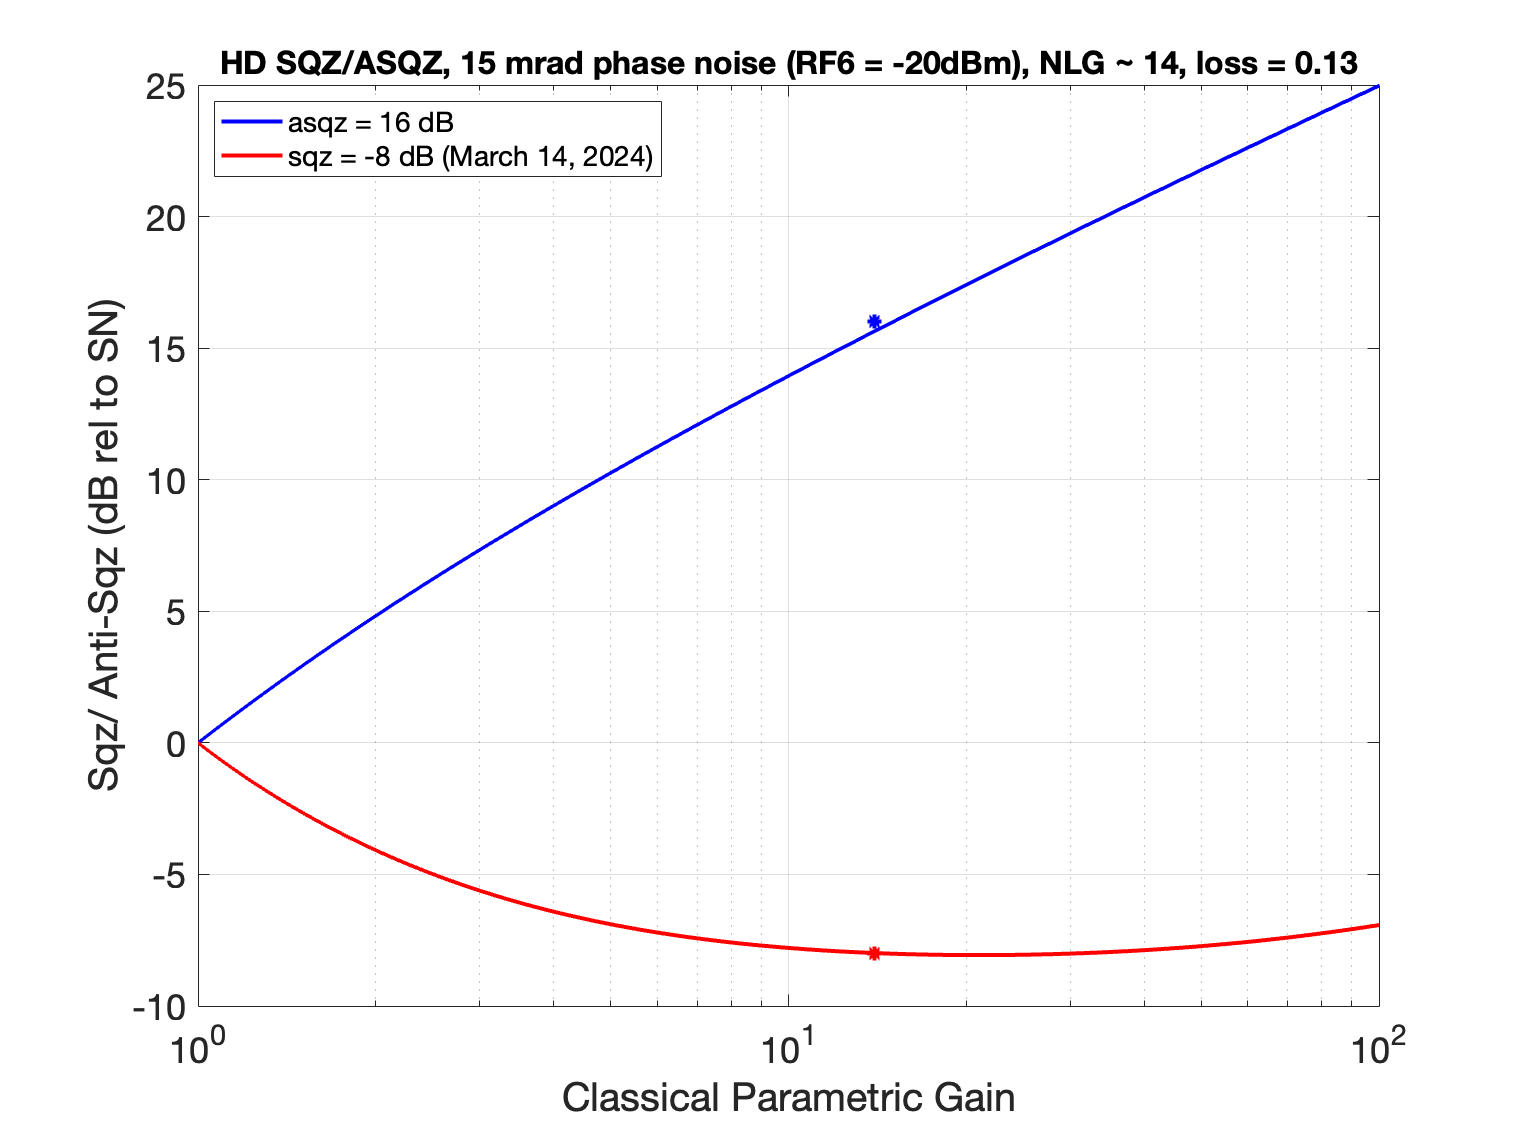
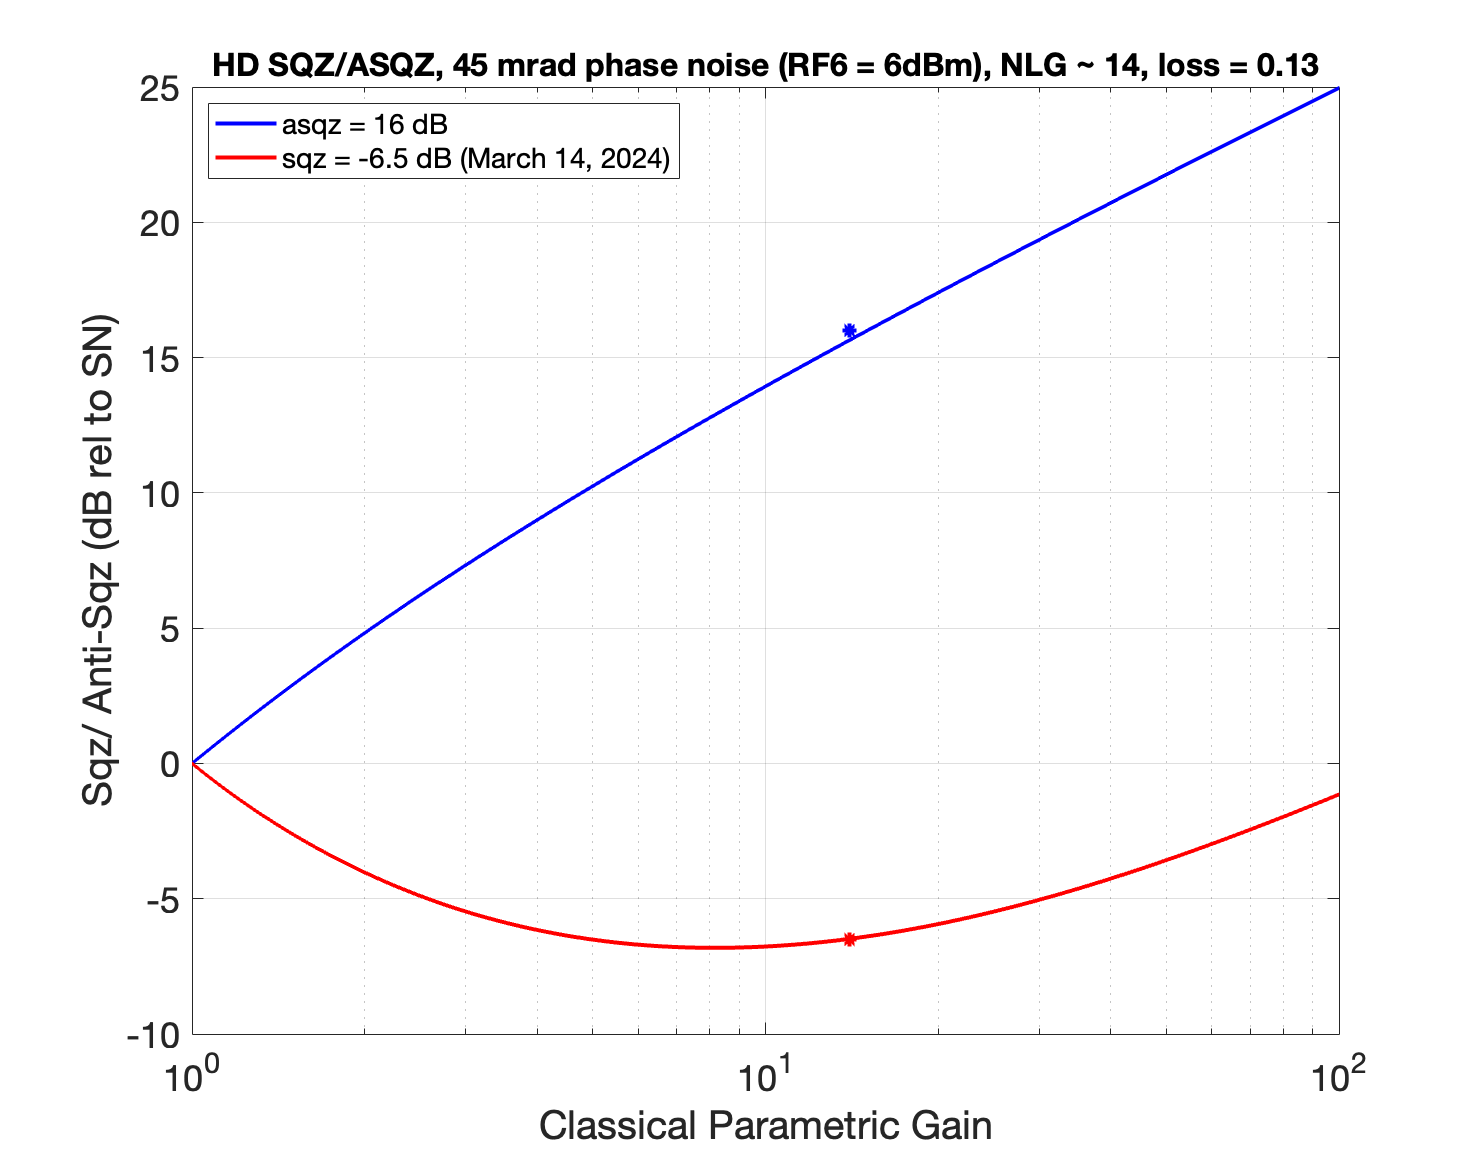
These number include amplitude modulation. It's the worse case that could possibly happen. Using 45 mrad of phase noise and *16dB of asqz fits the high CLF squeezing of 6.5 dB in the homodyne. 15 mrad and 16 dB of squeezing fits the low CLF squeezing of 8 dB in the HD.
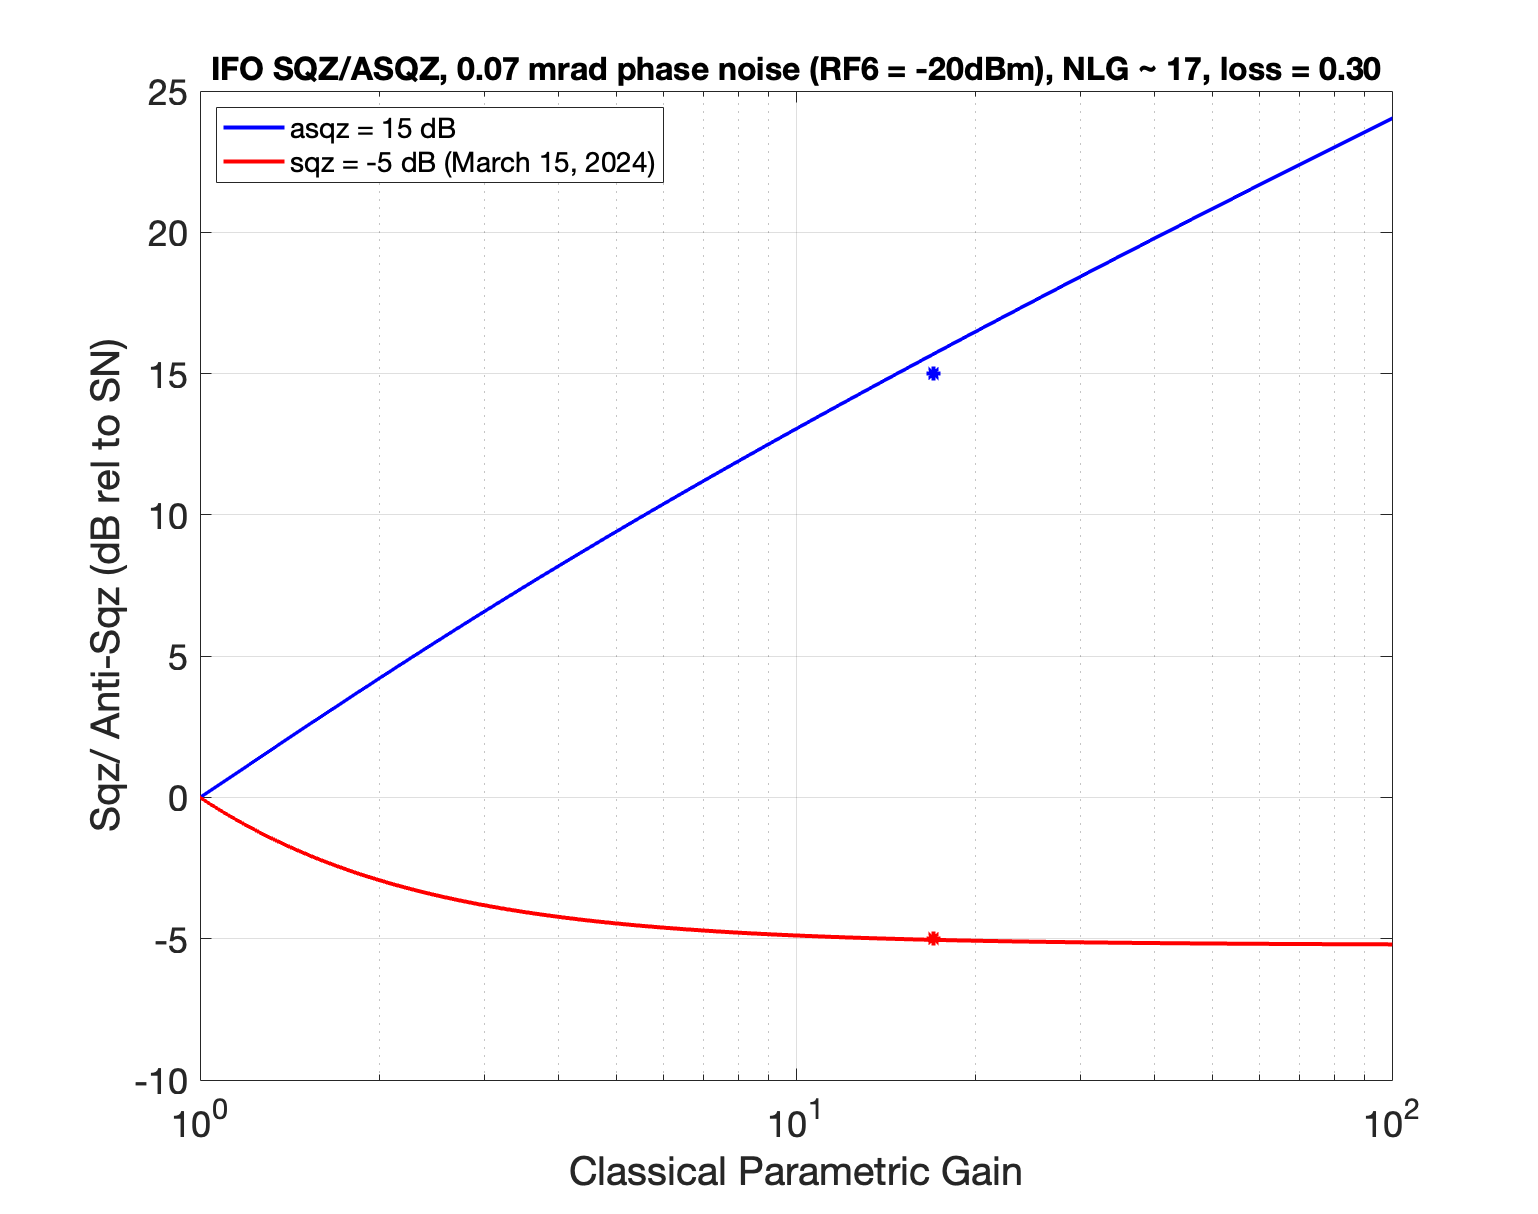
For the IFO case we've only injected sqz using low CLF so far. All the sideband power gets attenuated by the OMC (a factor of 5000). The LO (IFO carrier) is ~40mW. Phase noise contribution from CLF/RLF sidebands is 0.08 mrad, which is negligible. Even for high CLF power (RF6 = 6 dBm) this phase noise would be 0.3 mrad. That number is still negligible so there's no reason why we shouldn't be able to see good squeezing with high CLF. Using **15dB of aSQZ and a loss of ***30% we have 5 dB of squeezing as observed on Friday.
*ASQZ trace overlapped with 16 dB aSQZ reference in HD https://alog.ligo-wa.caltech.edu/aLOG/uploads/73562_20231018171710_8dB_hd_sqz_2023Oct18.png
**15 dB of aSQZ in DARM https://alog.ligo-wa.caltech.edu/aLOG/index.php?callRep=76426
*** If I'm reading this noise budget correctly the inferred loss in the IFO is 30%.