On Sept 4th we had a longer commissioning period to allow us to heat up OM2. The main goal was to use this to characterize the mode matching of the arm cavities to the OMC, but we also made some other interesting measurements.
Summary: heating up OM2 now costs us about 1% of optical gain, while it used to cost us 2%. Heating up OM2 also changed the SRCL offset needed to get flat squeezing significantly, and reduced the amount of squeezing that we could get (without adjusting psams).
The interferometer unlocked (86727) while Jennie Wright was running the DARM offset step script with OM2 cold, to get a measurement of HAM6 throughput and look at OMC refl before heating up OM2. As that link says, there wasn't an obvious connection between the DARM offset script which was in it's final steps (nearly back to normal) when the lockloss happened.
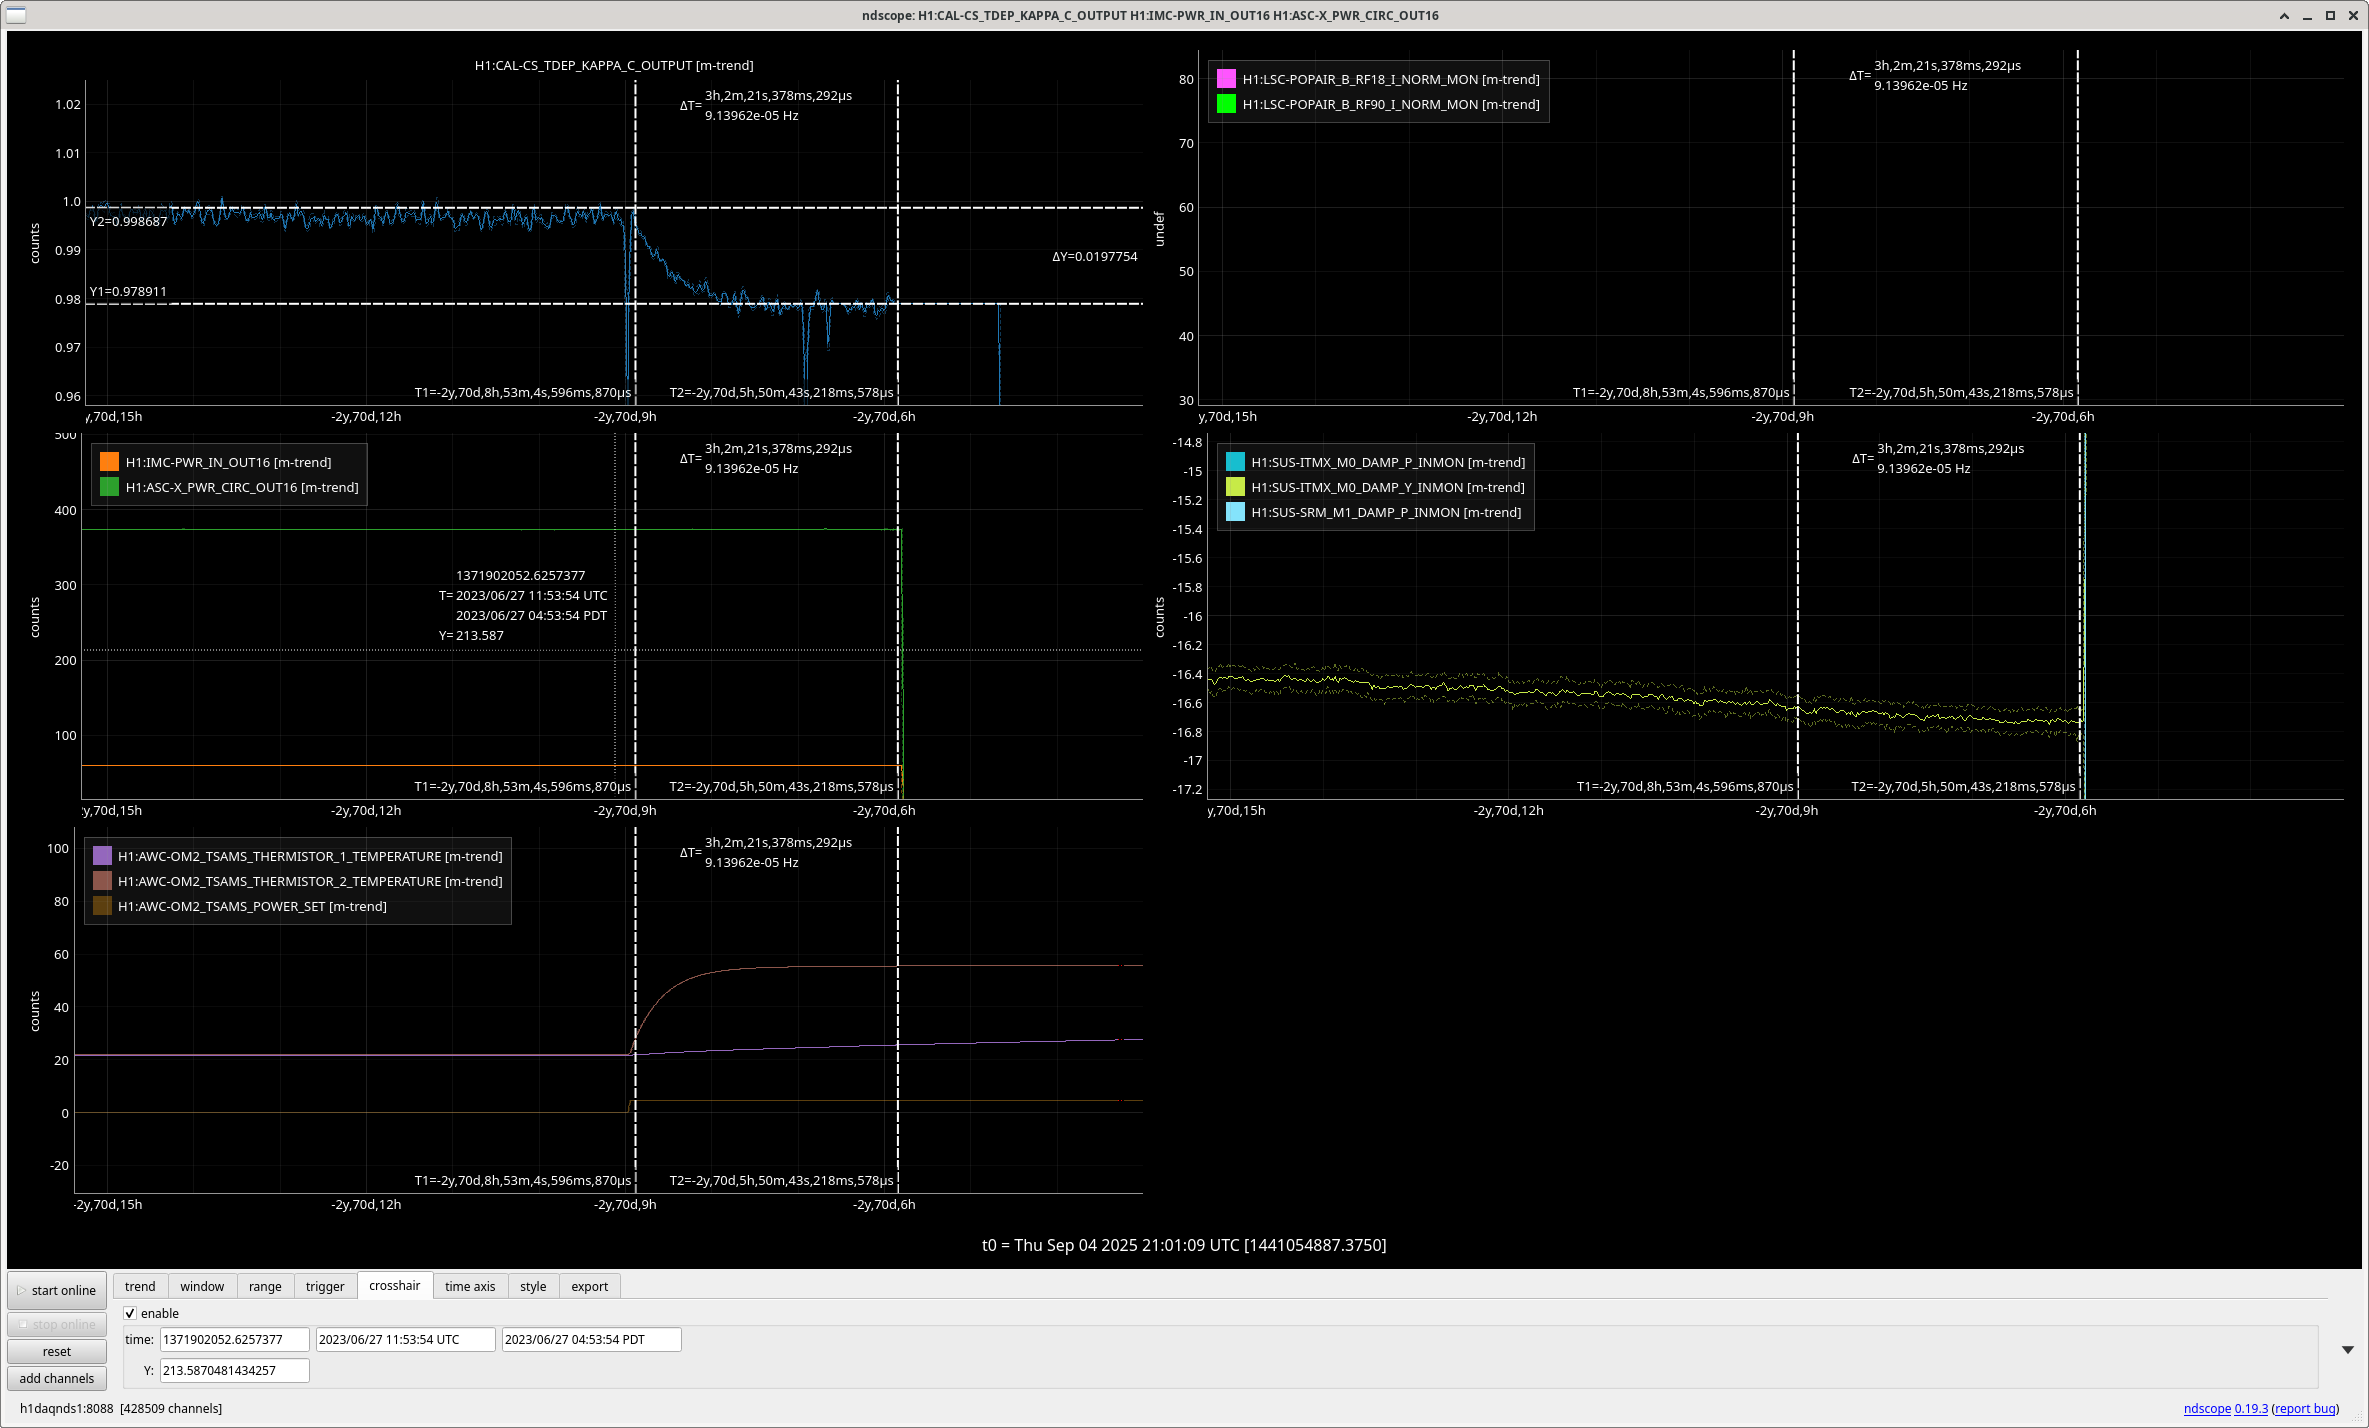
We turned on the OM2 heater while relocking after some back and forth, then had an commissioning caused lockloss while trying to recover. By the time we were relocked, OM2 was heated up according to thermistor 2, which is the thermistor who's timescale matched the timescale of optical gain changes in the past (see screenshot of June 2023 example). We also had a large earthquake while relocking, so we paused after power up and before going to nominal low noise, so we do not have tracking of the optical gain using pcal in the first 30 minutes of this thermalization.
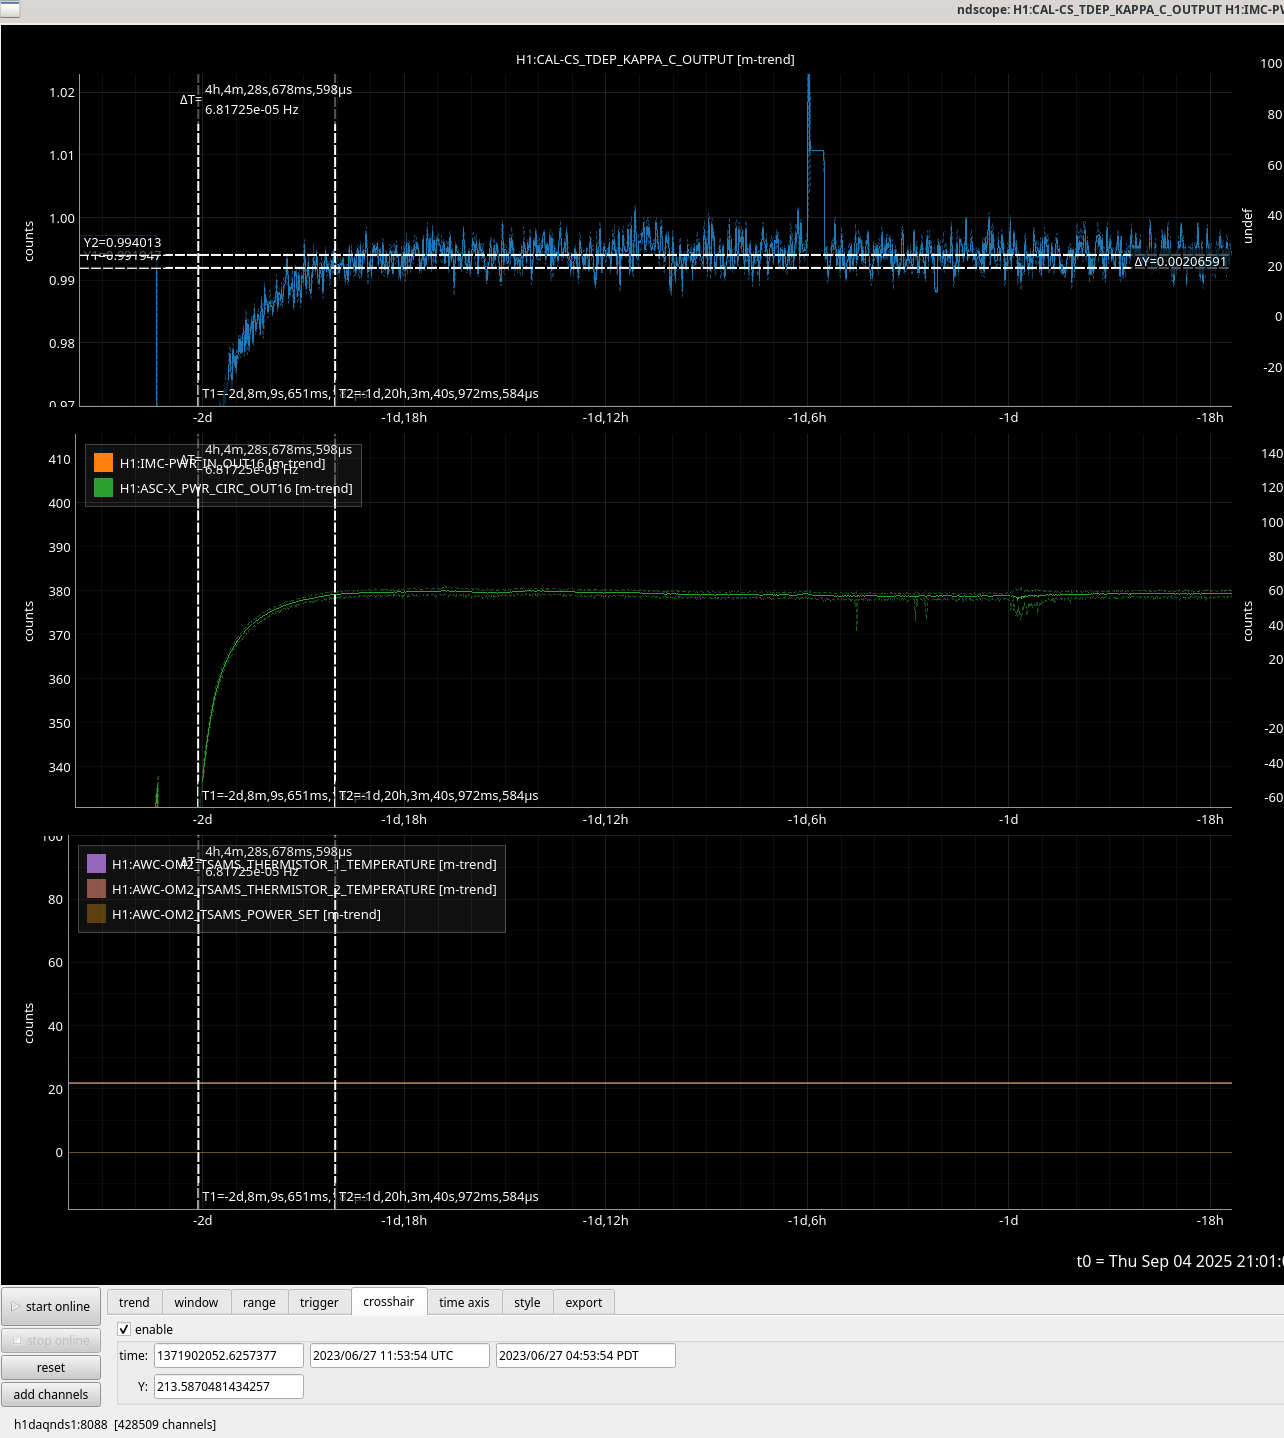
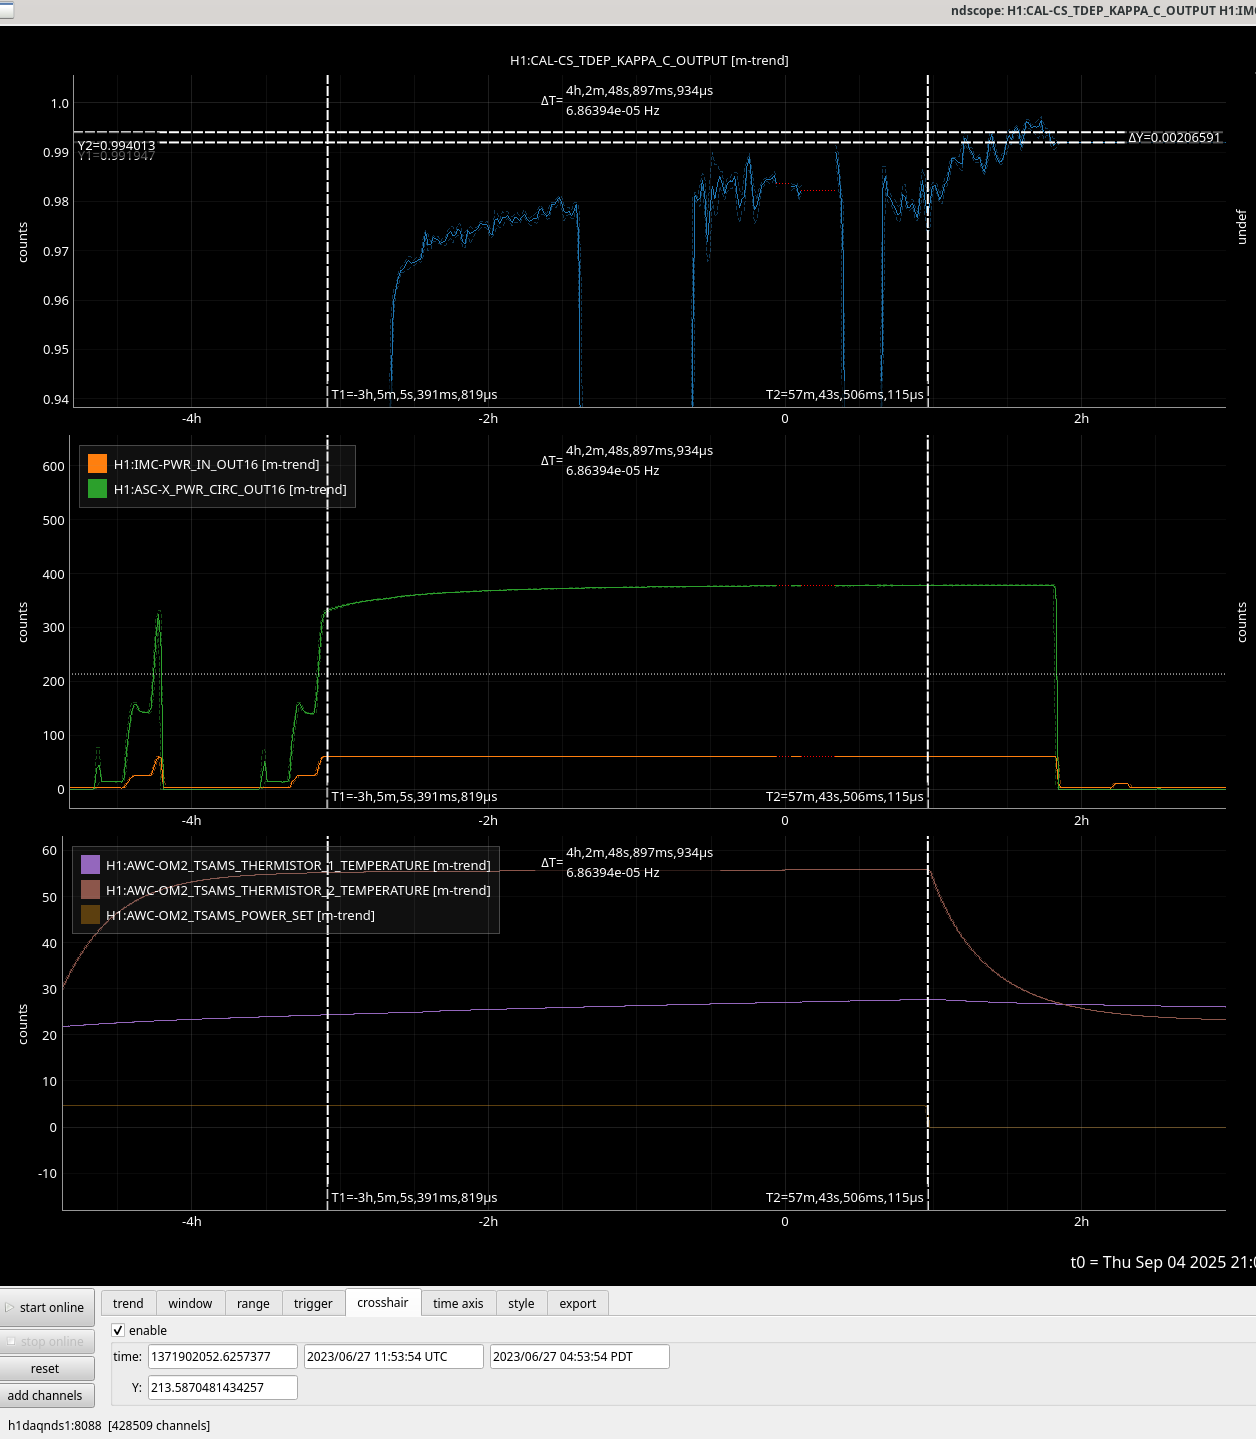
The optical gain in this thermalization seemed to be fairly similar to the previous lock where OM2 was cold in the first hour. The change in optical gain between OM2 hot and cold was much smaller this time around, so we needed to see the full thermalization in order to see what the gain change was. We set the OM2 heater off 4 hours and 5 minutes after the power up, the attached screenshot shows a trend of optical gain during the previous thermalization while OM2 was cold, with a vertical cursor 4 hours 5 minutes into the lock. The horizontal cursors show where the optical gain was at 4 hours and once the thermalization was complete, the optical gain continued to increase by 0.2% after the first 4 hours. The next screenshot shows vertical cursors also at the time of power up and 4 hours later, and the horizontal cursors are the same as on the previous screenshot (OM2 cold). It seems that the optical gain was about 1.1% lower with OM2 hot than cold, although fitting these two thermalizations to an exponential might bring them closer by as much as 0.2%. Our current ring heater settings are 0W on ITMY, 1.5 W/segment on ETMY and 0.44W/segment on ITMX and 1W/segment on ETMX.
Since this is a different result than in the past times of OM2 changes, I've gone back to look at old times when we did this change. One possible explanation for the difference could be ring heater settings being different.
- 12/18/2023, cooled off while unlocked, optical gain increased 1.8% ETMX +ETMY RH 1W, ITMX 0.44W
9/19/2023, heated while unlocked, optical gain dropped 1.9% (this time is confusing, it seems like the thermistors which had been disconnected were plugged in and looked to be thermalizing, but the set power was unchanged).- 7/19/2023, heated in steps, 71484 ifo unlocked and relocked several times, perhaps calibration was reset making optical gain comparison confusing. (it did seem to drop by about 2%, but this seems more like a calibration reset) ETMX + ETMY RH 1W/segment, ITMX RH 0.44W/segment
- 7/12/2023 OM2 cooled off in lock, lockloss happened in the early part of the cooling (2% optical gain increase), ETMX + ETMY RH 1W/segment, ITMX RH 0.44W/segment
- 6/27/2023 OM2 heated while in lock, optical gain dropped by 2%, ETMX + ETMY RH 1W, ITMX RH 0.44W/segment, 0 on ITMY.
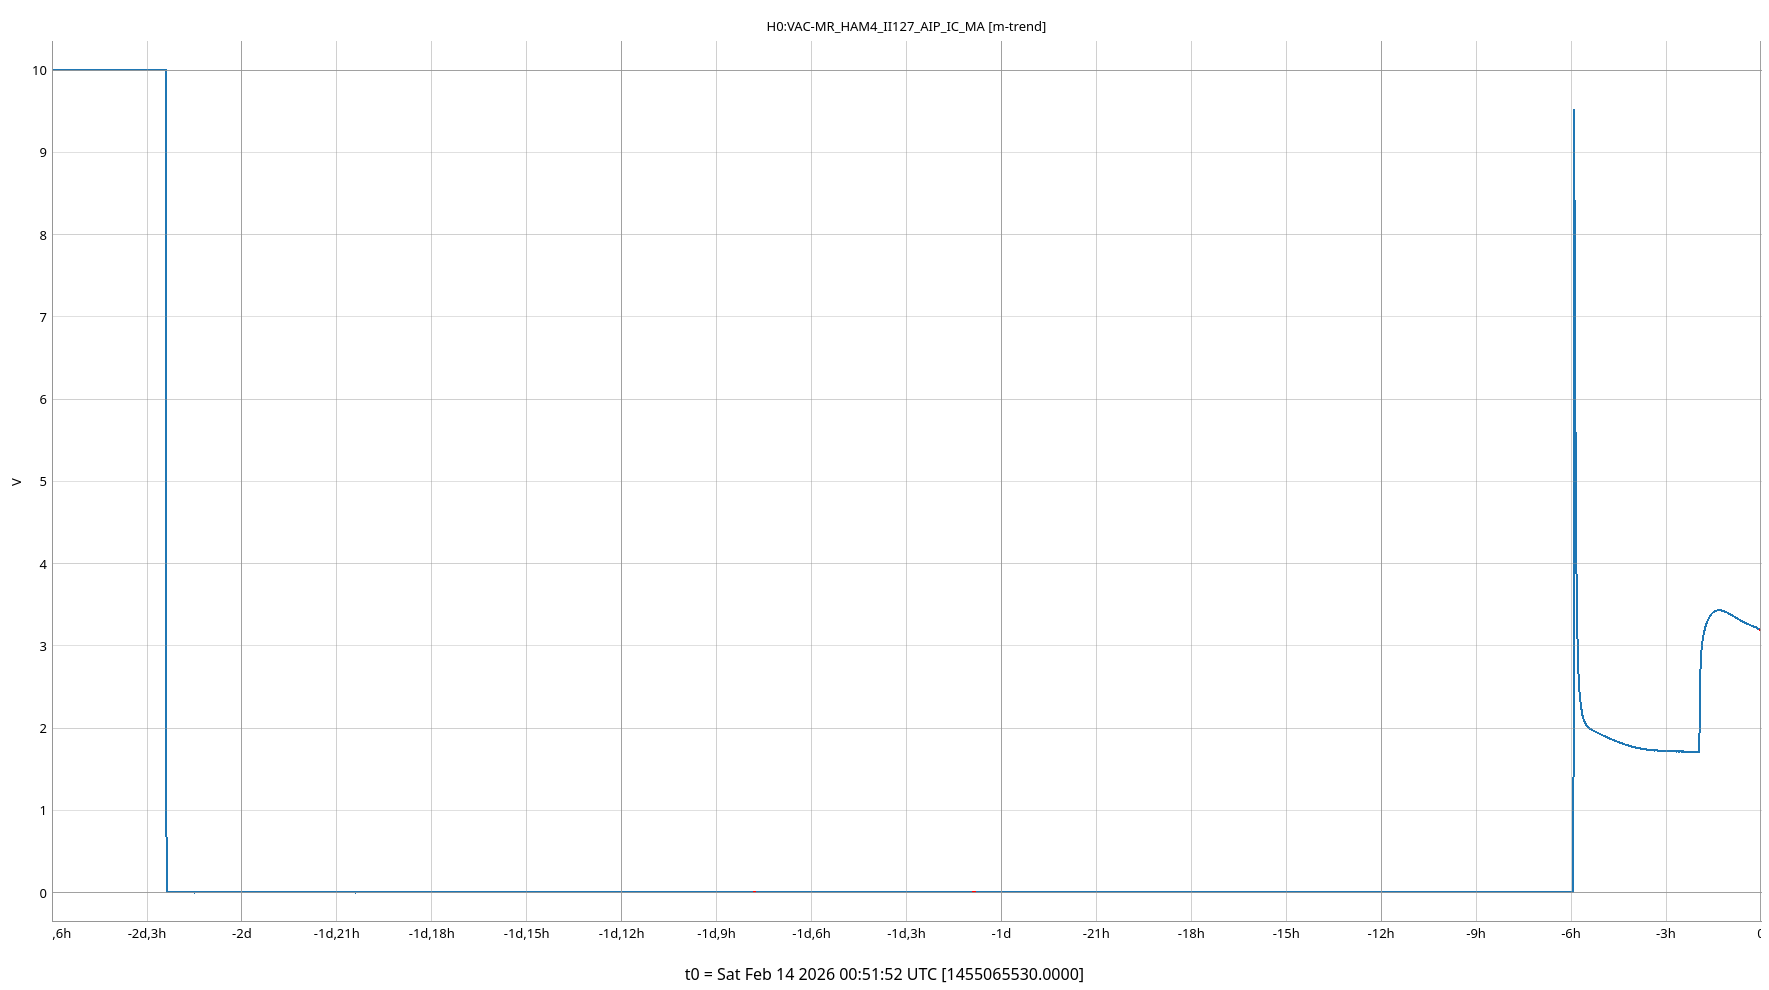
Once the OM2 heater was turned back on, the optical gain increased by nearly 1%, but the IFO lost lock before that thermalization finished. There was a 2% decrease in POP18 during the cool off and a 3 urad shift in SRM top mass.
While OM2 was hot, we did a few tests.
- We had a large change in the SRCL offset needed to reduce the squeezing rotation: 86739 This is interesting, in the past we have tried to change SRM alignment to see an impact on this number and it was a much smaller change.
- No squeezing time for a senstitivty comparison (not much change): 86788
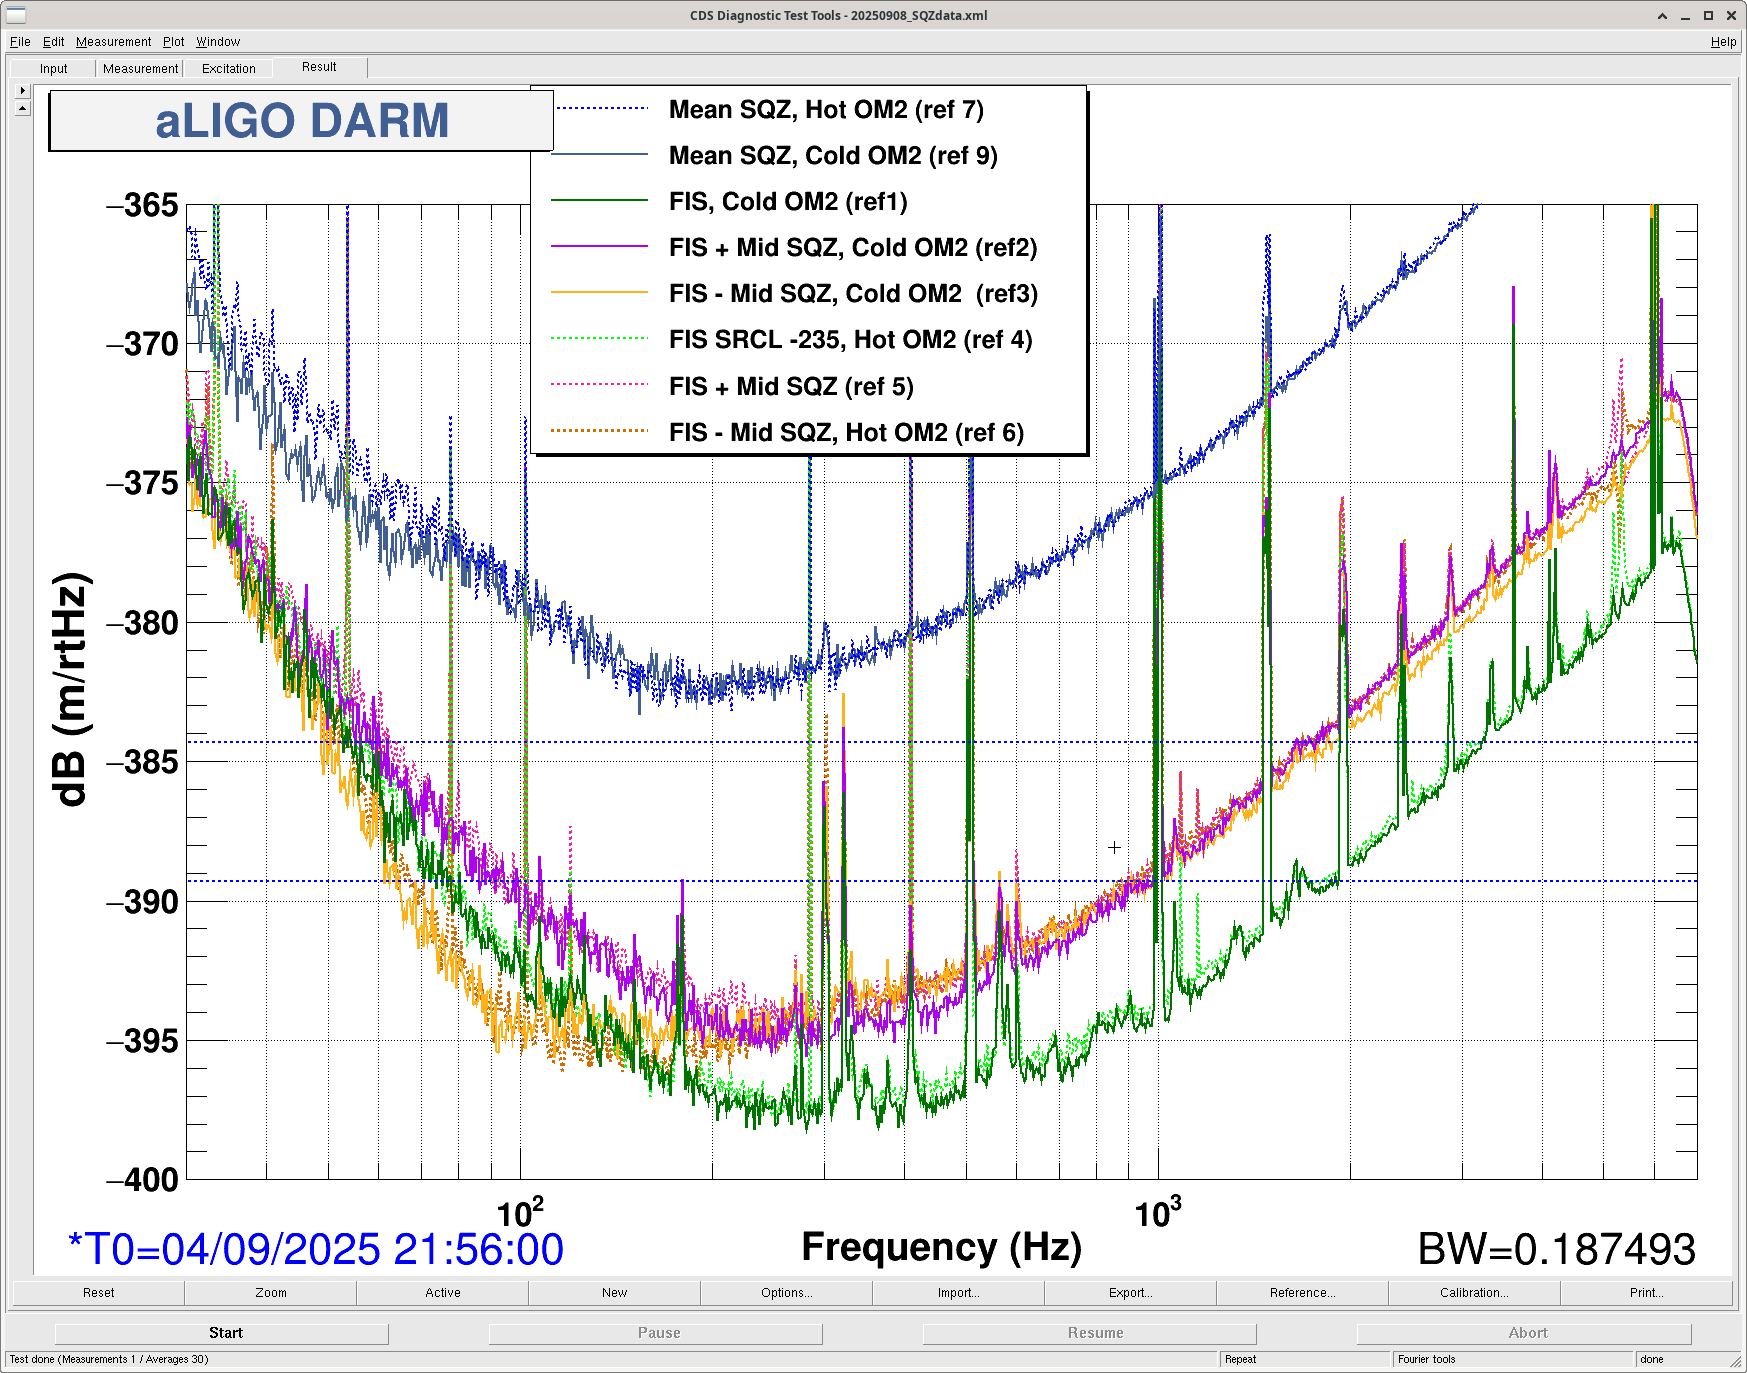
- quick squeezer data set (before SRCL offset updated: 86736 with SRCL offset updated: 86739 ) , to see a comparison with OM2 cold see Camilla's plot from this morning
- Jennie Wright did DARM offset steps with OM2 hot, and cold.


Keita has come back from the LVEA, Light Pipe is closed for the weekend.
JAC Guardian has been taken to down.