ibrahim.abouelfettouh@LIGO.ORG - posted 00:03, Thursday 07 September 2023 - last comment - 00:04, Thursday 07 September 2023(72726)
OPS Eve Midshift Update
IFO is in NLN and OBSERVING as of 02:19 UTC
Lockloss at 00:01 UTC (alog 72723) and Acquisition
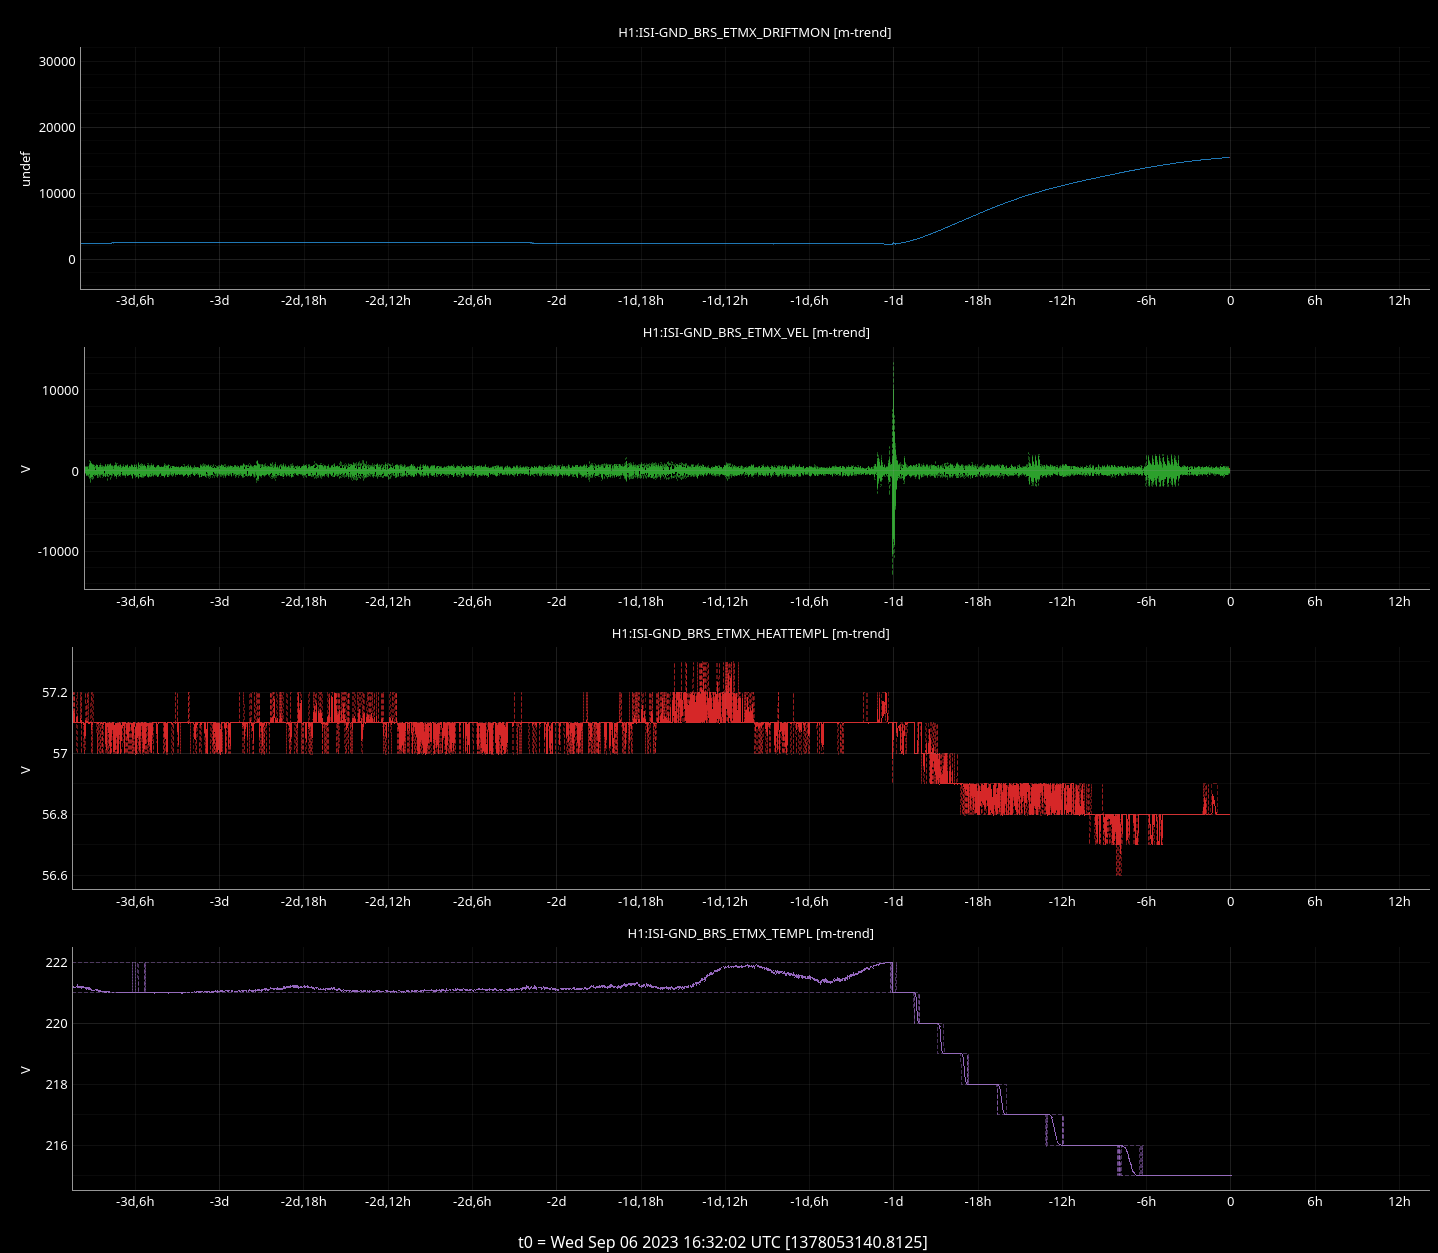
- 6.2 Earthquake in Chile broke our lock. Due to the BRS temperature walk from earlier (alog 72709), this happened when IFO was more susceptible to such earthquakes due to sensor correction temporarily being off until the temperature walks back to nominal.
- Although not expecting success, a locking attempt was made right after the lockloss due to ALS not aligning (nor being close to aligning through increase flashes (twice).
- With the R-waves ~12 minutes out, I took IFO to DOWN at 00:24 UTC.
- I monitored the ISI_CONFIG and EQ Screen (nuc 5) until the ground motion settled. This happened at 01:08 UTC (as soon as seismic went to CALM for the last time post-EQ)
- NLN was reached at 02:02 UTC
- OBSERVING Reached at 02:19 UTC
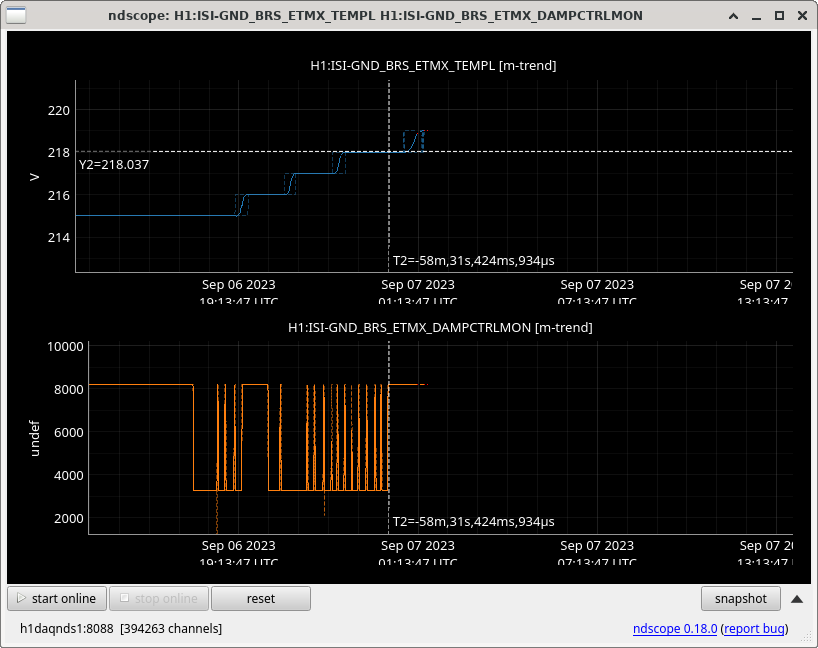
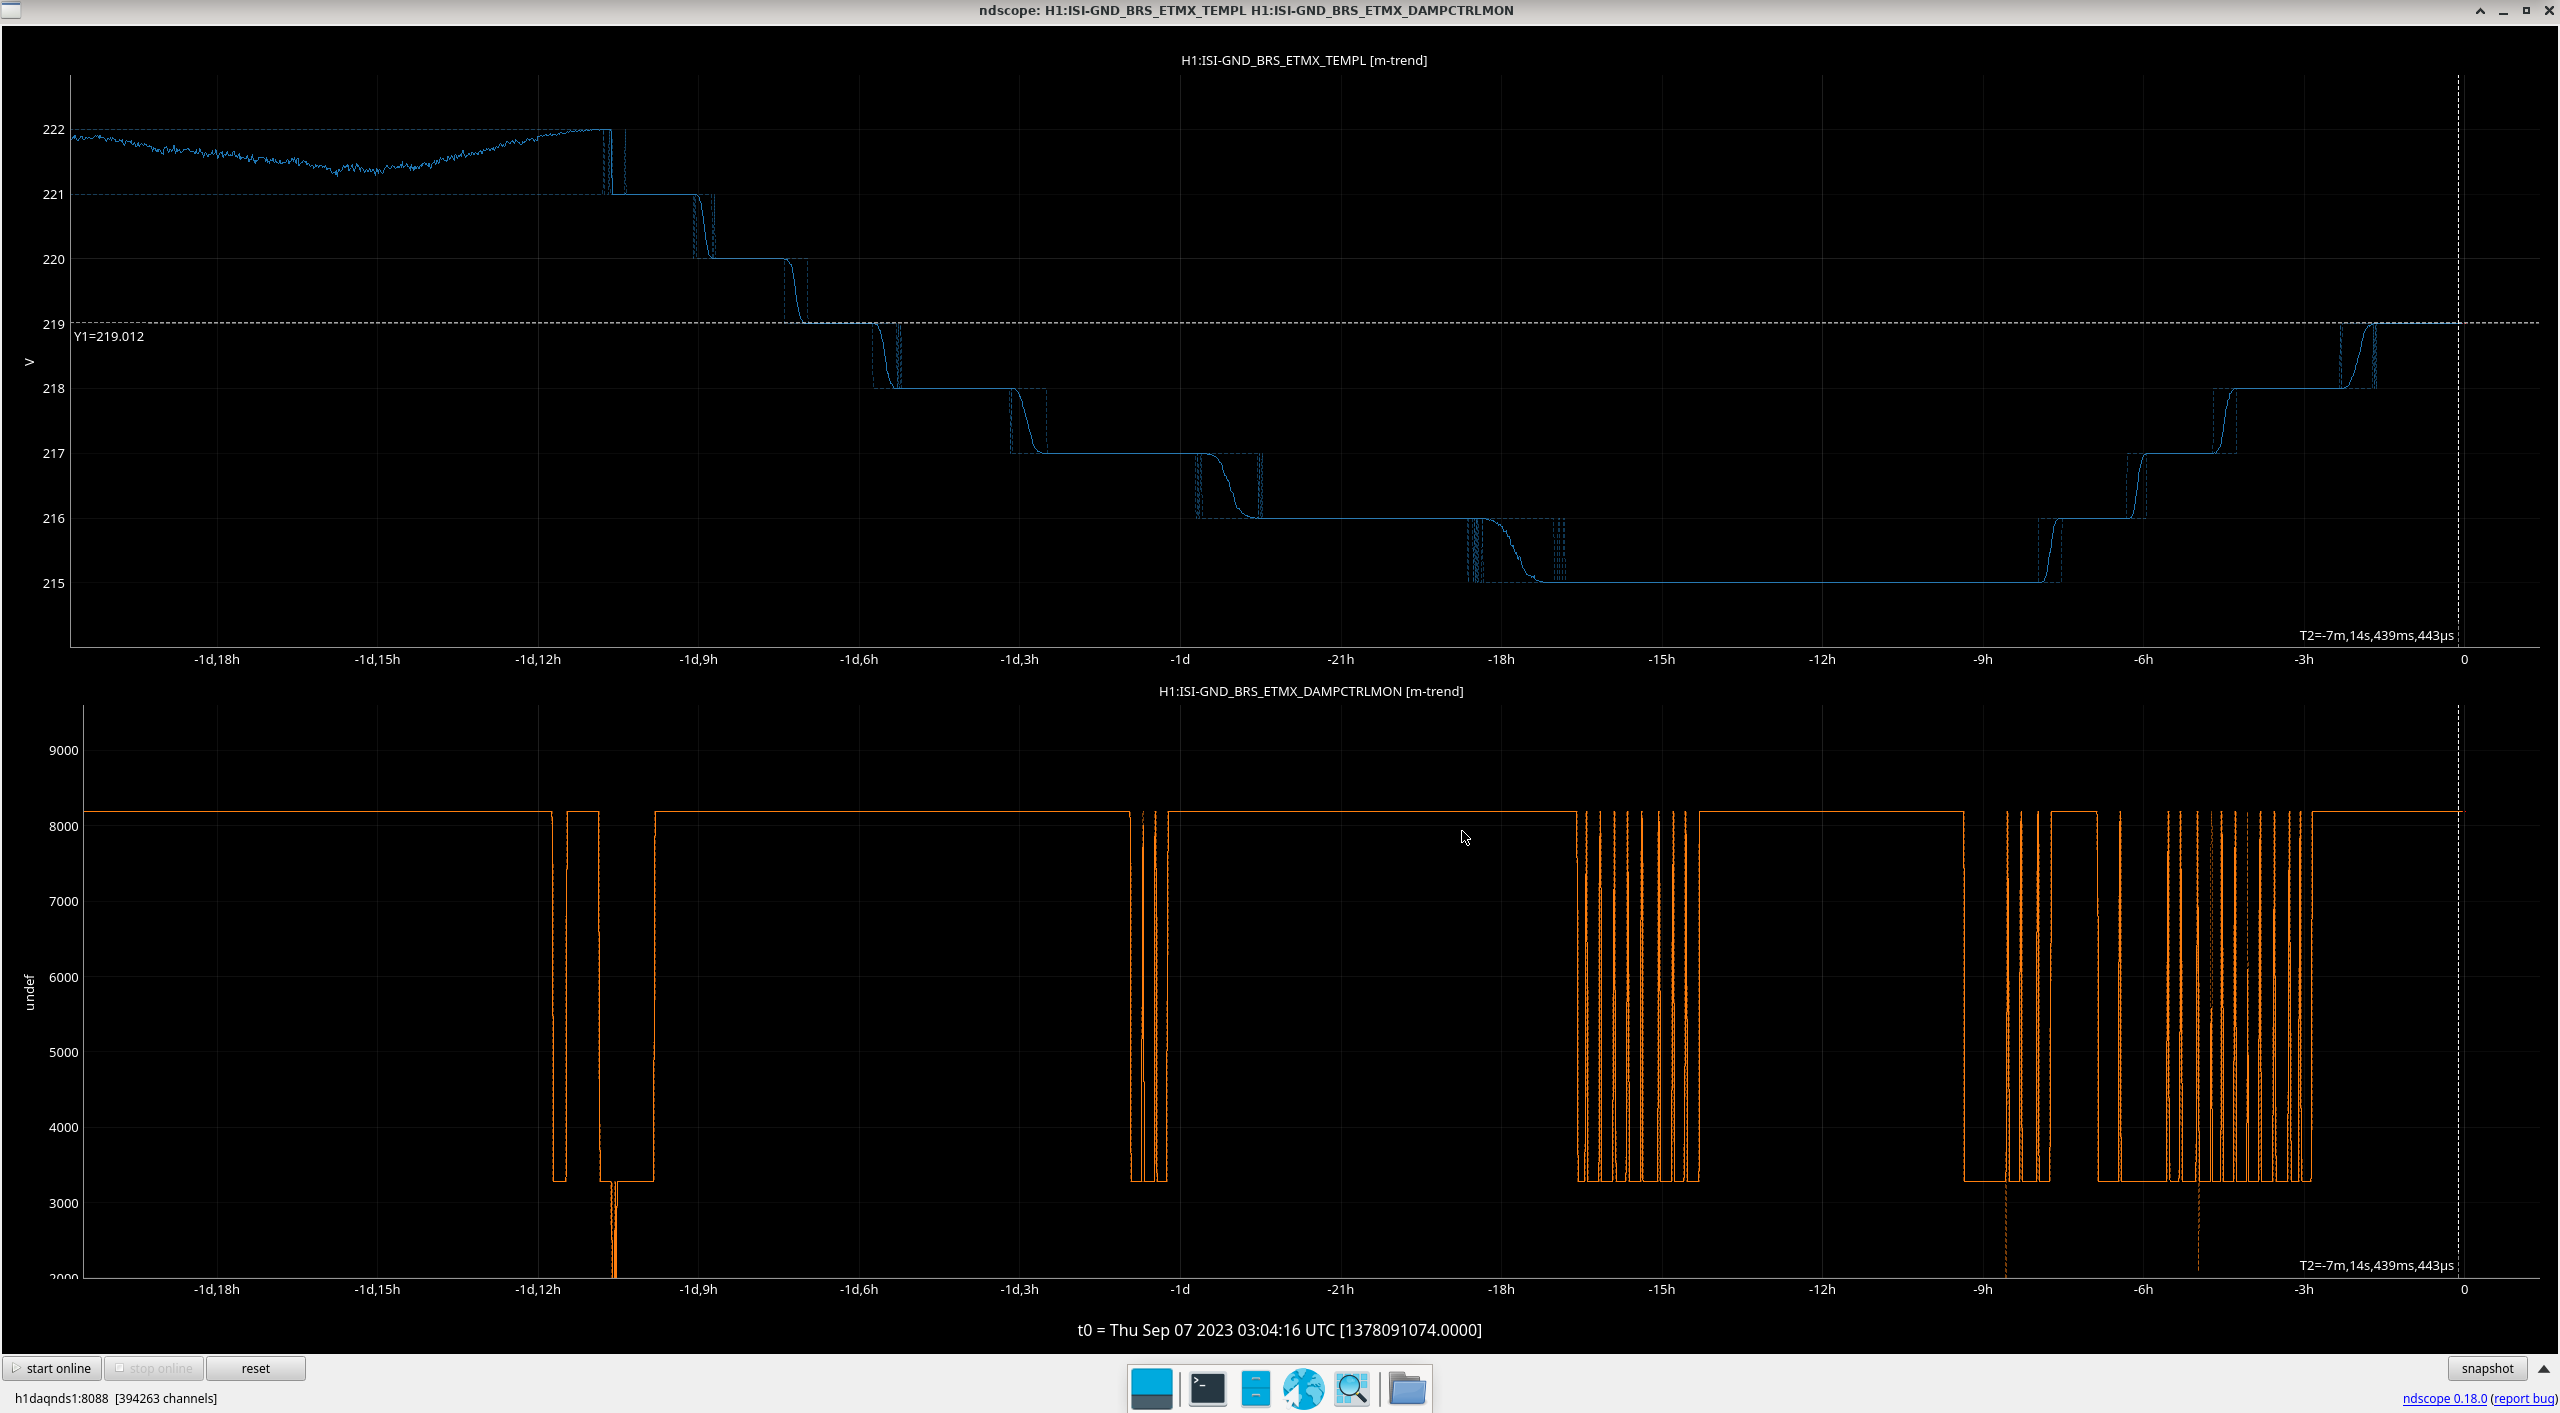
ISI Sensor Correction (BRS Temp - alog 72709)
- On the bright side, BRS temperatures seem to have gone back to normal, prompting the successful automatic activation of ISI Sensor Correction. This happened at 00:16 UTC (15 minuutes after the EQ) when the temp was 21.8 C.
- An hour later, while locking, the temp was 21.9 C (Screenshot 1). Nominal is 22.1 C.
- At the time of this update, BRS temperature is still 21.9 C (Screenshot 2).
- Will post a 3rd screenshot at shift summary with the current temp.
Images attached to this report
Comments related to this report
Before anyone worries we are boiling our brs's, that temp channel is .1 C, so 220=22.0C.
Edited wrong units (you'd have to ask my subconcious how that passed my sanity check).