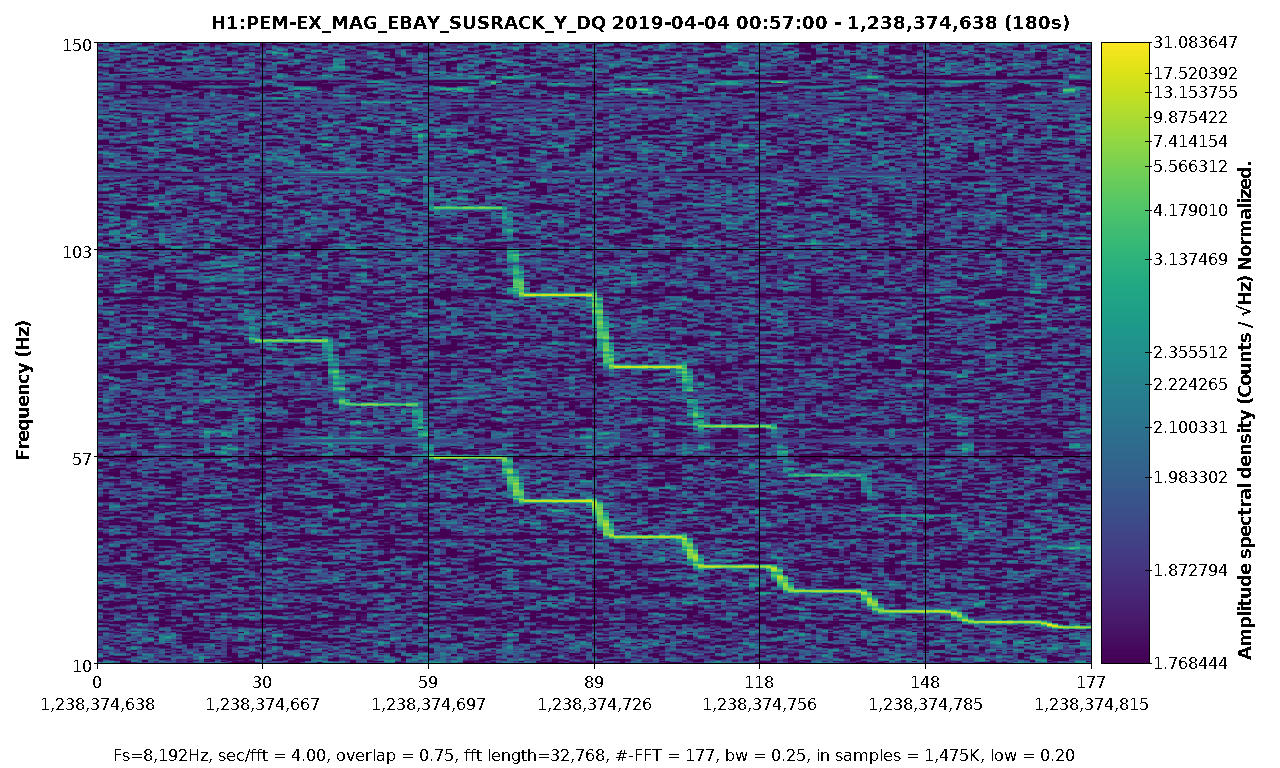
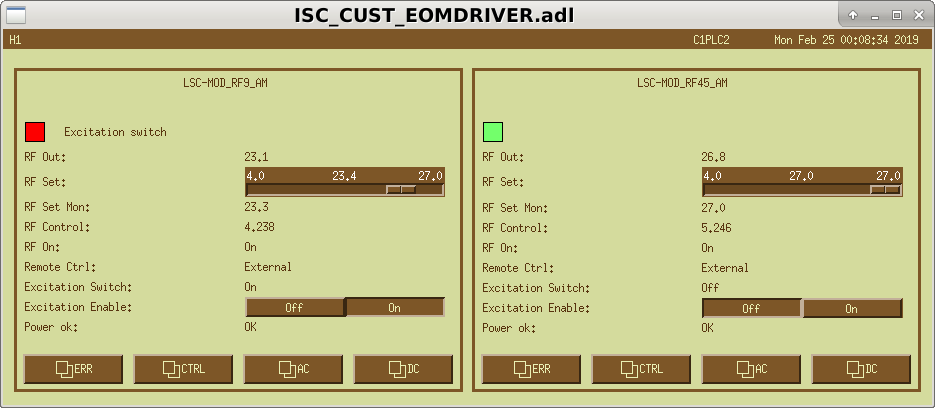
The EX susrack magnetometer (all directions) is unsafe, meaning it picks up signal directly from DARM. Presumably it's picking up the electrical signal from the feedback of DARM to EX. This was determined by Sheila's suggestion of looking at a calibration sweep. We're also analysing the detchar hardware injections, which should show the same thing. We see the calibration sweep appear in the magnetometers below about 100 Hz. The Y direction also sees something at double the frequency. I'm only attaching that spectrogram. Edited to add: The calibration sweep is going through the Y end, so it's not just picking up that.
Ops Shift Transition: 04/16/2019, Owl Shift 07:00 – 15:00 (00:00 -08:00) - UTC (PT)
State of H1: NLN
Intent Bit: Observing
Weather: Low wind
Primary 0.03 – 0.1Hz: 0.02 um/s
Secondary 0.1 – 0.3Hz: 0.15 um/s
Outgoing Operator: Patrick
Quick Summary: In Observing for close to an hour when I took over. Microseism decreasing over the last 24 hours.
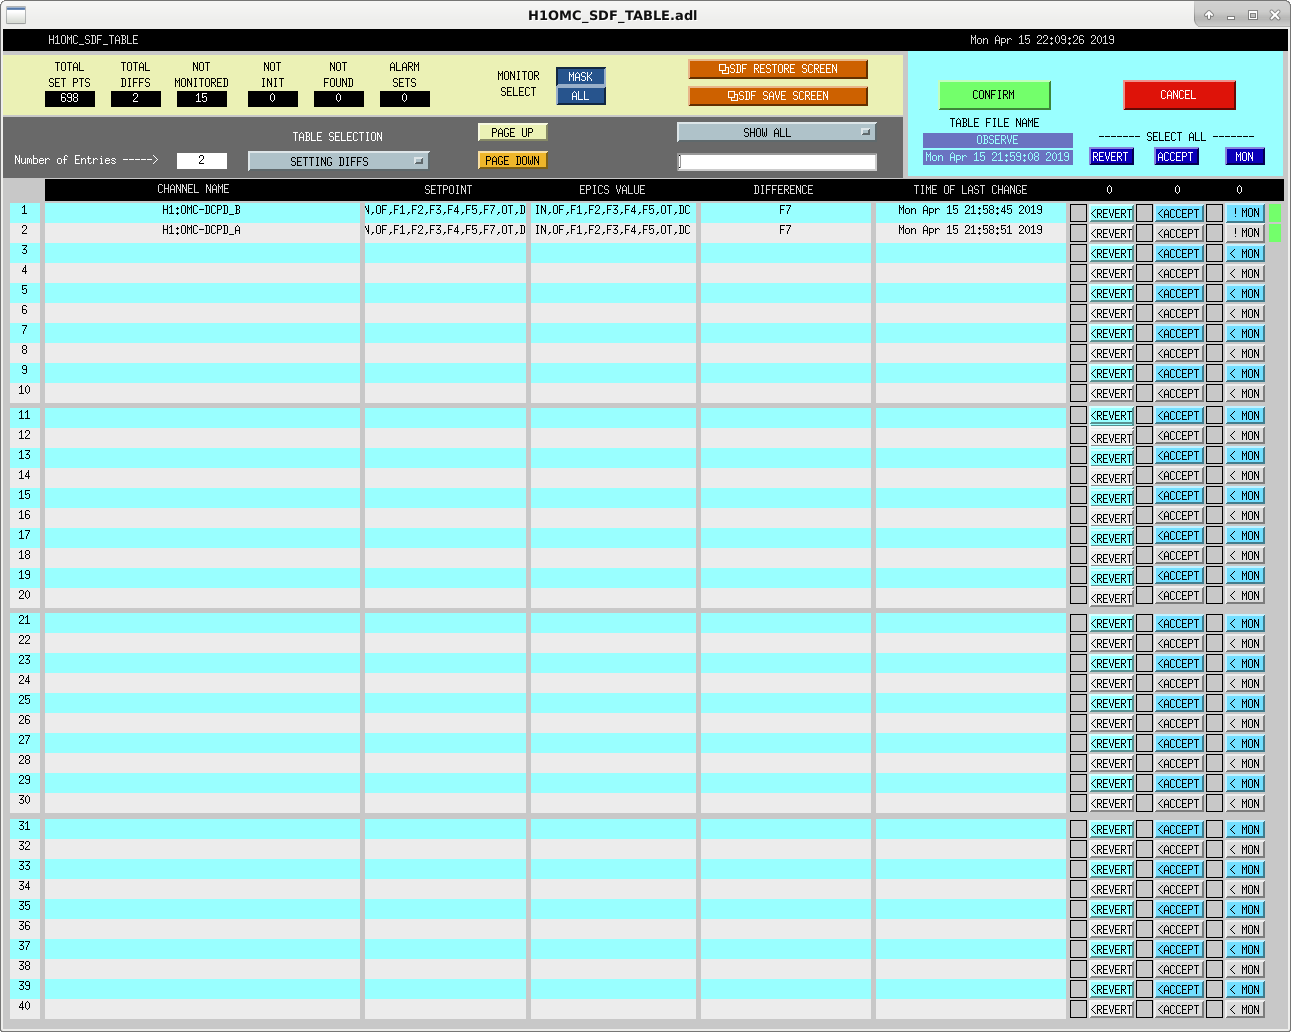
TITLE: 04/15 Eve Shift: 23:00-07:00 UTC (16:00-00:00 PST), all times posted in UTC STATE of H1: Observing at 107Mpc INCOMING OPERATOR: Niko SHIFT SUMMARY: Rough night for locking. See log. LOG: 23:36 UTC Lock loss 00:06 UTC Stopped at PREP_DC_READOUT_TRANSITION. Commissioning resuming. 02:01 - 2:05 UTC Sheila to LVEA, setting DC PD transimpedance back to normal 02:07 UTC Lock loss 02:41 UTC Lock loss from ENGAGE_ASC_FOR_FULL_IFO 02:42 UTC Initial alignment 03:54 UTC Initial alignment done 04:16 UTC Lock loss from DARM_TO_DC_READOUT 05:11 UTC Broke lock reverting SDF differences at NLN (alog 48518) X arm green transmission keeps falling off Going to try an initial alignment of just green arms 05:28 UTC Finished alignment and offloading of green arms. Relocking. Initial alignment of green arms seems to have helped. Able to move past ALS without X arm transmission falling off. Stopped at PRMI and aligned BS and PRM, but lost lock after a poor acquisition of DRMI Another poor acquisition of DRMI but was able to adjust SRM in time to fix it before it broke lock 06:07 UTC NLN. No SDF differences. 06:08 UTC Observing 06:10 UTC Dropped out of observing by squeezer. CLF unlocked. Fixed by hitting init, down, etc on various squeezer guardians and then 'caput H1:SYS-MOTION_C_BDIV_C_OPEN 1' when it was trying to lock OMC 06:19 UTC Observing
06:08 UTC No SDF differences.
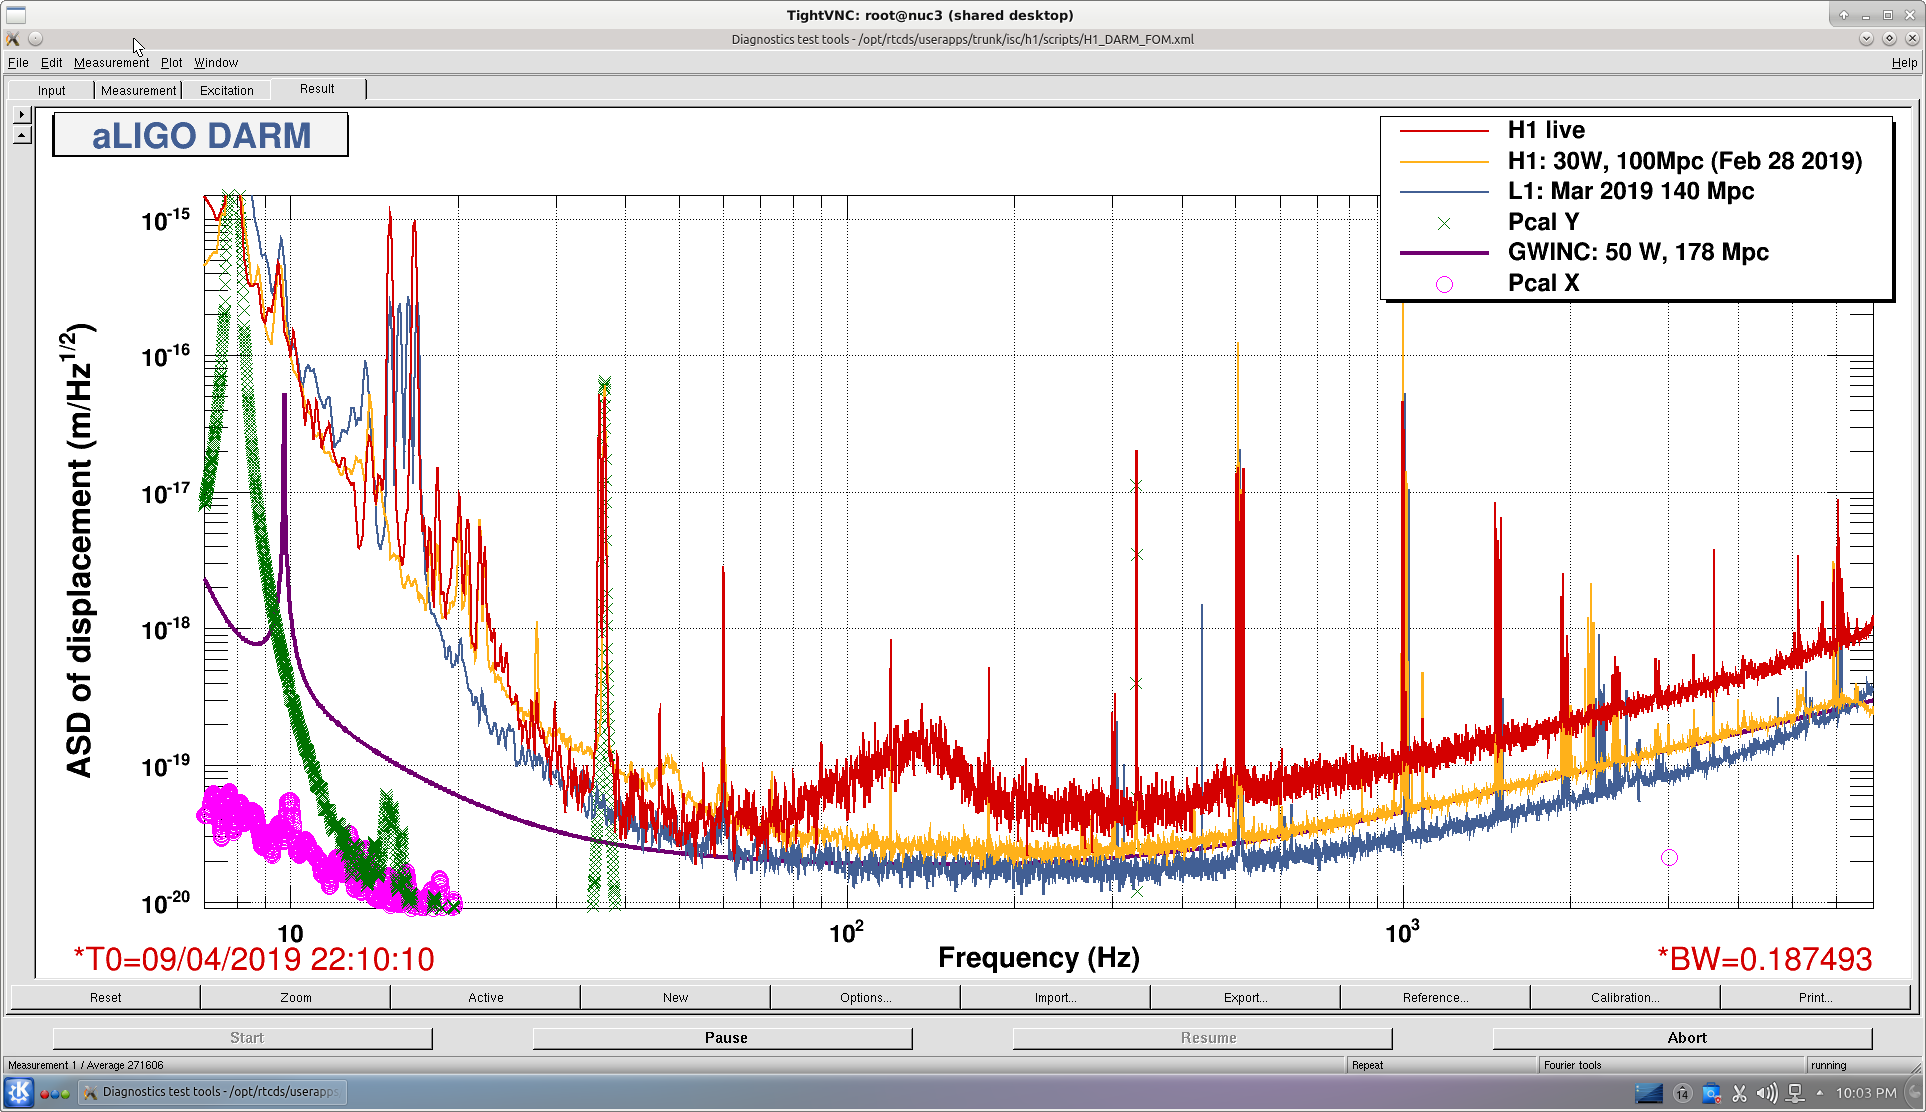
DARM has odd spectrum (see attached). Suspect squeezer guardian is not at nominal.
Commissioning is done for the night. Running through initial alignment.
Sheila, Danny
Today we took about 5 hours out of observing in order to do a series of OMC scans. The measurements were heavily inspired by what Dan Hoak did in alog 22175.
What I wanted to see from these scans was a direct effect of the high spatial frequency optical path distortion on the carrier and 9 MHz and 45MHz sidebands. My attempt to accomplish this required the following:
Another separate but relevant measurement was to measure the field content at the AS port with a 35W thermal state. Because we did not want to damage the PD by scanning at 35W we let the interferometer thermalize at 35W and dropped down to 10W to take scans. It is important to note that it was not trivial to power up to 35W on DC readout and transition back to RF hence the large amount of time out of observing. Because of time constraints, the thermalization criteria had to be an hour and a half at 35W rather than 2+ hours which should be good enough for this measurement.
Results from the scans are pending and will be posted in a comment on this log entry.
This is just a summary so that this is written in one place in the log:
Koji measured the modulation depths for 9 and 45 MHz using an OSA after installing the new EOM: 41435 For the 9 MHz Koji measured gamma =0.191 for an epics setting of 23.6dBm, which is used during lock acquisition. We reduce this in low noise to 20dBm, giving us the final modulation depth of 0.1352 (That is the whole story for 9MHz).
After that Daniel and company moved the EOM driver out of the PSL enclosure and added an RF combiner/amplifier, (41889) which increased the drive power for 45MHz by +1.83dBm compared to the time of Koji's measurement. The modulation depth measured with an epics setting of 27dBm (used for lock acquisition) should have a modulation depth of 0.243 assuming the EOM response measured by Koji. In low noise we use an EPICS setting of 24dBm, so we should expect 0.172 modulation depth for 45 in full lock. (These numbers are a little different from Daniels because he used the EOM response from G1800724 rather than Koji's measurement).
Craig and Georgia also measured modulation depths by exciting RFAM and measuring intensity noise after the OMC (47113) but those results aren't agreeing well with the numbers that Koji and Daniel posted.
The above is wrong! Let me try again:
Koji measured the modulation depths for 9 and 45 MHz using an OSA after installing the new EOM: 41435
9 MHz:
For the 9 MHz Koji measured gamma =0.191 radians for an epics setting of 23.6dBm, meaning that we are getting 0.220 rad/V. Durring lock acquistion we are now using 23.4dBm out of the EOM driver, meaning that our acquisition modulation depth is now 0.189 rad, in low noise we are using 20.4dBm meaning that our modulation depth is 0.159 radians in low noise
45 MHz:
Koji's measurement for 45 MHz indicates that 0.239 rad/V delivered to the EOM (which is different from the epics setting, which was 27dBm at that time). After that Daniel and company moved the EOM driver out of the PSL enclosure and added an RF combiner/amplifier, (41889) which increased the drive power for 45MHz by +1.83dBm for the same epics setting compared to the time of Koji's measurement. The modulation depth measured with an epics setting of 27dBm (used for lock acquisition) should have a modulation depth of 0.233 assuming the EOM response measured by Koji. In low noise we use an EPICS setting of 24dBm, so we should expect 0.177 modulation depth for 45 in full lock. (These numbers are a little different from Daniels because he used the EOM response from G1800724 rather than Koji's measurement).
Craig and Georgia also measured modulation depths by exciting RFAM and measuring intensity noise after the OMC (47113) but those results aren't agreeing well with the numbers that Koji and Daniel posted.
Pep Covas, Jeff Kissel
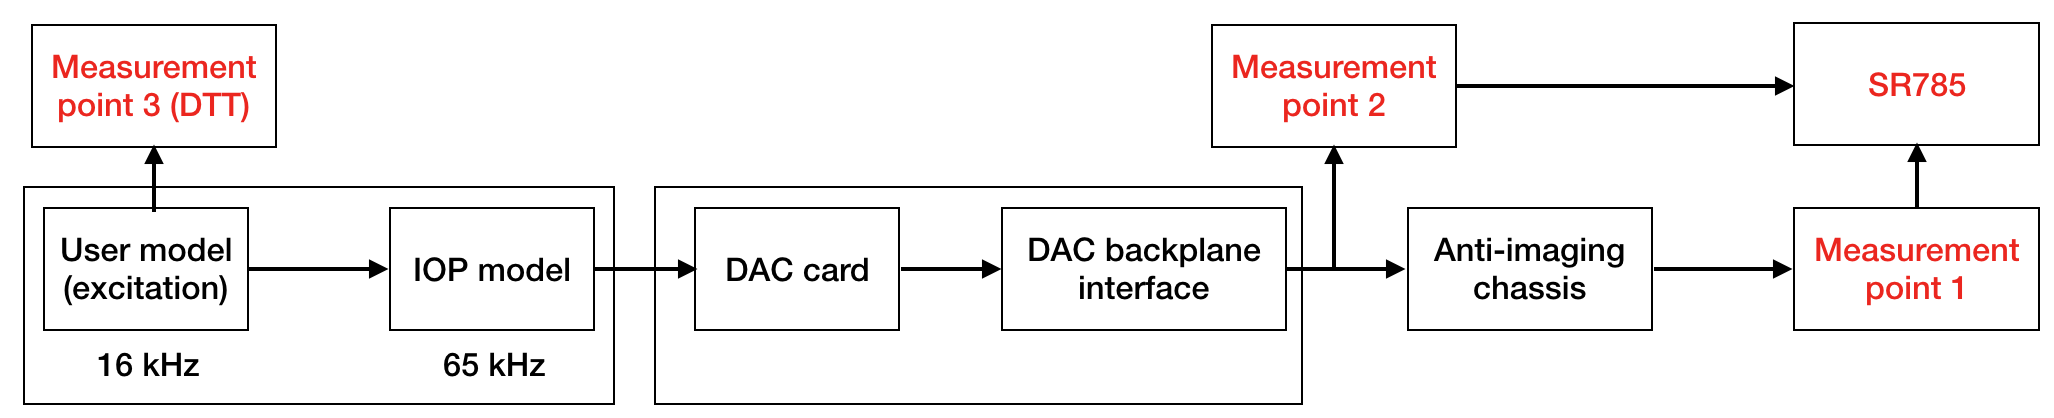
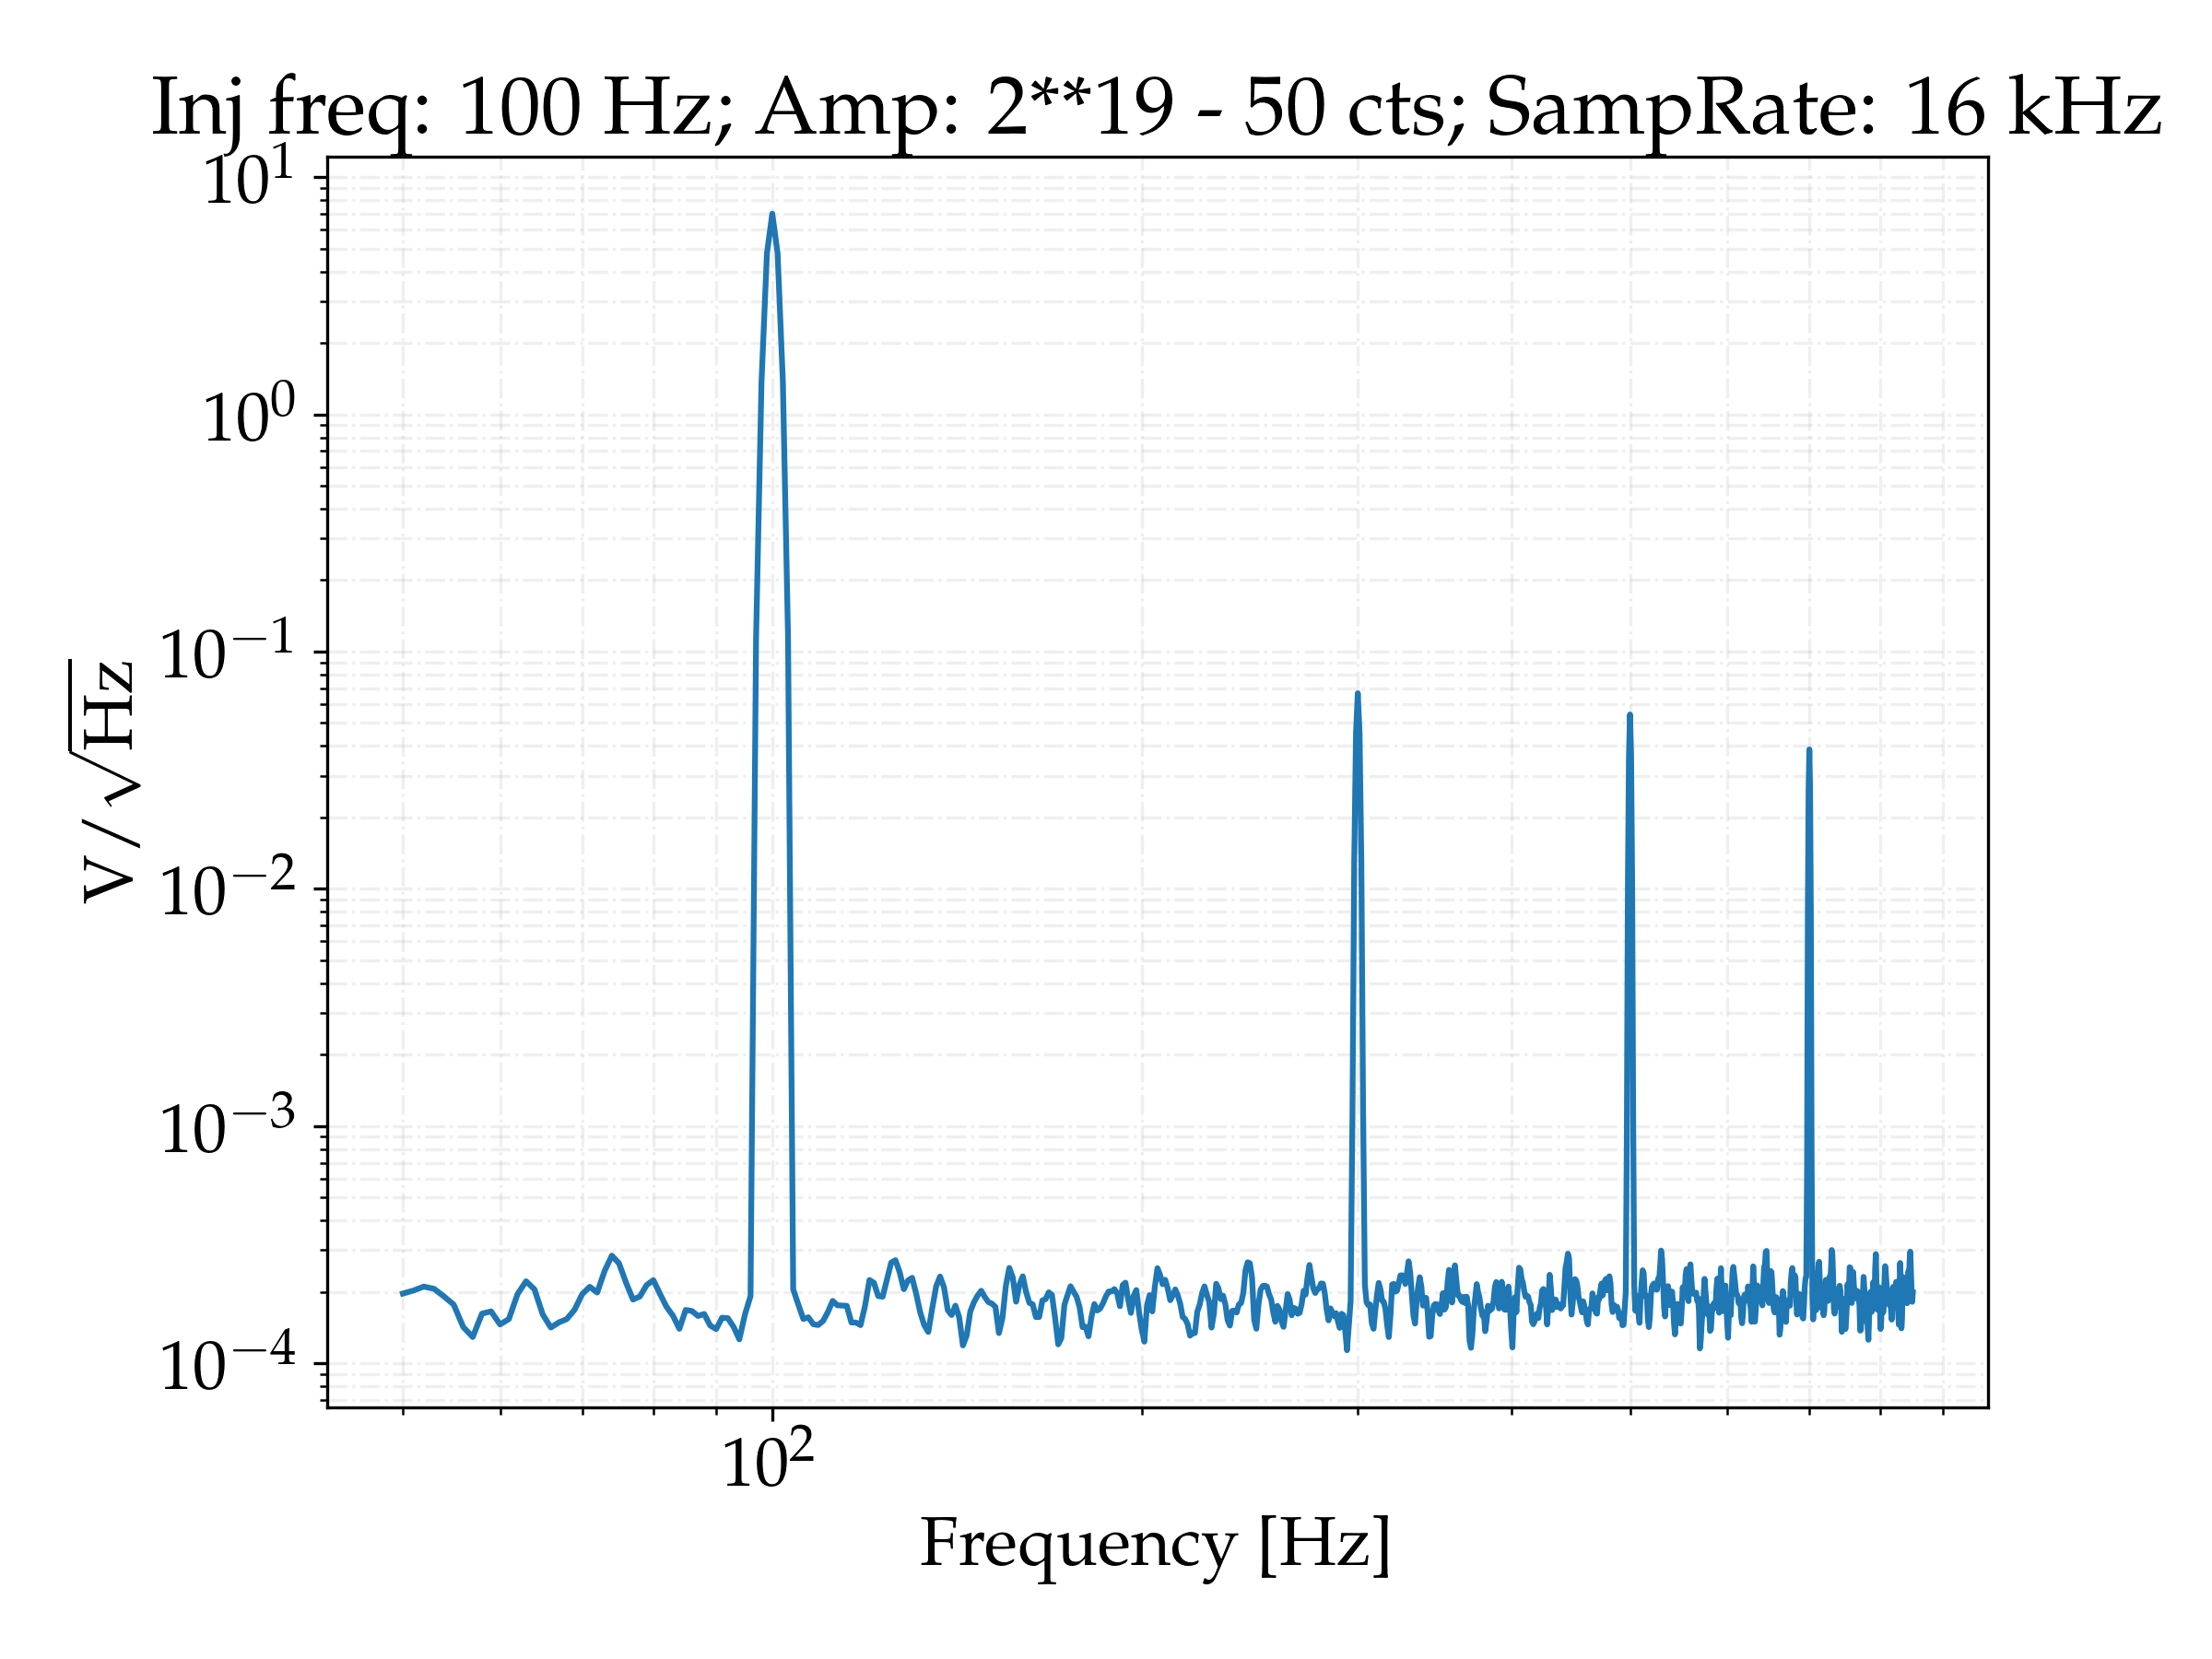
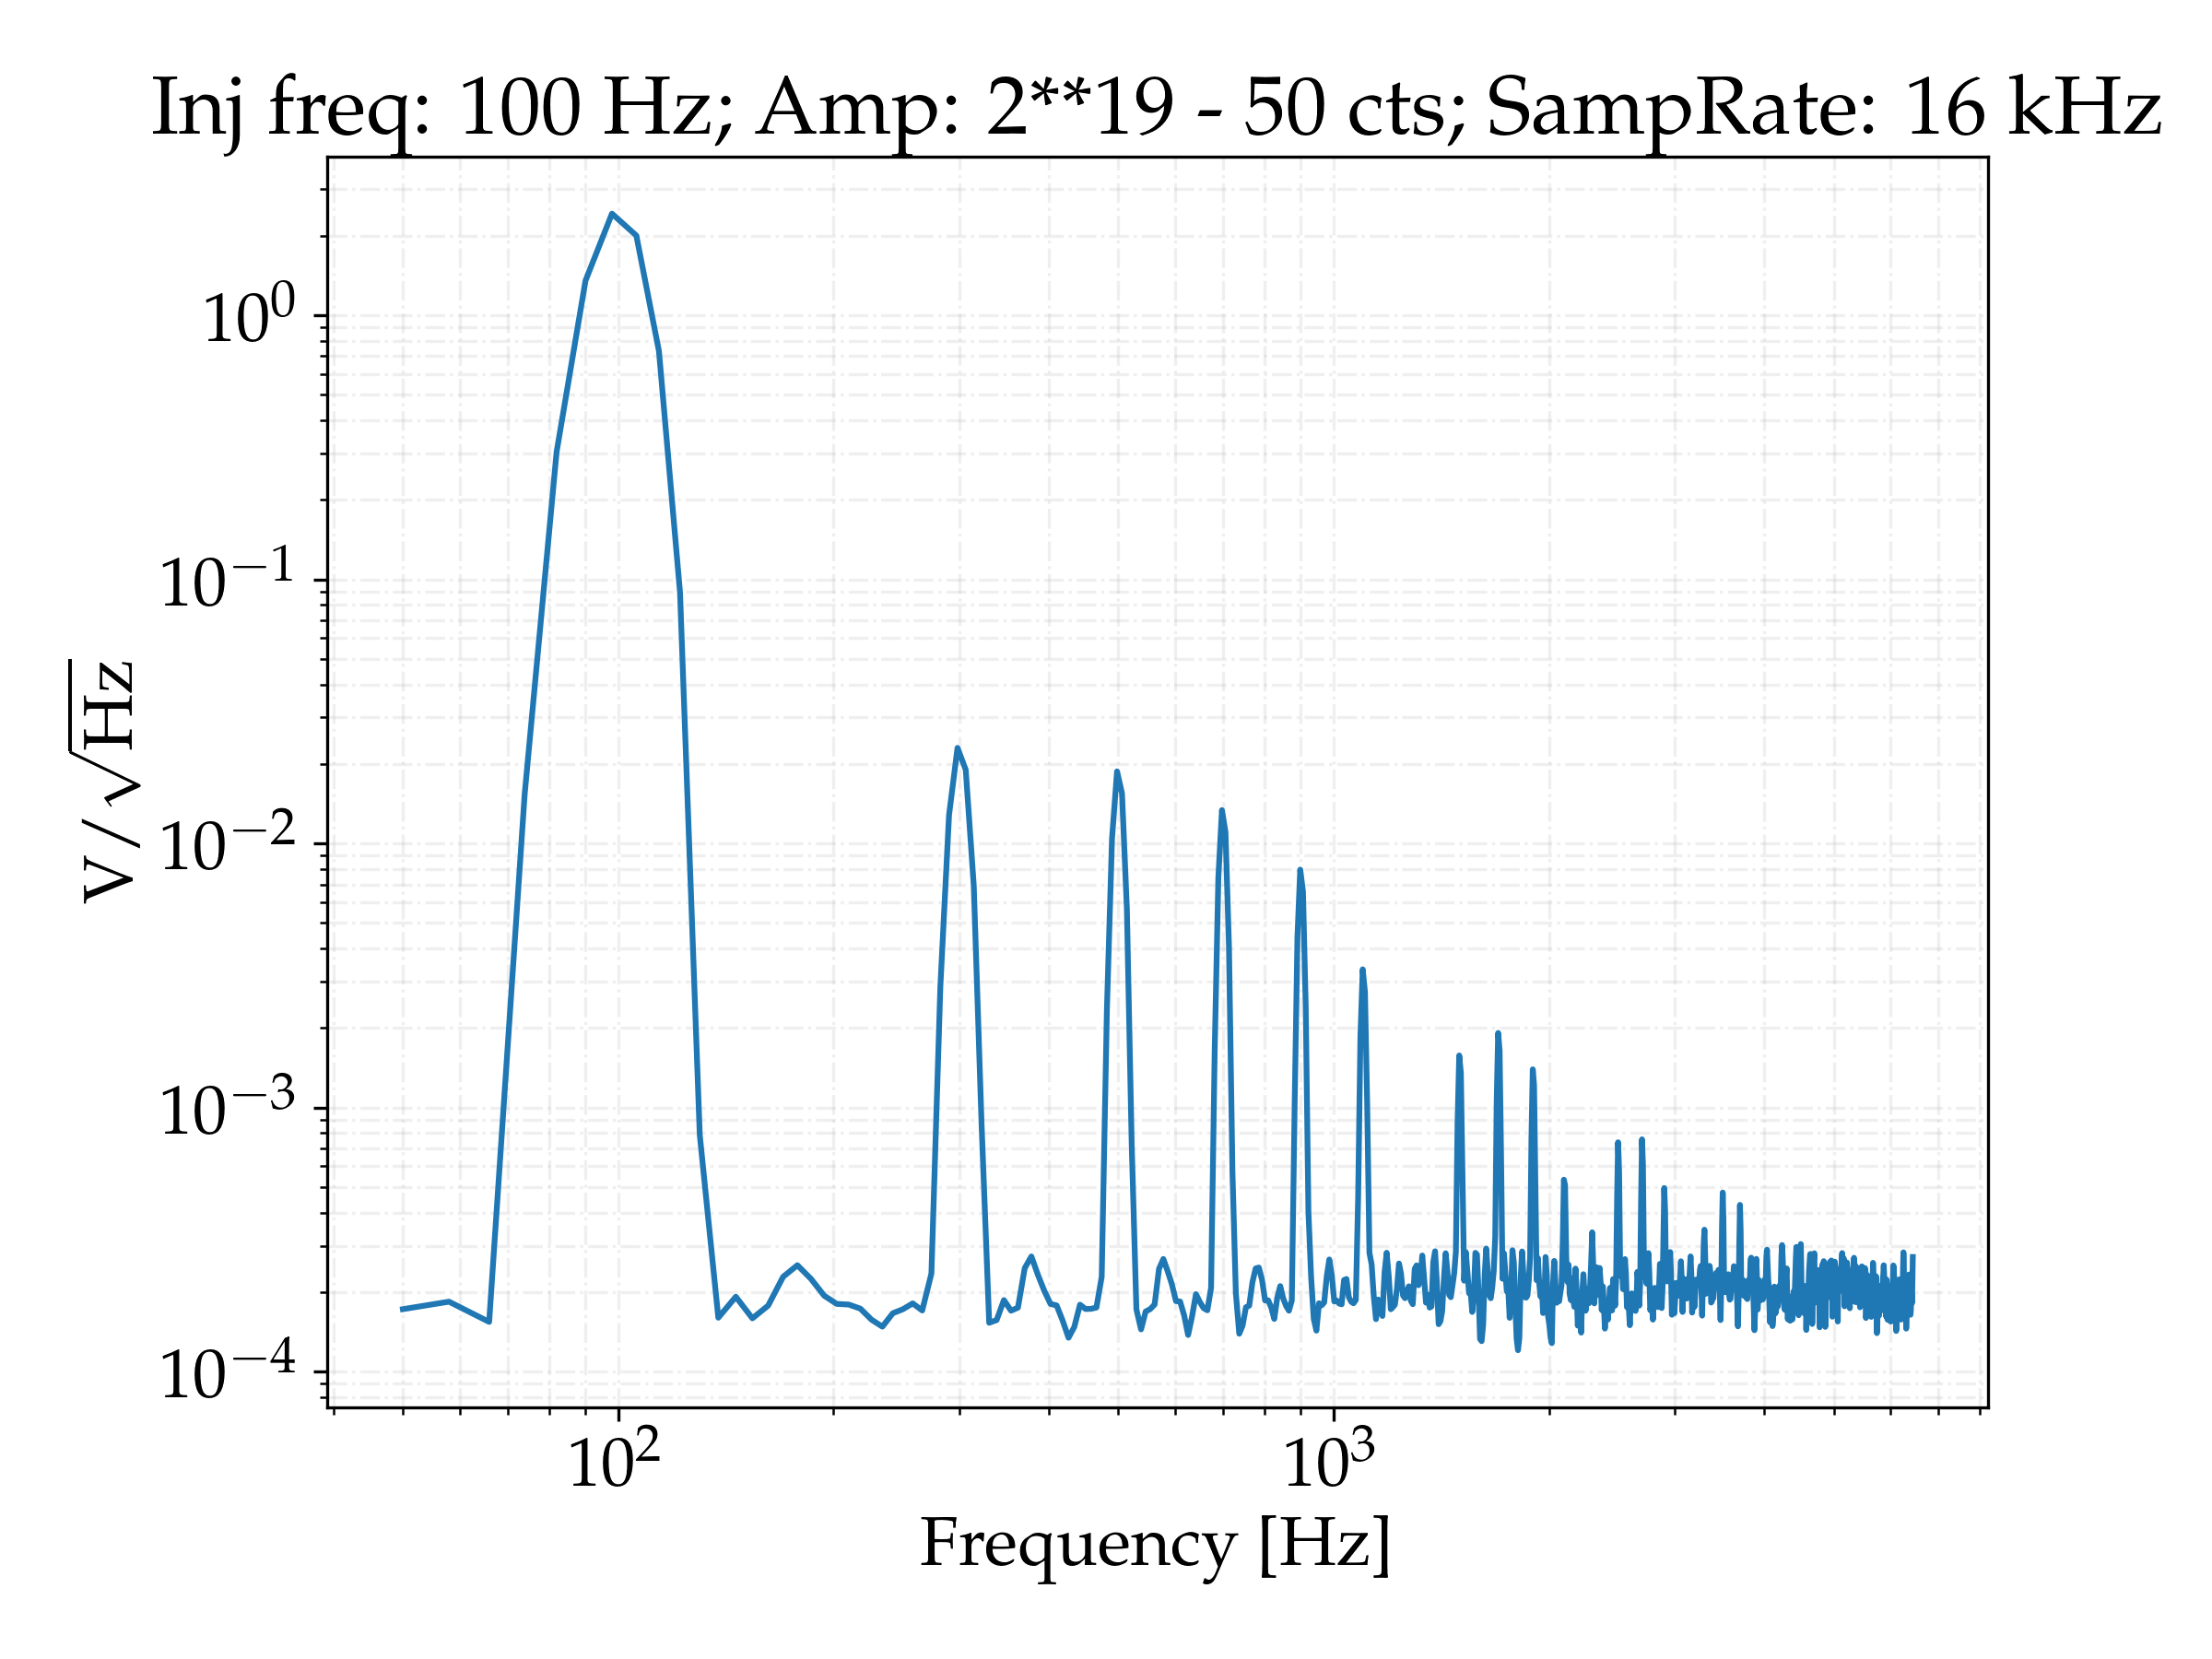
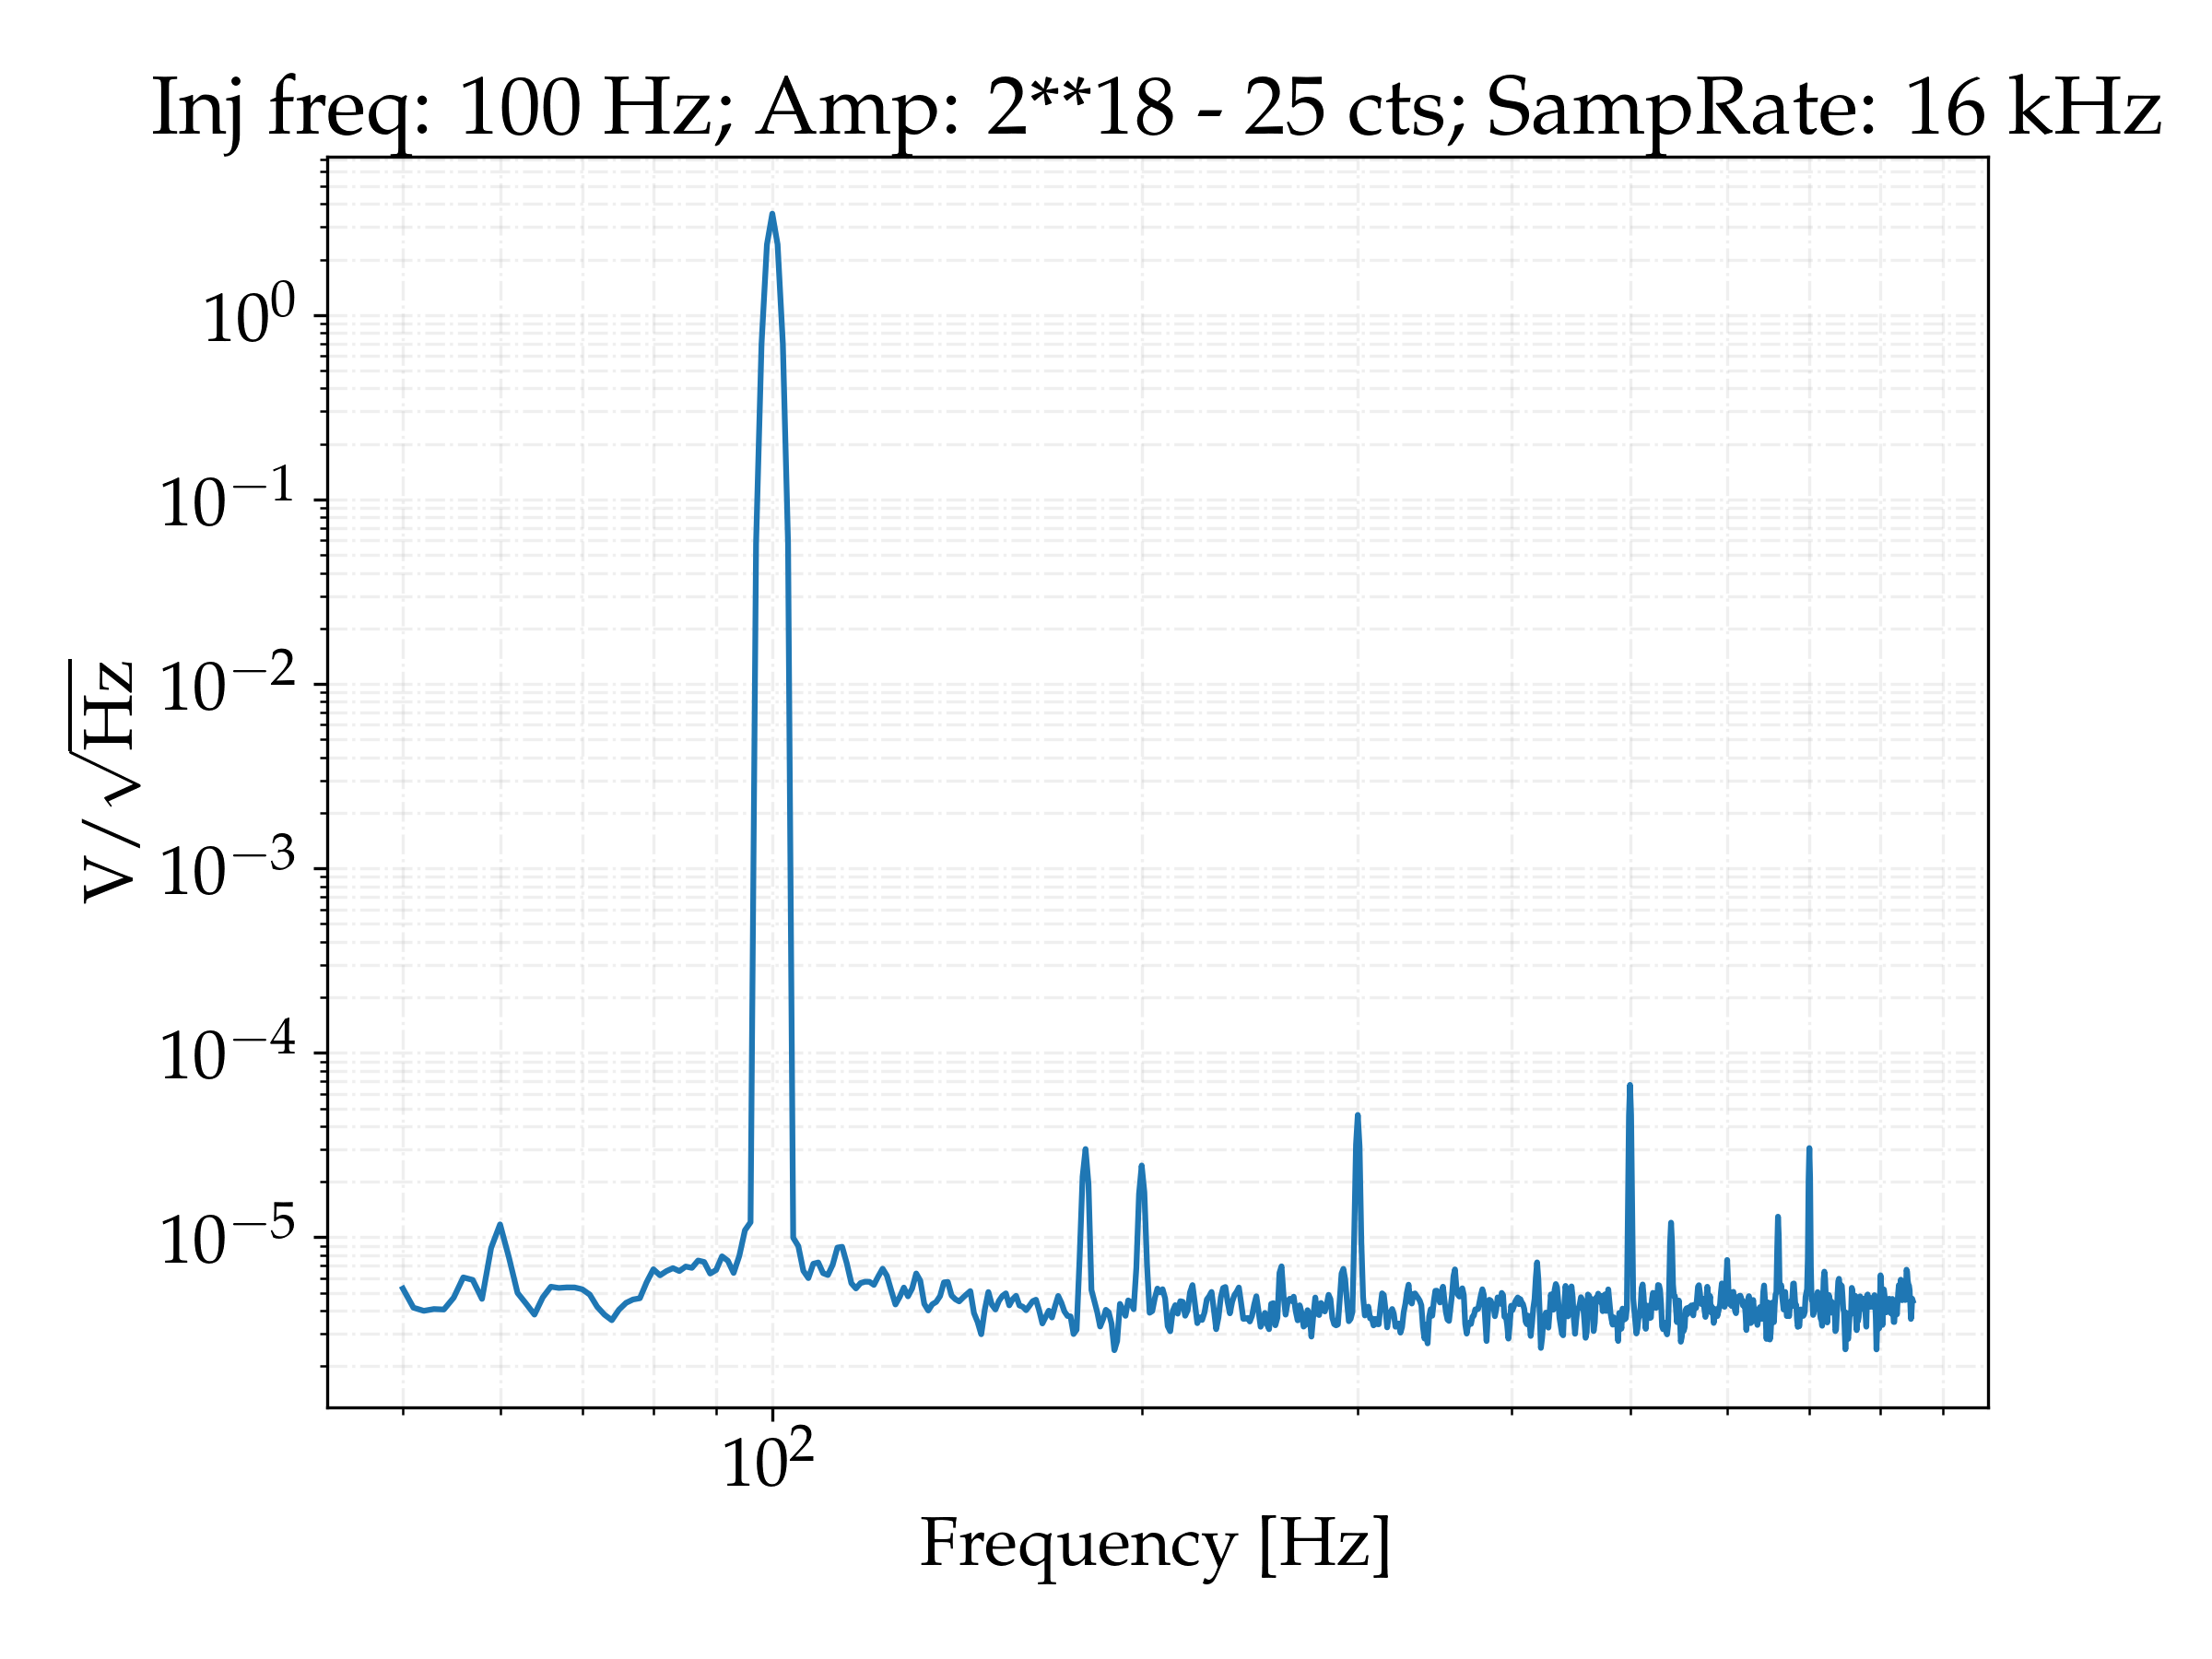
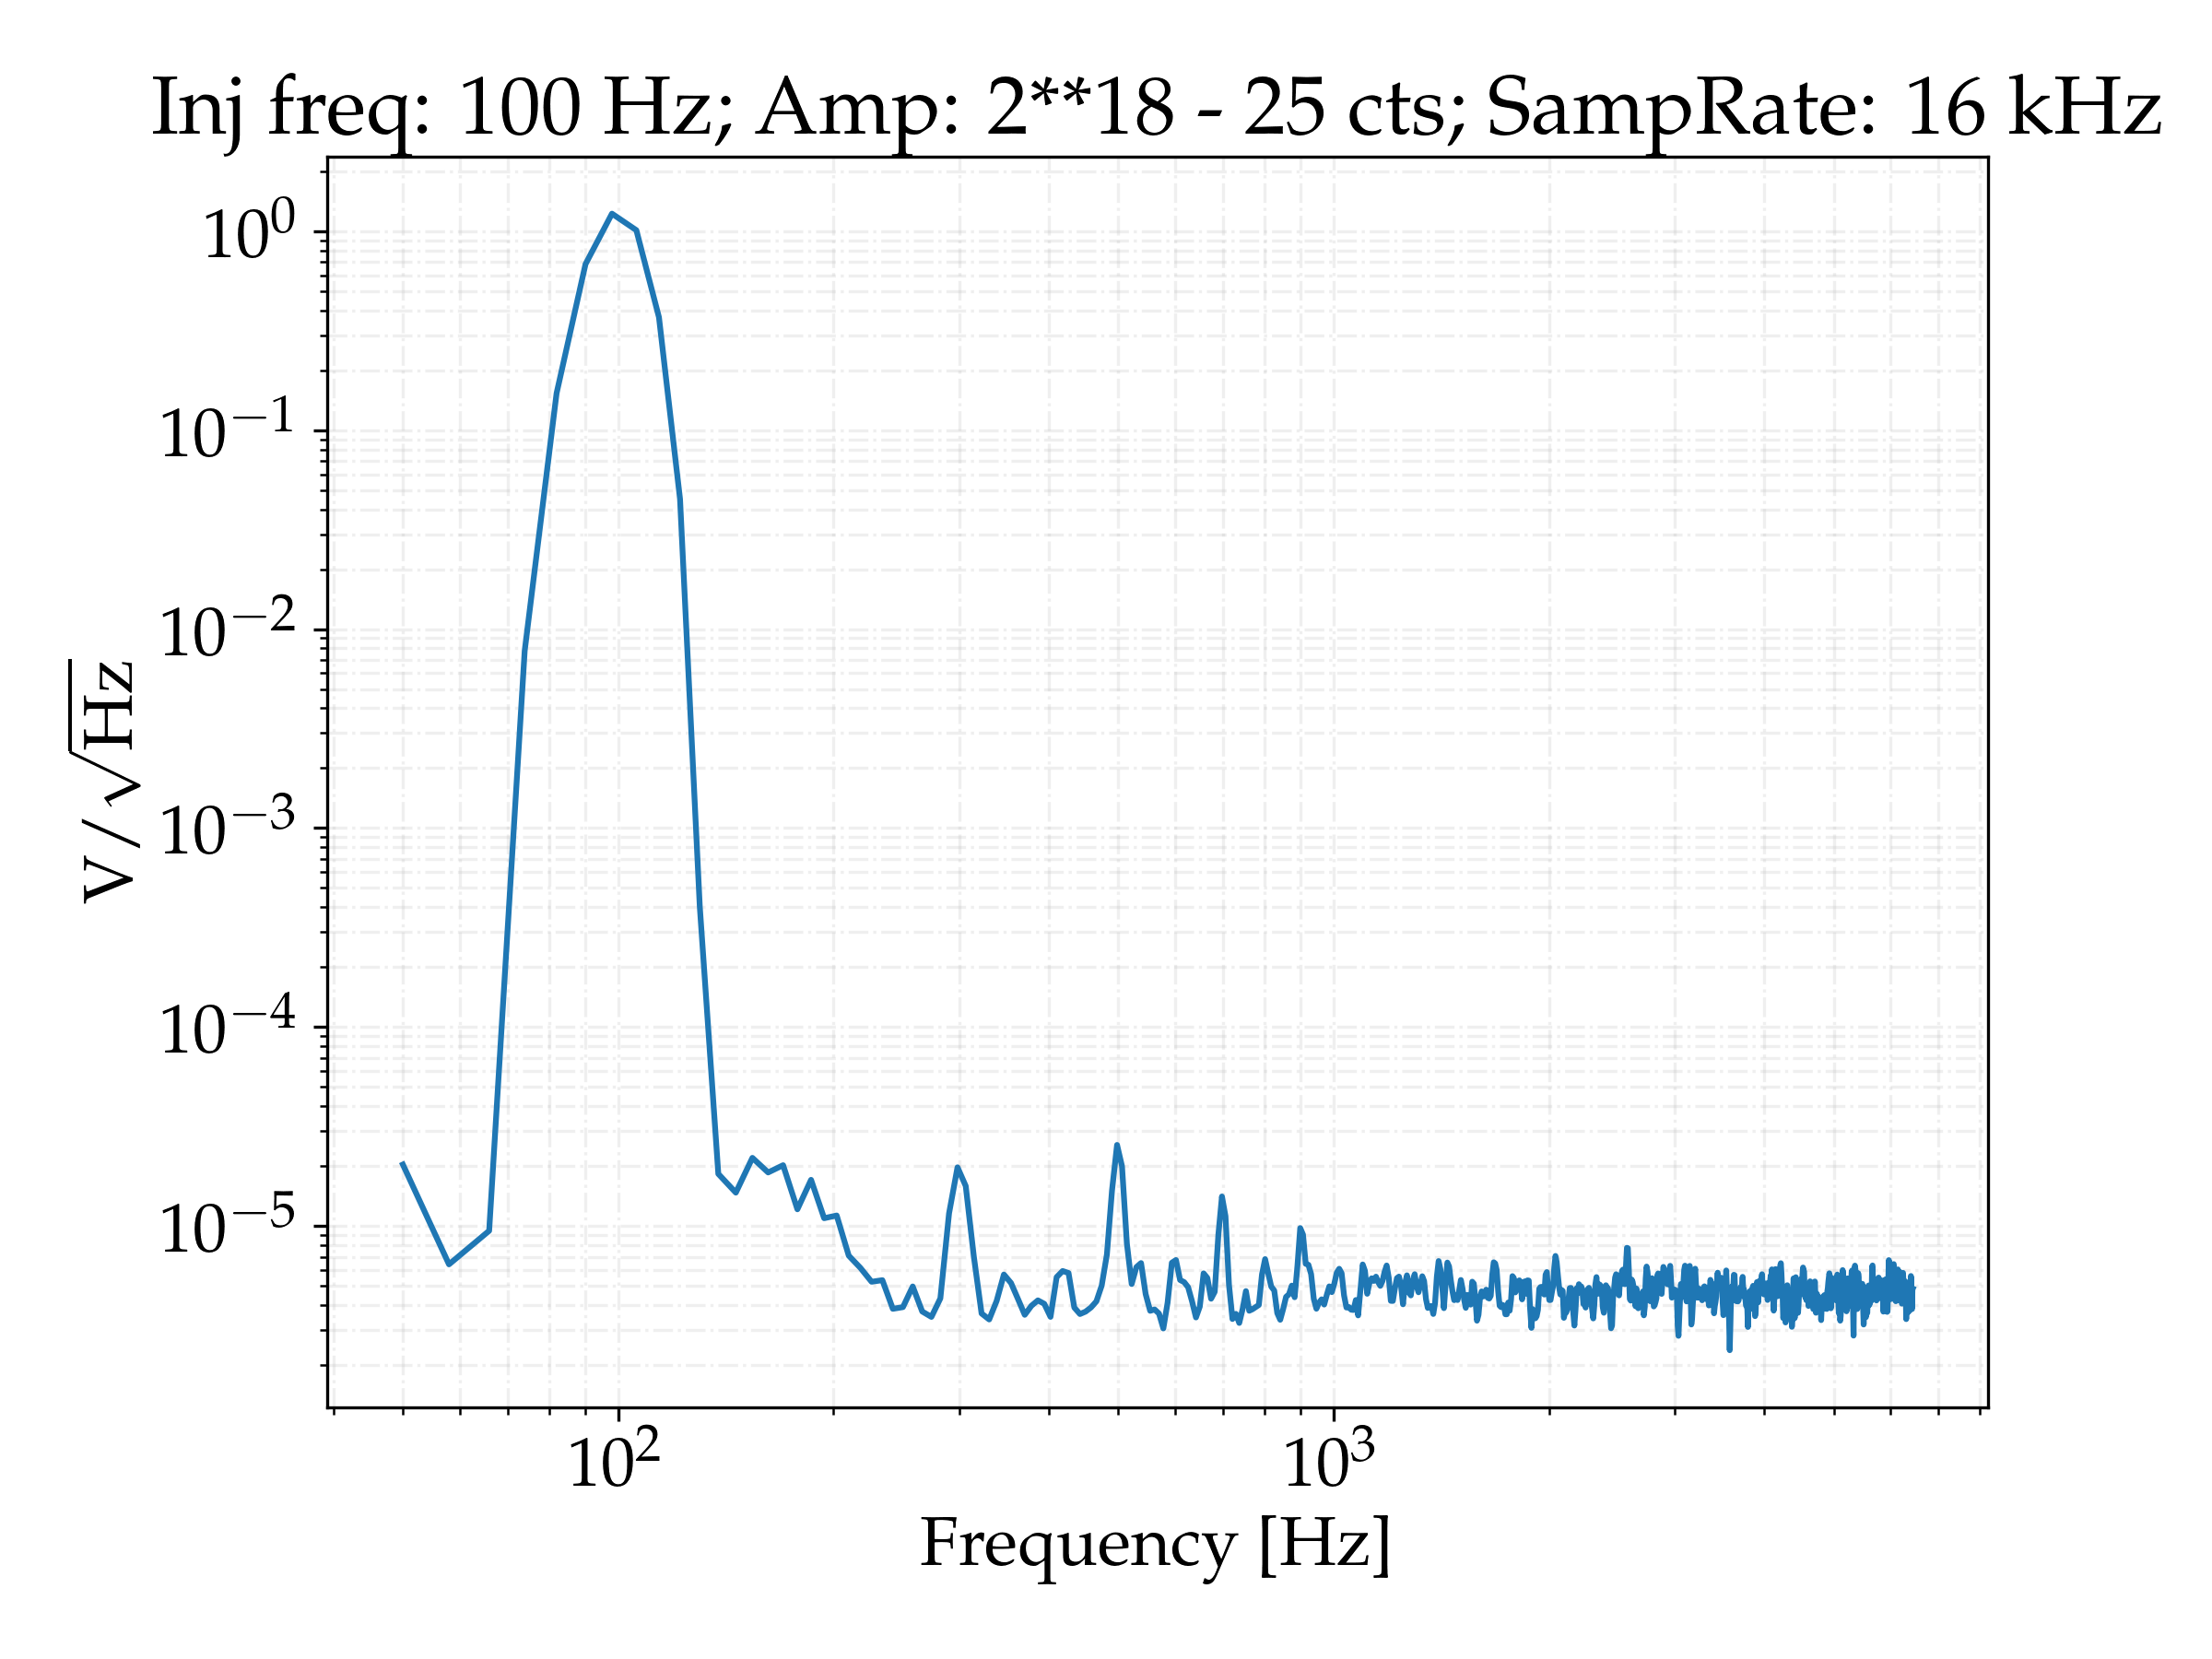
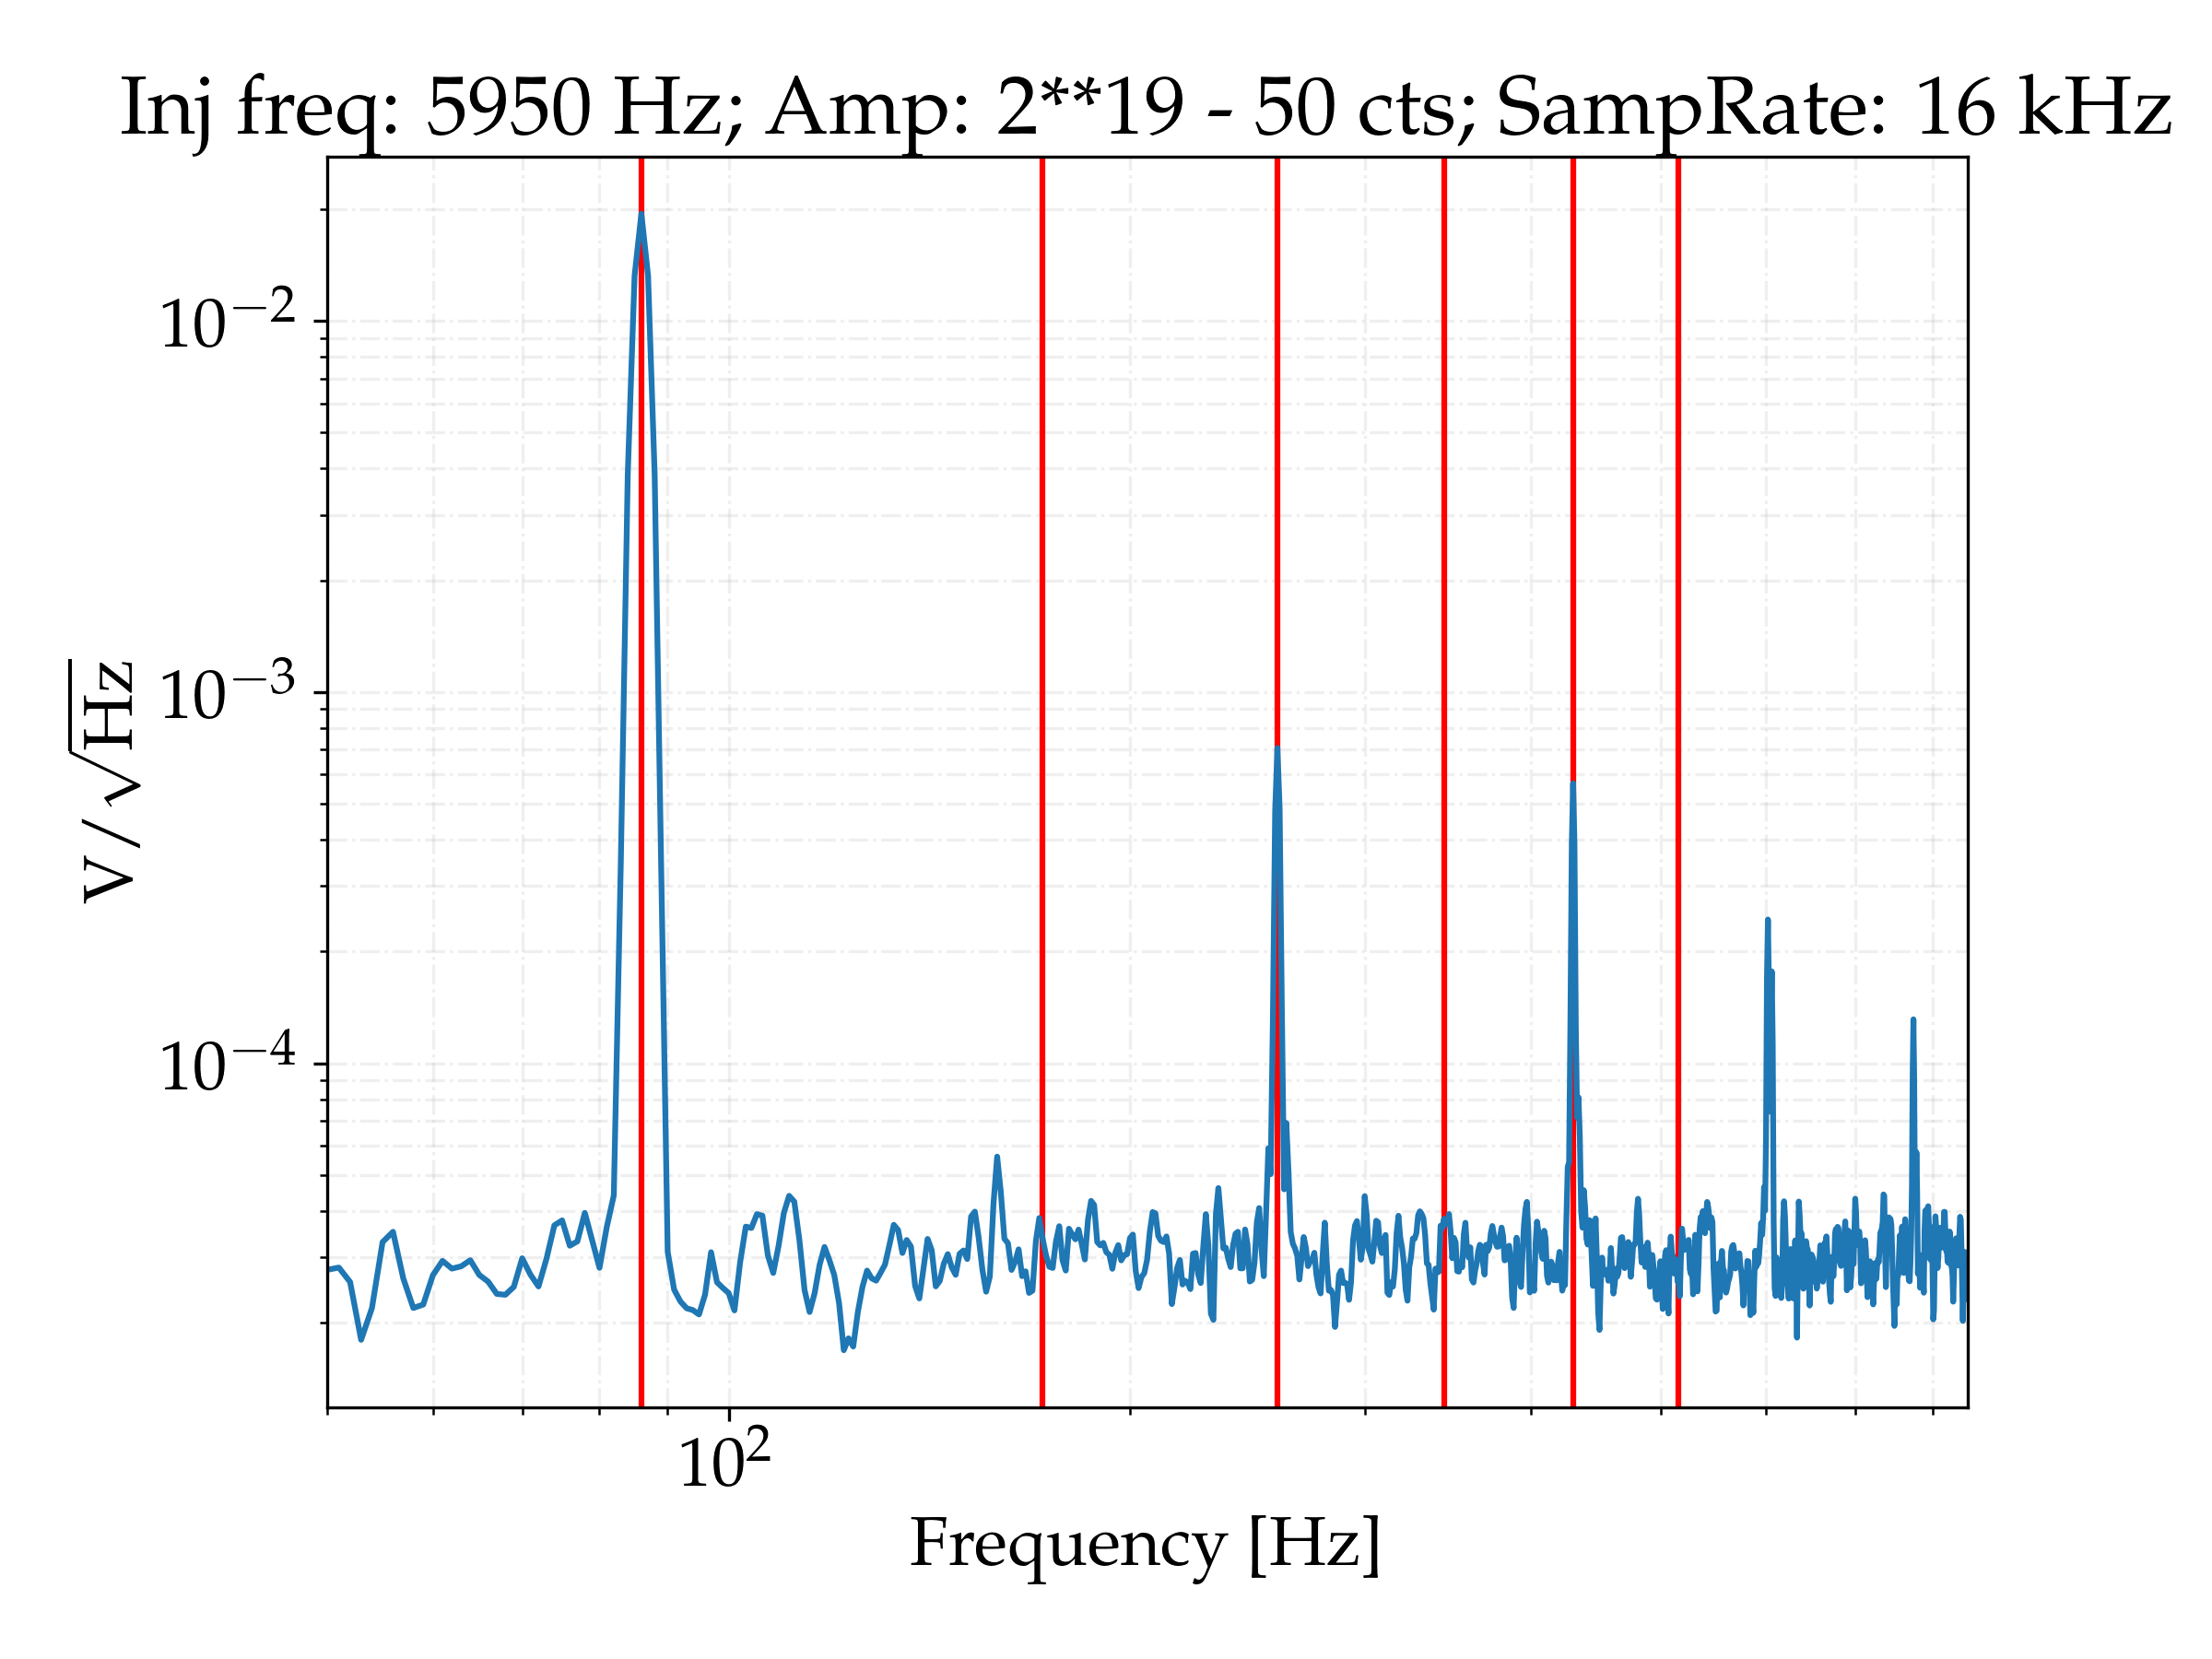
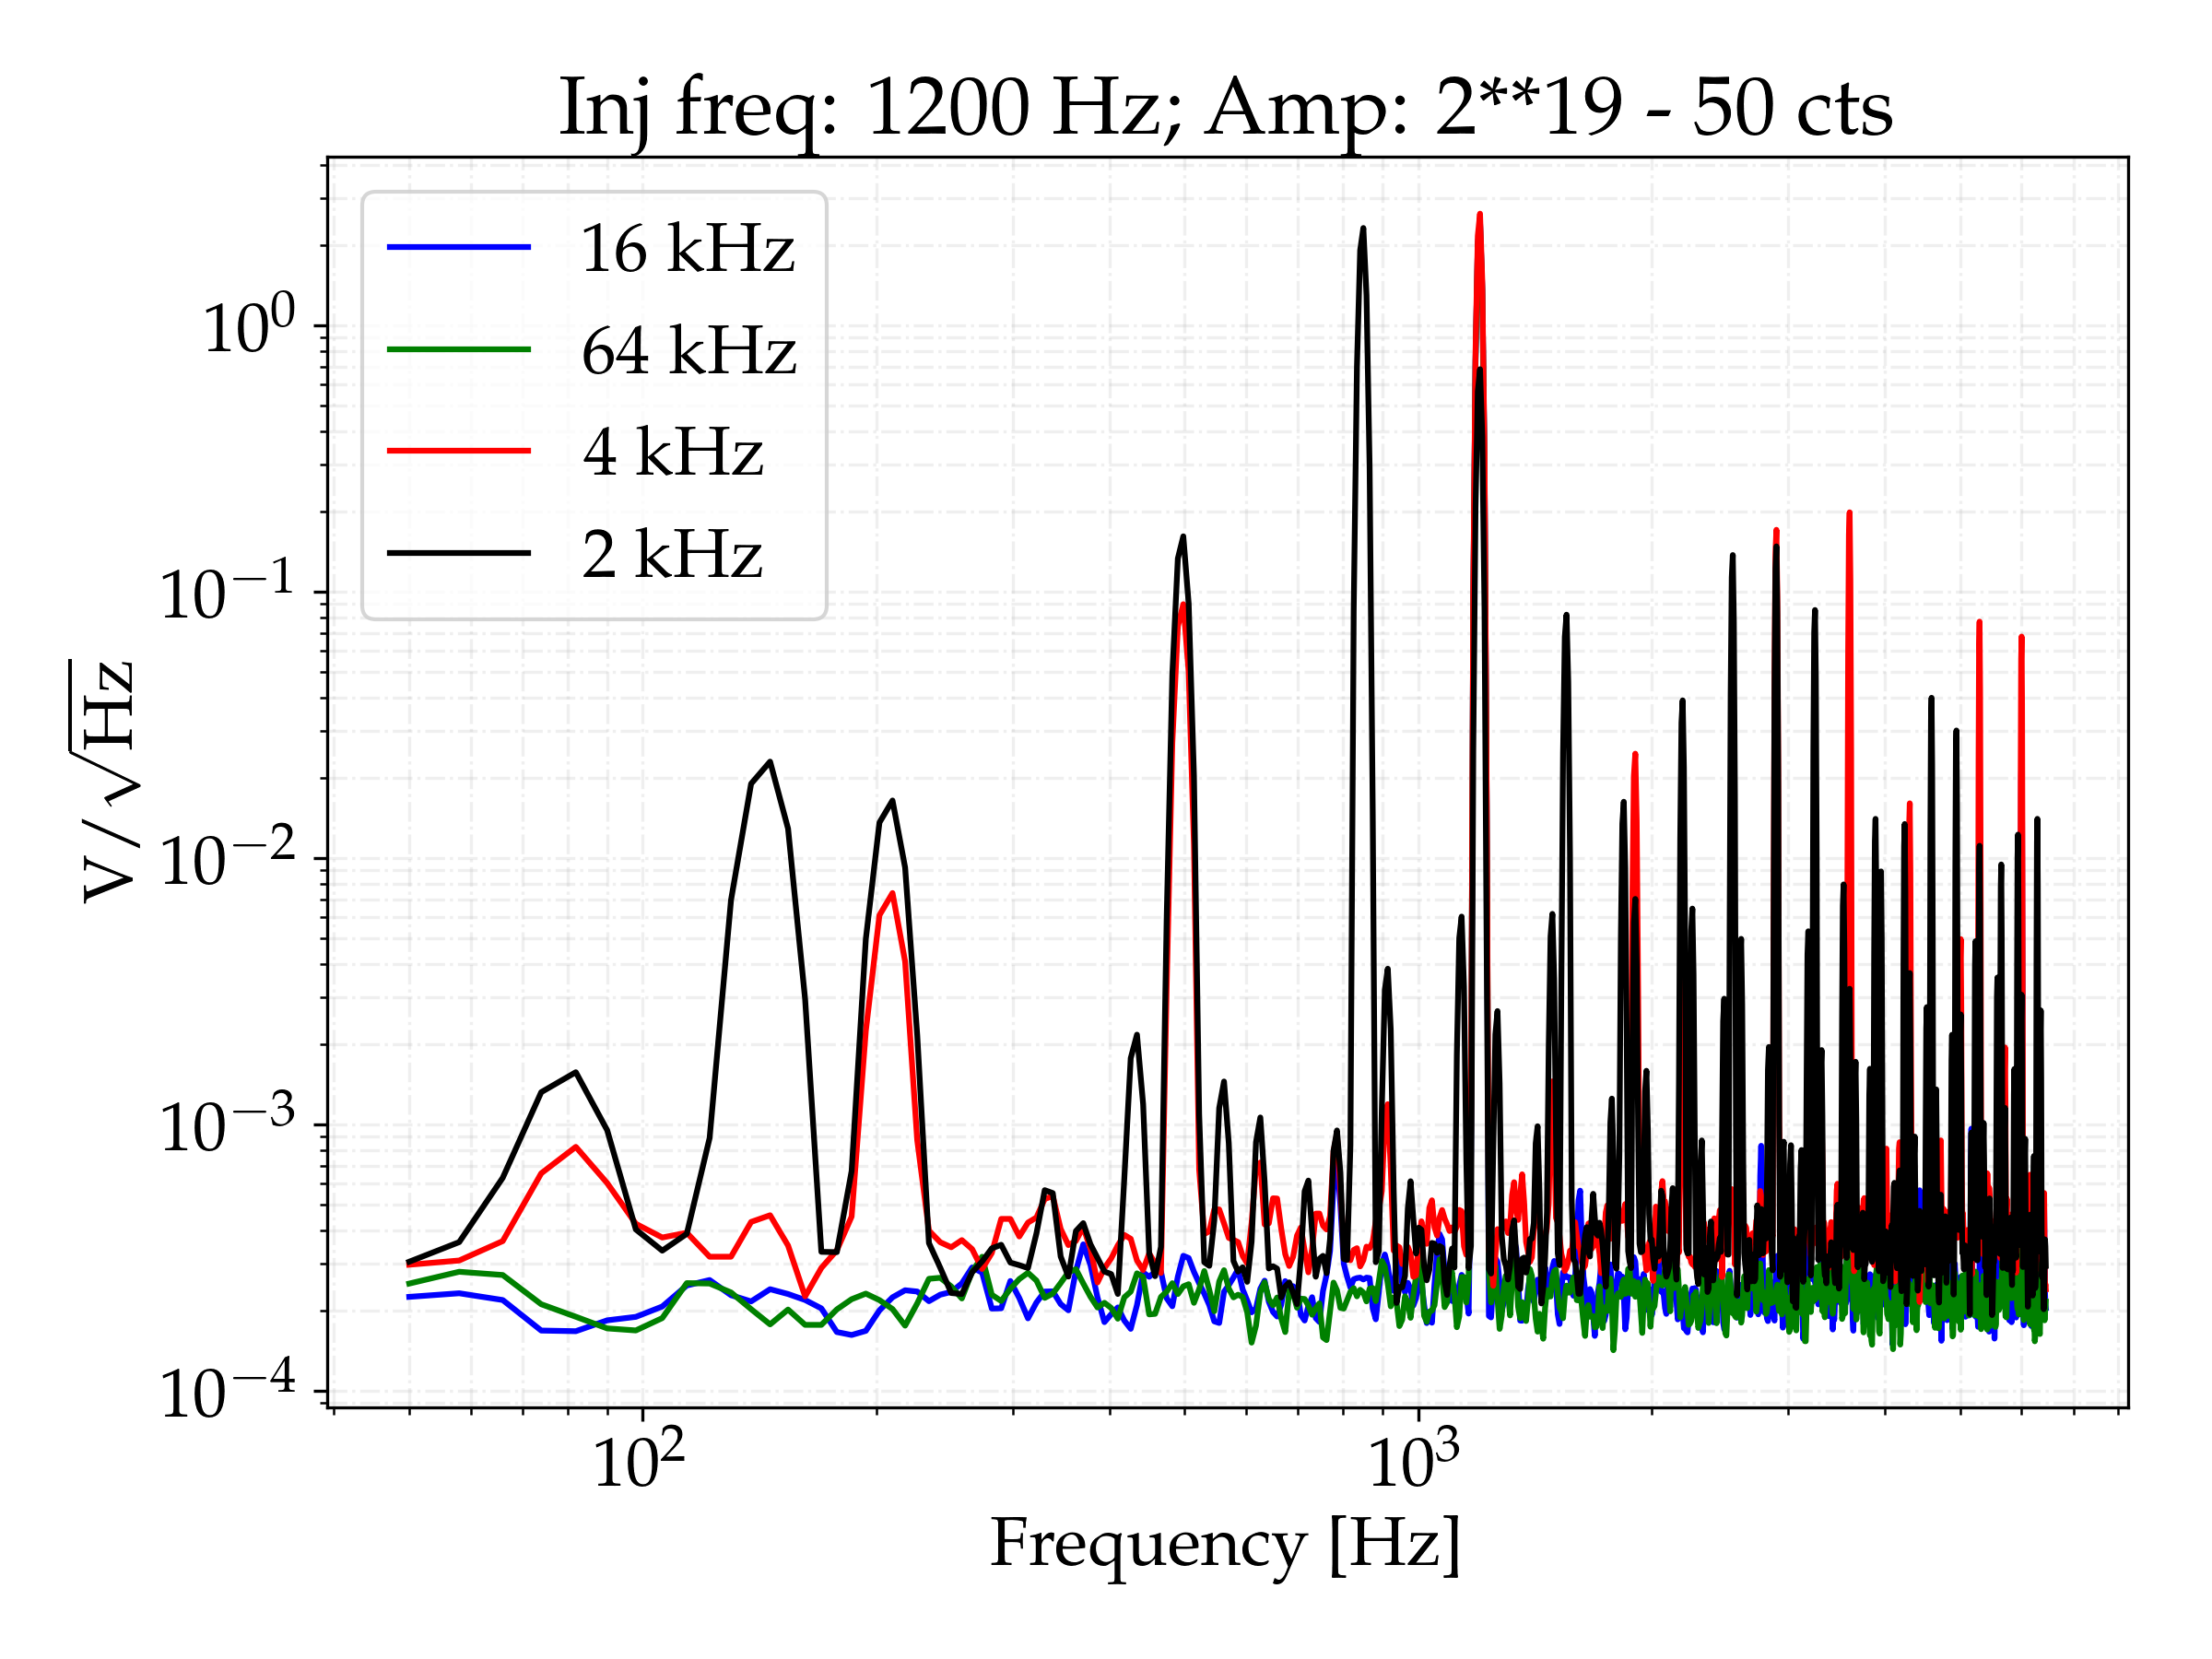
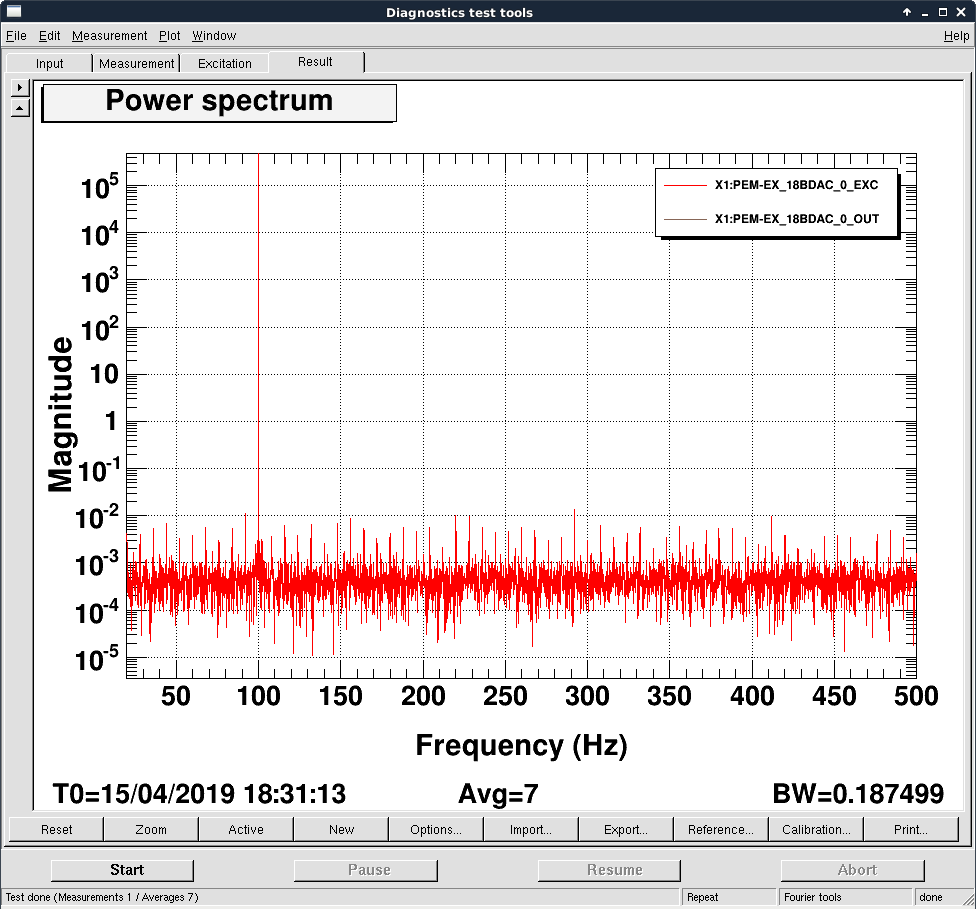
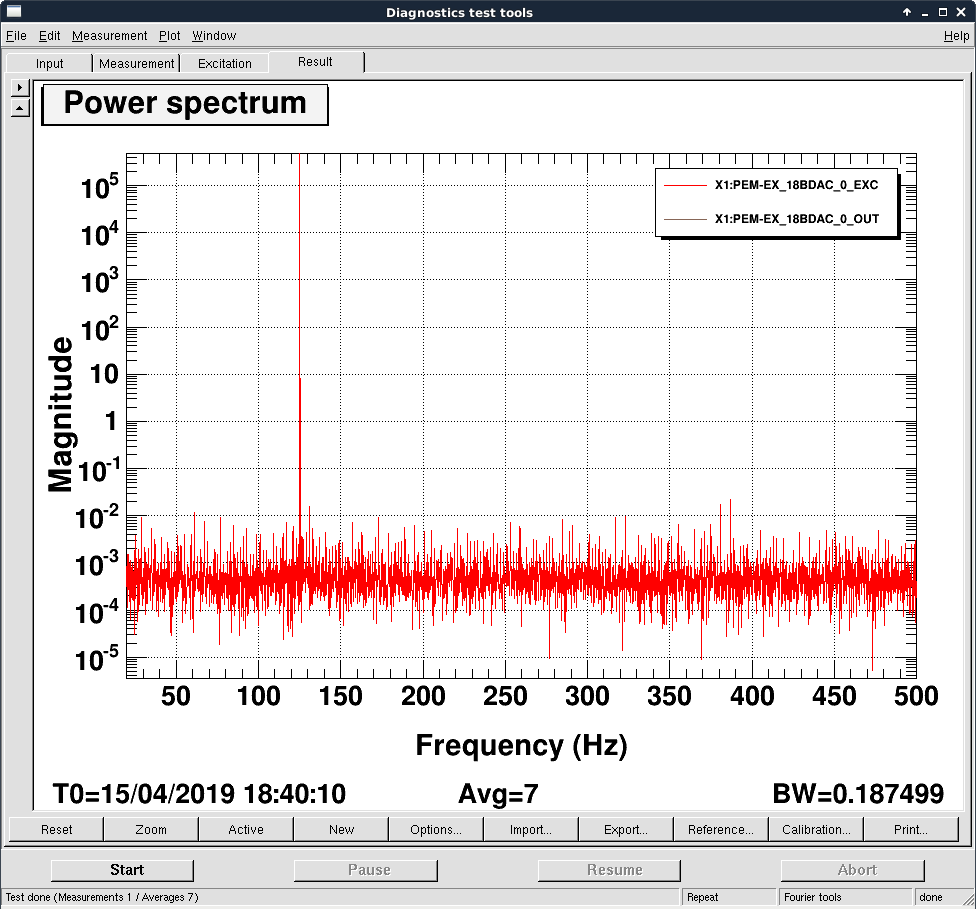
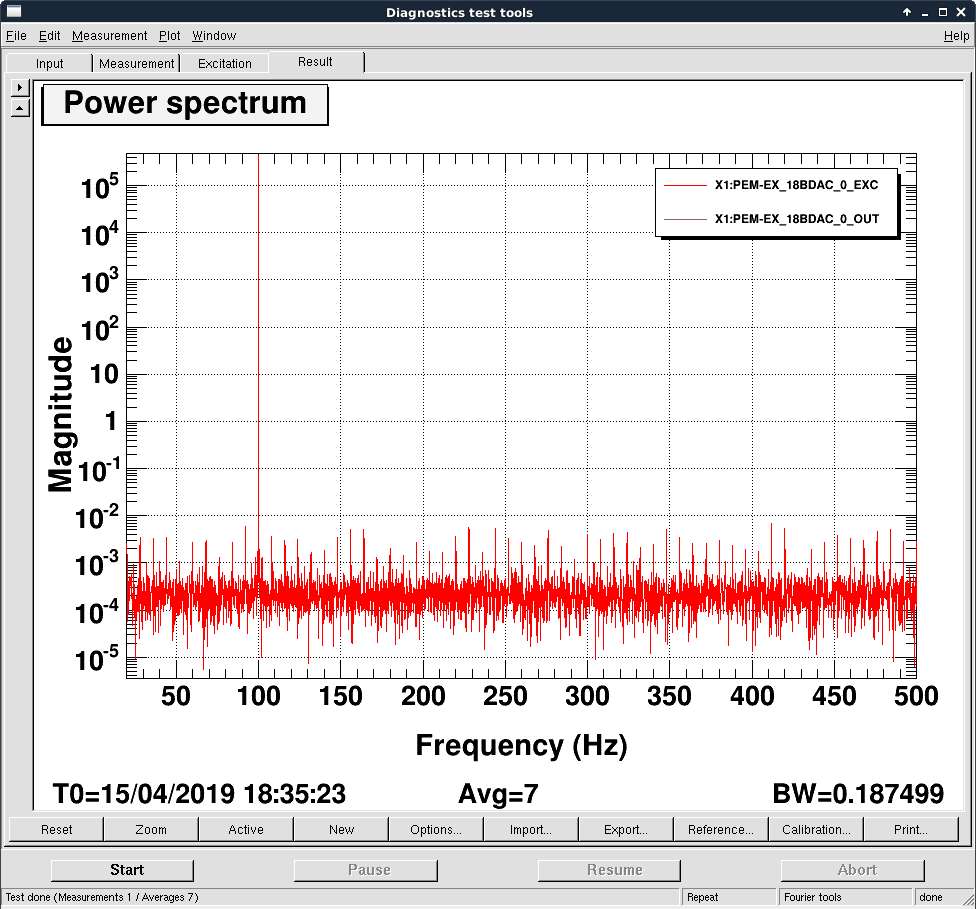
We report on some tests of the 20 and 18 bit DACs performed in the test stand. We drive a signal of varying frequency and amplitude, and check if we see nonlinearities in the spectrum (i.e. lines at multiples of the injected frequency or at other frequencies). The reading is made at the output of the anti-imaging chassis with a break-out board connected to an SR785 (more details about the setup are shown in the first attached image). The following plots have been obtained with the 20-bit DAC, but similar results are observed with the 18 bit DAC.
The second figure shows the results obtained by injecting a signal of 100 Hz near the maximum amplitude (~2**19 cts). A comb of lines is produced, with spacing equal to the injected frequency, although only the odd harmonics can be seen. The next figure shows a wider frequency range, where we can see that for frequencies higher than ~4 kHz further harmonics are not visible (the last visible harmonic with an integration time of 10 s is around number 75, but longer integration times make larger harmonics also visible). The next two figures shows the same injected frequency at half number of counts (half amplitude). Many lines can still be seen, at a reduced amplitude than the first figure. In order to not see any of the non-linear lines, the signal amplitude must be lower than ~30000 cts, more than an order of magnitude away from the maximum (with longer integration times this number would be even lower). This comb of lines with spacing equal to the injected frequency is produced at any injected frequency and sampling rate of the user model.
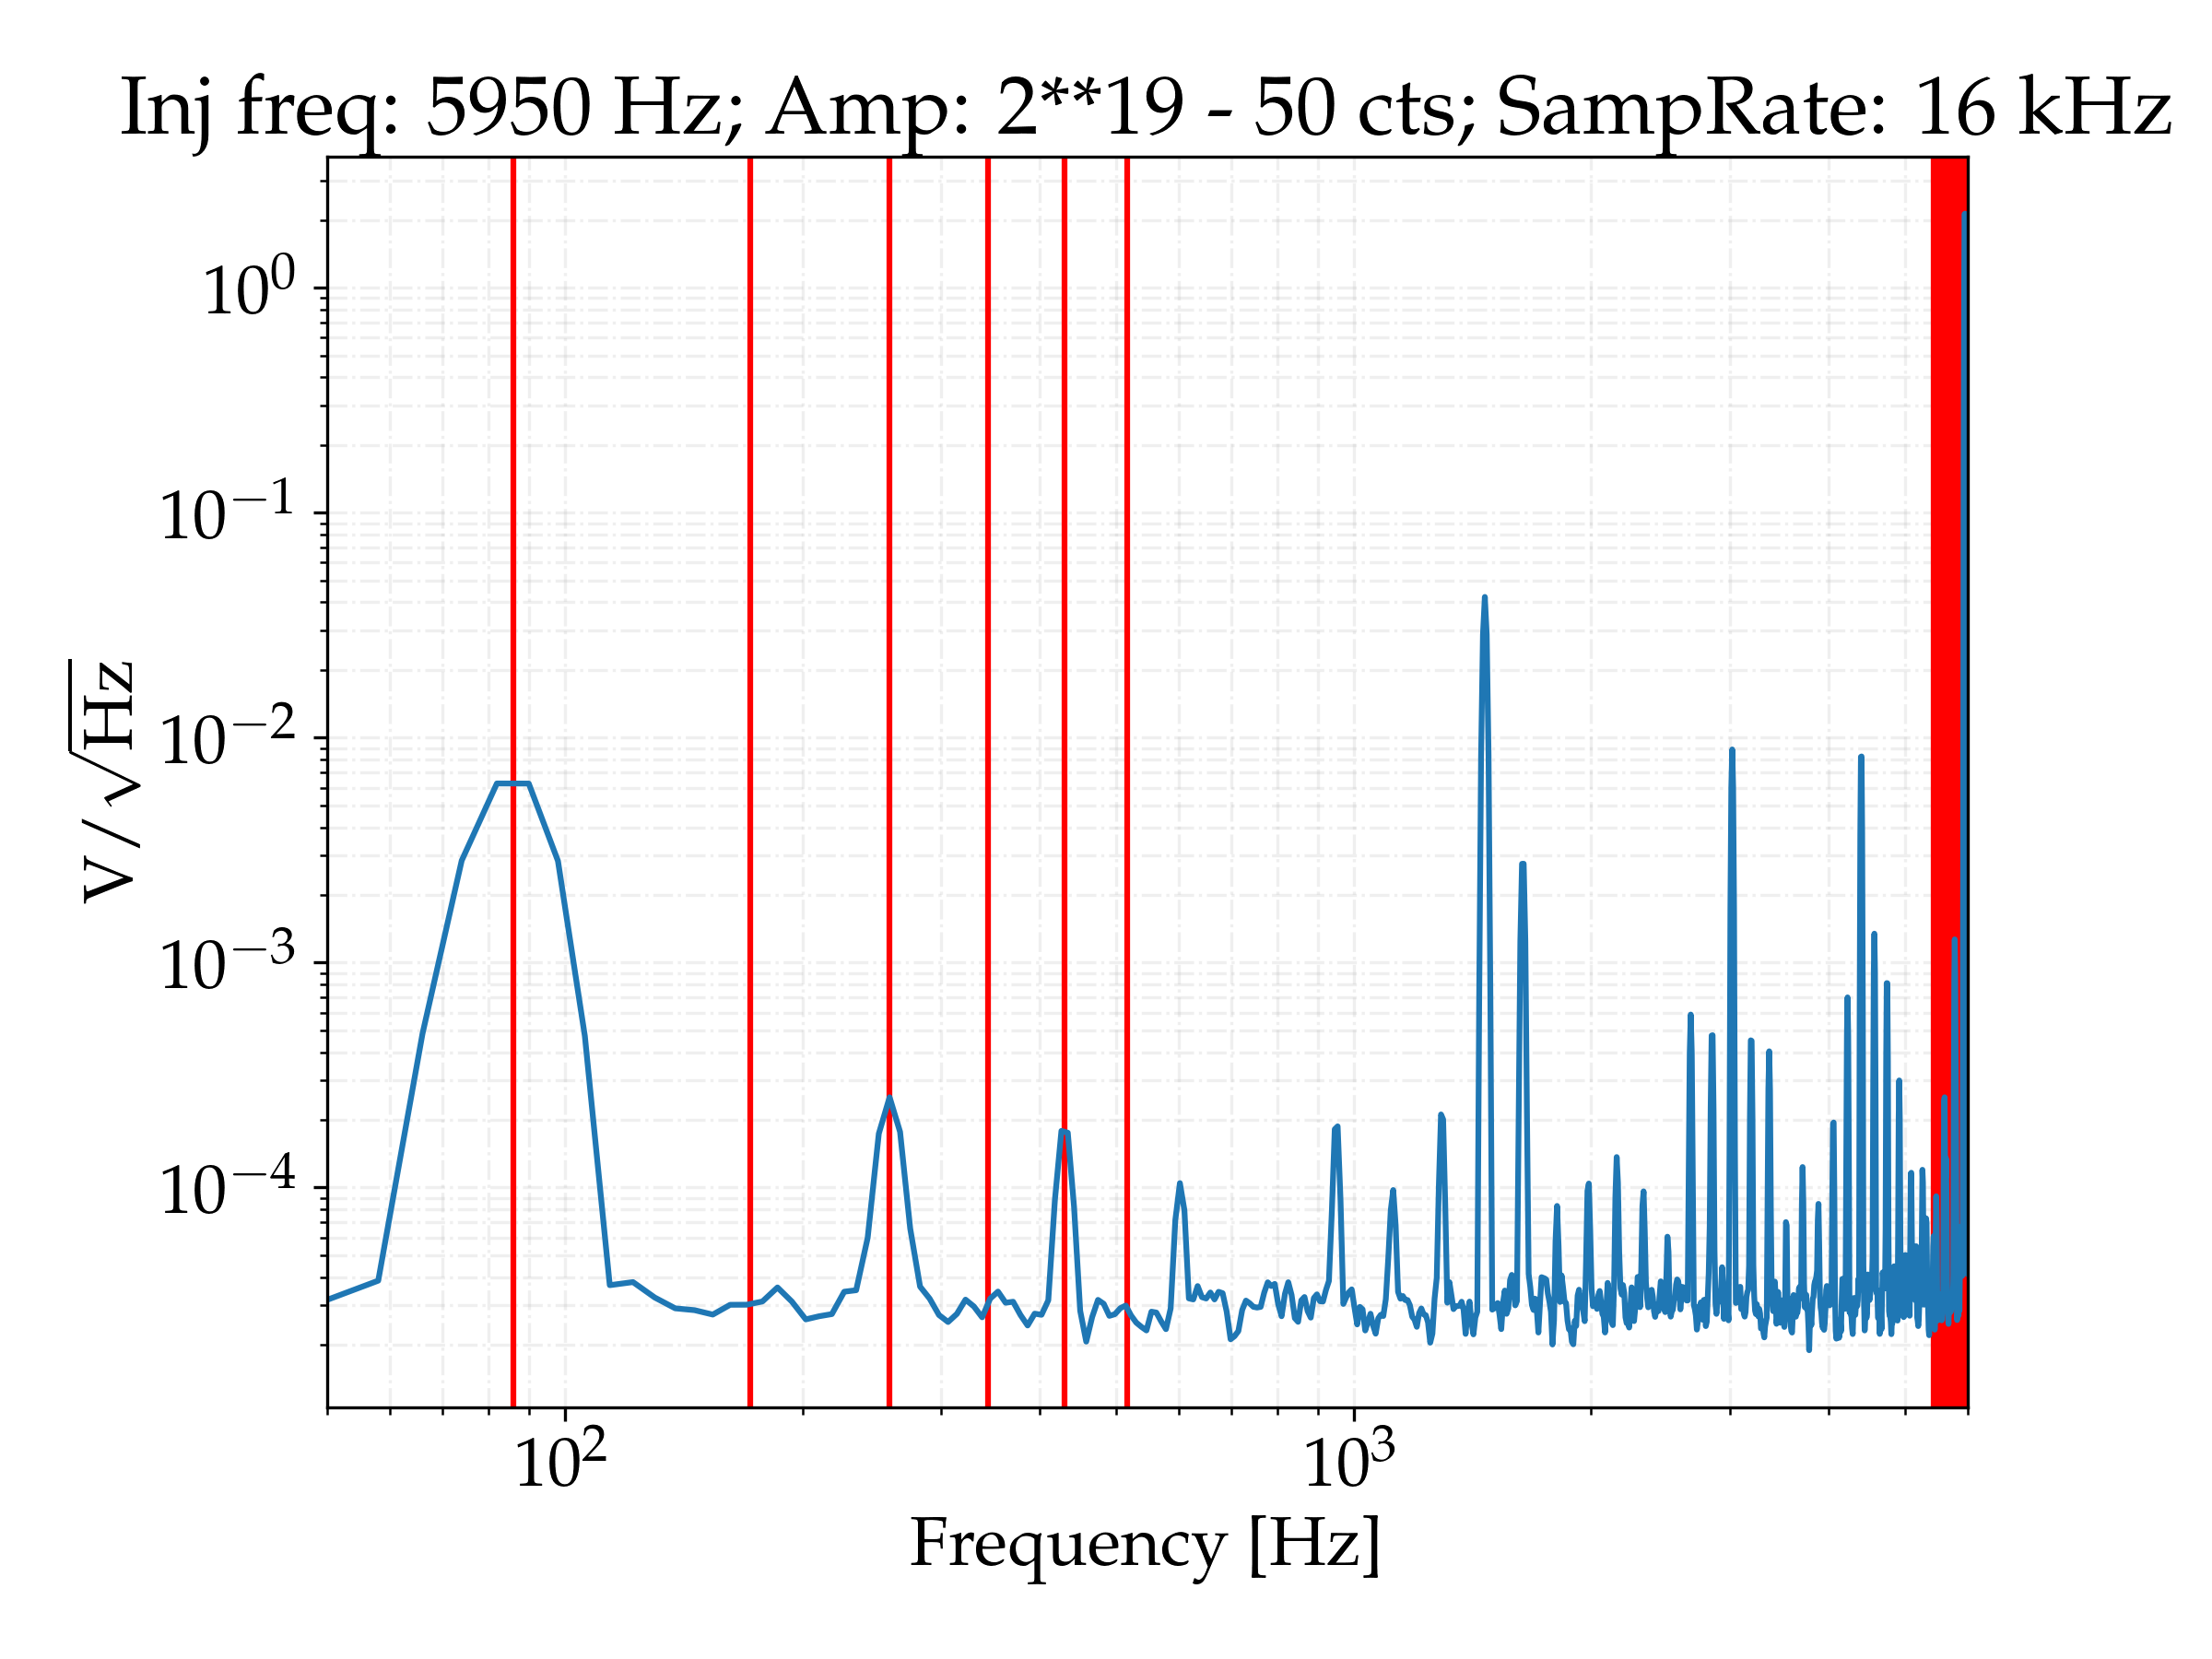
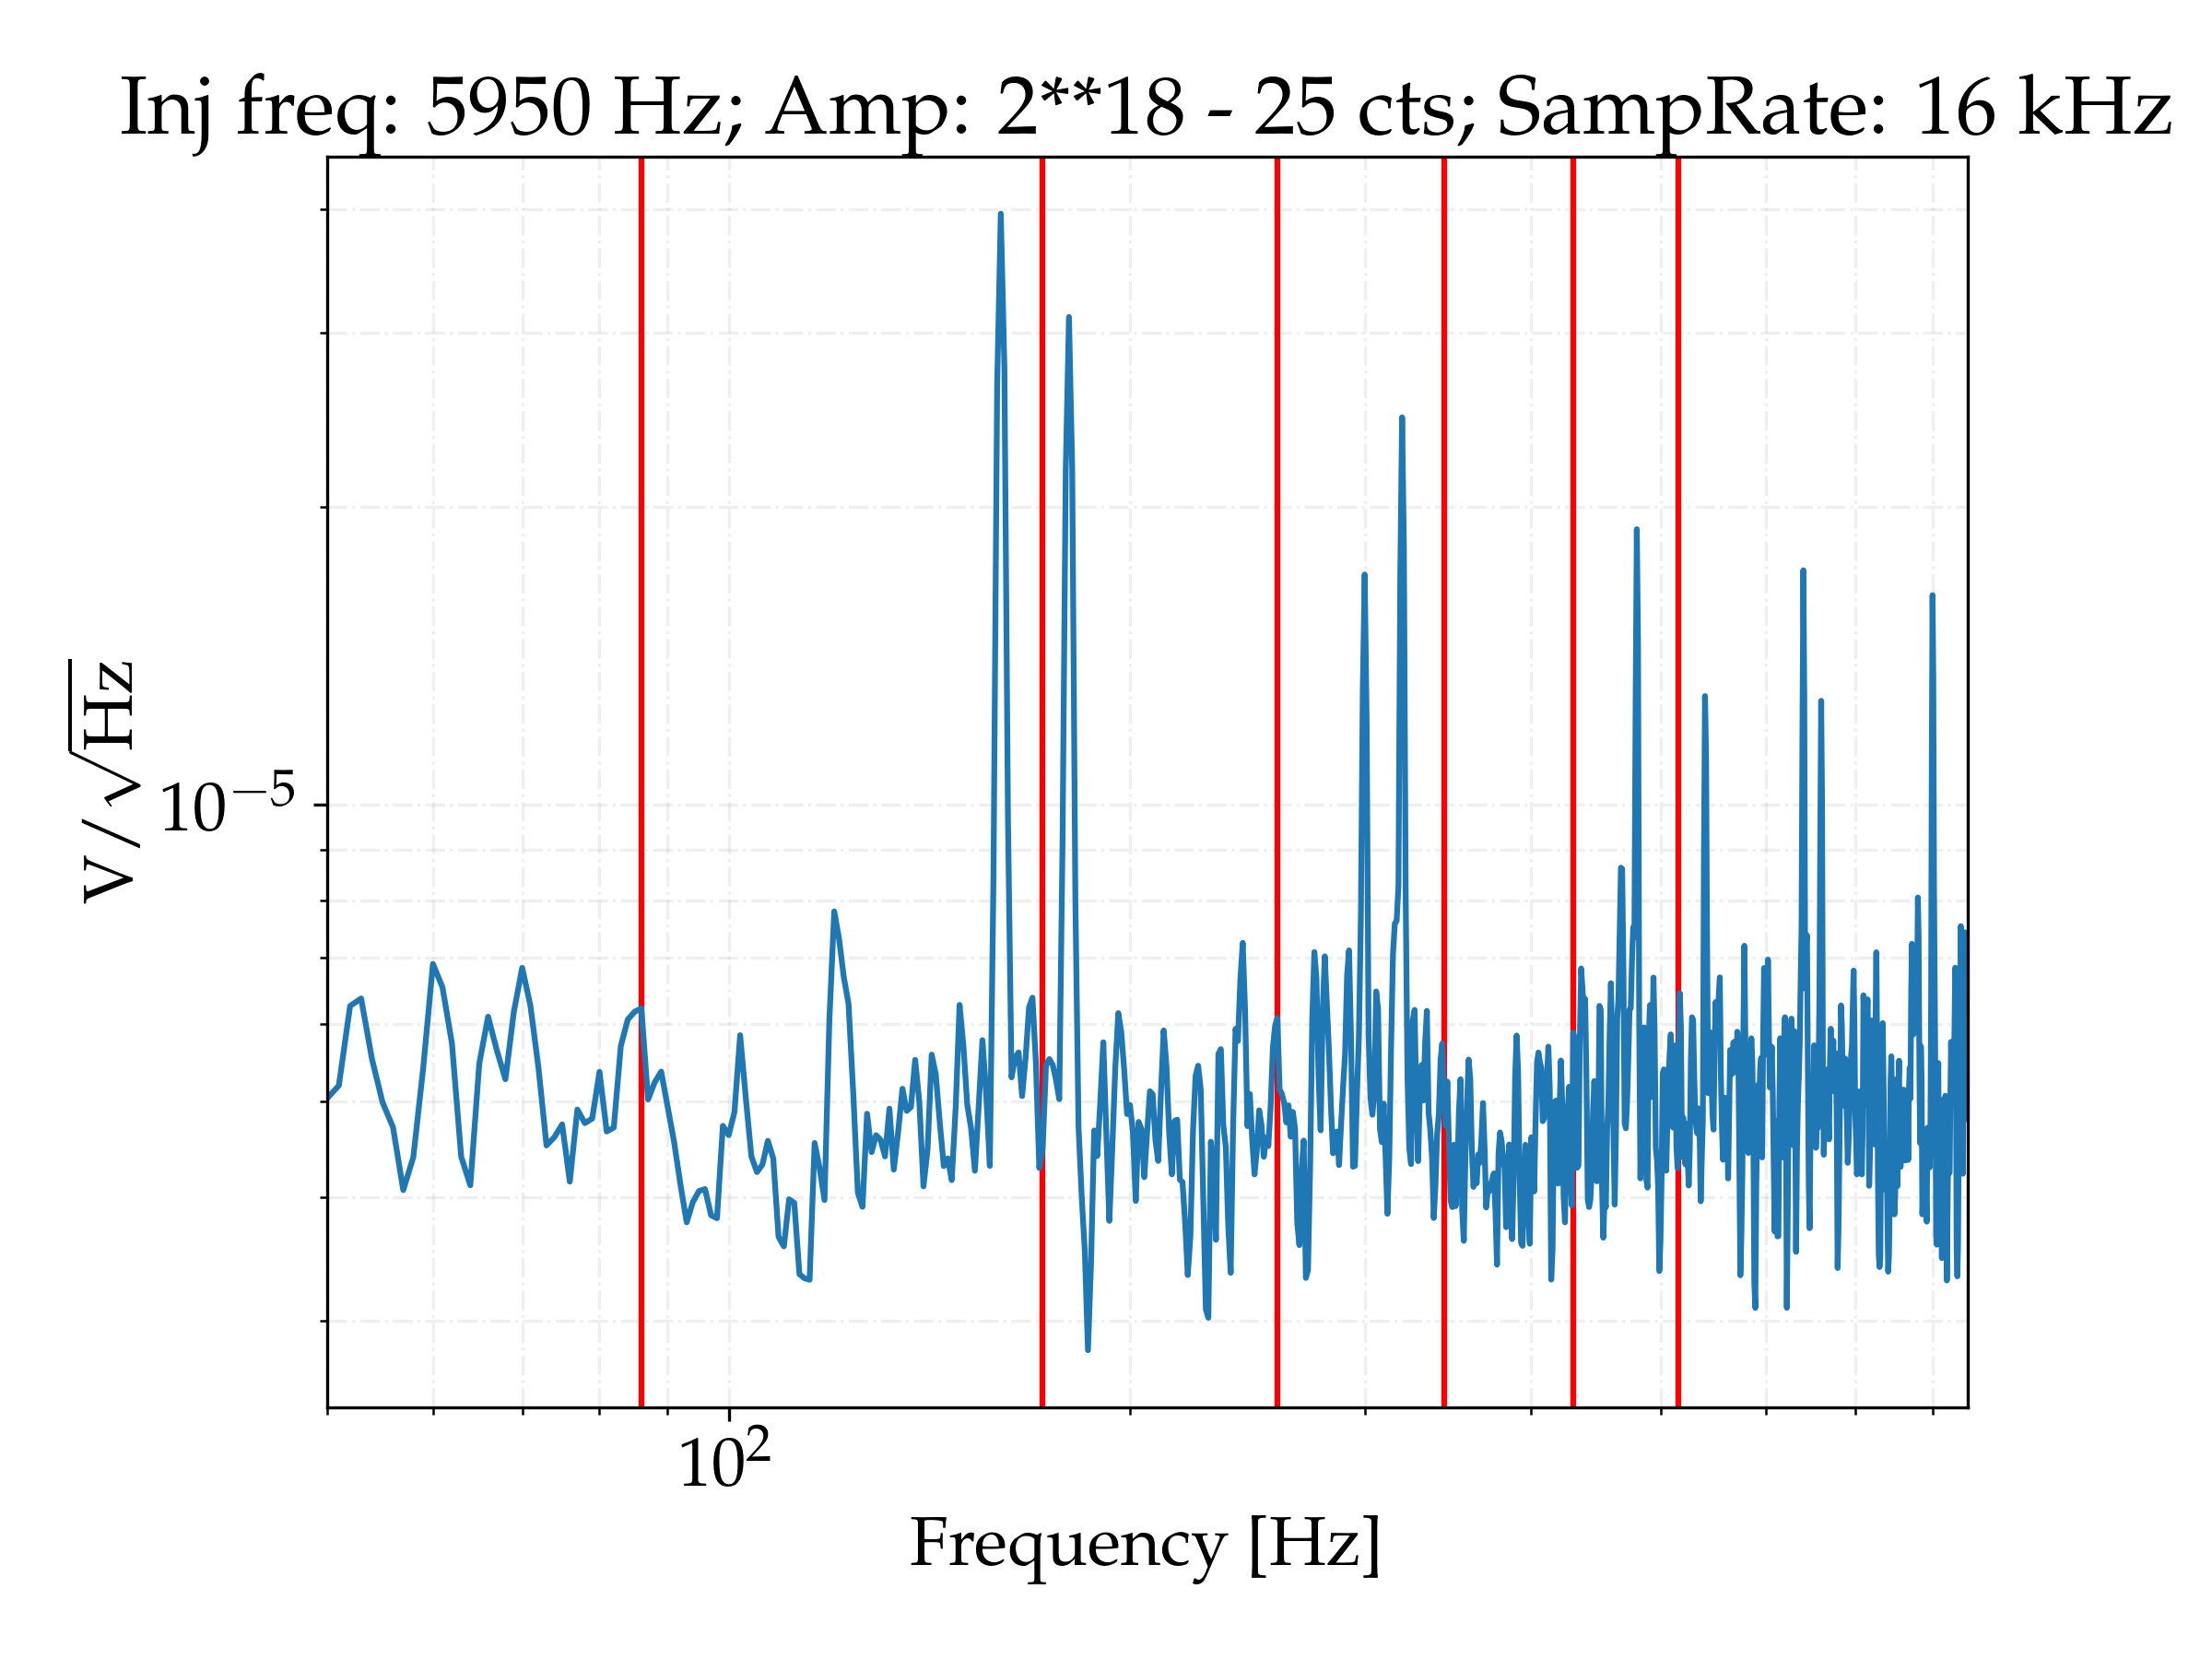
By increasing the frequency of the signal, many lines start to appear in the low frequency range. For example, for a signal of 5950 Hz, lines with a spacing of 86 Hz appear, as shown in the 6th figure (again, only odd harmonics). These lines appear to come from aliasing of the high frequency harmonics of the main comb discussed previously. Harmonics which lie between 2**15 Hz (Nyquist frequency) and 2**16 Hz (sampling rate of IOP model) are ported to the main frequency range by 2**16 - n*freq, where n is the harmonic index. Harmonics between 2**16 and 2**17 are ported by n*freq - 2**16. This pattern is repeated for all the produced harmonics, which get transported to frequencies between 0 and 2**15 Hz. The 5950 Hz frequency has been chosen to replicate the problems discussed in https://alog.ligo-wa.caltech.edu/aLOG/index.php?callRep=37139. Figures 7 and 8 show a wider range of frequencies and the same injection at half amplitude, where the low frequency lines dissappear.
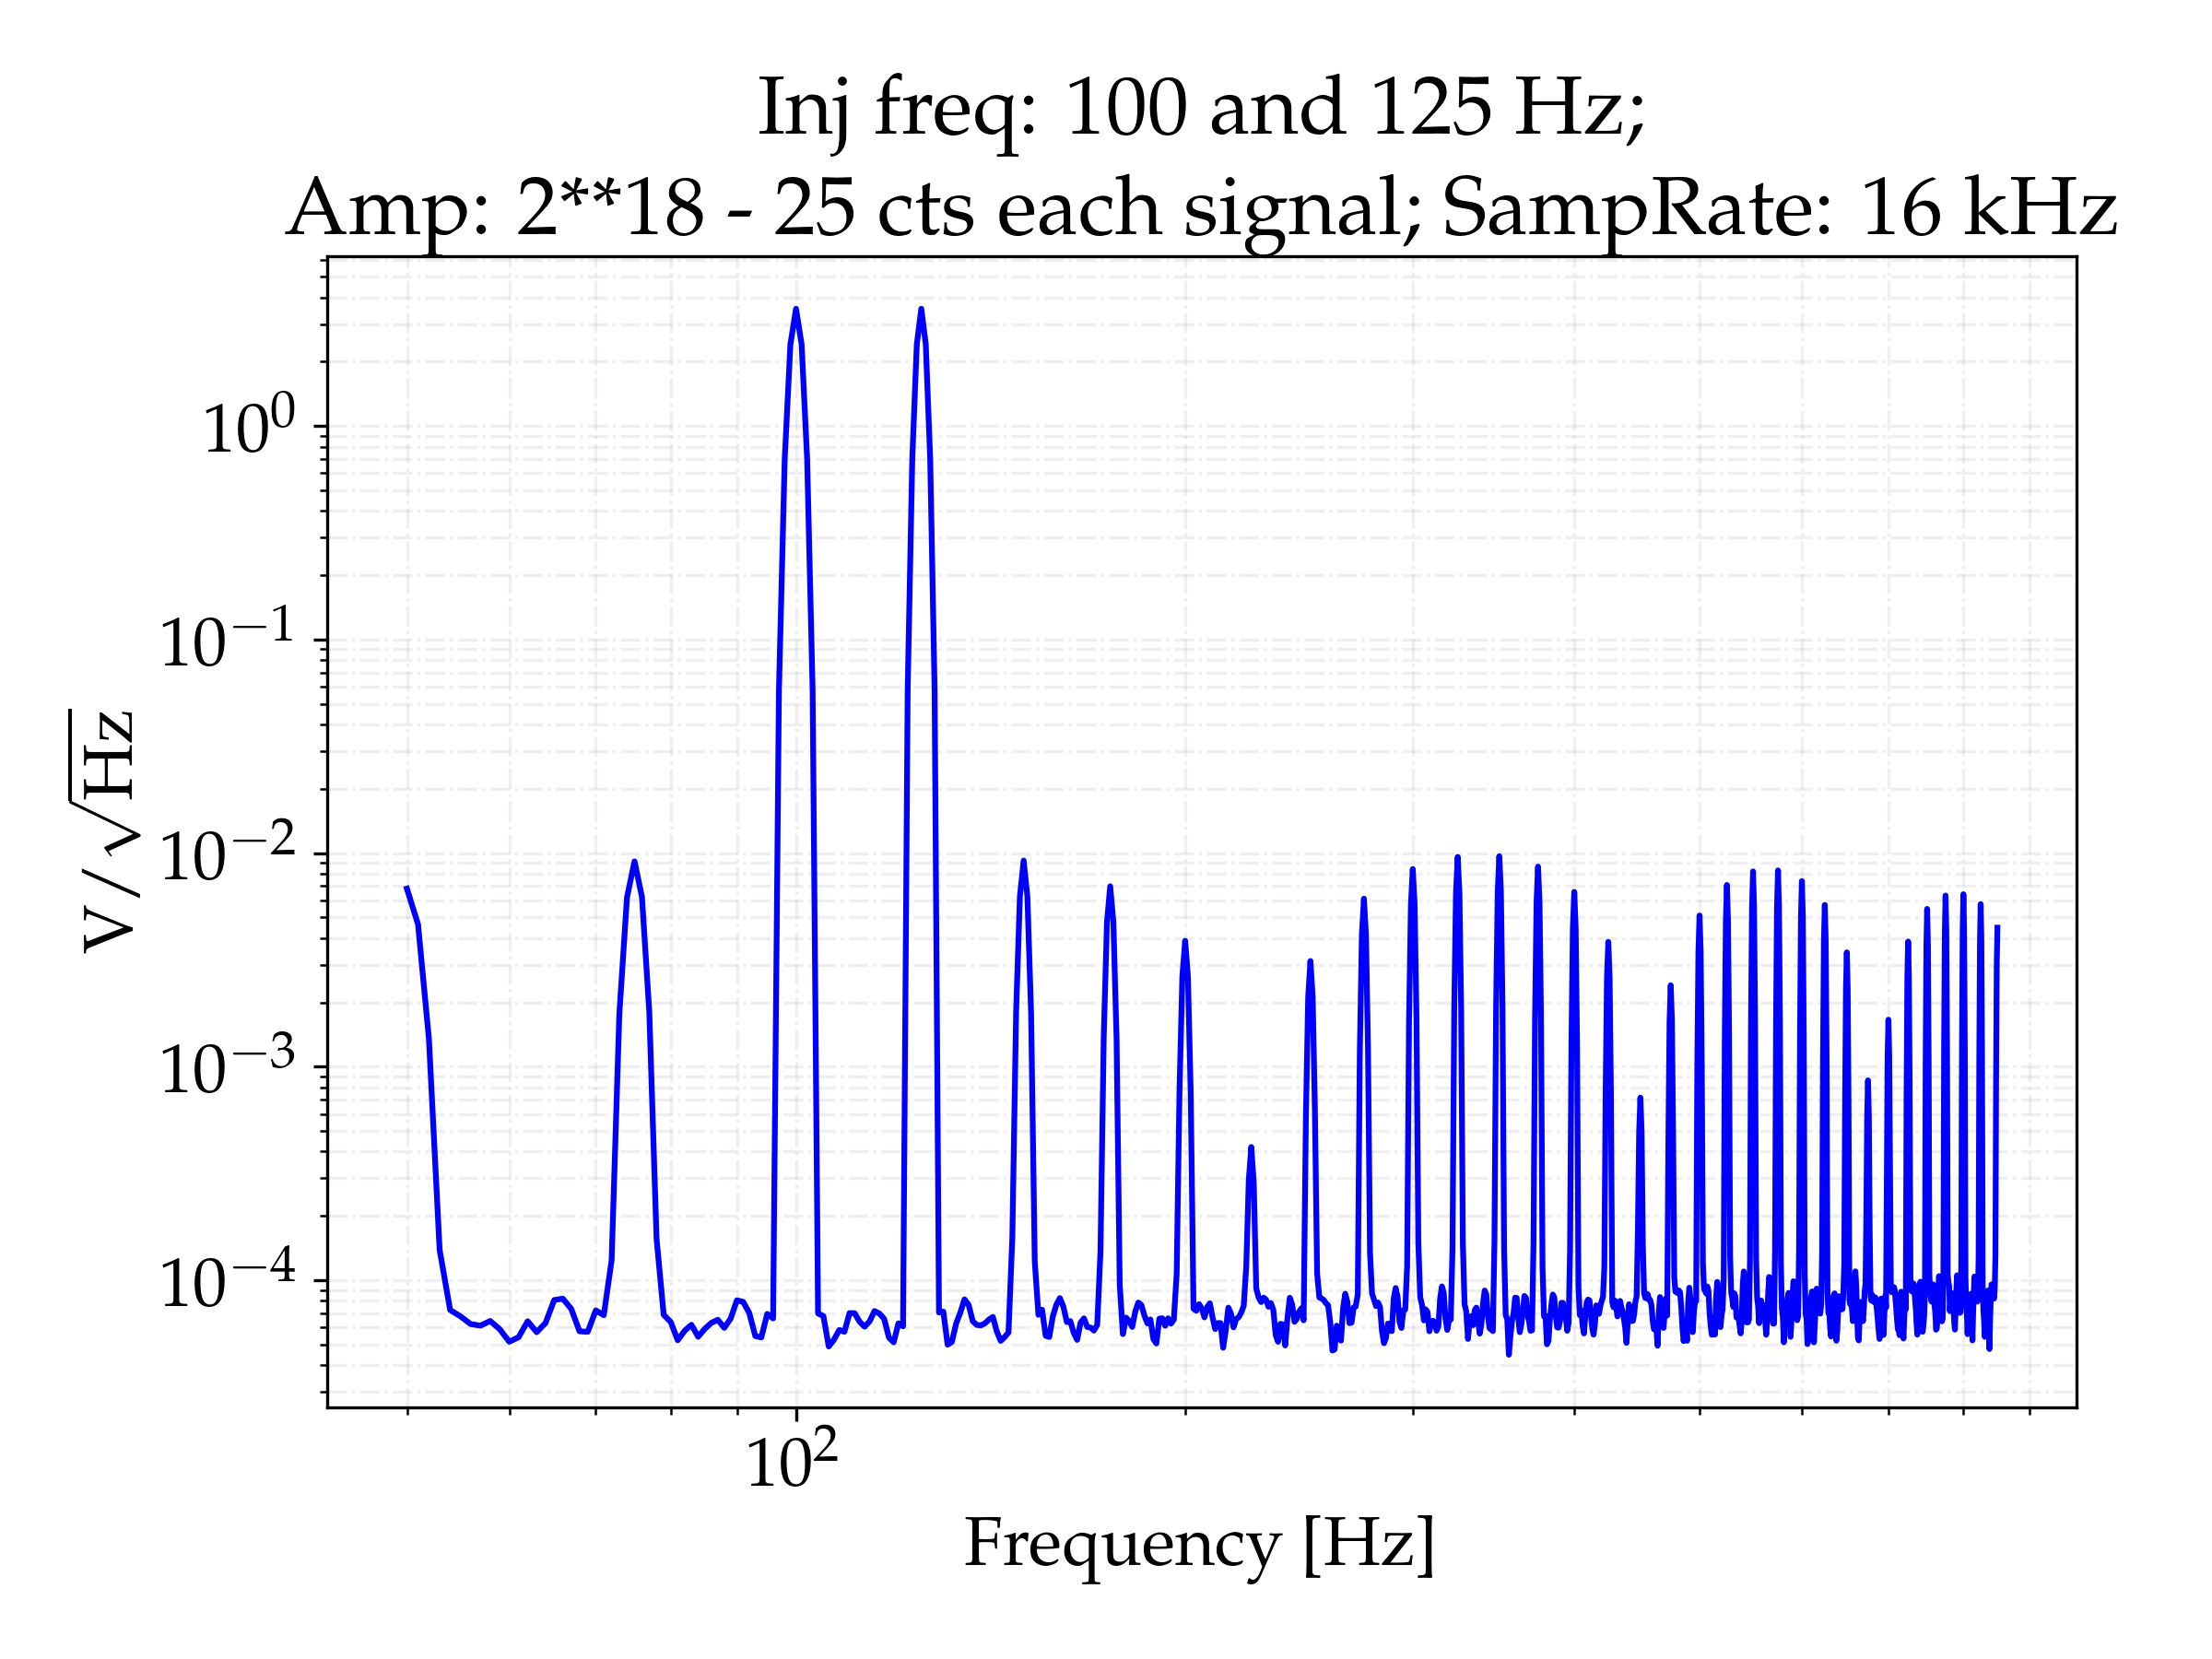
The main comb and the high frequency aliasing explains some of the lines which can be seen, but not all of them. We make further tests by driving two sinusoidal signals of different frequencies at the same time. Plot 9 shows an example of a 100 and 125 Hz signals, where new lines which cannot be seen when only injecting separately 100 or 125 Hz appear. These new lines have a spacing of 25 Hz, suggesting some type of beating between the two injected signals. This beating may explain some of the unexplained lines which appear in the spectrums discussed before. This may also explain some lines seen in DARM at frequencies which seem to be a beating of violin modes and calibration lines, as discussed here: https://alog.ligo-wa.caltech.edu/aLOG/index.php?callRep=48161.
Furthermore, different sampling rates of the user model have been tested. Plot 10 compares the output at different sampling rates. Although the main comb of spacing equal to the injected frequency is there in all the cases, different lines arise for each different sampling rate, with the situation being worse the lowe the sampling rate is.
Plots 11-14 show some readings performed at the excitation point with DTT (measurement point 3). Besides the main frequency, a comb of lines can also be seen. The spacing of this comb depends on the frequency of the main injected signal. This is a different feature than the comb which is seen after the DAC and AI, since the main comb of spacing equal to the injected frequency cannot be seen here, neither the beating between multiple injections.
Some readings have also been taken previous to the signal getting into the AI chassis (measurement point 2), and the same lines and nonlinearities have been observed as when measuring from point 1.
We would like to move several of the calibration line frequencies, in order to get them out of our most sensitive region, as well as to help give more accurate measurements of the interferometer properties.
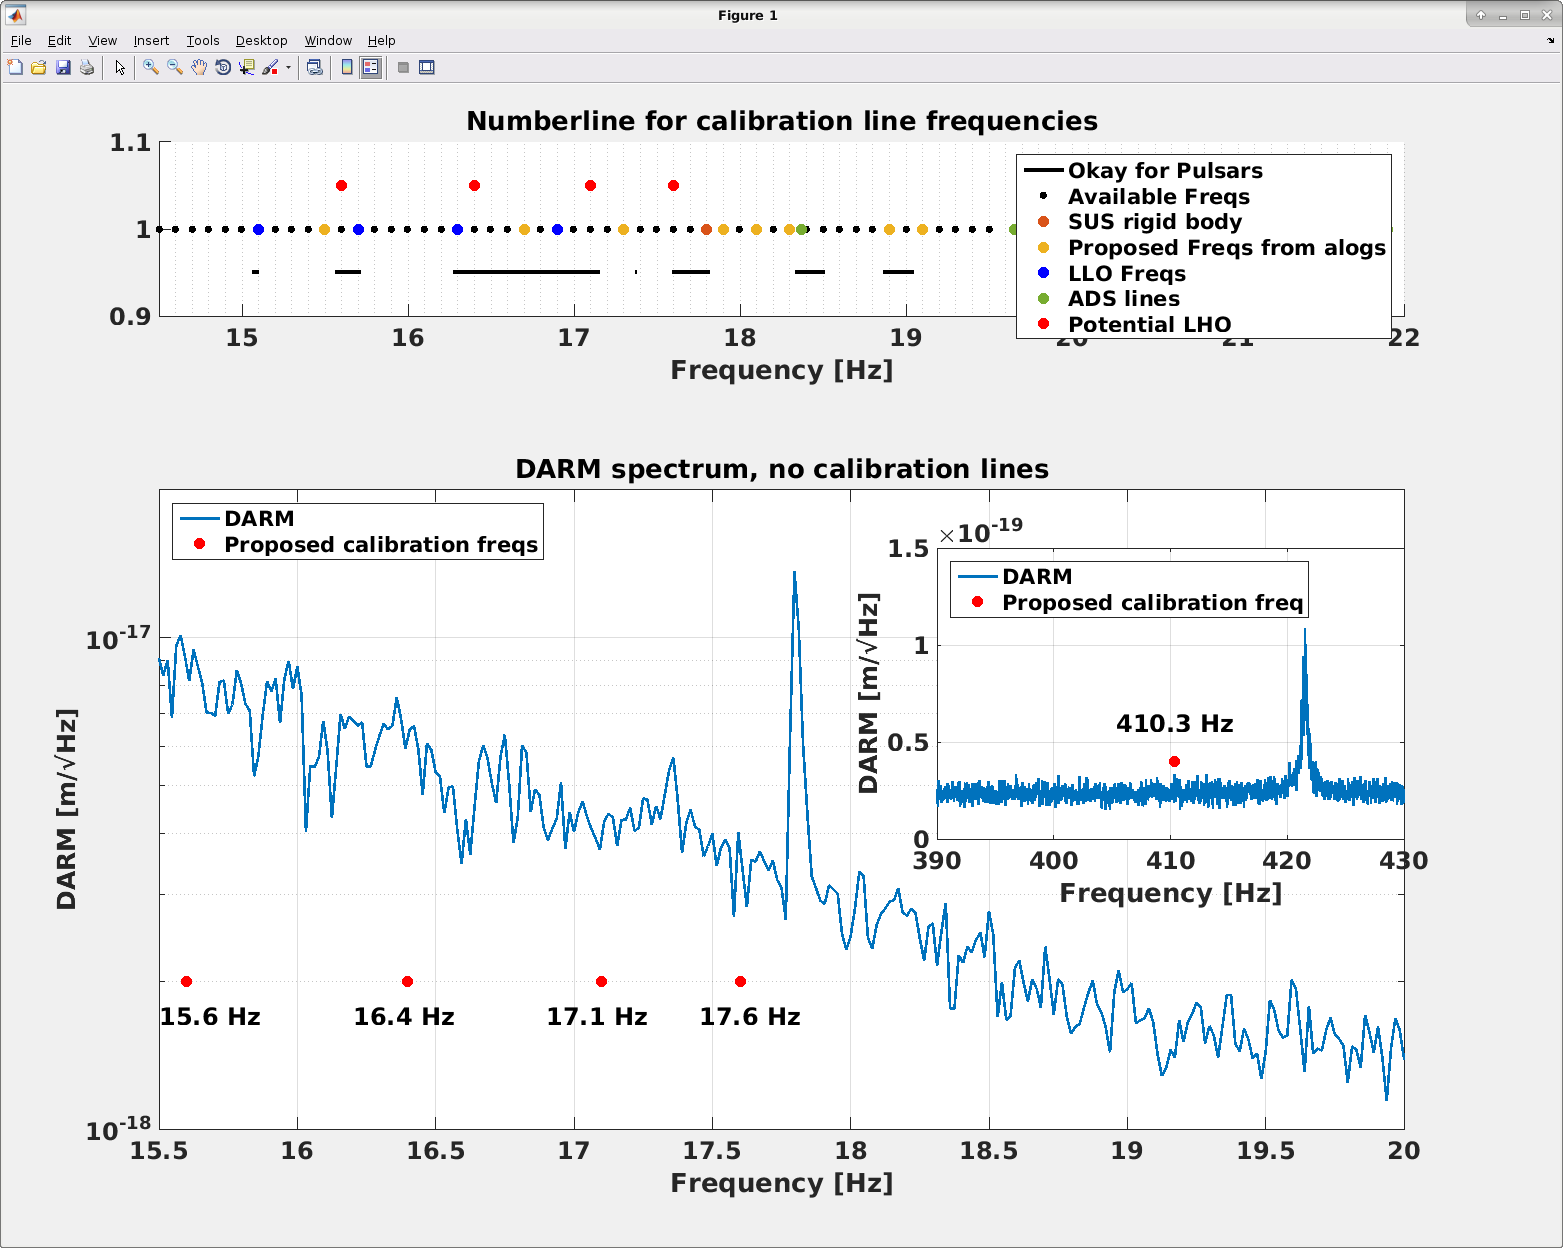
There are enough constraints on what frequencies are okay to use for calibration lines that I made a little script to help visualize where we're proposing to put the calibration lines at the lower (below 20 Hz) frequencies. Lilli has a nice summary of these constraints in alog 44590. EvanG provides in alog 44892 the frequency regions that are okay from the viewpoint of puslar searches.
Currently, our calibration line frequencies are [15.1 Hz, 16.7 Hz, 35.9 Hz, 36.7 Hz, and 331.9 Hz], and I am proposing to change those to [15.6 Hz, 16.4 Hz, 17.1 Hz, 17.6 Hz, and 410.3 Hz]. (We also have lines at 7.93 Hz and 1083.7 Hz, but we're not moving them).
In the top panel of the attached figure, I have horizontal bars for the okay ("non-vetoed") regions according to the pulsar group, assuming we need to be at least 0.1 Hz away from known pulsars for which we could potentially measure spindown limits. I show the LLO calibration frequencies in blue (since we don't want to use the same frequencies, although we have been for the 15.1 Hz line since about January 14th); several frequencies in yellow that have been proposed in various alogs, including those from Lilli and Evan linked above; the beam splitter rigid body frequency (Lilli's alog quotes 17.54 Hz for this, but it looks like it's closer to 17.8 Hz for us); and the ADS frequencies that we are currently using, since we must not drown them out with calibration lines. Finally, in red, I show my new proposed suspension calibration frequencies: 15.6 Hz, 16.4 Hz, 17.1 Hz, and 17.6 Hz.
In the bottom panel, I show where these frequencies lie in relation to our DARM spectrum at a time that the calibration lines were off (so that it's clear that current cal lines at, for example, 16.7 Hz, would change and not interfere with these new frequencies).
In the bottom inset, I also show the proposed frequency for the pcal line that is used to measure the DARM cavity pole. LLO uses 434.9 Hz for this line. We will use something lower, since our DARM cavity pole is currently much lower than L1's.
Either tomorrow or Wednesday, Jeff and I will:
TITLE: 04/15 Eve Shift: 23:00-07:00 UTC (16:00-00:00 PST), all times posted in UTC
STATE of H1: Commissioning
OUTGOING OPERATOR: Corey
CURRENT ENVIRONMENT:
Wind: 9mph Gusts, 5mph 5min avg
Primary useism: 0.04 μm/s
Secondary useism: 0.21 μm/s
QUICK SUMMARY:
In commissioning for OMC scans.
TITLE: 04/15 Day Shift: 15:00-23:00 UTC (08:00-16:00 PST), all times posted in UTC
STATE of H1: Observing at 107Mpc
INCOMING OPERATOR: Patrick
SHIFT SUMMARY:
6.5hrs of OBSERVING this shift, and then ~4hrs of Approved Commissioning (TCS OMC scans) started at the end of shift and will carry over to the evening.
LOG:
My Locking Notes: DRMI alignment tweaking & OMC Carrier
1) If dropping out in steps between DRMI & DC Readout, tweak up alignment by stopping at CHECK_AS_SHUTTERS, and then: tweak PRM & SRM to get POP18 up to 60 & POP90 down to 15. (Thanks to Jenne for the reminder she's told me several times before!) :)
2) If one gets a message for the OMC not finding the carrier, one can not do anything and wait for the 600sec sleep for ISC_LOCK, or open up the OMC_LOCK node and request FIND_CARRIER (it'll go DOWN & then find the carrier). One can do this request eventhough this node is managed.
No water was added. No water was needed.
Laser Status:
Front End Power is 32.31W (should be around 30 W)
70W Output Power is 70.23W
Front End Watch is GREEN
70W Watch is GREEN
PMC:
It has been locked 0 days, 0 hr 0 minutes (should be days/weeks)
Reflected power = 9.893Watts
Transmitted power = 54.94Watts
PowerSum = 64.83Watts.
FSS:
It has been locked for 0 days 12 hr and 50 min (should be days/weeks)
TPD[V] = 3.965V (min 0.9V)
ISS:
The diffracted power is around 2.2%
Last saturation event was 0 days 13 hours and 51 minutes ago (should be days/weeks)
Possible Issues: Looks OK.
This is just a comment in passing. I find it strange that every time the PSL weekly report script is run it almost always reports that either the FSS or PMC has only been locked for a few hours. Many times it reports numbers less than 6 or 12 hours, when anecdotally both remain locked for much longer.
The script will look at the channels: H1:PSL-{PMC/FSS}_RELOCK_{DAY/MIN/HOUR}
Is these channels are reporting false information, the script can be changed to look at something more accurate.
I have begun some prep work for tomorrow's maintanance day installation of updated CALCS and SUS quad models under work permit 8166. This will address FRS 12335, as laid out in ECR E1900107, to eliminate the problem of timing slips on the supposed-to-be-synced oscillators causing problems with the time dependent calibration kappa calculations. JoeB successfully completed this at LLO last Tuesday (LLO alog 45007), so here we are just pulling his changes.
So far, I have:
To do tomorrow during maintanance:
For the phase delays to account for the 1 cycle delay with the new oscillator, the appropriate amount of delay in degrees depends on the line frequency. Here I list the delays for both our current calibration line frequencies, as well as for the proposed frequencies (see alog 48512).
The delays will go in channels of the type H1:CAL-CS_TDEP_SUS_LINE{1,2,3}_SUS_DEMOD_PHASE, and are calculated from angle(exp(-2*pi*i*Freq/16384))*180/pi.
15.1 Hz = -0.3318 deg
16.7 Hz = -0.3669 deg
35.9 Hz = -0.7888 deg
15.6 Hz = -0.3428 deg
16.4 Hz = -0.3604 deg
17.1 Hz = -0.3757 deg. (EDIT: this is the freq for the pcal line, which needs its delay updated)
17.6 Hz = -0.3867 deg. (EDIT: this is the freq for the sus line, which we need to put the delay in)
Also, since we are using ETMX for all of our DARM actuation, we will set channels of the type H1:CAL-CS_TDEP_SUS_L{1, 2, 3}_LINE_END_SW equal to 1. 0. EDITED - 0 is for EX (which we want), 1 is for EY (we do not want).
Since we are rebooting these models (and I remembered that the temporary channels were in there), I have removed the following channels from the quad suspensions:
H1:SUS-ETMX_L2_TEMP_P_1 1 0 0 4 16 0
H1:SUS-ETMX_L2_TEMP_P_2 1 0 0 4 16 0
H1:SUS-ETMX_L2_TEMP_P_3 1 0 0 4 16 0
H1:SUS-ETMX_L2_TEMP_TP_2 1 0 10814 4 16384 0
H1:SUS-ETMX_L2_TEMP_TP_3 1 0 10813 4 16384 0
H1:SUS-ETMY_L2_TEMP_P_1 1 0 0 4 16 0
H1:SUS-ETMY_L2_TEMP_P_2 1 0 0 4 16 0
H1:SUS-ETMY_L2_TEMP_P_3 1 0 0 4 16 0
H1:SUS-ETMY_L2_TEMP_TP_2 1 0 10814 4 16384 0
H1:SUS-ETMY_L2_TEMP_TP_3 1 0 10813 4 16384 0
H1:SUS-ITMX_L2_TEMP_P_1 1 0 0 4 16 0
H1:SUS-ITMX_L2_TEMP_P_2 1 0 0 4 16 0
H1:SUS-ITMX_L2_TEMP_P_3 1 0 0 4 16 0
H1:SUS-ITMX_L2_TEMP_TP_2 1 0 10798 4 16384 0
H1:SUS-ITMX_L2_TEMP_TP_3 1 0 10797 4 16384 0
H1:SUS-ITMY_L2_TEMP_P_1 1 0 0 4 16 0
H1:SUS-ITMY_L2_TEMP_P_2 1 0 0 4 16 0
H1:SUS-ITMY_L2_TEMP_P_3 1 0 0 4 16 0
H1:SUS-ITMY_L2_TEMP_TP_2 1 0 10814 4 16384 0
H1:SUS-ITMY_L2_TEMP_TP_3 1 0 10813 4 16384 0
None of these were being saved to frames. These had been put in, in order to diagnose some problems with the IFO lockloss trigger, and should have been removed months ago. However, since we don't ever want to reboot the suspension models unnecessarily and these channels weren't taking up frame space, we had left them in.
I have re-compiled and done make-installs for all 4 quad models. I have also done a make-install for h1calcs (it hasn't changed since I compiled yesterday afternoon).
Craig, Danny, Georgia
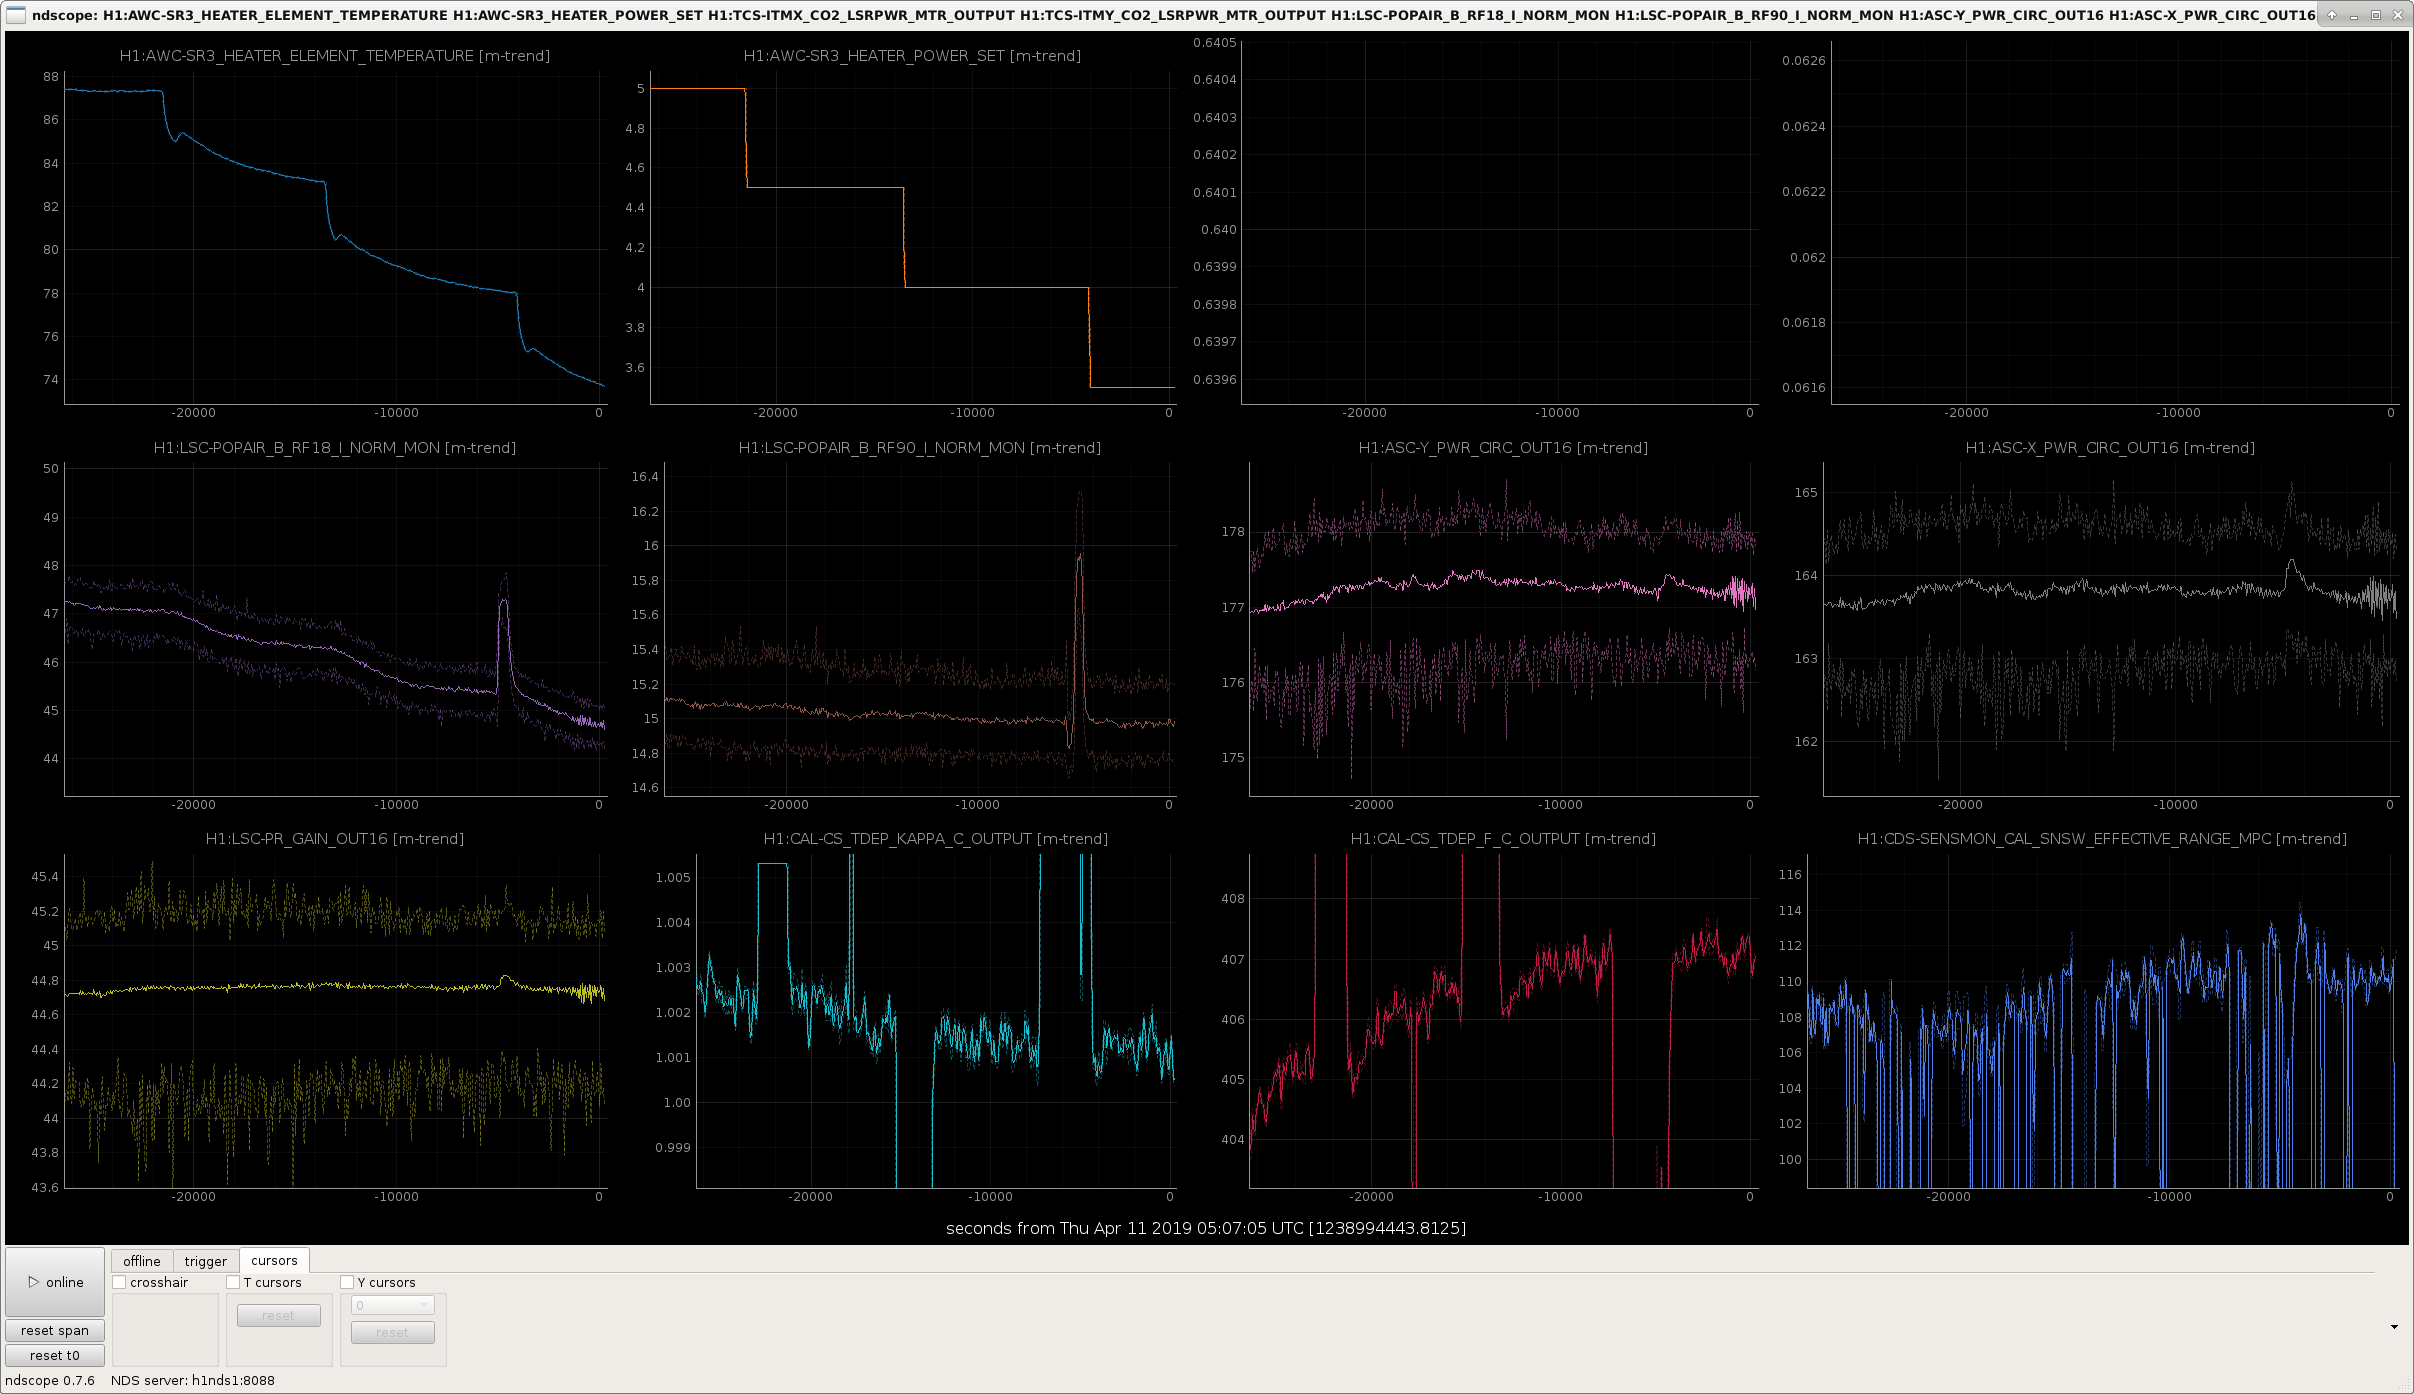
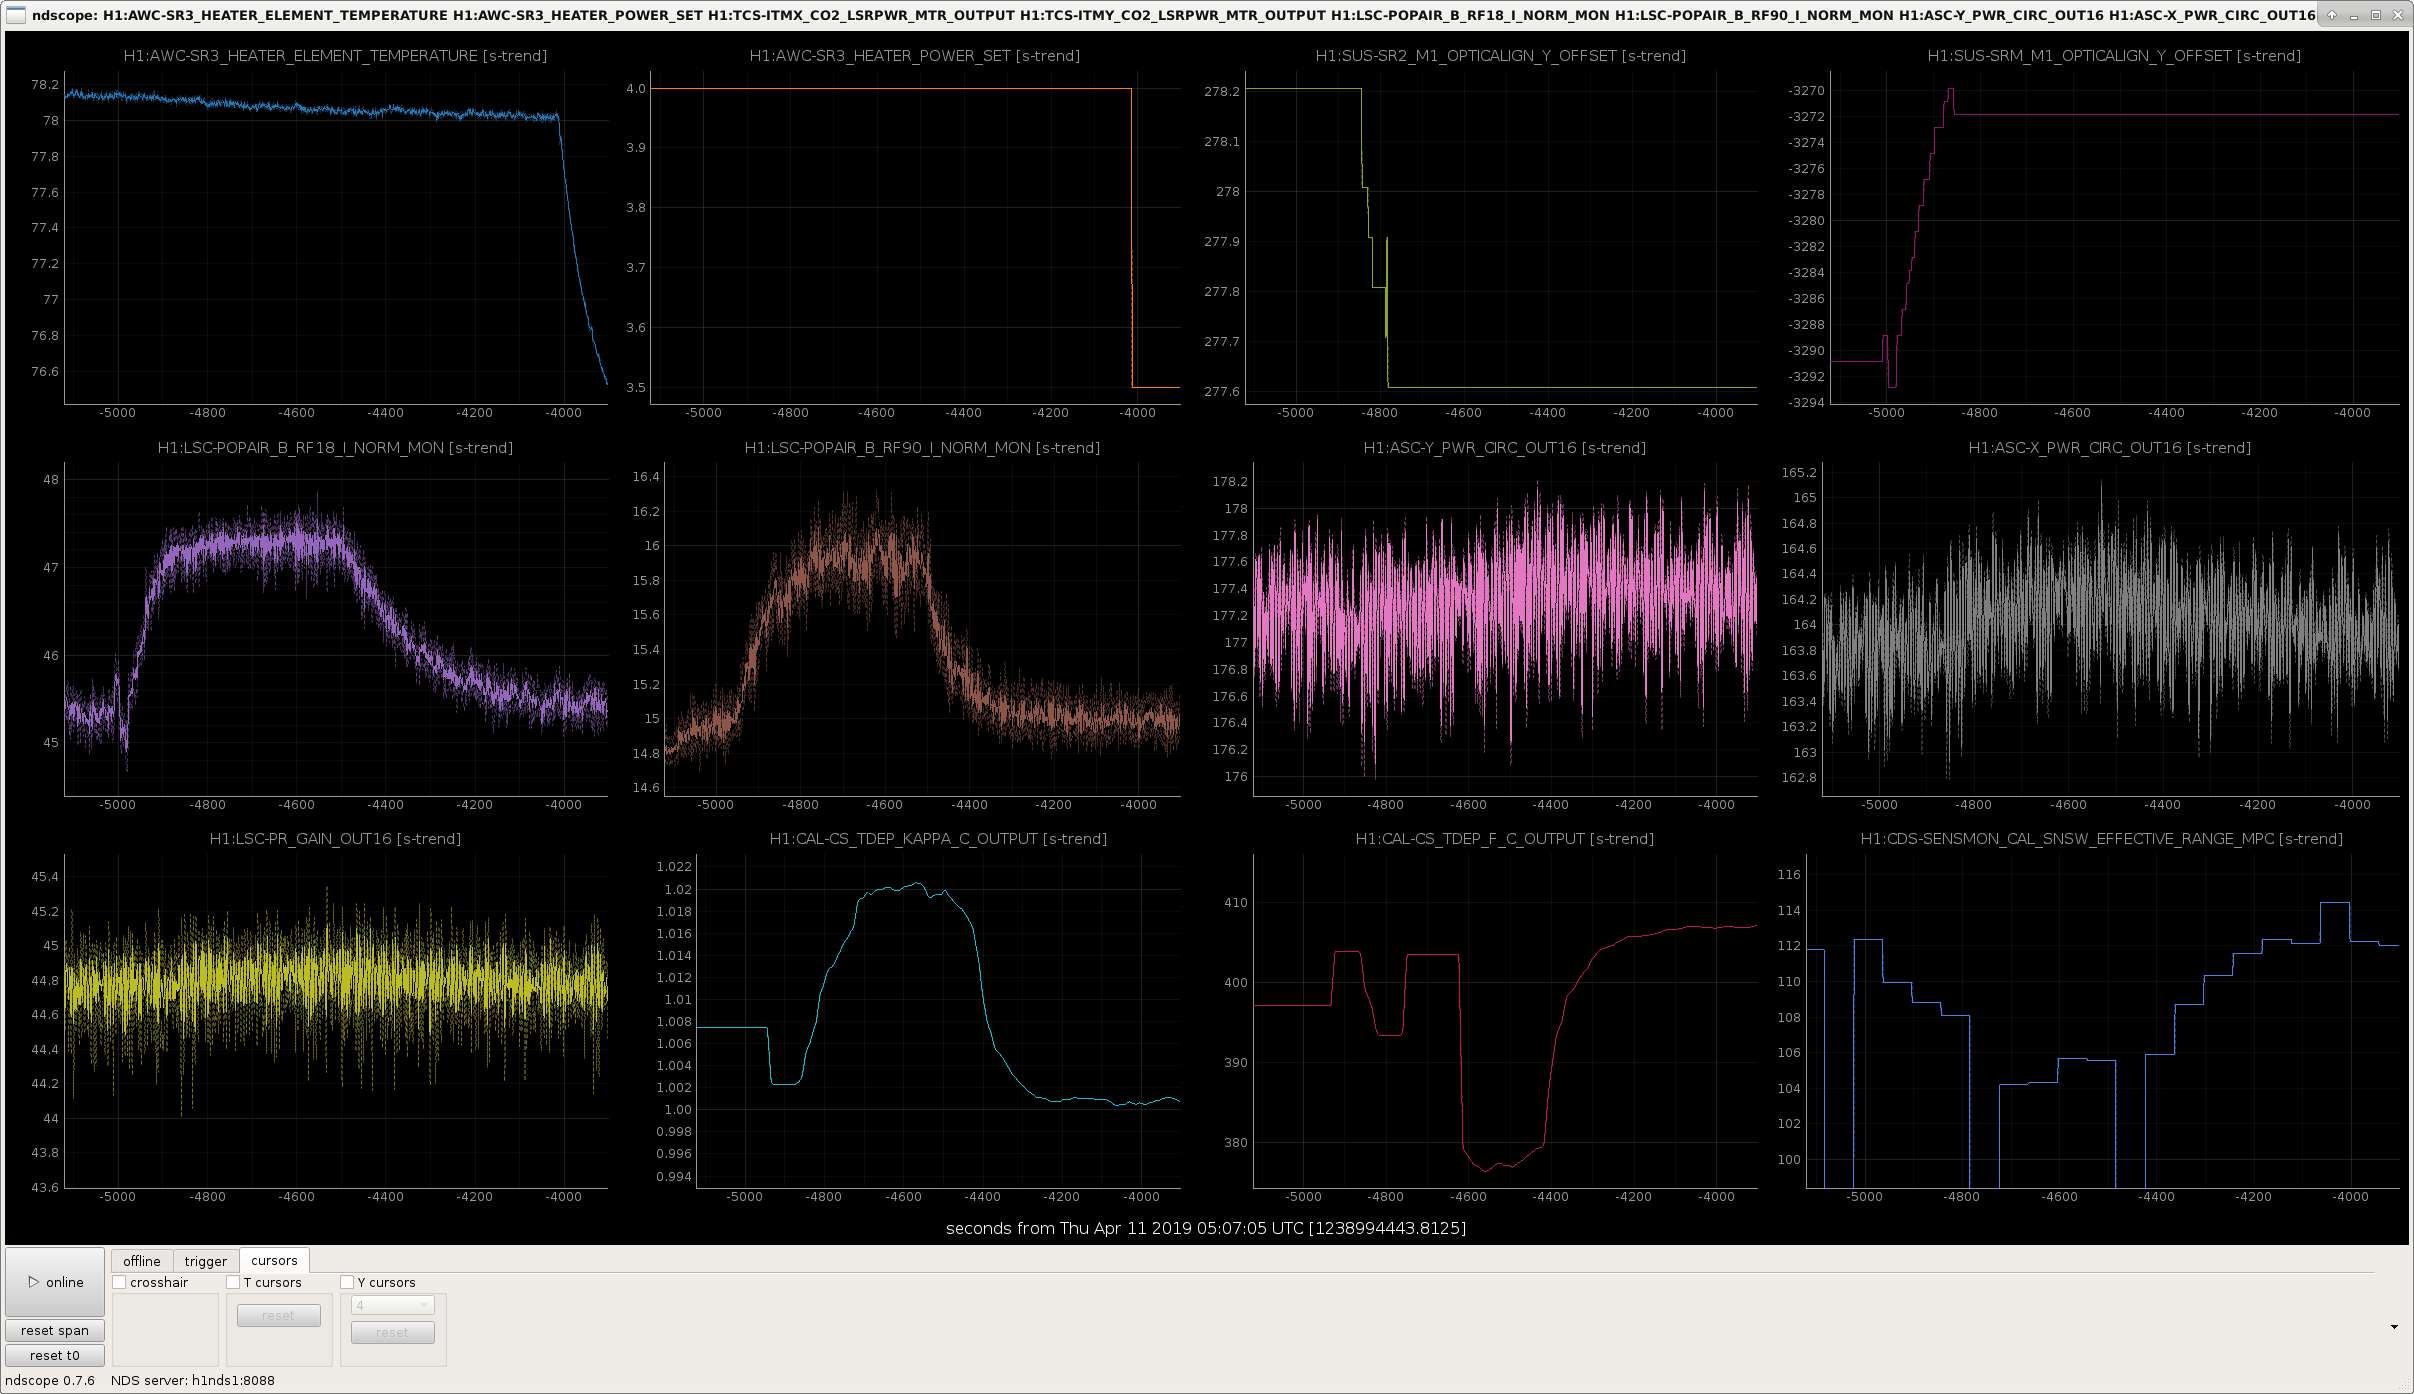
Today we stepped the SR3 heater down in 0.5 W steps, from 5W to 3.5W, according to plan. Here's what we found as we reduced the heating on SR3:
These values are shown in the first attachment, The kick in many signals just before we stepped down to 3.5 W is explained below.
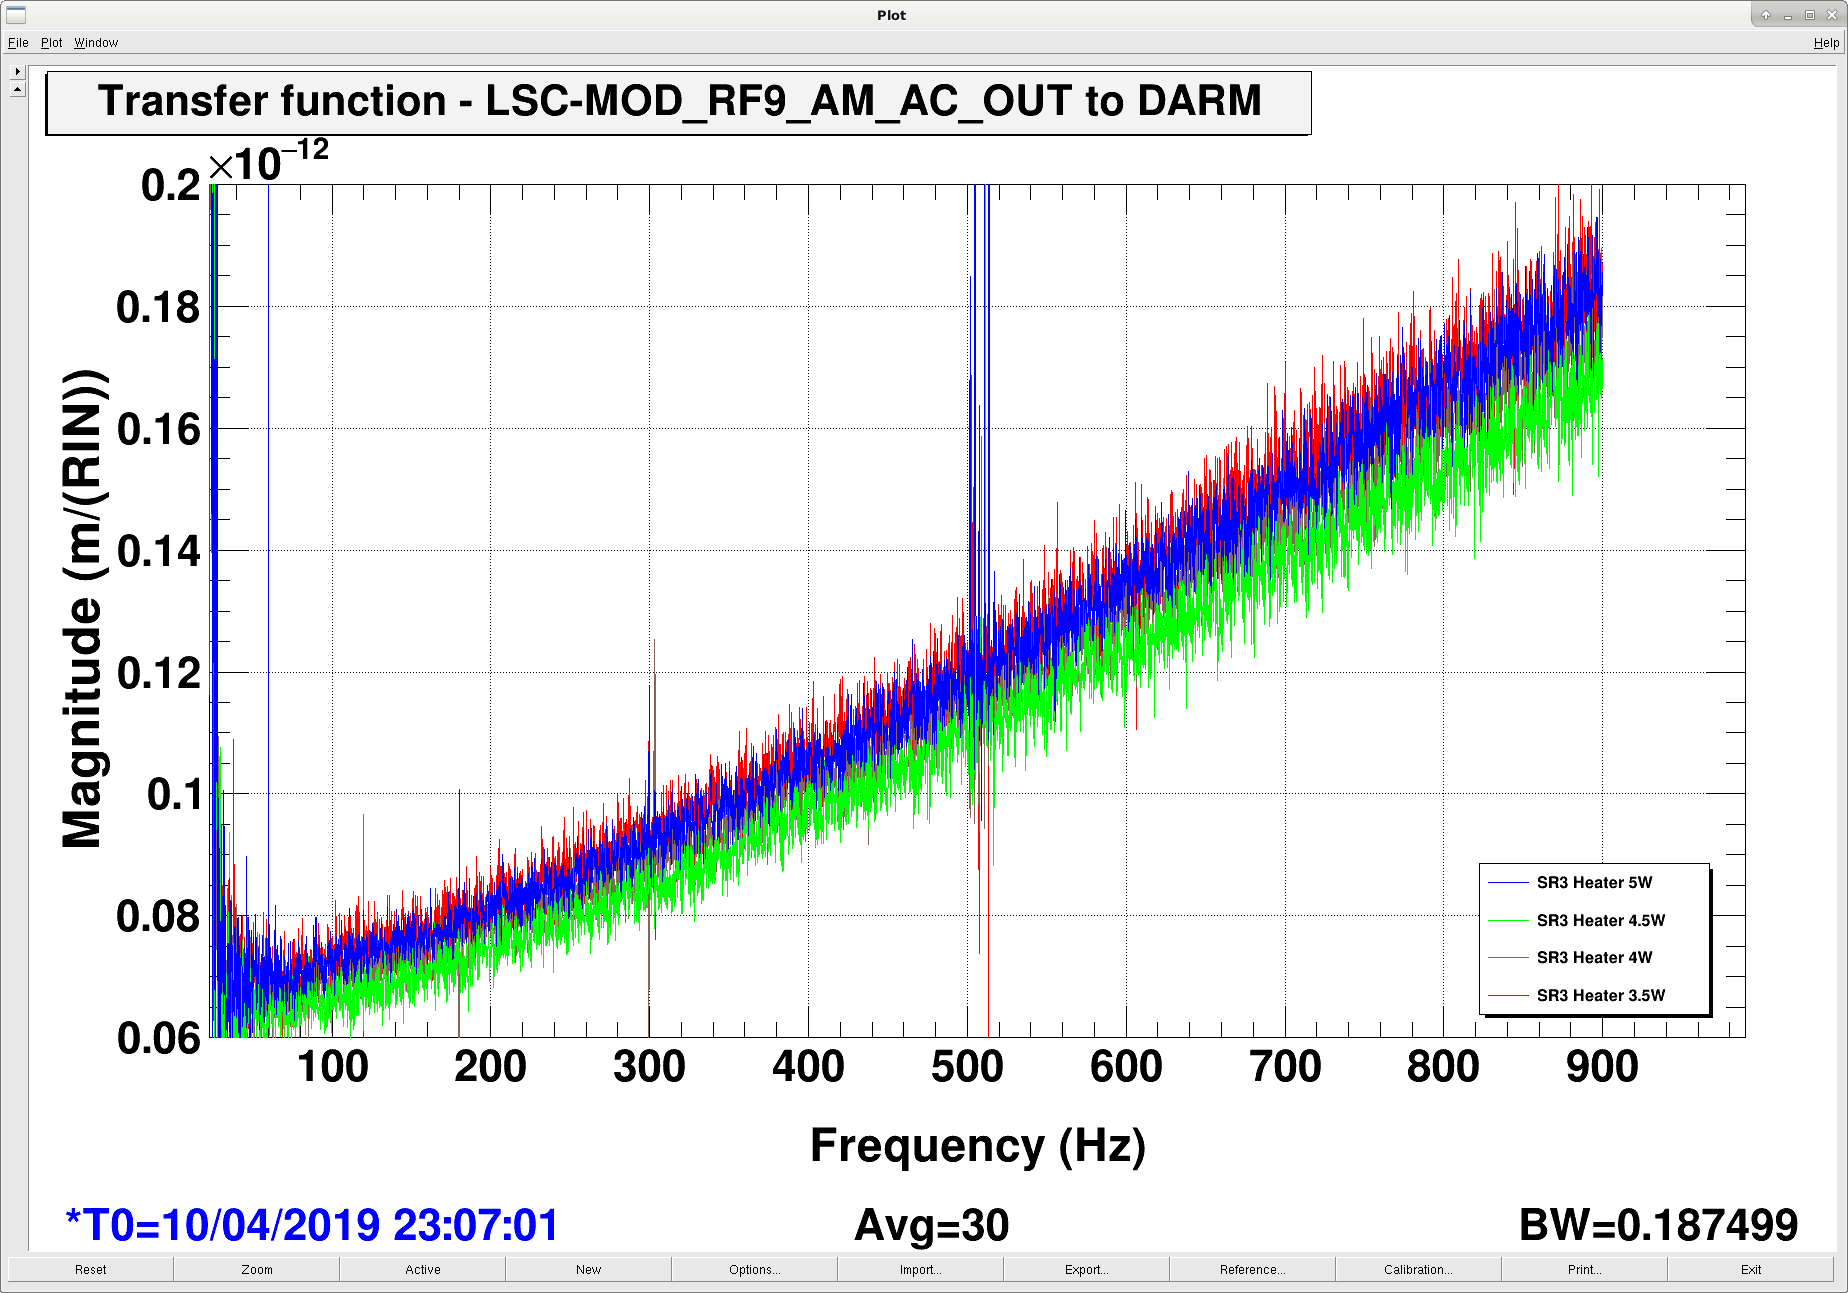
We also monitored the DARM plant, frequency noise coupling, intensity noise coupling, and RF9 RIN coupling at each step.
While we were sitting at 4W on the SR3 heater we checked for detuning in the SRC ASC. This is the big peak in RF18 and RF90 in the first attachment; the 4th attachment is zoomed in during this time. We opened the loops and moved the sliders (top right plots), found nothing too interesting in pitch, but while aligning yaw we saw:
We were surprised that the optical gain increased, that doesn't seem to hang together with the other pieces of information here. Maybe we should consider operating with 4W on the SR3 heater, and re-phasing the SRC ASC for this. [Edit: notes for attachment 4: at t = -4500s we turned the SRC ASC back on, which is why the alignment went back to its nominal level. The calibration lines were off before t = -4800s, and the calibration values before this time are not to be trusted.)
We now understand that the increasing Kappa_C corresponded to a decrease in optical gain. So we were misaligning the SRC when we were aligning it by hand. The fact that RF18 was able to be improved with a misaligned SRC suggests there's room for improvement in the beamsplitter or PRC alignment.
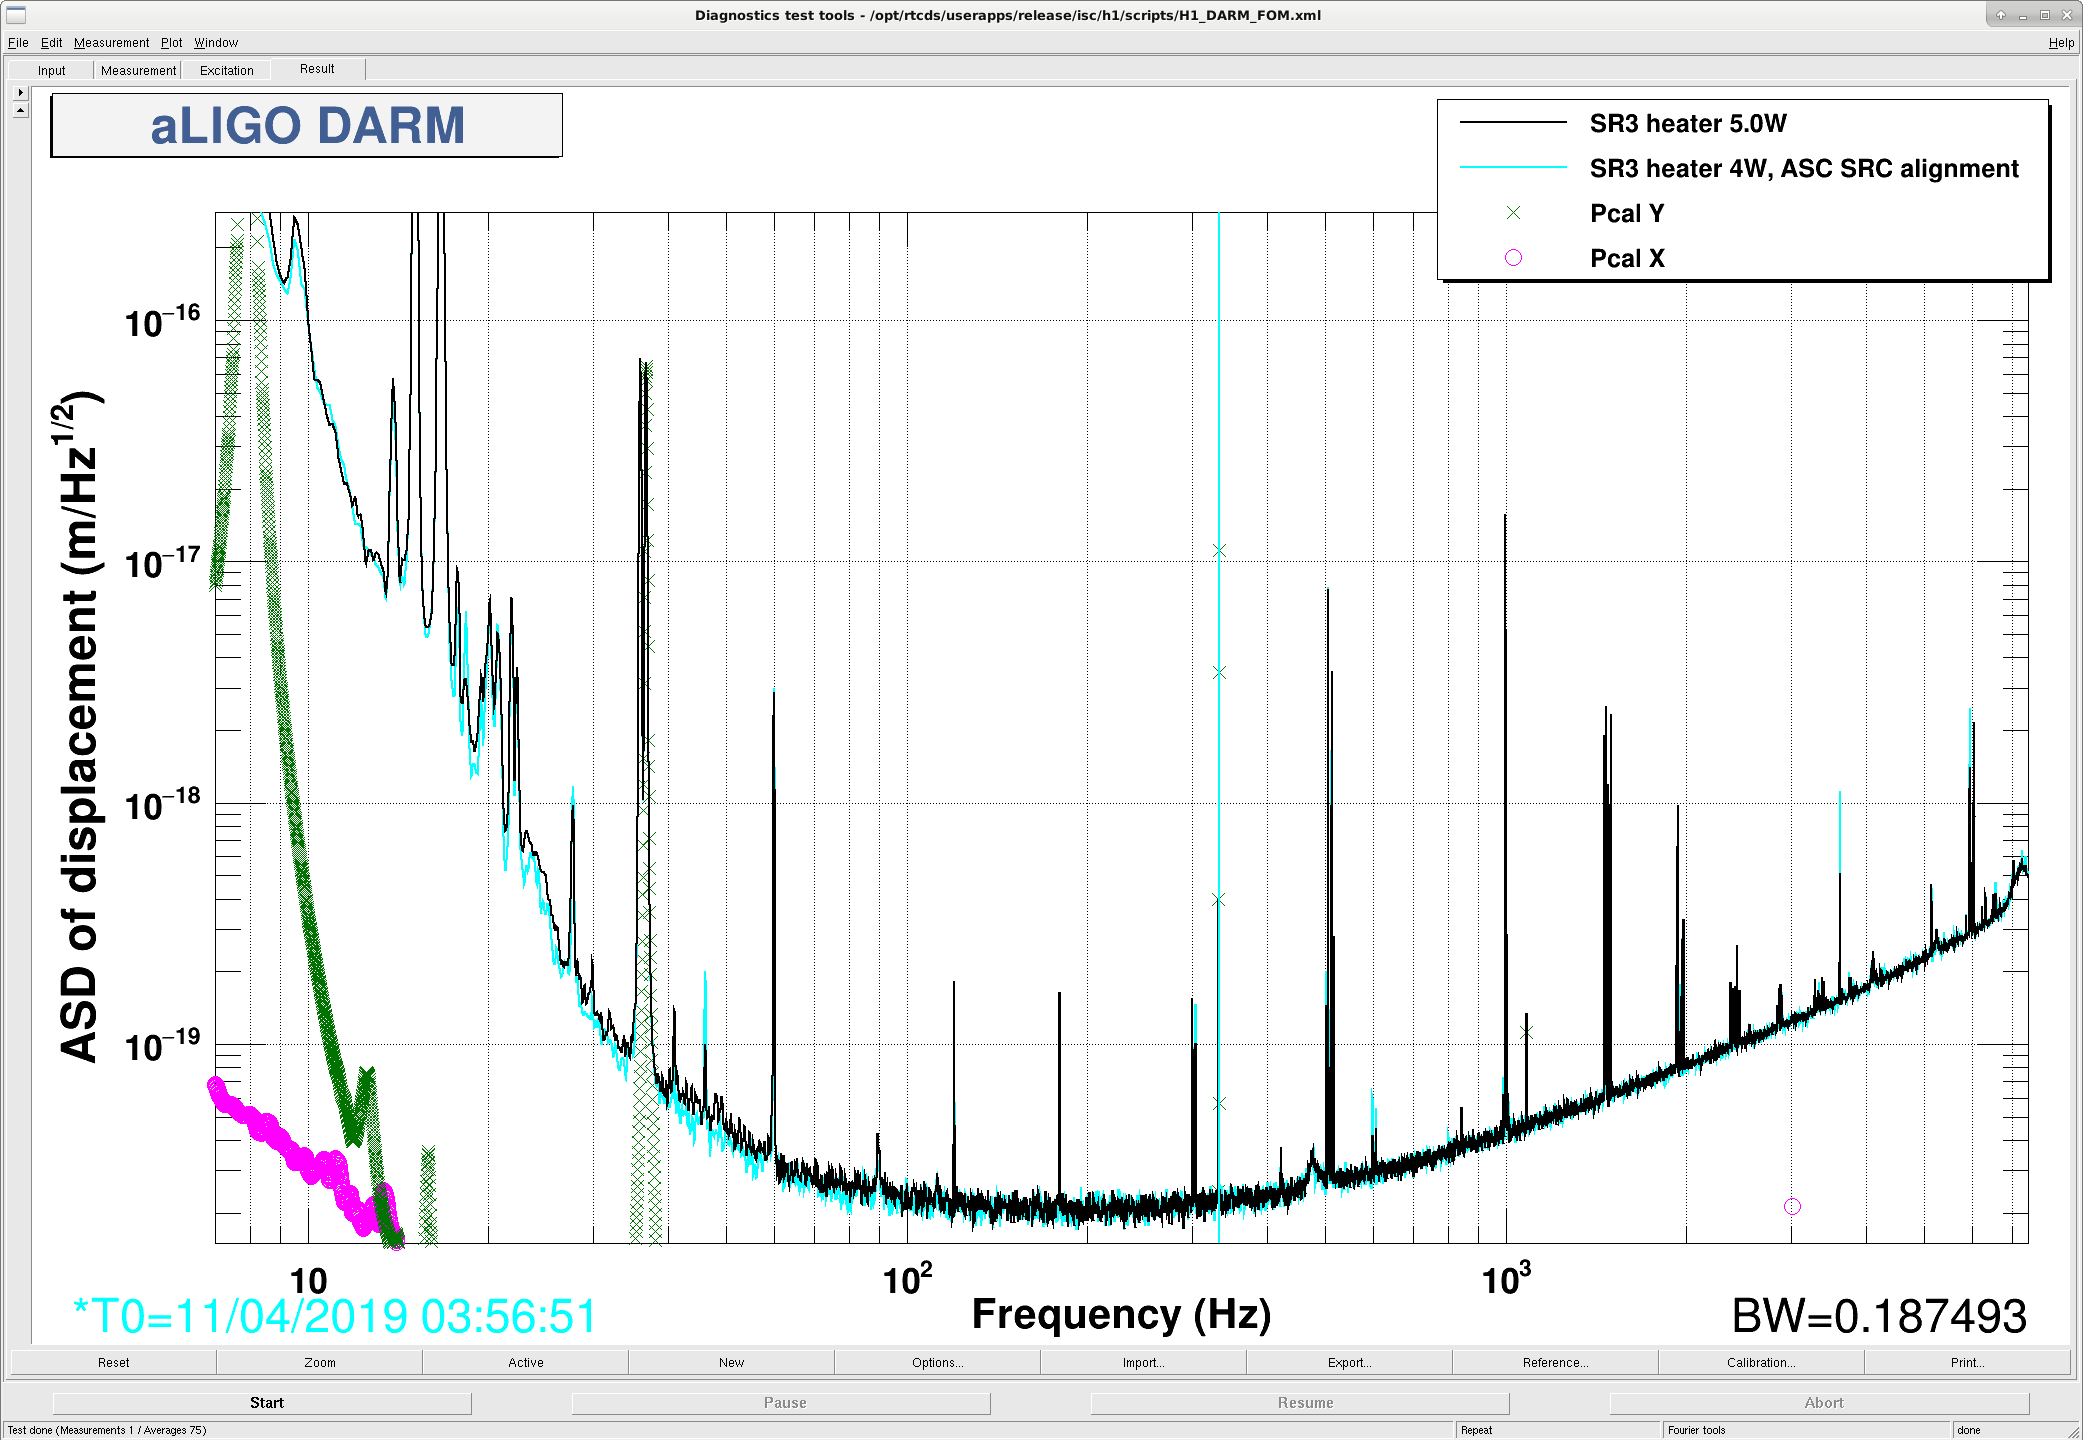
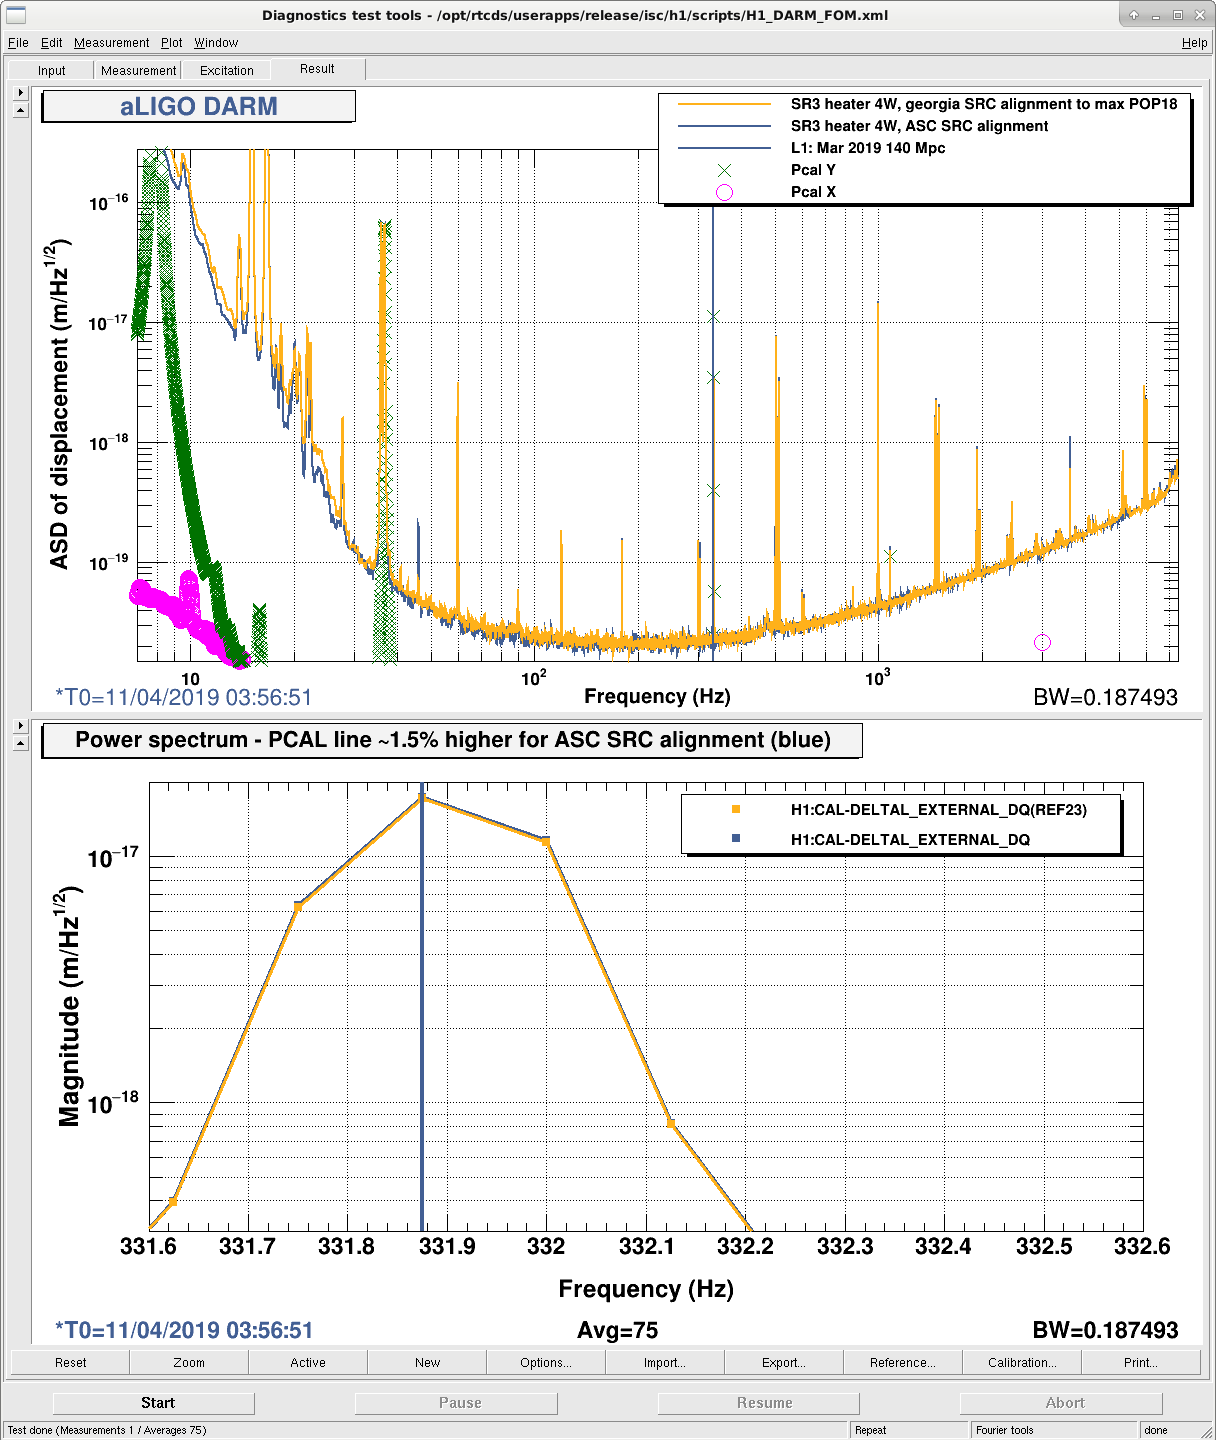
We have made some DARM spectra from times during our SR3 heater test, and SRC alignment test.
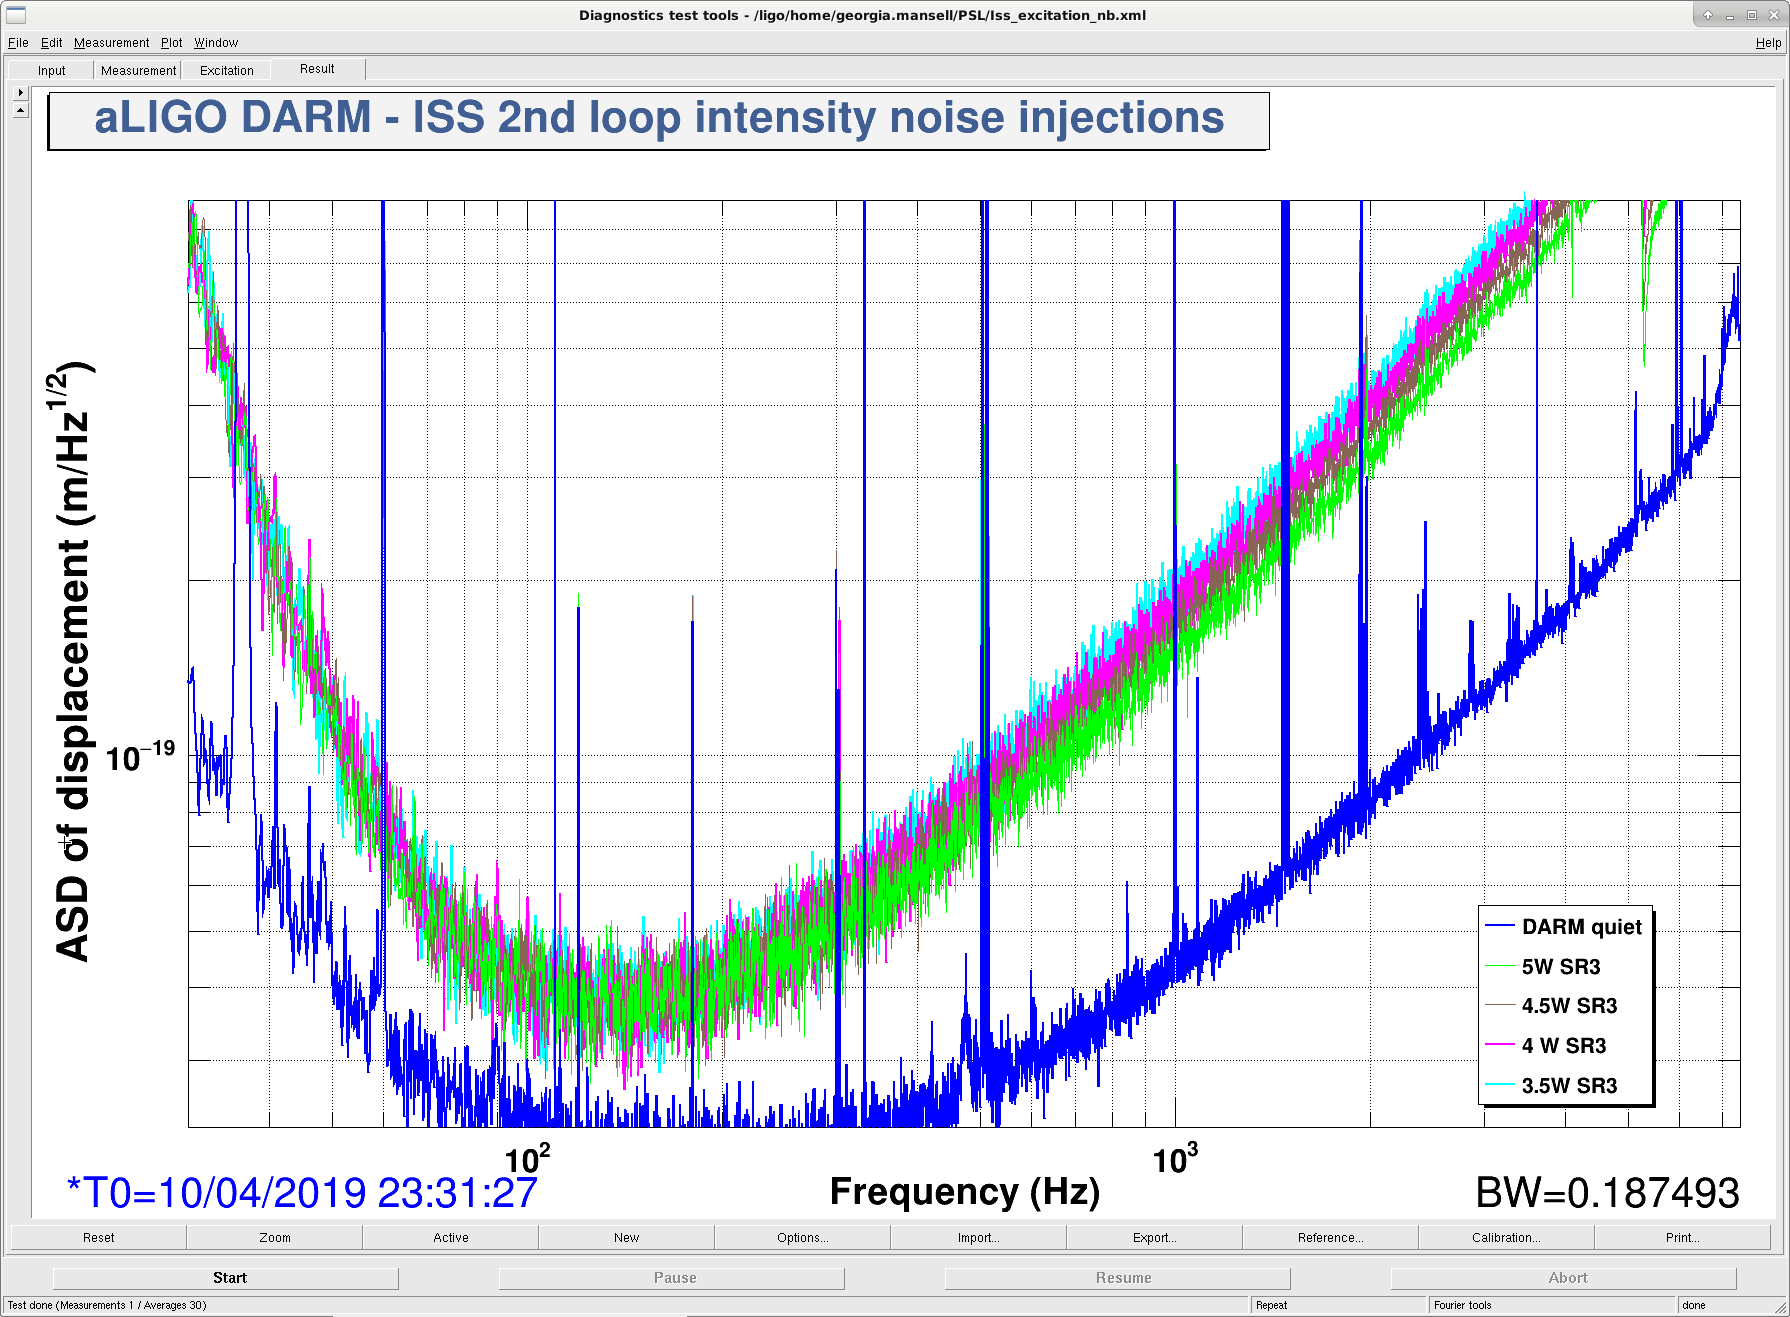
First attachment shows DARM with the SR3 heater at 5W (black) compared to 4W (cyan), showing definite improvement in the bucket, which explains our range increase. A similar spectrum at 3.5 W on the SR3 heater sits somewhere in between these two.
Second attachment shows DARM with SR3 heater at 4W, with the normal alignment (blue), and when we opened the SRC ASC loops and "aligned" by hand, maximising POPAIR_B_RF18 (yellow). It seems like I can undo the SR3 heater improvement by misaligning the SRC...
The DARM plant did not change very much over the period of the SR3 heater move.
I measured the DARM plant 4 times, at SR3 power of 5W, 4.5W, 4W, and 3.5W. The DARM plant did not change very much this time.
According to some MCMC fits:
Optical Gain = 3.20 +- .28 × 106 cts/m (<0.8 % uncertainty)
DARM pole = 417.80 +- 15 Hz (4 % uncertainty)
Delay = 5.31 +- 1.7 × 10⁻⁵ s (33 % uncertainty)
Spring Freq = -5.12 +- 1.6 Hz (32 % uncertainty)
Spring Q = 37.11 +- 4.7 (13 % uncertainty)
This is a different result than the SR3 heater move at 30W input power. We moved the SR3 heater by less this time (from 5W to 3.5W rather than from 0 to 5 W before). We would also like to test the DARM plant for SRCL offset and DARM offset changes.
Also the frequency noise coupling to DARM did not change. Will post plots later once they are correct.
Posted DARM ASDs, calibrated frequency ASDs, and frequency coupling TF plots. DARM calibration: 6 zeros at 30 Hz, 6 poles at 0.3 Hz, gain of 1 Frequency Calibrations: Same as 46864. See attached freqCals.txt. Comparison to 30 W coupling: 45831. Before, we had a dip in the freq-to-DARM coupling at around 30 Hz where the radiation pressure and contrast defect effects destructively interfered. Now that effect seems to have flattened out. (Plot 3 in the PDF) Over the SR3 heater test cooling from 5W to 3.5W, it seems our freq-to-DARM coupling increases by a few percent, but does not change too radically.
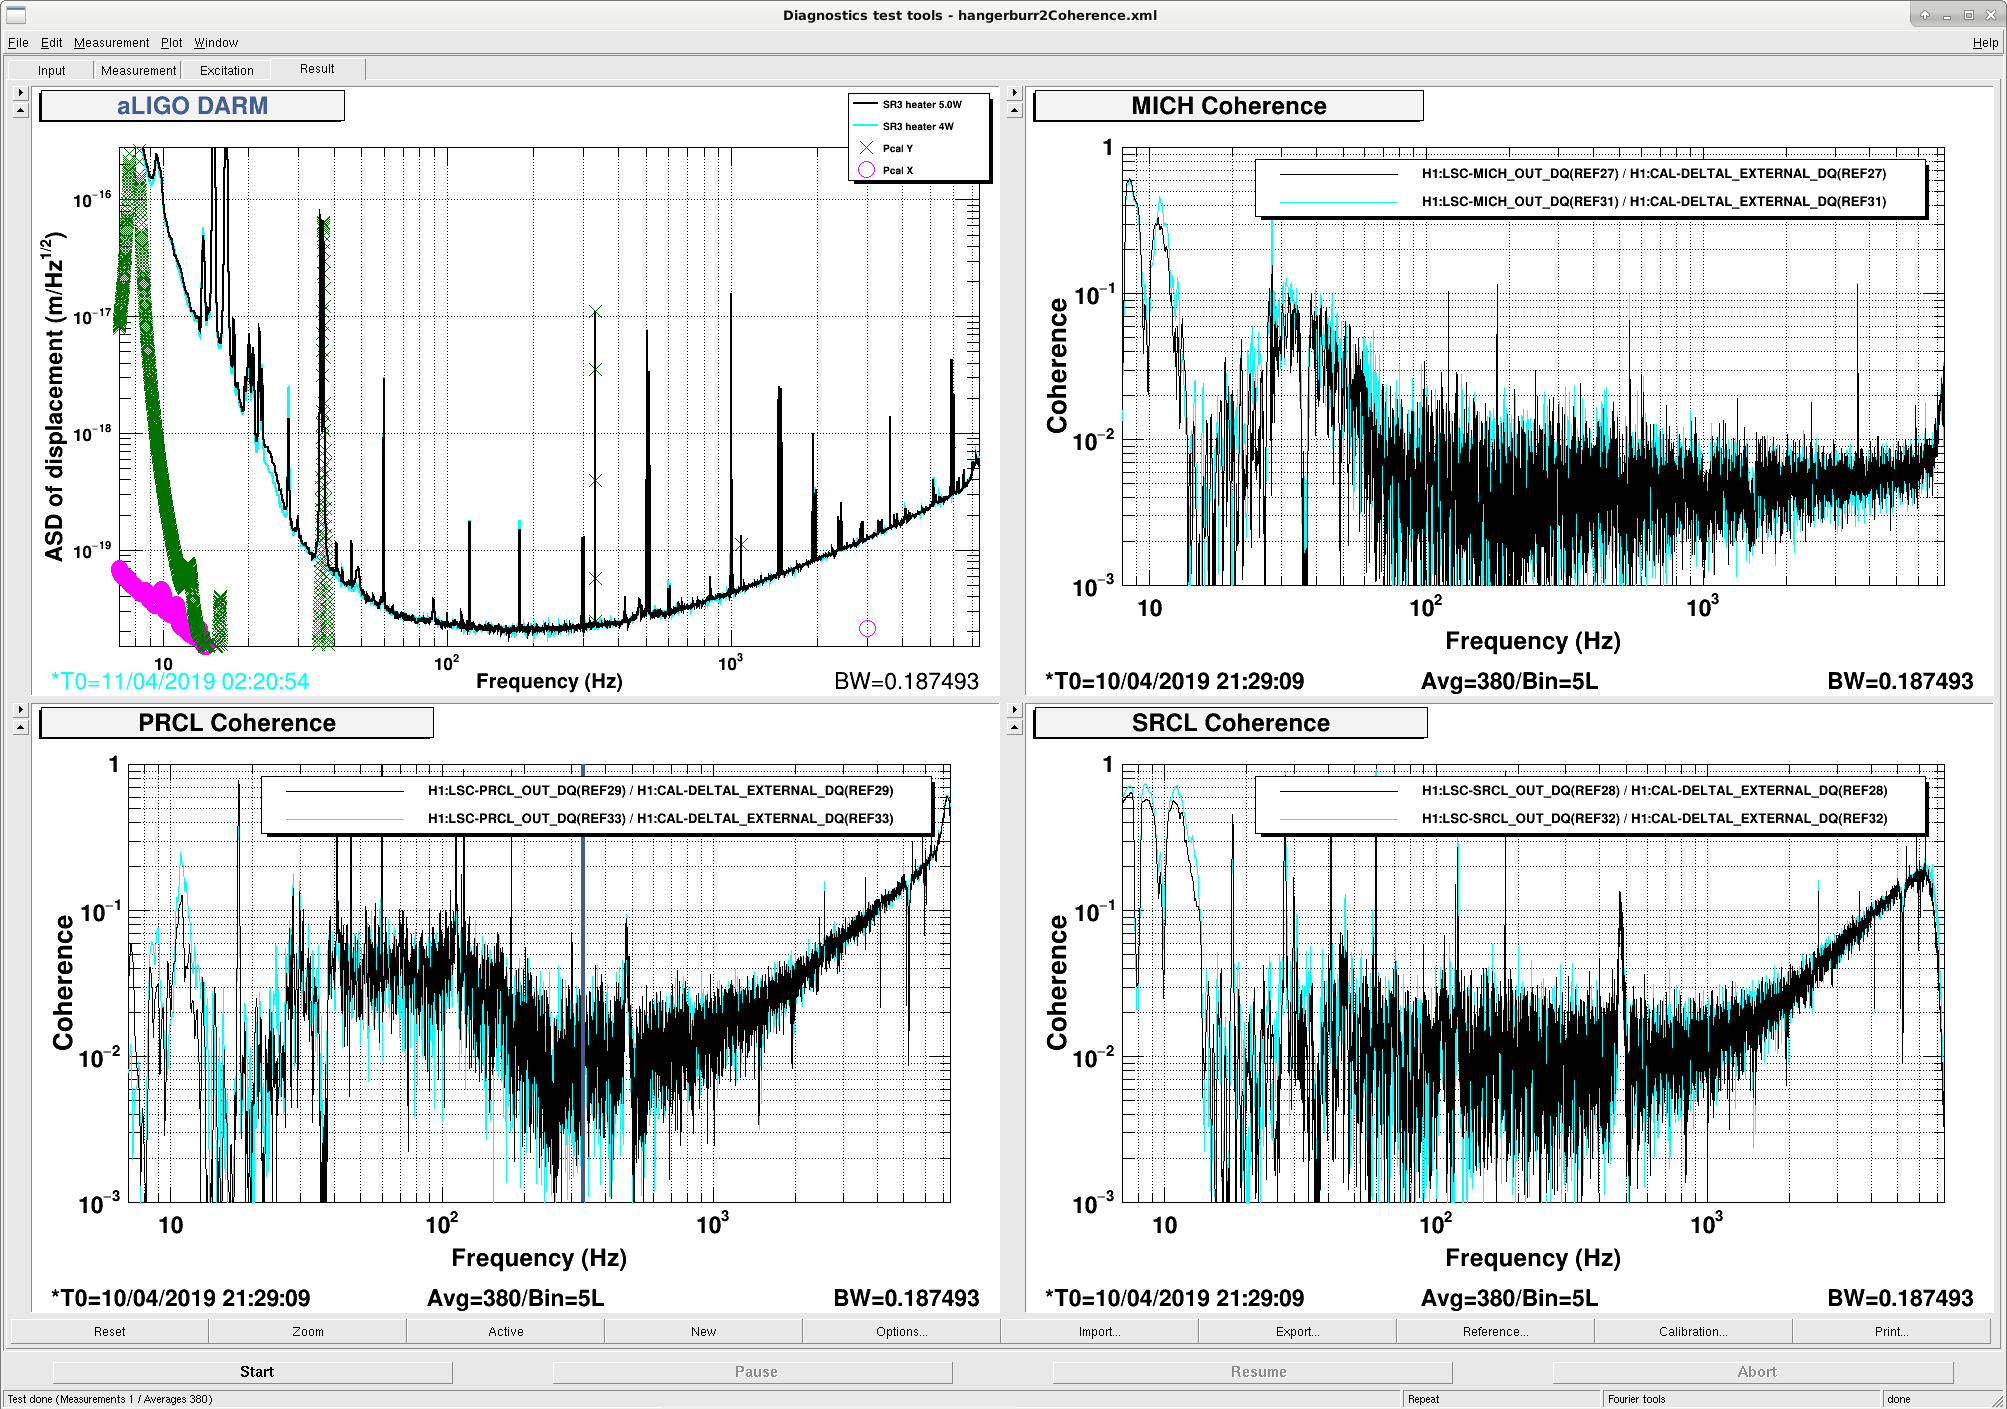
Sheila was thinking the SR3 heater improvement could be attributed to the changing MICH and SRCL feed forward. I had a look at the coherence between DARM and MICH/PRCL/SRCL during the SR3 heater test, comparing a time at 5W (black) and a time at 4W (cyan), and am not convinced the coupling changed significantly. If anything the MICH coherence is worse at 4W than 5W in our frequency band of interest (20-60 Hz).
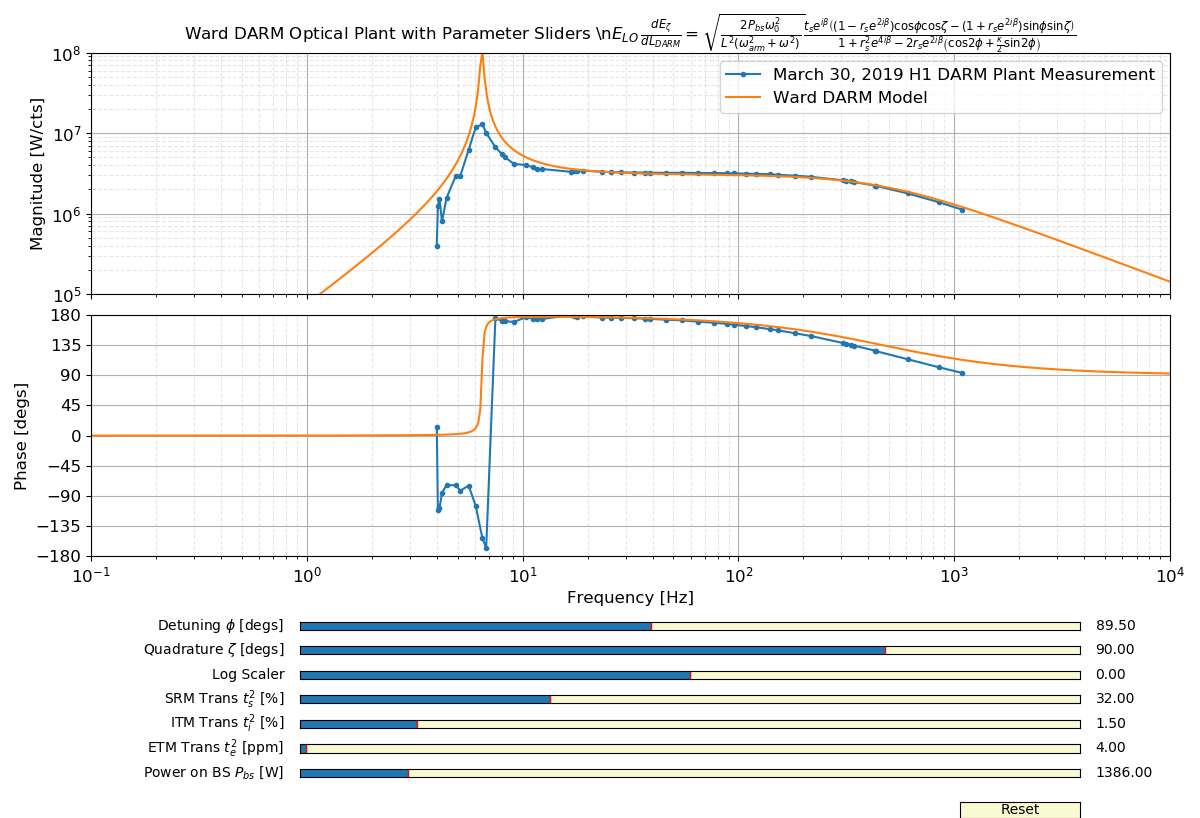
We've measured the DARM plant to have a prospring at 6 Hz and a Q of about 4. About the spring frequency, the phase goes through around -90 degrees, and not the expected +180 degrees alog 48083 This +180 degrees is not typical for causal control systems, but it is expected from SR IFOs as discussed in Section II B from BnC. Using the Ward DARM model (Eq 3.83) I was unable to achieve a satisfactory fit of the H1 DARM plant at low frequencies, so I made some sliders to see if I could get a heuristic match. I was not able to for reasonable IFO parameters. I discovered that our Q is far too low given our optic transmissions. One can lower the Q of the optical spring by increasing the SRM transmission or reducing the ITM transmission. However, changes to these parameters also change the frequency of the optical spring and the DARM pole. The pictured plot shows the best Ward model I was able to come up with to explain the current plant, featuring detuning of -0.5 degrees. DARM Plant Measurement I began questioning the measurement itself, but the procedure is pretty simple. A PCAL to DARM measurement gives C/(1 - G), where C is the DARM plant, and G is the DARM OLG. Then a DARM OLG is taken to get 1/(1 - G), and these two measurements are divided to give the DARM plant C. The PCAL calibration into meters is just two real poles at 1 Hz. This has phase of -160 degrees at 6 Hz, i.e. there is some dynamic phase rotation happening at LF due to the calibration which may not be real.
Does it change with arm power? dc offset power? Does AS45 see the same feature?
March 13 antispring DARM plant at 30 W Input Power and 0 W on SR3 heater: 47493 March 18 antispring to prospring at 30 W Input Power with 0 W to 5 W on the SR3 heater: 47604 March 20 prospring at 35 W Input Power with 5 W on SR3 heater: 47728 April 12 prospring at 35 W with 5 W to 3.5 W on SR3 heater: 48453 There have not been tests for the following: - Spot positions (for L2A2L effects) - SRCL offset - DARM offset Based on the above results, I think that higher arm power and higher SR3 heater power both push the DARM optical prospring to higher frequency. Danny Vander-Hyde tells me that the SRC gouy phase goes like around ~1 degree/watt of SR3 disk heater power, so we probably change the SRC gouy phase by ~5 degrees on March 18.
Craig, Georgia
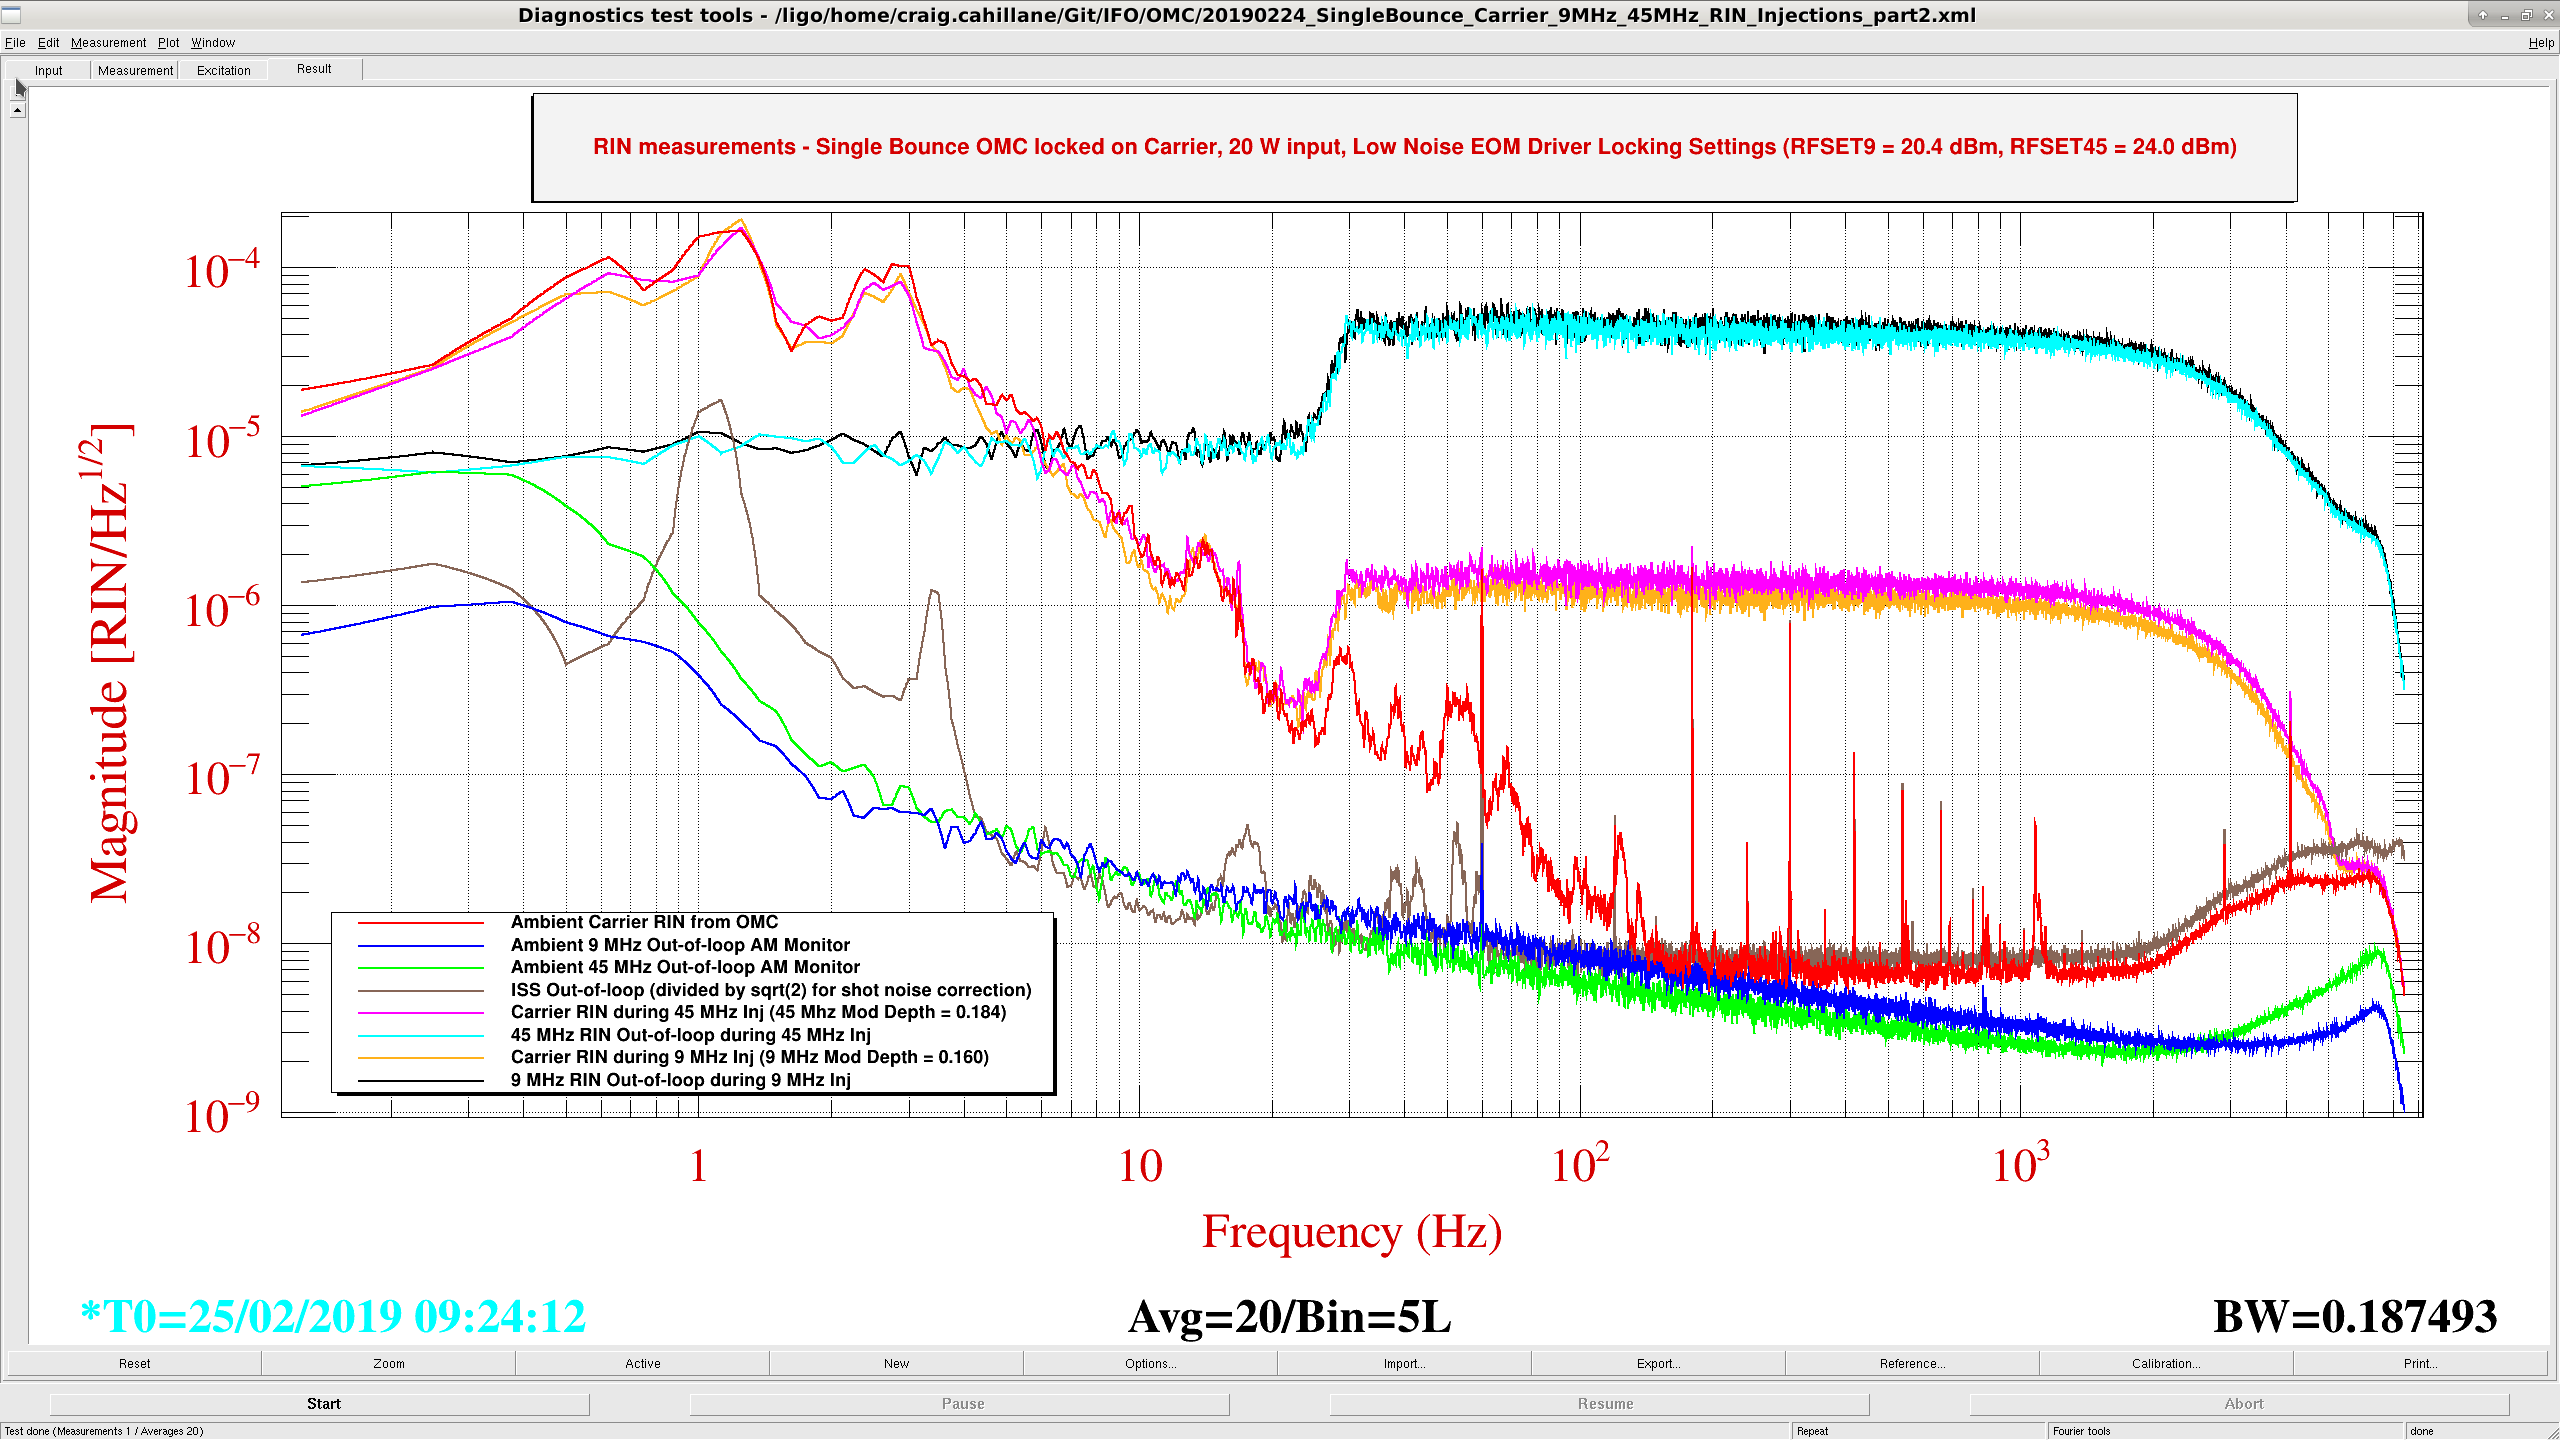
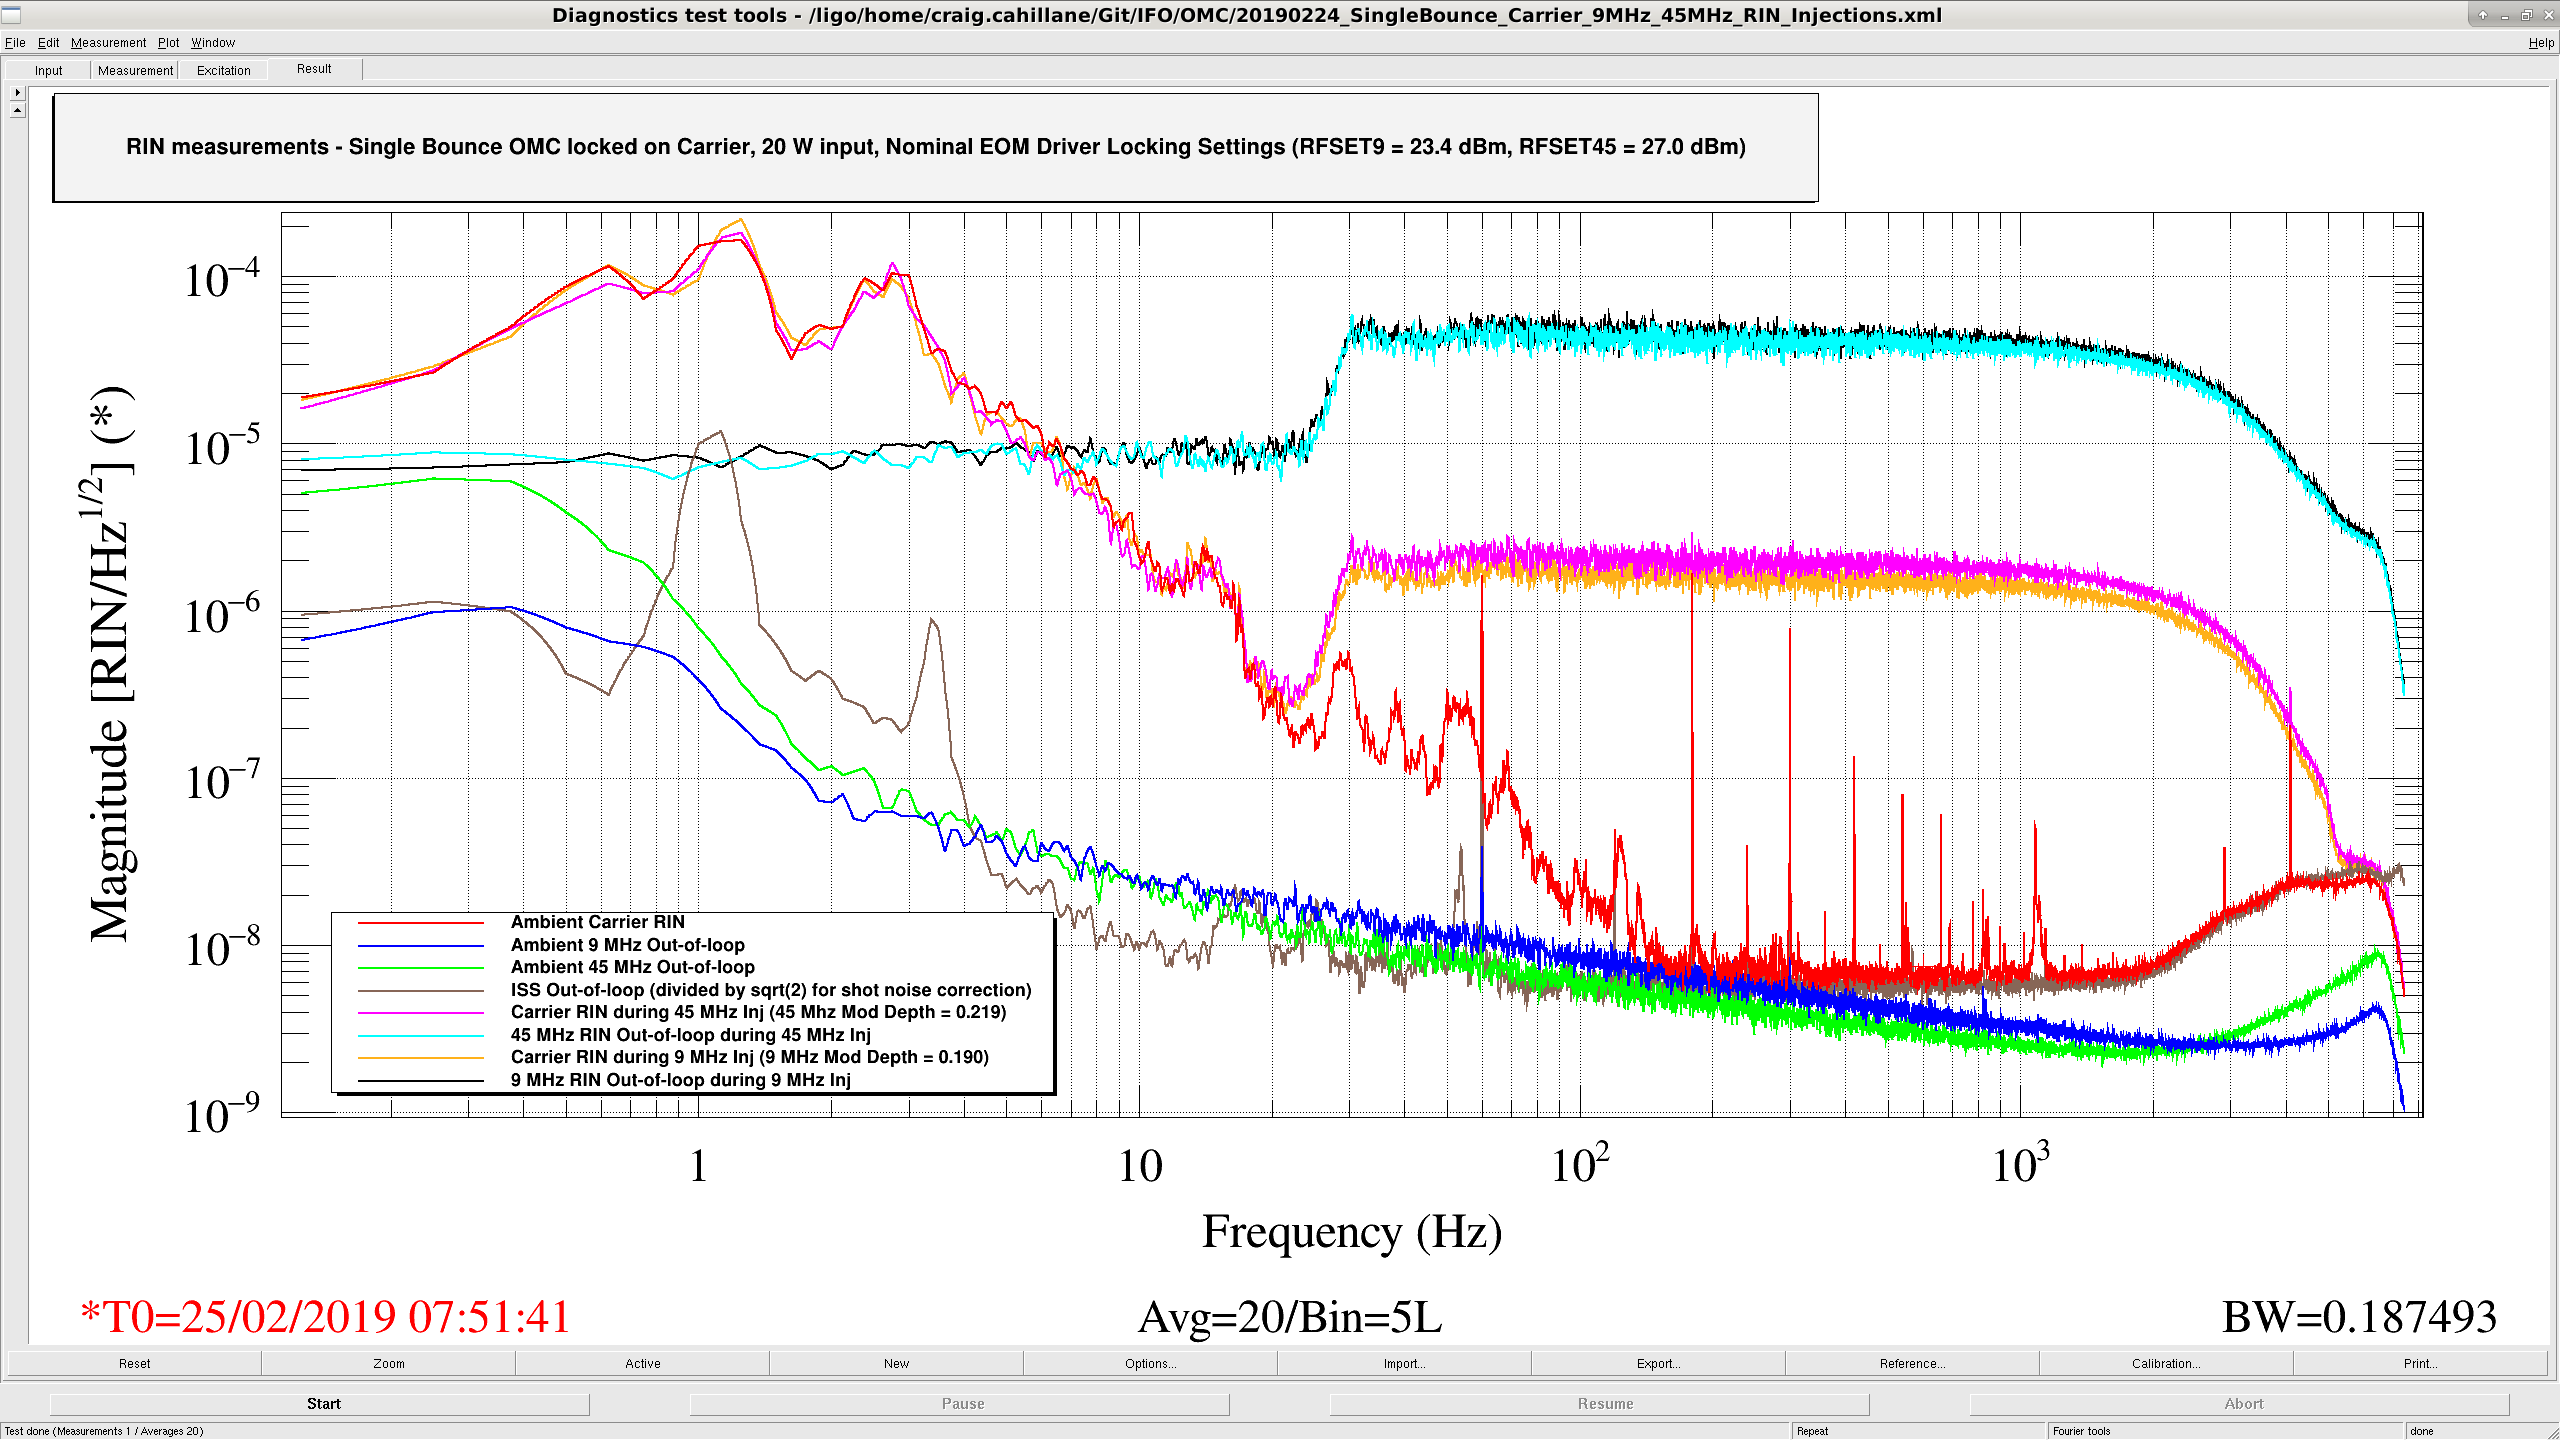
Today we locked the OMC on single-bounce carrier with 20 W input and injected large sideband intensity noise to measure the modulation depths for locking and low noise settings.
Results
Sideband Locking EOM Driver Slider Value [dBm] Low Noise EOM Driver Slider Value [dBm] Locking Mod Depth Low Noise Mod Depth
---------------------------------------------------------------------------------------------------------------------------------------------
9 MHz 23.4 20.4 0.190 0.160
45 MHz 27.0 24.0 0.219 0.182
Method
A simple comparison of the carrier and sideband RINs when injecting.
RIN0(f) = Γ2 RINsb(f)
We know that we can trust the 9 and 45 MHz RFAM monitors when we inject high broadband noise in the EOM driver.
At the same time, if we inject enough sideband RFAM, the carrier RIN should show through in the OMC transmission.
All injections were amplitude=10, ellip("BandPass",4,1,30,5000) through the LSC EXTRA AO 3, which is connected to the front of the drivers.
Reason
We've been running several 9 MHz RIN tests. It is good to know, for some high level of sideband RIN, the level of carrier RIN we expect.
Old EOM Driver alogs
Koji installation
Daniel boost
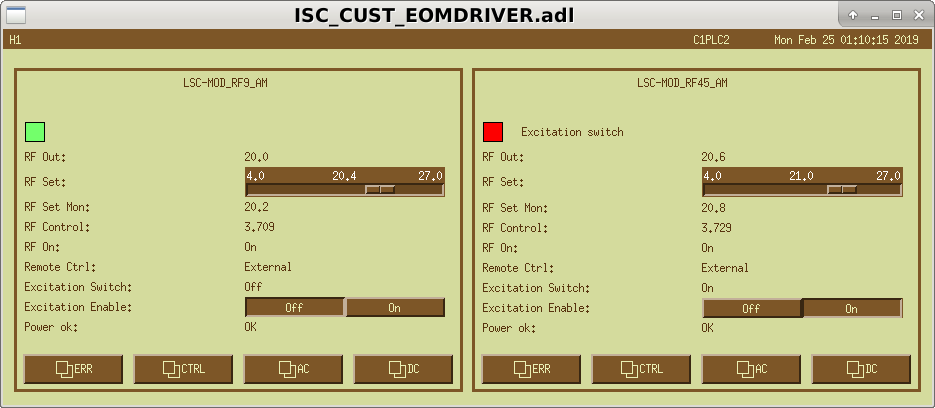
These numbers are likely wrong because we cannot trust the calibration of the RFAM monitors when we move the sliders away from nominal.
Math
I double checked the math here, I think there is a factor of -2 missing:
If P0 = Pc + 2 Ps, where P0 is initial power, Pc is power in the carrier, and Ps is power in a single sideband. If we require P0 to be constant, then taking the derivative wrt modulation depth gives
dPc = -2 dPs
Pc = J0(Γ)2 P0 ≈ P0
Ps = J1(Γ)2 P0 ≈ Γ2/4
RINc = dPc/Pc
RINs = dPs/Ps
RINc = - Γ2/2 RINs