TITLE: 03/27 Eve Shift: 23:00-07:00 UTC (16:00-00:00 PST), all times posted in UTC
STATE of H1: Lock Acquisition
OUTGOING OPERATOR: Niko
CURRENT ENVIRONMENT:
Wind: 8mph Gusts, 6mph 5min avg
Primary useism: 0.03 μm/s
Secondary useism: 0.14 μm/s
QUICK SUMMARY:
Relocking.
TITLE: 03/27 Day Shift: 15:00-23:00 UTC (8:00-16:00 PST), all times posted in UTC
STATE of H1: Locking
INCOMING OPERATOR: Patrick
SHIFT SUMMARY: Had a few hours of observing in the morning. Locking has been fairly quick today, with only commissioner-caused locklosses. ALS-X glitches made it difficult to reacquire every now and again. Wind is down.
LOG:
15:00 (8:00) Start of shift
15:52 (8:52) Vanessa to MX
16:30 (9:30) Took us out of Observing for commissioners
17:32 (10:32) Injections knocked us out of lock, requesting NLN
18:27 (11:27) In NLN and Observing, after accepting some SDF changes
18:46 (11:46) Switching to Commissioning
18:52 (11:52) Lost lock due to injections, reacquiring
19:25 (12:25) At NLN Cal, resuming commissioning
20:03 (13:03) Kyle to MX
20:32 (13:32) Kyle back from MX
20:58 (13:58) Kyle to MY
21:50 (14:50) Kyle back from MY
22:37 (15:37) Lost lock due to injections, reacquiring
23:00 (16:00) End of shift
Addressed TCS Chillers (10:03 - 10:09 AM PST today/Mon)
Added some explanation to the whitening screens about the meaning of the bits in the readback. This is done through a link to a new screen.
PS. Why do the DCPDs not use the same whitening controls as all others?
DQ Shift Page URL: https://wiki.ligo.org/DetChar/DataQuality/DQShiftLHO20190318
Recovering from commissioner-caused lockloss, reacquiring to continue commissioning. ALS-X glitches have been causing the occasional early lockloss while trying to reacquire. Winds still around 15-20 mph, supposed to decrease as the day goes on.
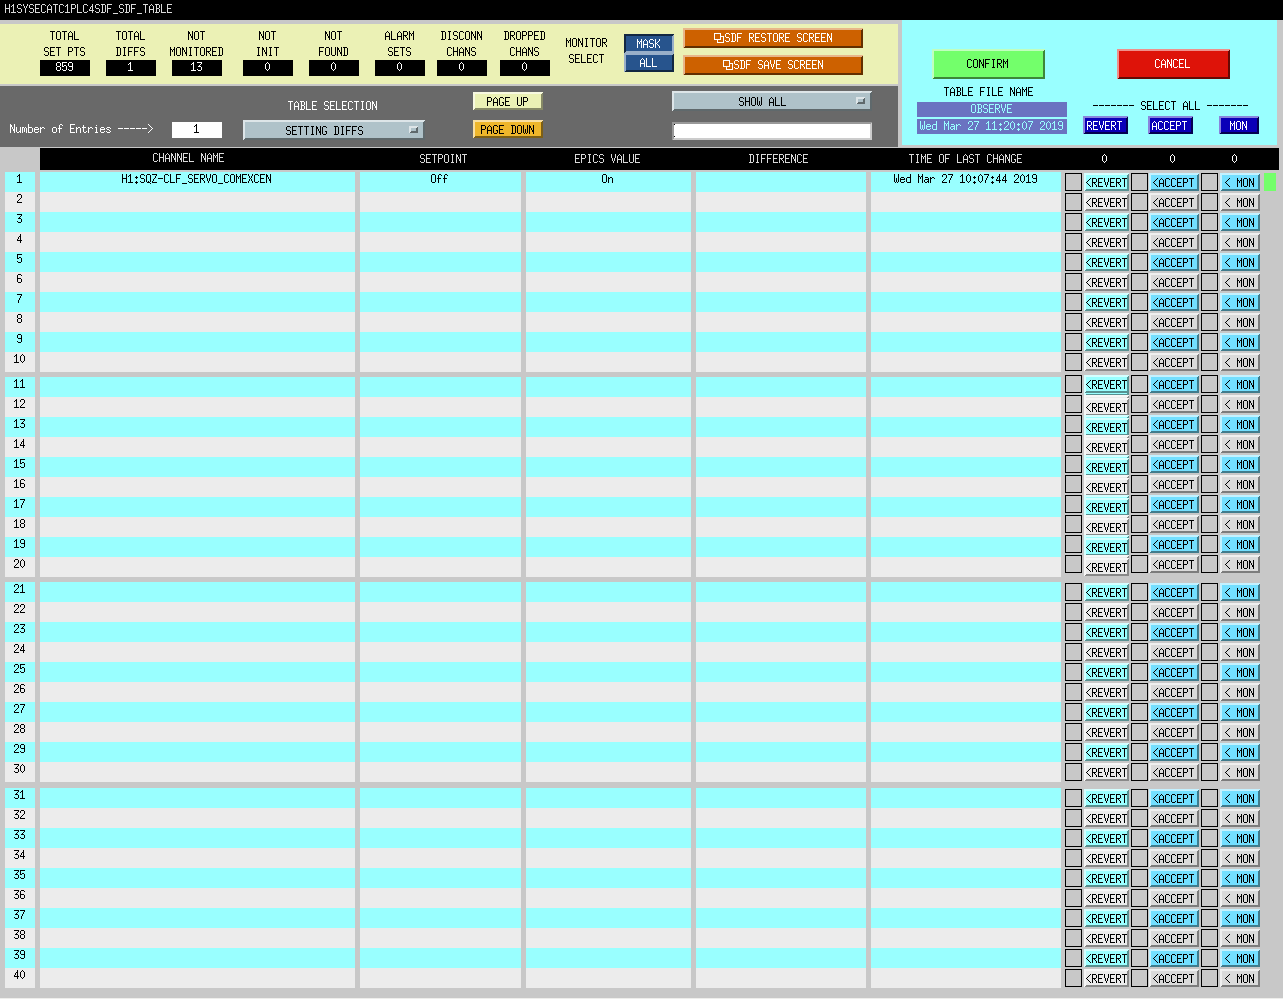
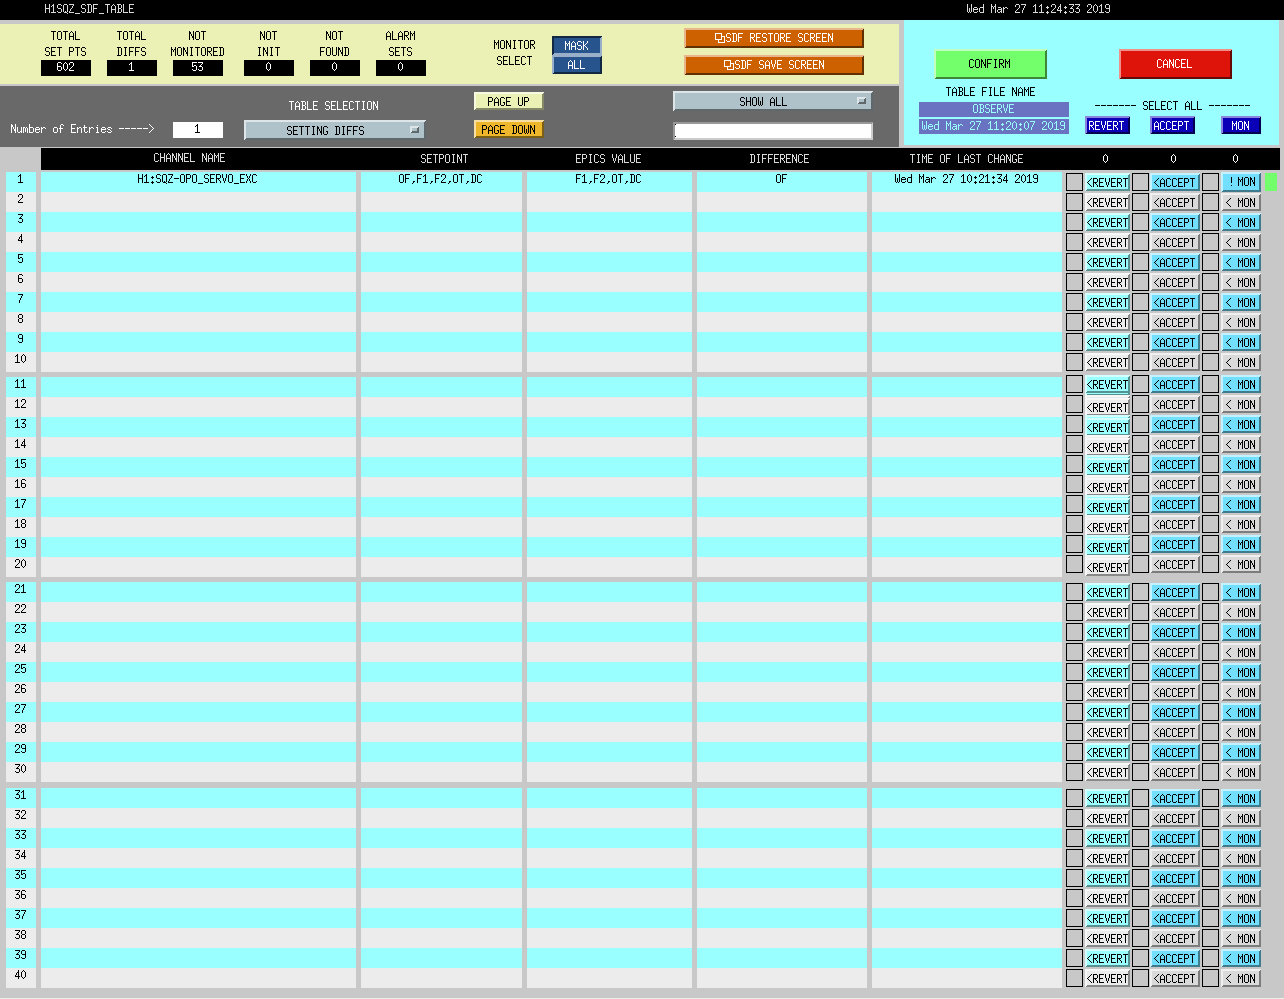
Accepted the attached SDF differences to take us into Observing.
After maintenance yesterday I looked at the 3 Gig E cameras on hte PSL. One had been unplugged during the network switch power failure. We were concerned too many things were drawing power over the POE and these were the last items plugged in so first out. After replacing the power supply two of the cameras were restored. The thirds was done around 1215 yesterday. I also did a hard reboot of the other cameras. They all appear to be working again though I am not sure what was wrong with camera 28. As of 1220 Tuesday all 3 were working.
Put 30 mL into the crystal chiller, no fault lights on either chiller.
Canister filter labeled 'X' slightly more yellow than canister filter labeled "D".
Ops Shift Transition: 03/27/2019, Day Shift 15:00 – 23:00 (08:00 -16:00) - UTC (PT)
State of H1: Locked at NLN
Intent Bit: Observing
Weather: Overcast. Winds are 15-20 mph, showing up more at EY. Rain forecast for around 2pm. Temperatures are in the lower 40s to upper 50s.
Primary 0.03 – 0.1Hz: 0.01um/s in Z, X and Y up due to wind
Secondary 0.1 – 0.3Hz: 0.1um/s
Outgoing Operator: Jeff
Quick Summary: IFO is locked at NLN with 110 Mpc from 35.2w. Have been in Observing for the past ~3 hours.
Sharan Banagiri, Anamaria Effler, Philippe Nguyen, Kara Merfeld, Robert Schofield
We made about 110 acoustic, magnetic, shaker, and HEPI injections last week (DTT files: https://lhocds.ligo-wa.caltech.edu/exports/pem/19aMarPEMinjections/LHO/ ). We used 27 hours of low-noise interferometer time. If we count recovery from losses between the injection periods, we used 36 hours of time (compare to 48 hours for 6 days of 8 hour shifts). We asked for a total of 36 hours of actual injection time, and we think we will need the remaining 9 hours, and possibly more, to complete the injections the week of April 14.
Coupling functions for most channels will eventually appear at http://pem.ligo.org/couplingfunctions
No coupling found at ISCT1
We mounted a shaker on ISCT1 again and found very little coupling to DARM, again clearing in-air POP.
Worst coupling found so far is a factor of a few below DARM
The worst environmental coupling locations that we have found so far have been in the HAM5/6 area, including the squeezer (https://alog.ligo-wa.caltech.edu/aLOG/index.php?callRep=47551), and at EY. The broad-band ambient background at these and other tested locations are expected to produce noise in DARM at a level of a few or less below the current noise floor. Figure 1 shows preliminary estimated vibration contributions to DARM at EY and some photos.
Though we have not completed injections at all locations, we have not noticed any location where the broad-band ambient environmental coupling (excluding peaks from motors, fans etc.) would produce displacement noise at greater than a factor of a few below the noise floor.
Reduction in 59 Hz DARM peak
The largest two peaks in DARM near 59 Hz were identified as coming from motors in the PSL and diode room chillers. We considered two coupling paths: through the floor, and through pressure fluctuations in the water, driving the PSL table and beam jitter. We placed the chiller on rubber machine feet (Figure 2), which reduced the size of the peaks by a factor of about ten in floor accelerometers. However, the reduction of motion at the PSL table was only about a factor of two. Thus, the table motion at this frequency is likely now dominated by pressure fluctuations in the water. The peak in DARM appeared to be reduced by more than a factor of 2, so, coupling through the floor path likely dominated, possibly at HAM5/6.
48 Hz peak source likely not found
We found 3 or 4 locations with resonances at roughly 48 Hz, but none appeared to couple strongly enough to account for the peak in DARM. The frequency modulation of the DARM peak, on time scales consistent with ASC but not temperature, is also not consistent with simple coupling of mechanical resonances.
Intermittent coupling behavior and inconsistent results from placing IO chassis fans on separate supplies
We attempted to remove the IO chassis fan peaks from DARM by placing the chassis fans on separate supplies. This seems to have worked for the CS ISC but not for the EX ISC IO chassis fans (Figure 3). As we have previously noted, the fan coupling varies a lot for some chassis -, note the transient large DARM peaks in Figure 3 (black) from a chassis near the CS SUS rack magnetometer. The SUS IO chassis fans at EX also come and go, though the ISC fans seem always there. More study is needed, but we might go ahead and suggest that LLO put their ISC fans on separate power.
Apparent magnetic coupling resonances revealed by broad band big-coil injections.
Figure 4 shows that a broad-band injection made using the large coil produced a resonance feature in DARM at about 112 Hz and at least four more resonance features between 600 and 900 Hz. A 100-500 Hz injection did not produce the 500-900 Hz features, so the coupling appears to be direct (as opposed to upconversion). The magnetic field measured at the vertex magnetometer (the closest one to the coil) at the 112 Hz resonance frequency is at about 1e-9 Tesla/sqrt(Hz), much larger than the background at that frequency, but about the size of the 120 Hz magnetic field and much smaller than the 60 Hz field. The resonance features are narrow and could have been missed by comb injections, supporting the need for these large coils.
We haven’t yet found the magnetic coupling site that produces these features in DARM; the 112 Hz coupling site does not appear to be the squeezer, because we shut off the squeezer and the peak remained. More study is needed.
More HEPI plots
We made HEPI injections at all test masses and the BS (https://alog.ligo-wa.caltech.edu/aLOG/index.php?callRep=47805). We did not find evidence of scattering from the ACBs, or BS clipping. Plots for all BS HEPI injections are shown in Figure 5.
To do, week of April 14:
1) Acoustic injections in multiple standard locations: CS ebay, two output arm locations, input arm, and Y-man.
2) Shaker injections for scatter tests of BSC2, reduction flange by ITM optical levers, gate valve seat by ITMs.
3) Shaking of P-Cal nozzles at EY as potential scattering site, and possibly other locations
4) HVAC shutdown to check for self-inflicted noise that could be reduced by reducing the air flow.
5) Site activities tests (car, control room etc.)
6) Magnetic injections repeats for saturation in CS ebay and any other repeats found necessary during analysis
7) Mid station injections to check coupling level there (was significant in O2)
8) Mobile accelerometer check for 70 Hz peak candidates
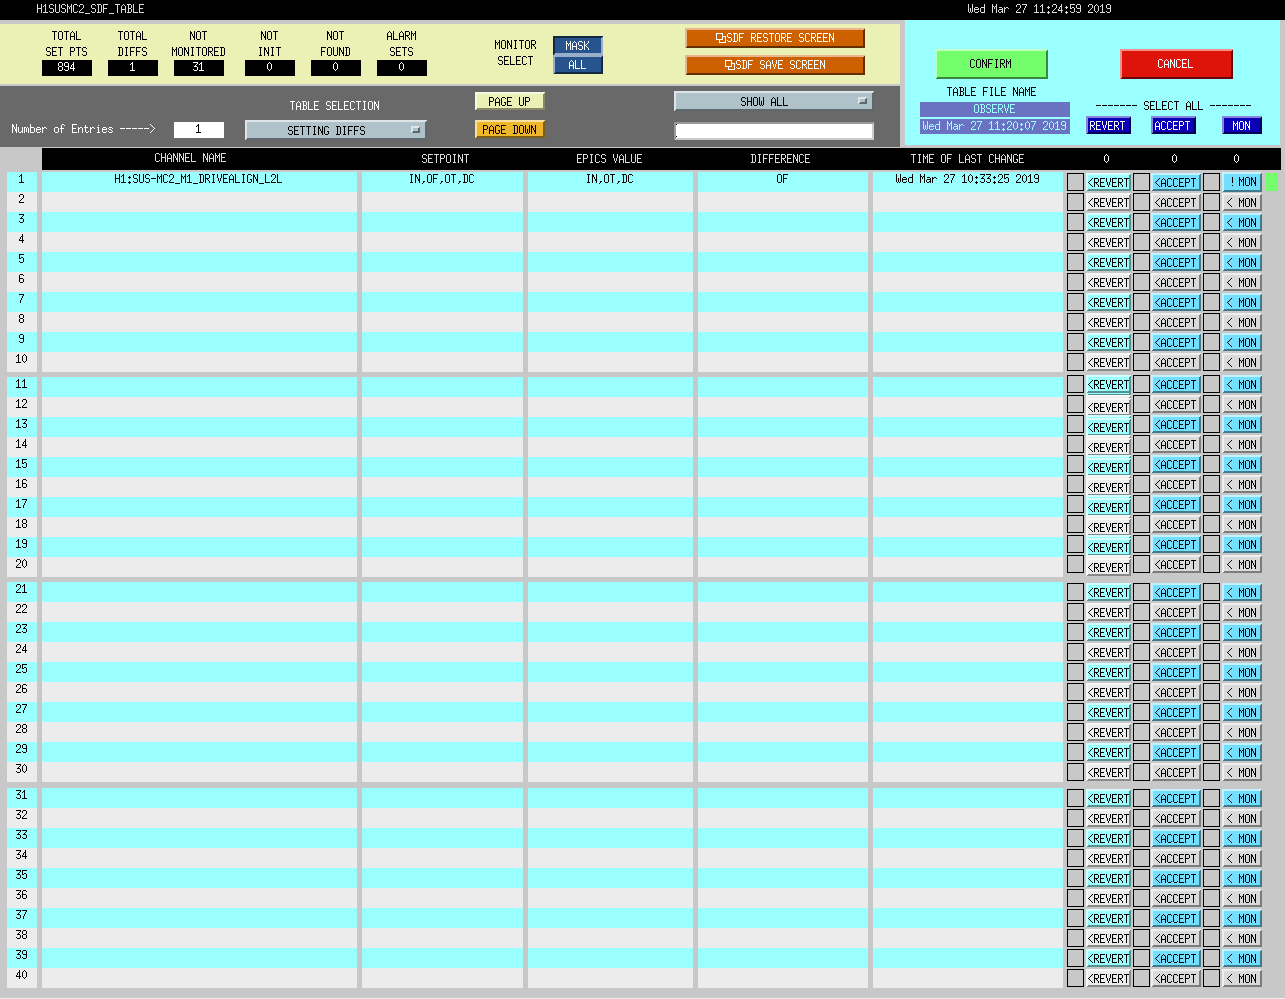
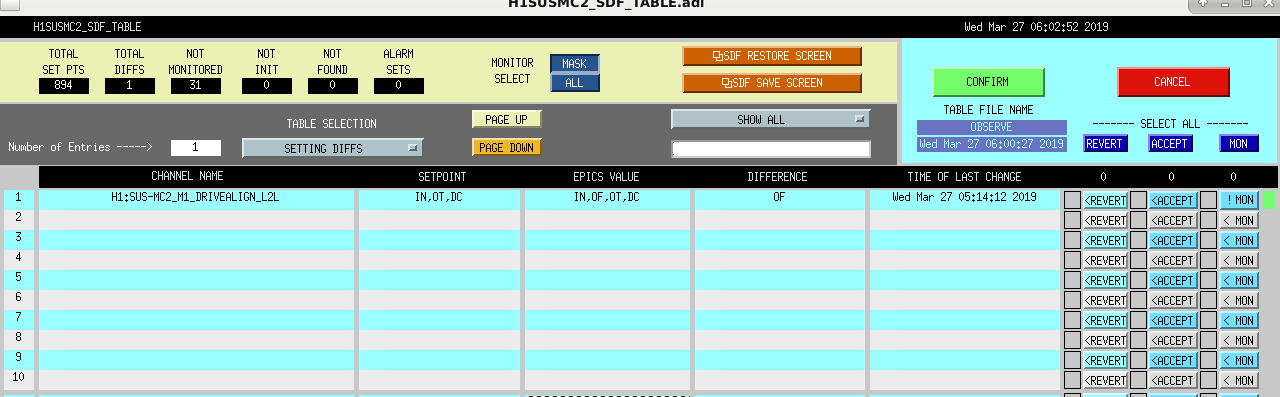
Accepted the SDF Difference for MC2 after relocking.
Reed Essick, TJ Massinger, Adam,
Some detchar safety injections have been scheduled to go into the IFO at 5:00:00 PDT (12:00:00 UTC) tomorrow morning. They'll take about 91 secs. They'll only go in if the IFO is in observation mode, but the operator should know that it's not critical for these injections to happen, so they don't have to stress if the IFO isn't in observation mode.
If for some reason, these injections need to be stopped, the operator can request INJECT_KILL in the INJ_TRANS guardian (found on the guardian overview screen).
These injections were not successful. The interferometer was not in observing intent at the correct time.
[Daniel, Jenne]
At 17:06 local, so 00:06 on 27 Mar 2019 UTC, we turned off by hand the corner station ALS VCOs (COMM VCO, COMM FDD, DIFF VCO, DIFF FDD), using the new relays mentioned in alogs 47894 and 47893.
I have also added turning them on and off to the main ISC_LOCK guardian. When we get to PARK_ALS_VCOs (no longer using ALS for any lock) the VCOs and FDDs will now be turned off. The PREP_FOR_LOCKING state will turn them back on. Note that the channels are "disable" switches rather than our more usual "enable" switches, so to turn off the VCO, you must set the bit to 1. The MEDM screens just say on/off, so it's clear, but the guardian uses the numerical values, which is why I make note of it.
DetChar: It would be helpful if you could have a look at tonight's lock and see if the whistle situation is improved. Hopefully it will be!
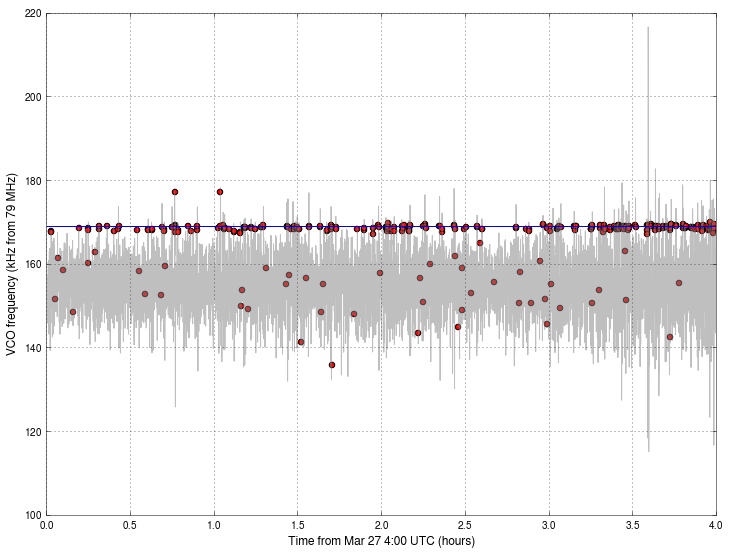
Laura, Andy There are still many whistles in the long lock at 4 UTC (Mar 27). First we confirmed that the ALS comm and diff frequencies are zero, so those VCOs are turned off in the lock. The summary pages show a high rate of high frequency glitches. We can find the IMC VCO frequencies at which these whistles occur, by plotting the VCO frequency of the lock, with all glitch times marked as points - see attachment. They make a clear line at 79.169 MHz. The ALS VCOs all park below 79 MHz, so even if they were on they're not really close enough to the IMC VCO to explain the whistles. The code for the plot is on git.ligo in this Jupyter notebook.
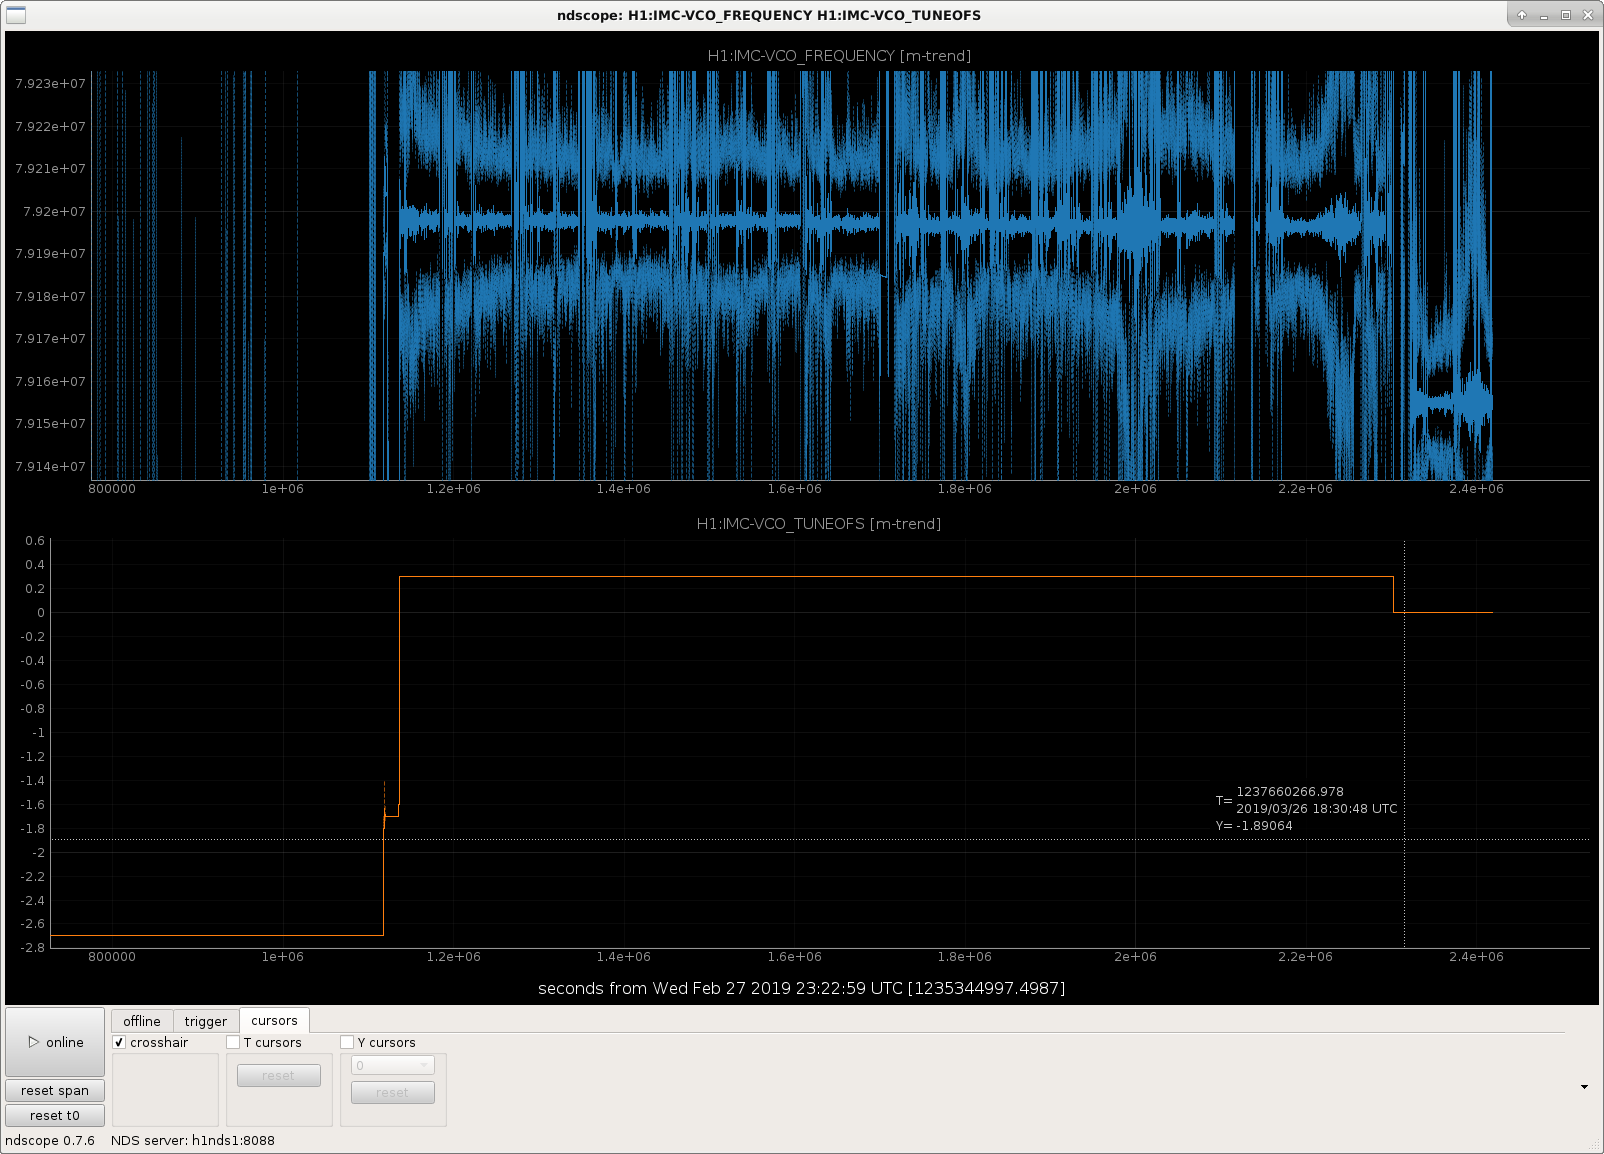
Thanks for looking at this. We'll do a slow sweep of the IMC VCO frequency over a longer range to hopefully find a good place.
While looking at the history of the situation, I see that the reboots due to the new on/off switches that happened on Tuesday seem to have removed the offset of the setpoint that we'd been using since Daniel set it on March 12th (alog 47470).
TJ, Jonathan, Dave:
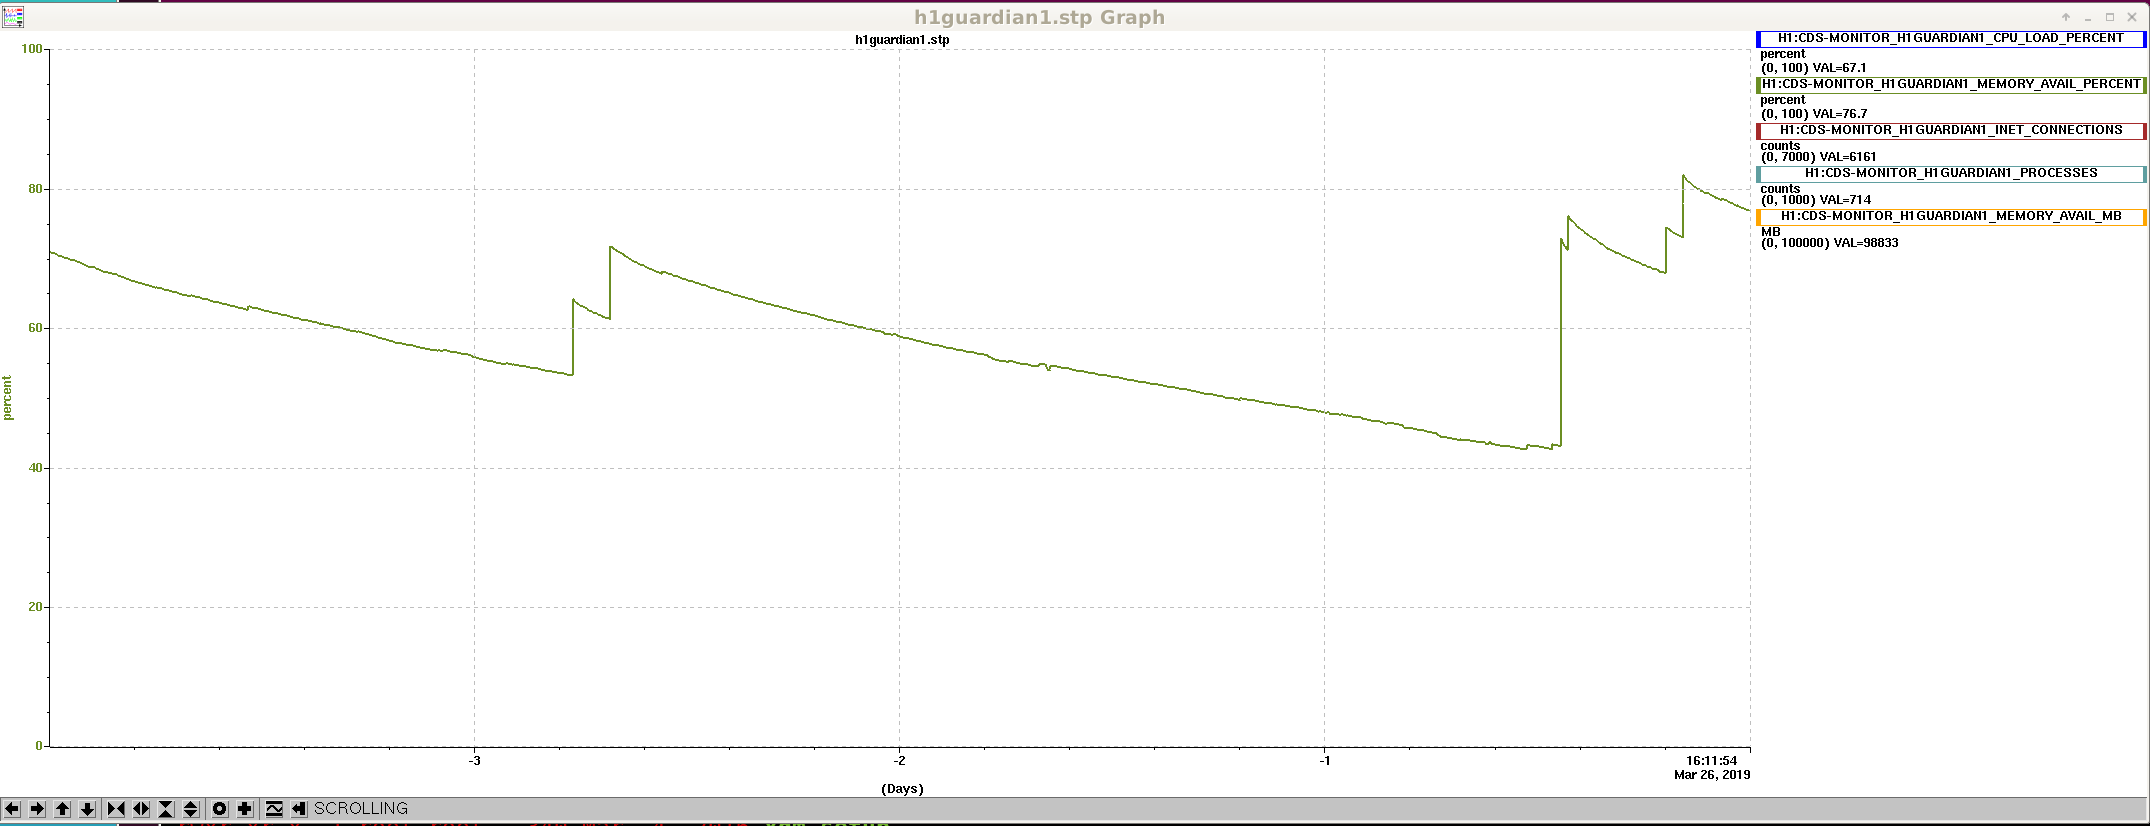
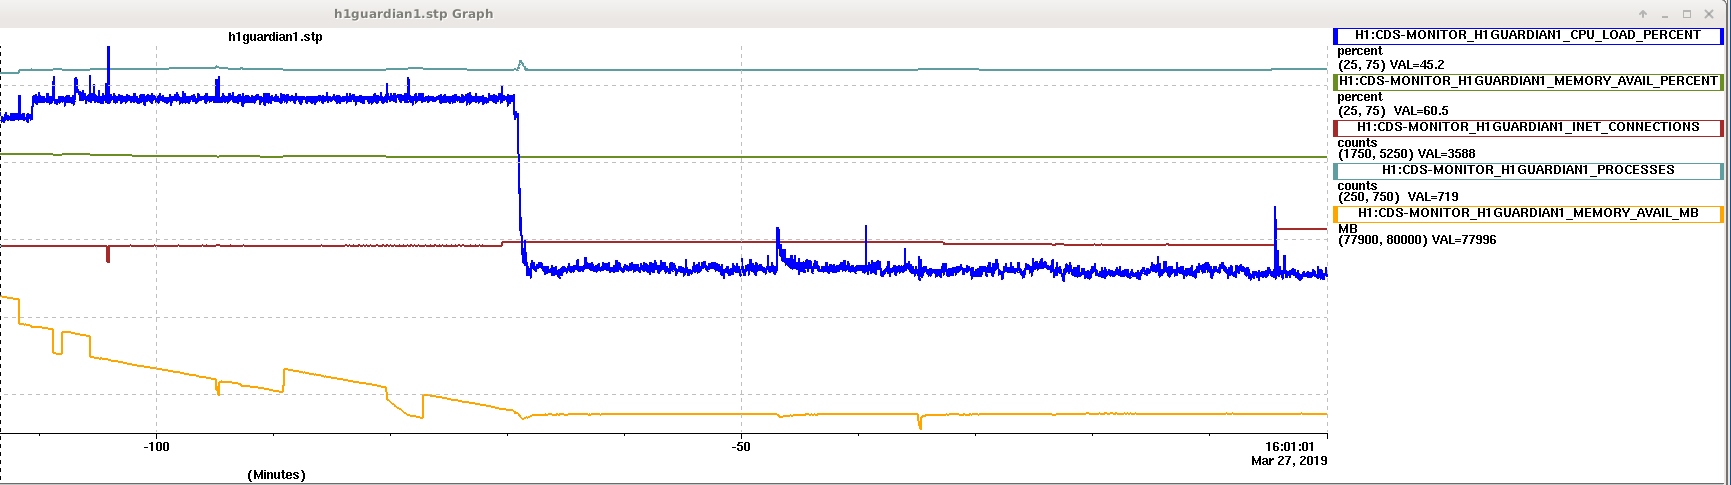
Late last week Jonathan installed his system monitor EPICS-IOC on h1guardian1 and we striptool'ed it over the past 4 days. The trends have revealed a memory leak, with the available memory dropping from 80% to 40% and occasionally resetting back (see attached striptool plot).
The times the memory is recouped is coincident with seismic blend switching, which is usually associated with operator earthquake switching. TJ is taking the investigation further.
I forgot to mention the system load fluctuates at these times as well.
After Dave found that the SEI_CONF node was changed to EARTHQUAKE the time that the memory % freed up a bit, I tried each of the 3 types of nodes changed in that state: HPI sensor correction, ISI sensor correction, and ISI blends. The first didn't change anything, but changing the ISI_BS_ST1_BLND node made an immediate change.
These nodes will sit in its idle state after making the blend transition, and the only thing running is a decorator checking the configuration. This decorator is creating a new LIGOBlendManager class reference every cycle. I thought that the end of each new cycle would release this from memory, but perhaps I was wrong. I will test this in the coming days, when given the opportunity.
In the mean time, if memory becomes an issue, we can always re-request the same blend. It will blend to the same one, and no harm will be done to the IFO.
Potential offender here:
def check_blend_config(config):
"""
dof_dict - Dictionary with the dofs as the keys and
what should be the correct fm#s as their values
"""
config_name, dof_dict = config
for dof, fm in dof_dict.items():
if fm == 0:
continue
cur_fm = LIGOBlendManager([dof], ezca=ezca).get_cur_blend_name(dof)[0]
if cur_fm != fm:
return False
return True
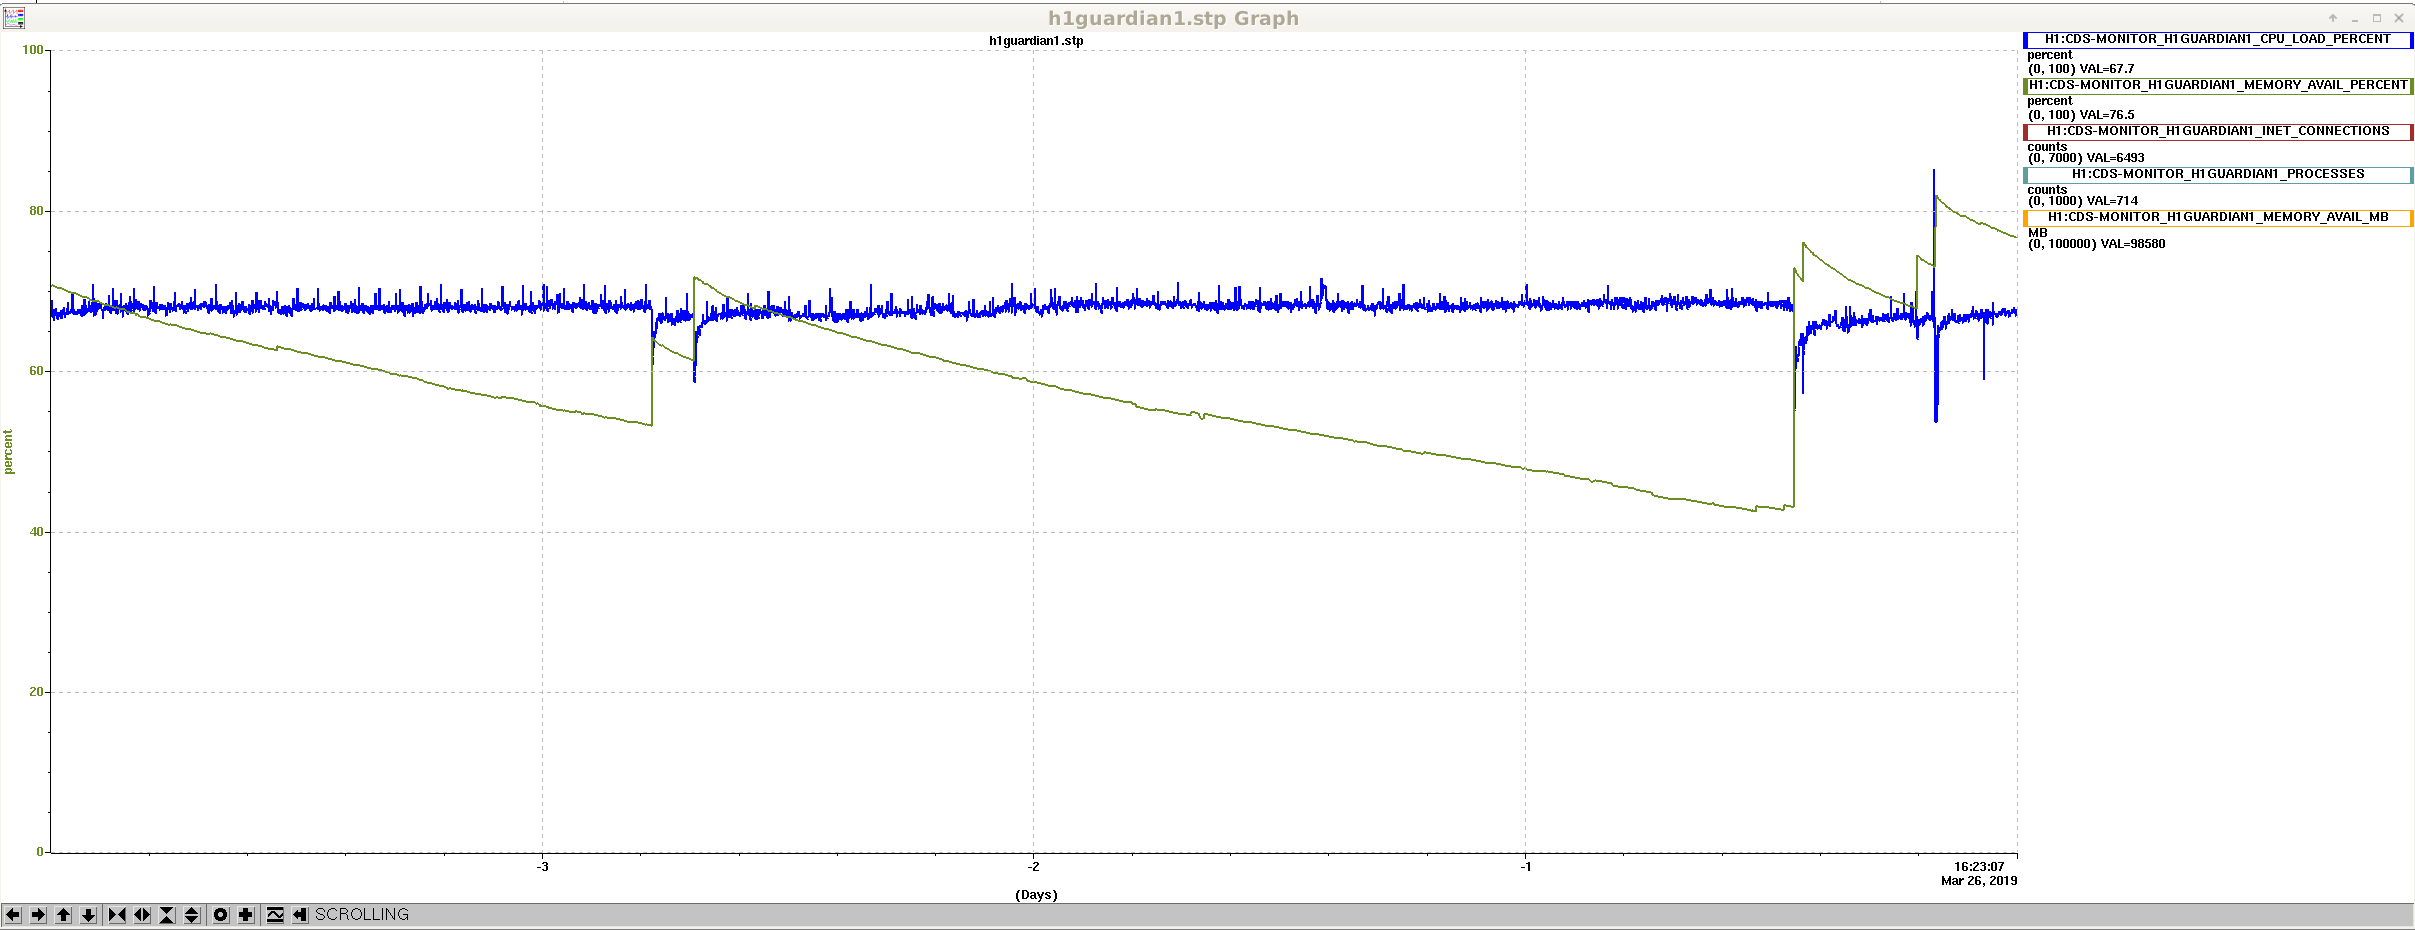
I ran a test today of commenting out that decorator, reloading all of the blend nodes, and then watching the available memory rate and CPU load. This definitely seems to be the problem.
In the attached trend the large drop in the CPU load (blue) was me reloading the blend nodes without the decorator. The available memory (yellow) from before this point was steadily declining, but after was basically stable. I did not get the chance to change blend states, so it makes sense that we did not free up more memory like we had seen previously.

Pep Covas, T. Shaffer
Started the HIGH_FREQ_LINES Guardian node to sweep H1:CAL-PCALX_PACALOSC1_OSC_FREQ from starting frequency to 2000Hz by 500Hz steps. The steps will happen every 12 hours, but it will wait until we are not locked to change the frequency, so it could be longer than the 12.
Line amp = 35000
Starting freq = 5950.0Hz
Step size = 500Hz
We unmonitored H1:CAL-PCALX_PCALOSC1_OSC_FREQ in SDF.
J. Kissel, P. Covas
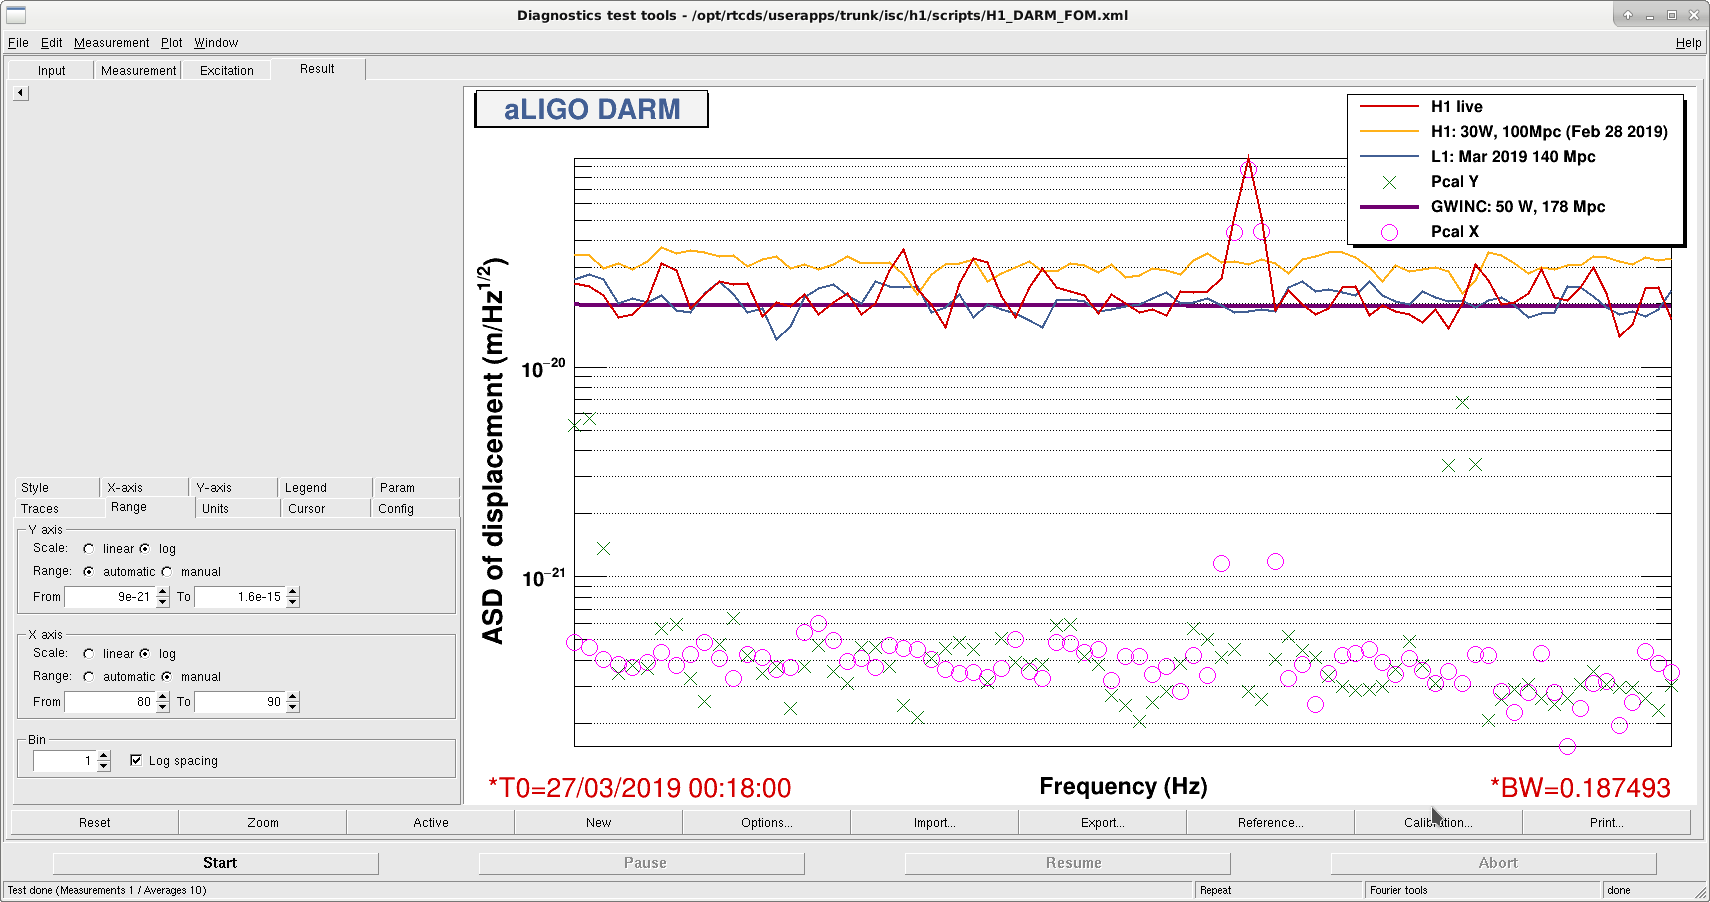
We found that the PCALX saturated, so we turned off the line at 5950.0 Hz, then turned off the optical follower servo and then reenabled it. Then we turned up the line around 0:18 UTC. We saw the non-linearity (down-conversion) seen previously in O2 is still there, which produces a line at 86 Hz, as can be seen in the attached plot. At 0:24:45 the frequency of the line was changed to 3 kHz.
We have seen that the line had been reverted back to ~6kHz. At 18:47 UTC we have changed it to 3001.3 Hz
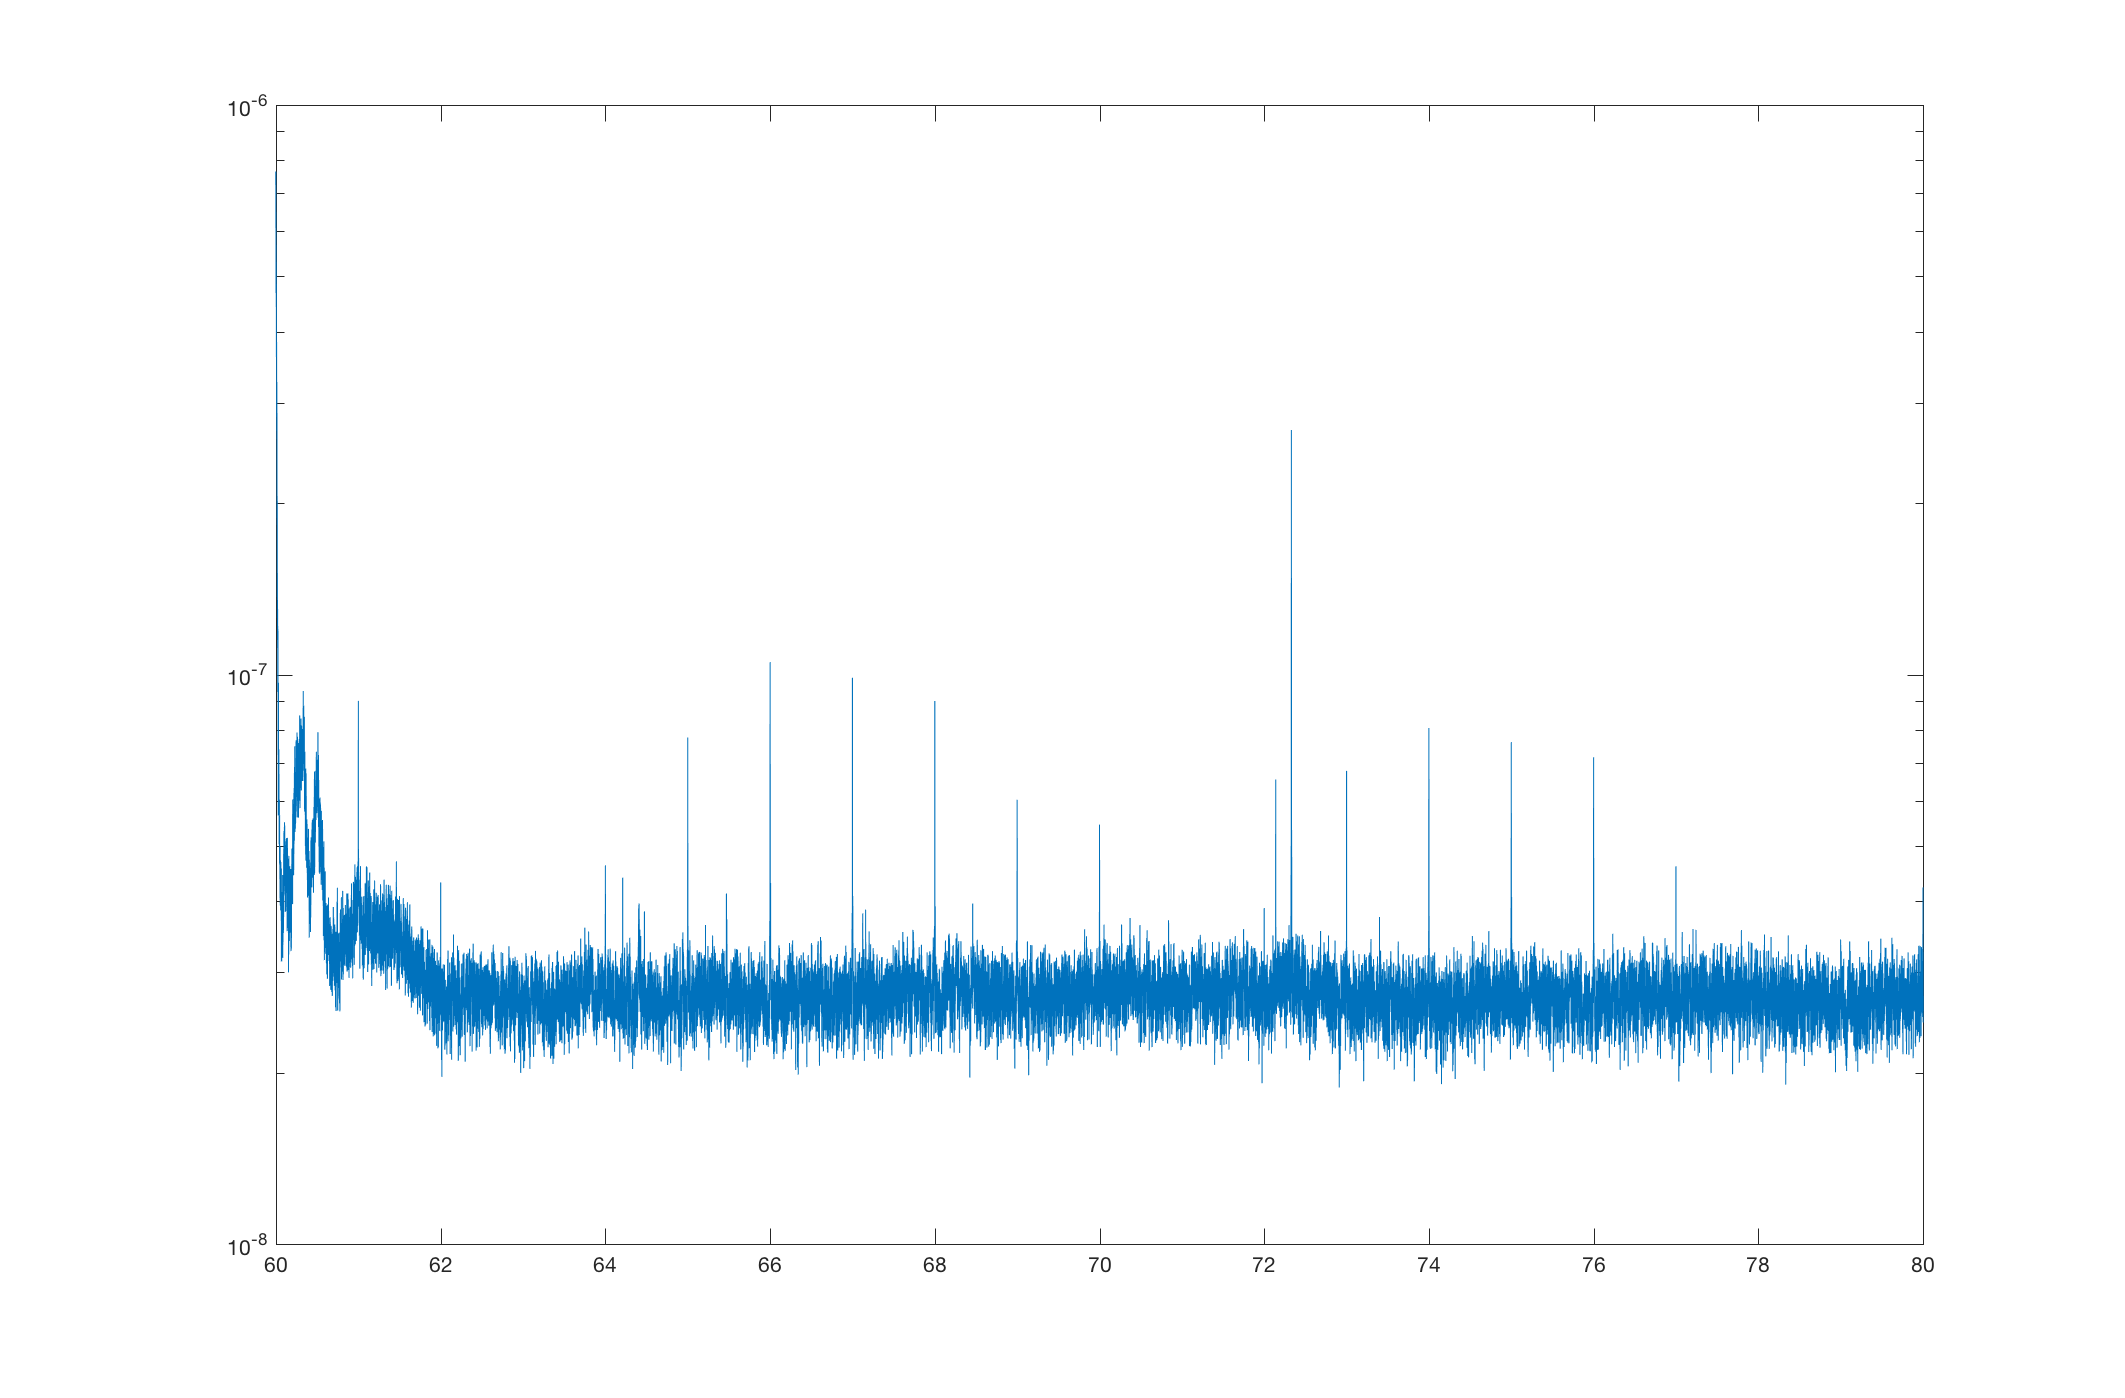
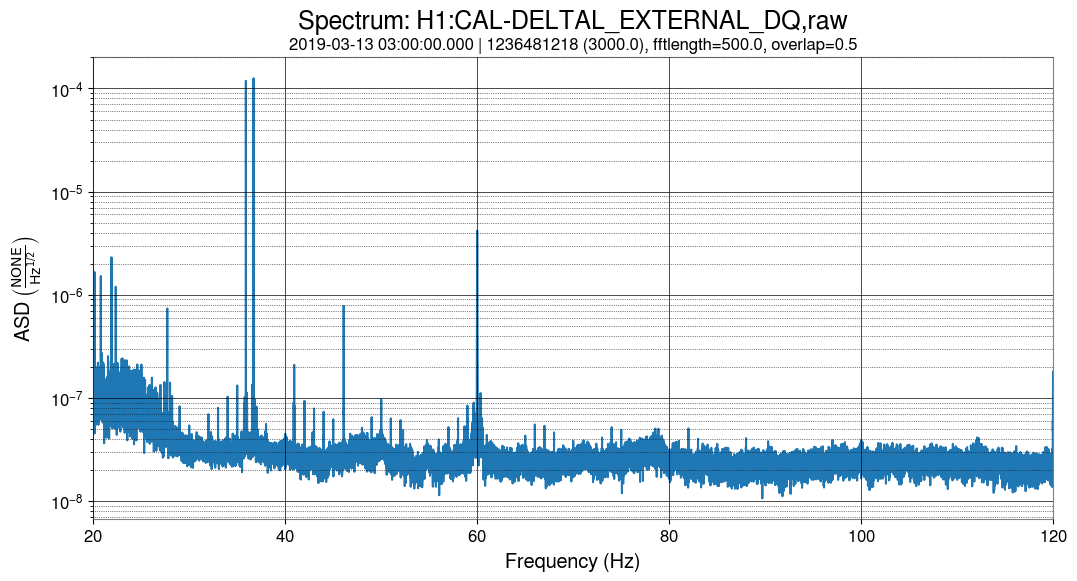
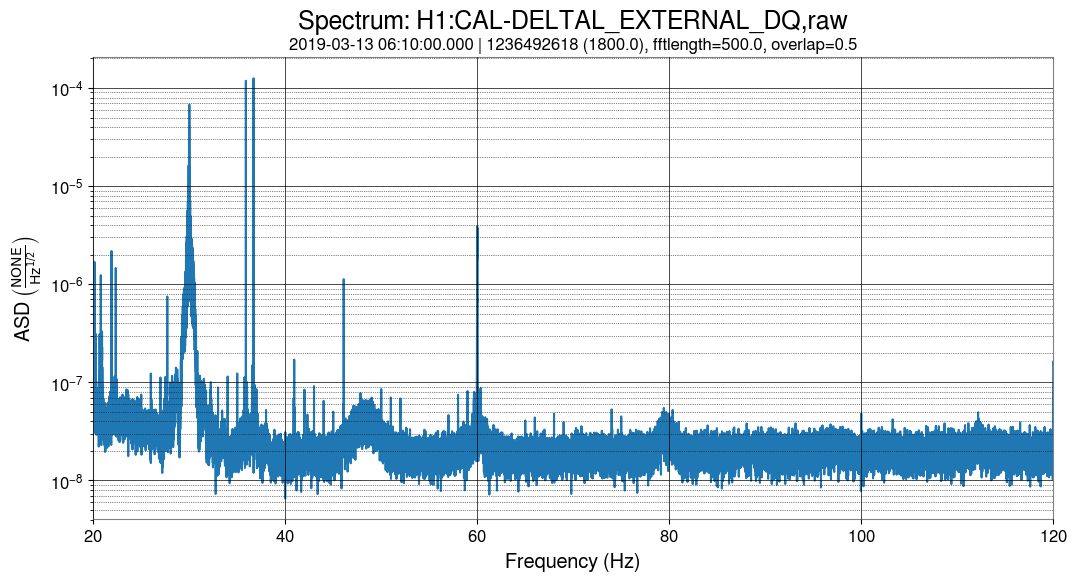
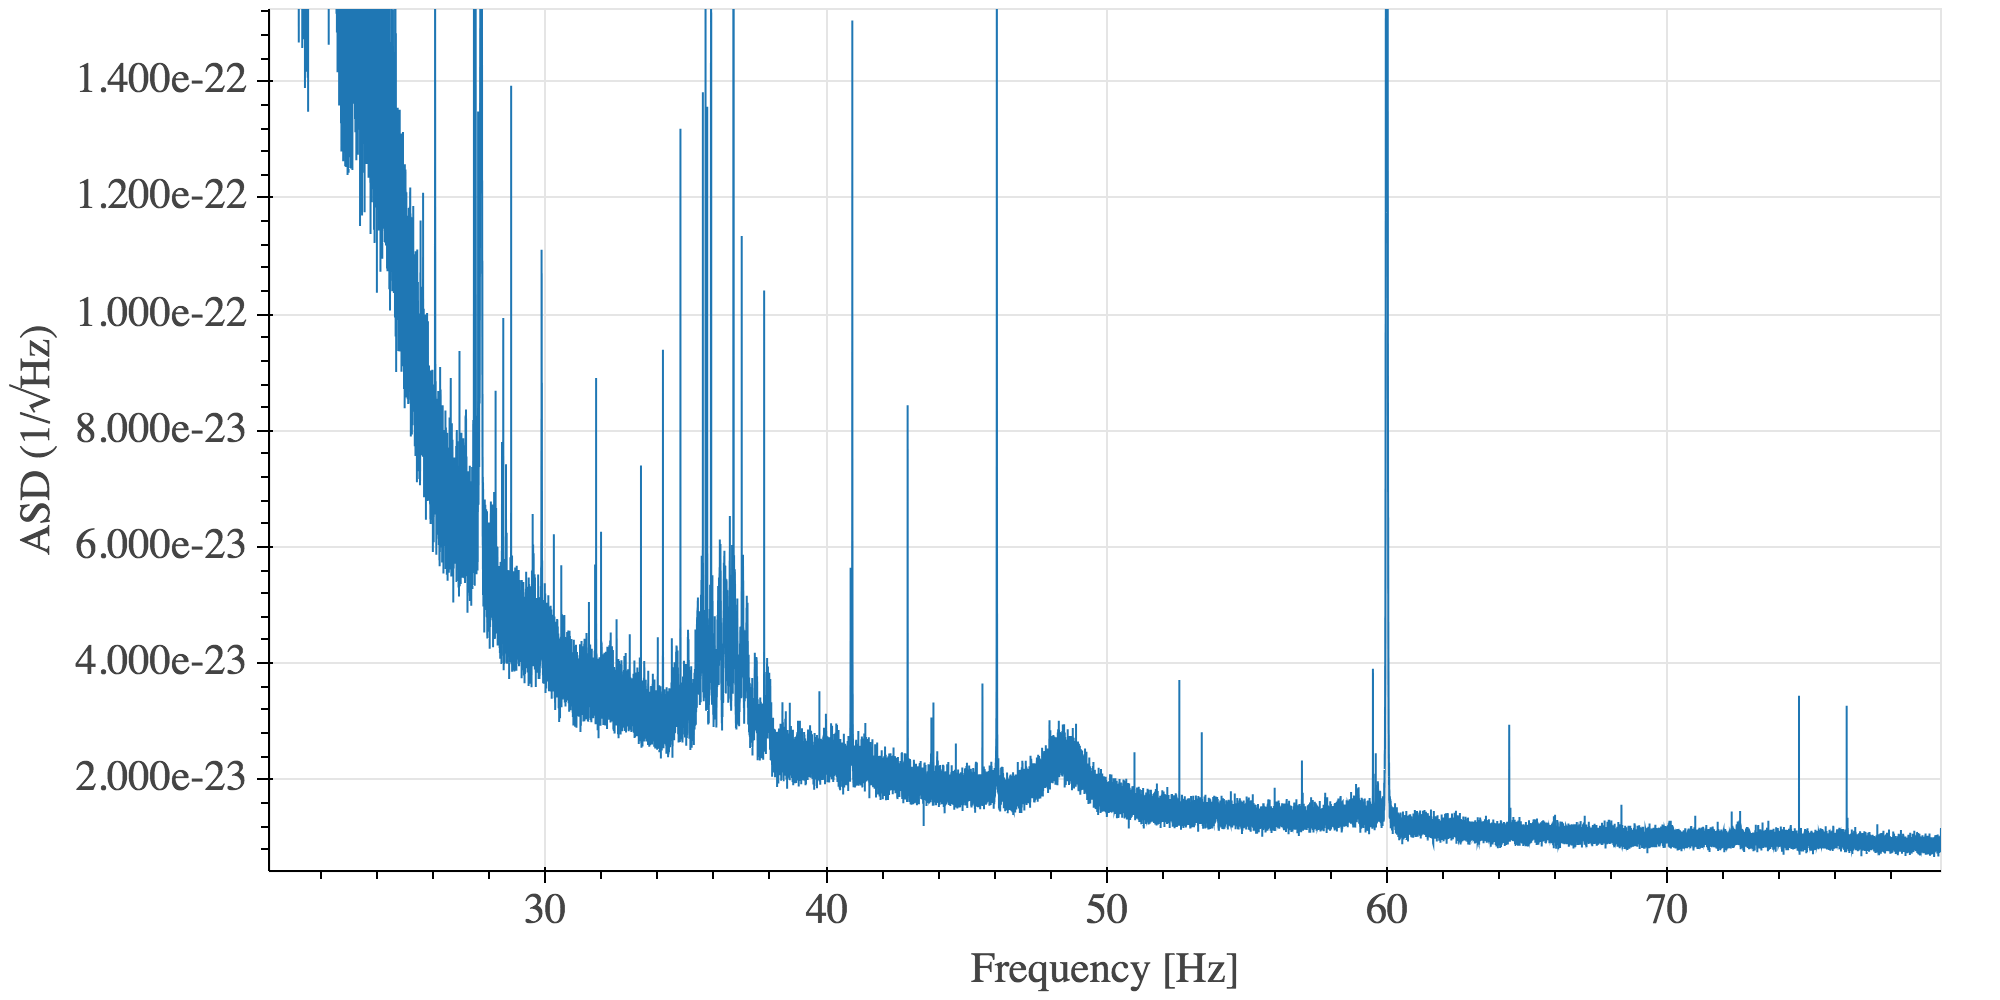
Given that H1 is still in commissioning mode, I hesitate to report on lines that may be due to ongoing work, but I'm seeing a very strong 1-Hz comb in DARM as of last Wednesday, which I suspect is unintended. Below are spectra of 20-120 Hz and its 20-Hz sub-bands from yesterday's data (typical of daily spectra since Wednesday). Note that the lines are on exact 1-Hz multiples (to ~0.5 mHz resolution), but they have flat shoulders of O(0.01 Hz) full width. An arbitrary but typical example at 34 Hz is shown. Also, the amplitudes of the lines do not fall entirely monotonically with frequency. There are clusters of lines with a spacing of roughly 7-8 Hz. Any ideas on what changed, perhaps during the last Tuesday maintenance?
Additional clue: there are small but noticeable changes in comb strength in a couple magnetometer channels at EX, in the same time frame. I'm not seeing anything similar in EY or CS mags. (The 1-Hz comb is present in many magnetometers; it's the change points that seems to be unique to EX.)
Hey all,
This looks similar to what we have seen in the past from the hartmann wavefront sensor cameras. It seems like we solved the issue by changing the camera power supplies. We can double check this by changing the HWS sync frequency at low noise and provide you with a gps time.
Sheila, Anamaria
The first thing that comes to mind from last Tuesday is a change to the ESD driver grounding at EX (47308), which did reduce some coherence between EX magnetometers and DARM (47323) At first it looked like this work last tuesday removed a line at 73 Hz from DARM, although looking at the summary page you can see that this line has been coming and going and was at 72.5 Hz yesterday. summary page
It's probably not the HWS because those were always showing up a few tenths of a percent below their sync frequency, so if this comb is within half a mHz it's too accurate.
Ok, I'm posting more detail on what I'm seeing in the magnetometers, in case it helps to pin this down. I've checked for any obvious/clear change points, and also compared whether the shape of the comb is similar to what's observed in DARM (same pattern of variation in peak heights). In summary, SEIRACK and SUSRACK magnetometers at EX are particularly notable.
Also, the comb does appear to be precisely on 1 Hz, unlike the HWS comb.
Detailed magnetometer report:
[Corner station]
H1:PEM-CS_MAG_EBAY_LSCRACK_*_DQ: no apparent change; comb shape dissimilar from what is observed in DARM
H1:PEM-CS_MAG_EBAY_SUSRACK_*_DQ: no apparent change; comb shape dissimilar
H1:PEM-CS_MAG_LVEA_VERTEX_*_DQ: comb not really present
[End X]
H1:PEM-EX_MAG_EBAY_SEIRACK_X_DQ: changed (decrease); comb shape similar
H1:PEM-EX_MAG_EBAY_SEIRACK_Y_DQ: no apparent change; comb shape similar
H1:PEM-EX_MAG_EBAY_SEIRACK_Z_DQ: changed (increase); comb shape similar (?)
H1:PEM-EX_MAG_EBAY_SUSRACK_X_DQ: changed (increase); comb shape similar
H1:PEM-EX_MAG_EBAY_SUSRACK_Y_DQ: no apparent change; comb shape similar
H1:PEM-EX_MAG_EBAY_SUSRACK_Z_DQ: changed (decrease); comb shape similar (?)
H1:PEM-EX_MAG_VEA_FLOOR_*_DQ: comb not really present, but neither is anything else. These channels look way too clean; there might be an issue.
[End Y]
H1:PEM-EY_MAG_EBAY_SEIRACK_*_DQ: no apparent change; comb shape similar
H1:PEM-EY_MAG_EBAY_SUSRACK_*_DQ: no apparent change; comb shape similar
H1:PEM-EY_MAG_VEA_FLOOR_*_DQ: no apparent change; comb shape similar (?)
Robert, Anamaria
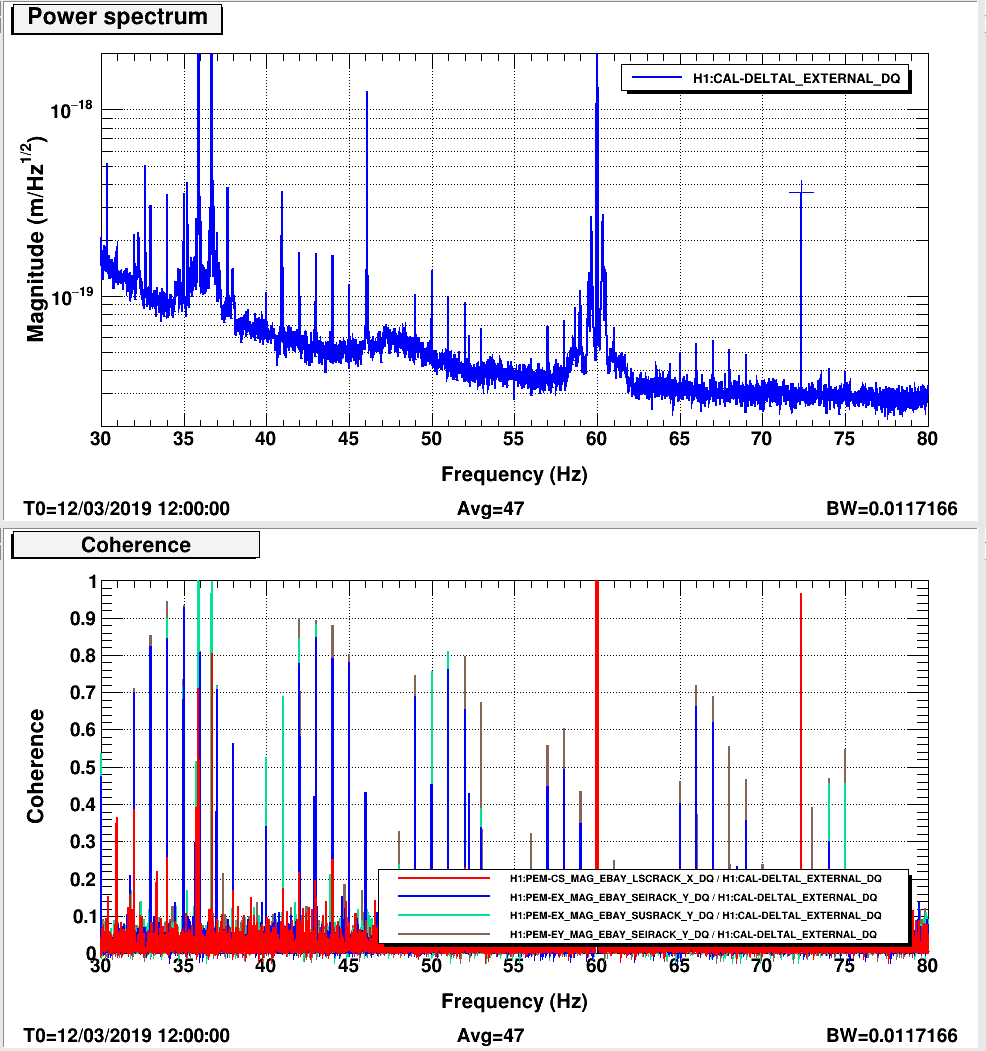
Even with just 0.01 Hz resolution, there is large coherence between various magnetometers in the EBAYs and DARM. Indeed this was not the case before last Tuesday.
Separately, the 72.5 Hz that appeared in the last two days is coherent with the corner EBAY magnetometer in the ISC rack. We think it's a real peak because if the sensor were picking up DARM the large calibration lines at 35ish Hz would show better coherence. Though it does not appear to be there this morning, so not completely clear what's going on.
Danny and I had a 72.33 Hz line driving some frequency noise over the weekend during some TCS tests. We also had lines at 3.25kHz, 4.5kHz and a bunch around 23-25Hz.
Shifted ETMX HWS sync frequency from 1 Hz to 5 Hz starting at 1236485181 and shifting it back to 1 Hz at 1236494796.
What about the GPS clocks that got turned on last Tuesday?
I had trouble finding a lot of clean DARM data during the period when the HWS frequency was changed, but what I found suggested the 1-Hz was still strong. Figure 1 is from when the HWS frequency was normal. Figure is from when it was changed.
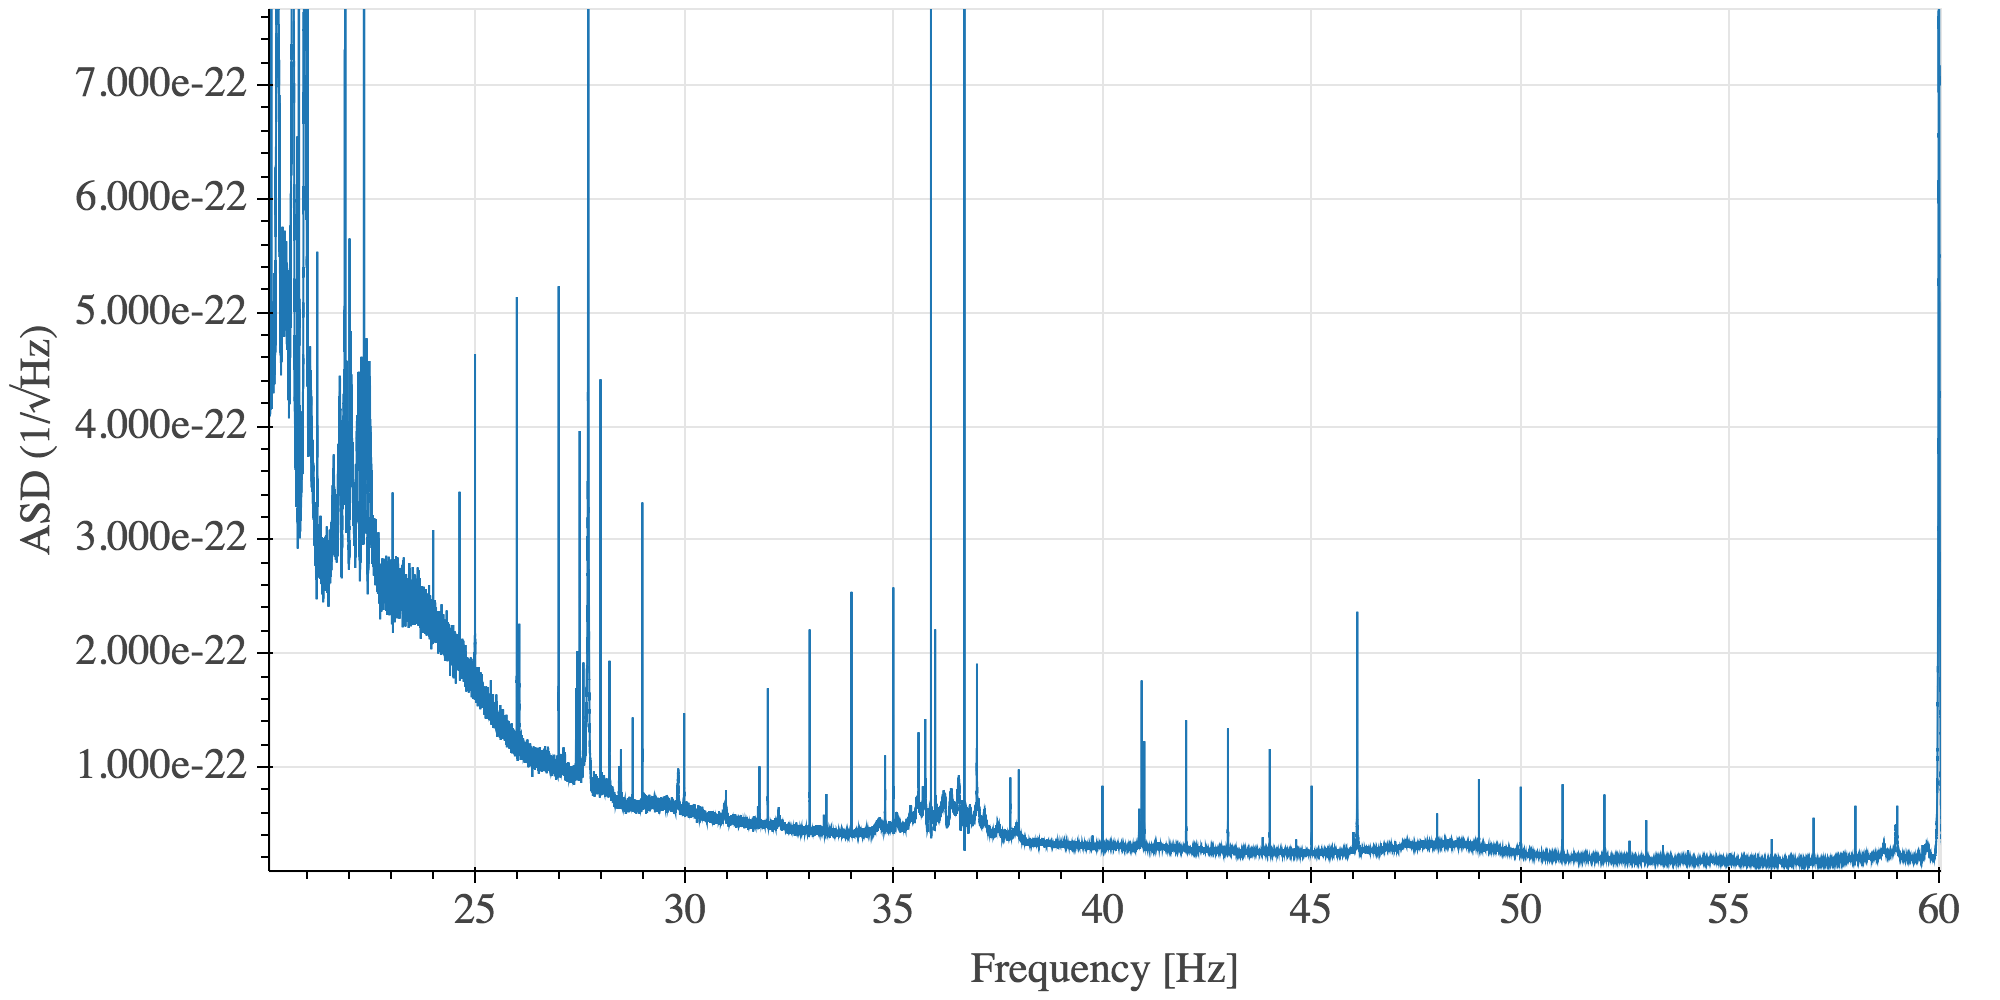
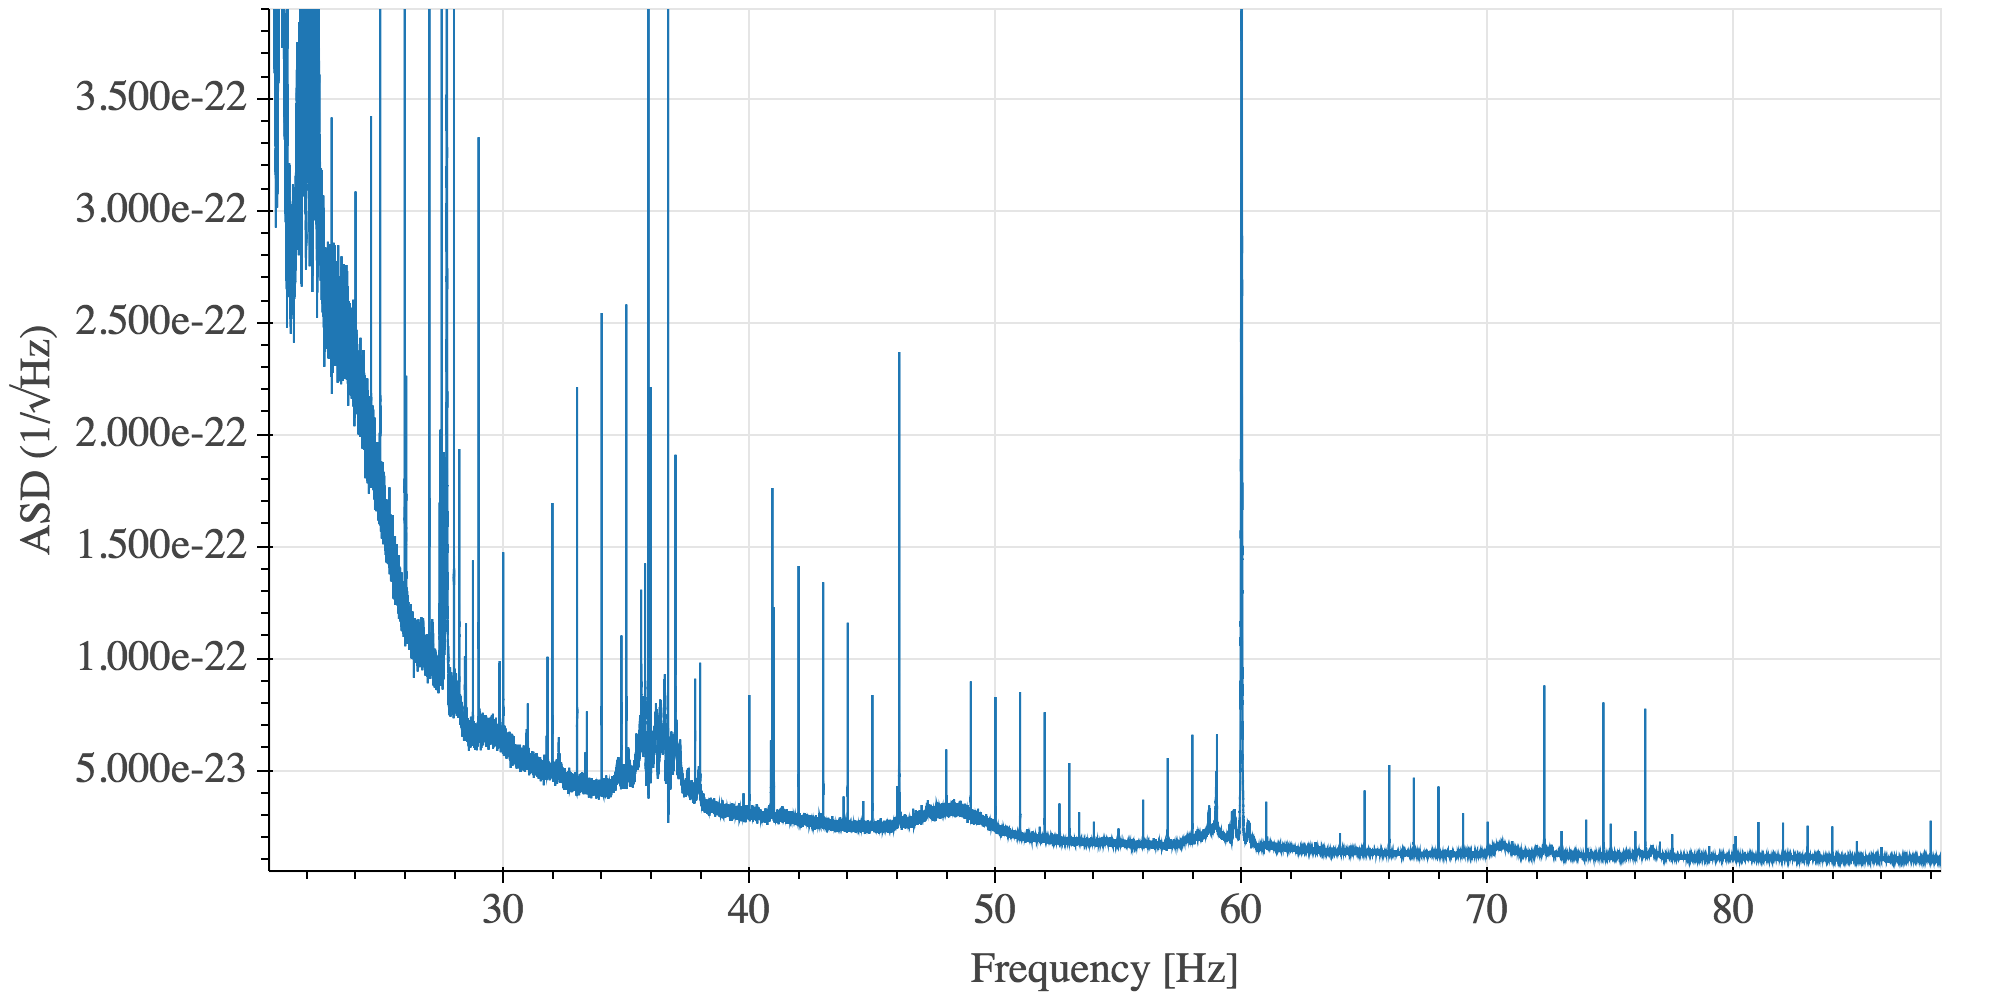
The 1 Hz comb is still present in data from the third week of ER14, see first attached plot. There is also a very bad 0.8 Hz comb visible between 420 and 500 Hz, see second plot.
The 0.8 Hz comb Pep noted is a complicated structure, but it has some symmetrical features which are centered on the 516.78 Hz line. Keith tells me this is an EX violin mode (alog 47650, alog 47179). A plot showing data from March 25 is attached.
It seems that the work reported in https://alog.ligo-wa.caltech.edu/aLOG/index.php?callRep=47766 has made the 1 Hz comb disappear.
The first attached plot shows the spectra before this change, and the second one the spectra after this change.
On the other side, the lines and 0.8 Hz comb around the ~500 Hz violin modes are still there.
J. Kissel (with help from L. Sun, E. Goetz, L. McCuller, E. Bonillla, R. Kumar) I've been processing the actuation function data from 2019-03-01 (see LHO aLOG 47206), and have some updates. Not were I want it, but since the heat is on I'll give a status update. Recall from LHO aLOG 46806, Steps to success: (i) Find out why ETMX L1 and L2 doesn't work, and fix it, such that we can go forward with full ETMX DARM actuation. DONE (see fixes to UIM and PUM crossovers in LHO aLOGs 47164 and 46861) (ii) Measure the PUM and UIM coil drivers, and update the compensation. DONE (see LHO aLOG 47167) (iii) Truly identify ETMX all 8 violin mode fundamentals and their harmonics to update the PUM dynamical model (needs IFO time), finish fitting the UIM transfer function data to update the UIM dynamical model (needs Kissel time) (iv) Remeasure all stages of ETMX with the full IFO DONE (see LHO aLOG 47206) (v) Update the front-end calibration (including reference model parameters at calibration line frequencies such that time-dependent correction factors are accurate), and (vi) confirm success with the full IFO (needs IFO time). So, I'm currently working on (iii) [with the help of Edgard, Rahul, Borja (#TeamSUS) along with Lee and Lilli #TheFittingCrew] and this aLOG is reporting the progress on fitting the results from the 2019-03-01 measurements, i.e. (iv) [working with Evan #TeamPyDARM]. Check out the attached .pdfs from each stage below, which are the output of the following script, /ligo/svncommon/CalSVN/aligocalibration/trunk/Runs/O3/H1/Scripts/FullIFOActuationTFs/process_actuationmeas_20190301.py after creating a new pyDARM model parameter file, ^/trunk/Runs/O3/H1/params/modelparams_H1_20190301.py TST: MCMC Results Force per count of longitudinal DAC request (just down stream of DRIVEALIGN bank): Gain = 4.734e-12 (N/ct) Force per actuator signal (current or voltage): Gain = 4.433e-11 (N/V**2) Actuator gain, H_c (N/ct) | 4.734e-12 (+2.09e-15,-2.102e-15) or (+0.04415%,-0.0444%) Residual time delay, tau_A (usec) | 10.79 (+0.7573,-0.76) or (+7.02%,-7.045%) Comments: Except for the sign flaw in the "intermediate results" plot, I'm very happy with the state of the systematic error, I believe the MCMC fit, and I think we're ready push to front-end. PUM: MCMC Results Force per count of longitudinal DAC request (just down stream of DRIVEALIGN bank): Gain = 6.223e-10 (N/ct) Force per actuator signal (current or voltage): Gain = 0.03038 (N/A) Actuator gain, H_c (N/ct) | 6.223e-10 (+3.339e-13,-3.33e-13) or (+0.05367%,-0.05352%) Residual time delay, tau_A (usec) | 4.096 (+1.568,-1.571) or (+38.28%,-38.34%) Comments: There's still something very fishy going on below 20Hz. I don't understand it, and this is under investigation by Evan and I. UIM: MCMC Results Force per count of longitudinal DAC request (just down stream of DRIVEALIGN bank): Gain = 7.498e-08 (N/ct) Force per actuator signal (current or voltage): Gain = 1.597 (N/A) Actuator gain, H_c (N/ct) | 7.498e-08 (+2.842e-11,-2.869e-11) or (+0.03791%,-0.03826%) Residual time delay, tau_A (usec) | 57.81 (+1.218,-1.215) or (+2.107%,-2.101%) Comments: the low frequency data (below 10Hz) is pretty un-informative, and this is where the UIM matters -- BUT I'm not sure we've ever got any better. I'm dividing out the high frequency dynamics of the OSEM bracketry and UIM to PUM violin modes based on old H1 ETMY data for now CSWG aLOG 11212, and that has significantly flattened out the systematic error, so we can now use all the data from 10 to 100 Hz for the fit of the actuation coefficient instead of what we did in O2 which was only use 3-5 points between 10 and 20 Hz. I'm working with Lee to get an updated fit on data that I took on 2019-01-25. Finally, I show one of the plots from the latest output of https://svn.ligo.caltech.edu/svn/aligocalibration/trunk/Common/pyDARM/darm_loop_critique.py which, unlike the scripts from above is a function, which I called using the following command line, python3.6 darm_loop_critique.py --run=O3 --IFO=H1 --DARMmodelfile=modelparams_H1_20190301 --modelFunction=modelPars --outputfile=2019-03-01_critique This shows the relative contribution of each stage. to the overall actuator to give you a feel for what matters where (now that things have been updated to reflect Sheila's latest work with the PUM crossover). Comments: - Only the phase is shown, so take the plot with a grain of salt. - In the calibration band (a bit larger than the detection band, between 5 and 5000 Hz), excitingly, the UIM is now *very* unimportant to get perfect. However, I'm interested to see how this plot shapes up once we've fixed the dynamical model (which is currently all this plot has to go on) - It is far more important to get both the PUM and the TST stage right. - We'll need to resolve this reported frequency-dependent systematic error in the PUM, since it's right in the phase/magnitude mixing region ("the crossover" implies the hand-off between stages only happens precisely at a single frequency. No bueno.) So -- I continue my work on the PUM as priority. We also need to retake a sensing function sweep suite, so I can compare the results against and open loop gain model.
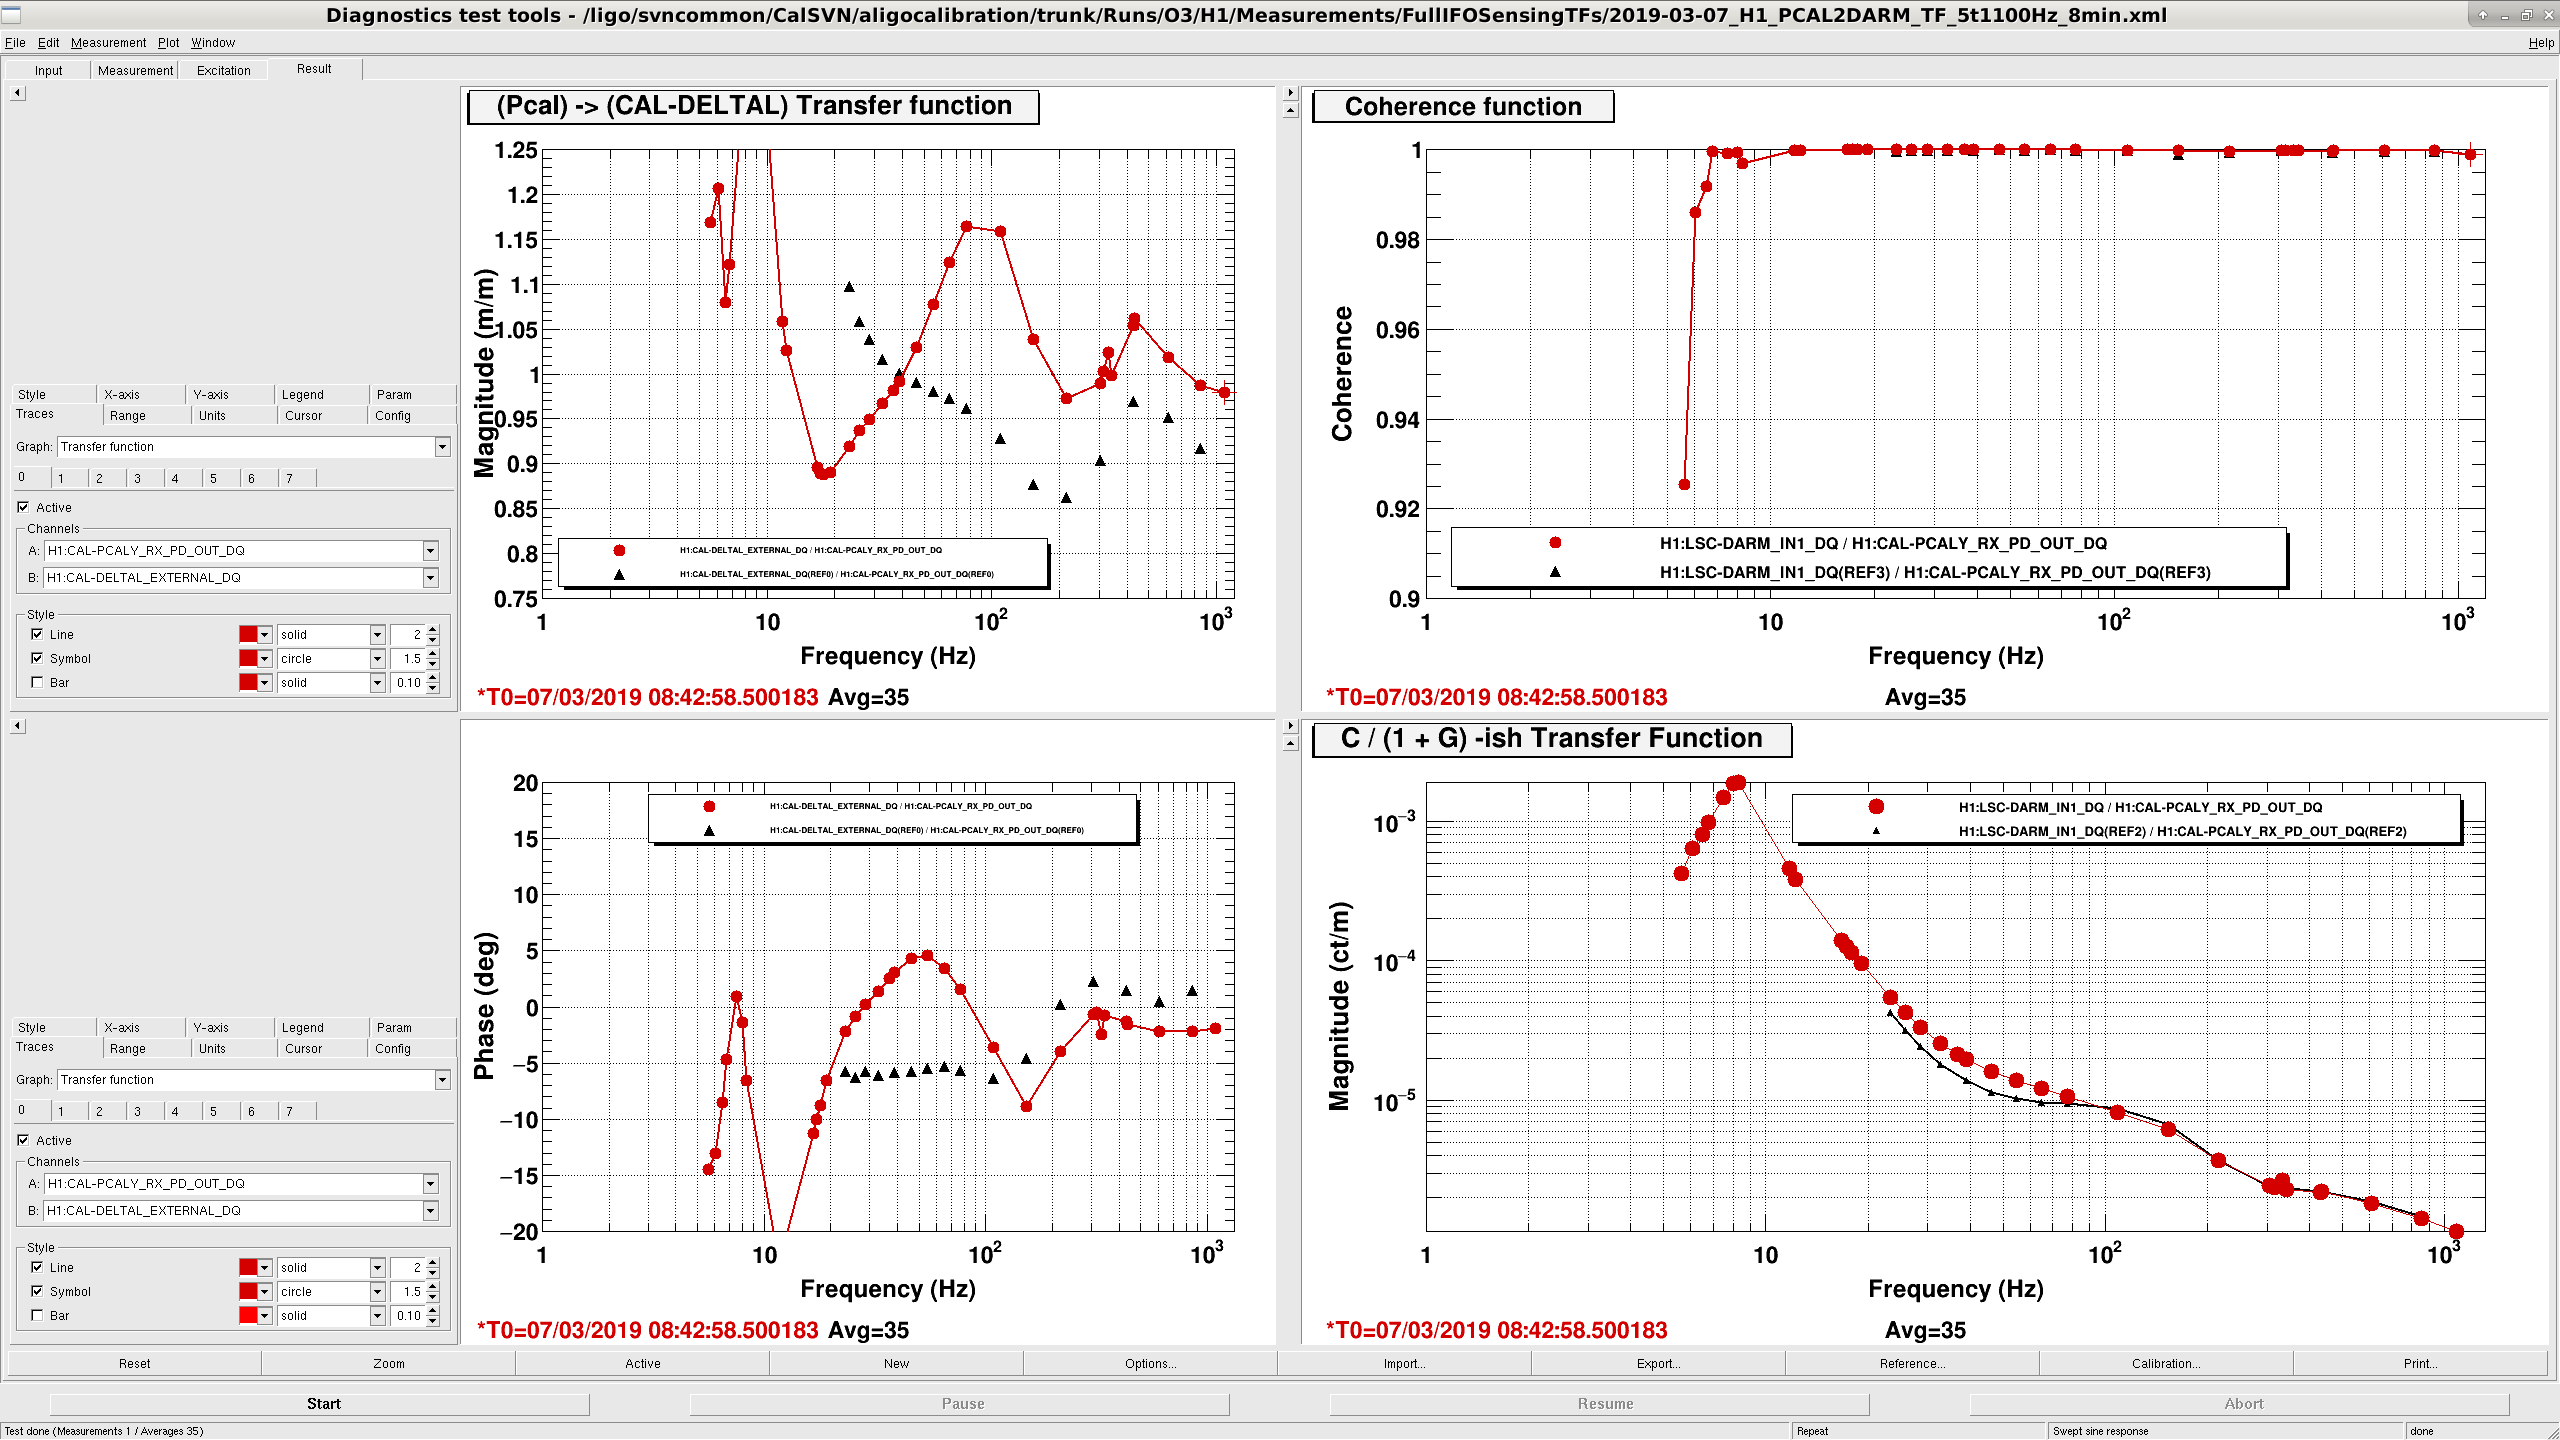
I took a PCAL to DARM measurement, and a DARM OLG, they are in /ligo/svncommon/CalSVN/aligocalibration/trunk/Runs/O3/H1/Measurements/FullIFOSensingTFs/2019-03-07*.xml
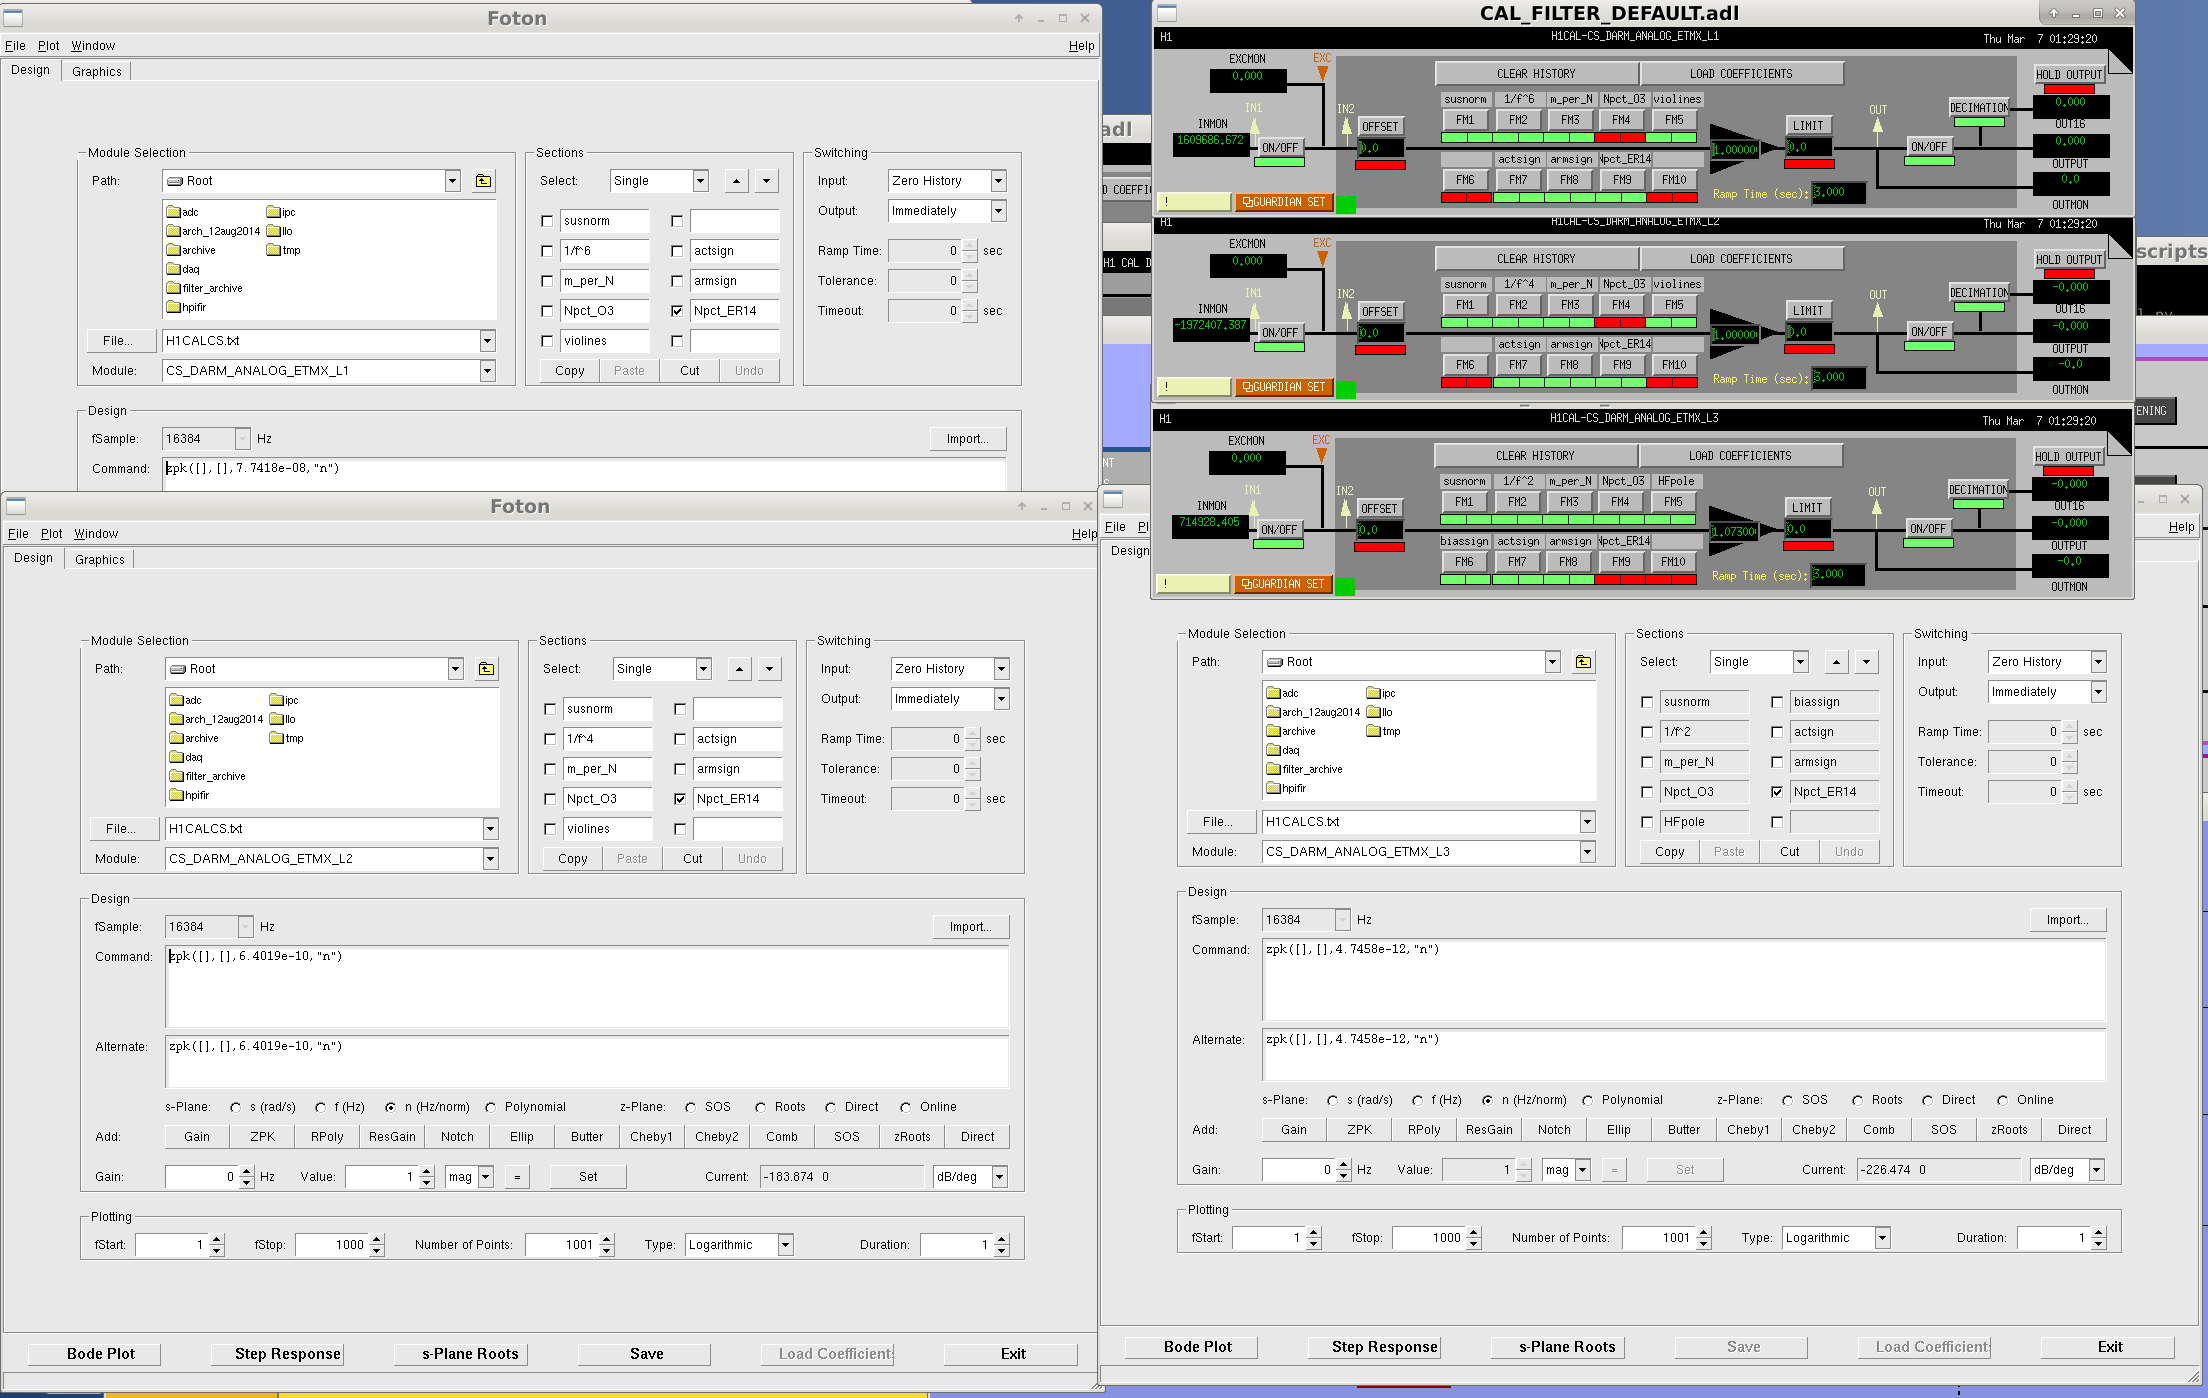
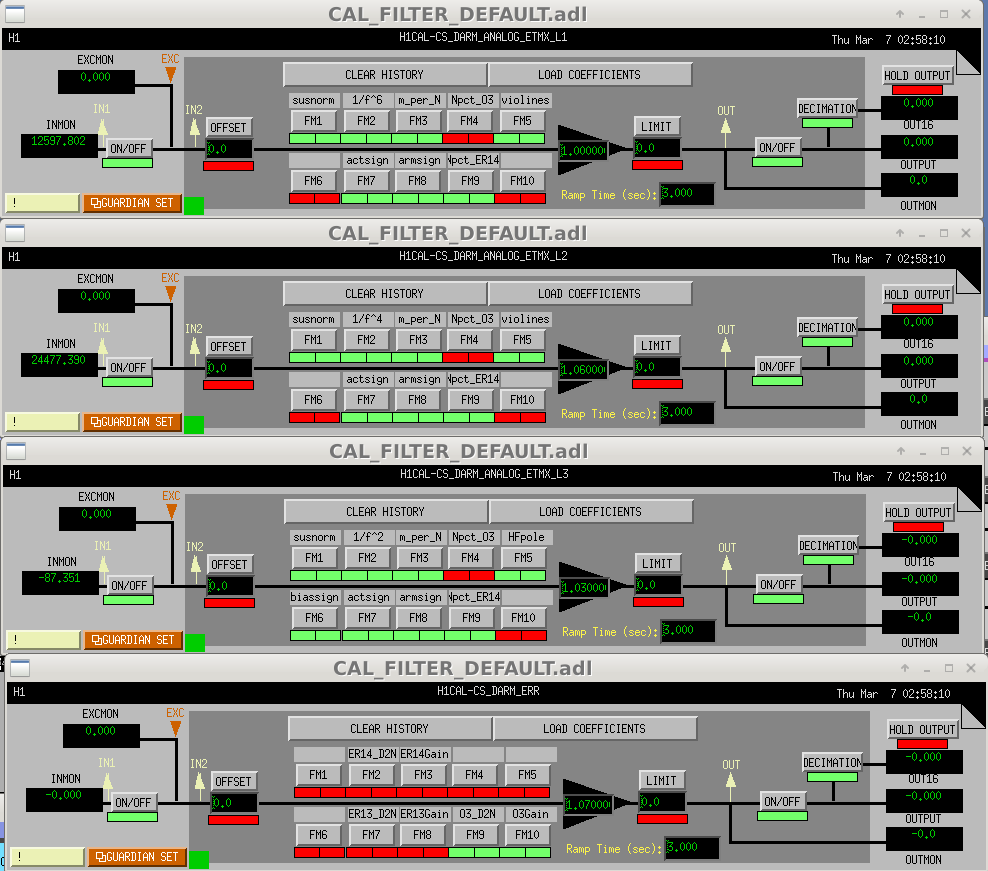
The PCAL to DARM was pretty bad, so I updated the Npct_ER14 front-end calibration filters according to the numbers above. I also switched off Npct_O3 and switched on Npct_ER14 for ETMX L3, and adjusted L3's FM calib actuator gain from 1.073 to 1.0. Will retake PCAL to DARM if I get a chance tonight.
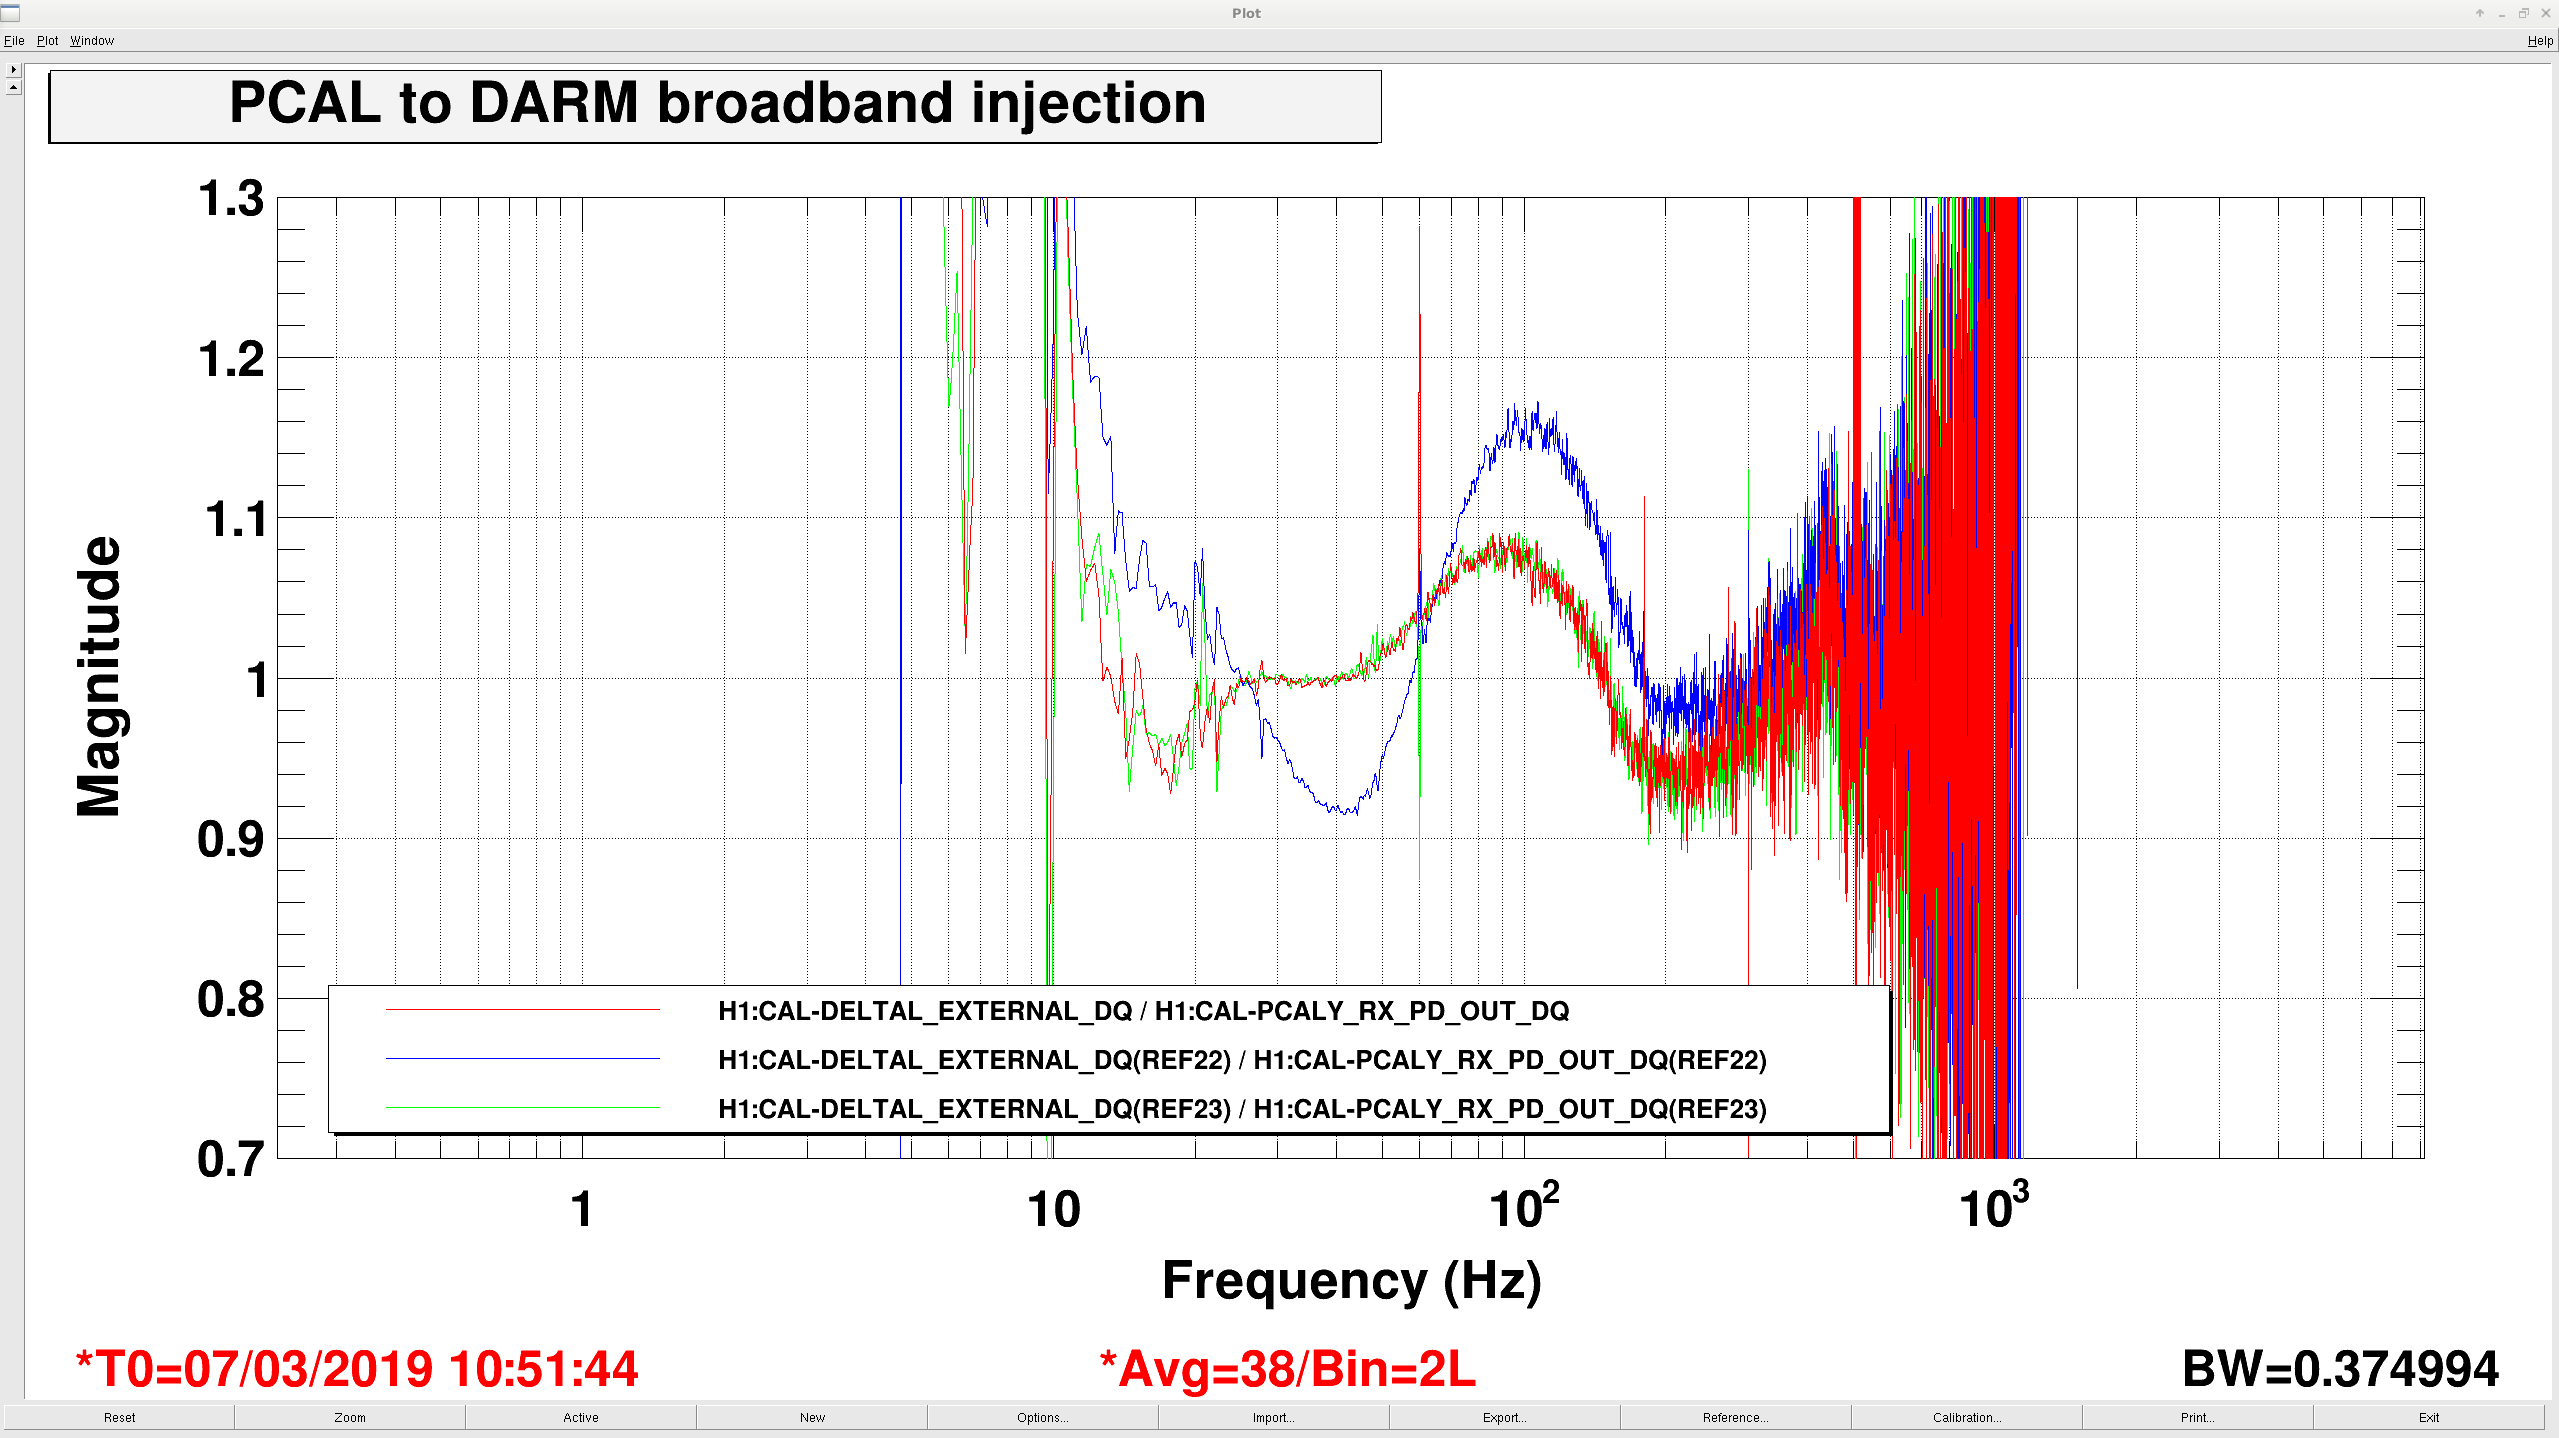
I ran another PCAL to DARM broadband injection while adjusting the gains. I believe there is some phase mismatch which makes a perfect front end calibration not possible at the moment: no matter how I adjust the gains, there is always a hump around 100 Hz, right around the crossover between the L3 and error signal authority. I did the best I could, we are good to 10% everywhere now. Range went from ~87 to ~95 Mpc.
Comparing the third plot above (called actuator authority) to the attachments to 47164, it seems like there must be a sign error in one of the stages which is creating the notch just below 2 Hz in the total. It would be easier to debug these sign flips if we also could see the phase.
@Sheila -- You're correct -- the model file used to generate the plot you mention (via darm_loop_critiue) had a reference to the wrong H1SUSETMX filter file (it wasn't as simple as a sign flip, but a previous filter file [before the PUM design was fixed] called with the same filter *banks* meant a report of a cross-over instability). I've corrected this since (apologies for not posting until now), but the new version is attached below, including the phase.
Keita, Craig, Sheila
Thanks Jeff for the updated plot. We are using the model used (and compared to cross over measurements) in 47164 to try to reproduce your plot.
We've tried to reproduce the plot you have above, but the only way we can do this is by removing the cascading of filters. To say the same thing a different way, when you say LOCK IN to displacement, I think that you mean L3 lock in to displacement, which for L1 would mean L3 LOCK L * L2 LOCK L *L1 LOCK L * L1 drivealing *L1 electronics * L1 mechanical stuff. The only way we can recreate your plot is to leave out L1 LOCK and L2 Lock from the L1 actuator. However, if we leave these out the toal line in your plot is misleading/wrong.
In the first attachment (not cascading filters) is our reproduction of Jeff's plot above, where we have removed the L3 lock and L2 lock filters from L1. The second one includes the cascaded filters, which is more correct if you want to add these up to make a total.
I've processed the measurements taken from 1) Drivealign bank and 2) Test bank (measurement data in aligocalibration/trunk/Runs/O3/H1/Measurements/FullIFOActuationTFs; March 26)
The resulting plots are attached. The fitting through the test bank is better. This is a quick comment. The details need to be further investigated and discussed.
The residual comparison plot is made following the steps below:
1) Create two separate reference models for drivealign and test scenarios, based on the Mar 16 model, by writing back the MCMC PUM MAP values.
2) Compute the error residuals for two scenarios separately.
3) Plot Response_drivealign_with_error/Response_drivealign_ref, and Response_test_with_error/Response_test_ref.