Displaying reports 43281-43300 of 88618.Go to page Start 2161 2162 2163 2164 2165 2166 2167 2168 2169 End
Reports until 15:41, Thursday 31 January 2019
H1 AOS
daniel.sigg@LIGO.ORG - posted 15:41, Thursday 31 January 2019 - last comment - 16:19, Thursday 31 January 2019(46727)
BIO chassis problems

At about 5:40pm yesterday, the EtherCAT system stopped communicating with BIO chassis 1&2. Inspecting the chassis in the CER, chassis 1 has an LED in the back indicating that +24V is off, whereas the LED in the front indicates that +24V is on. Things to try:

Comments related to this report
daniel.sigg@LIGO.ORG - 16:19, Thursday 31 January 2019 (46728)

Fil and I went with a laptop to check, if we can make a connection to the individual chassis. This worked and it turned out that the Ethernet cable between the EtherCAT chassis and the first chassis was broken. A strange failure mode, but it seems to work again.

H1 CDS (DAQ)
david.barker@LIGO.ORG - posted 15:19, Thursday 31 January 2019 (46726)
New DAQ overview MEDM

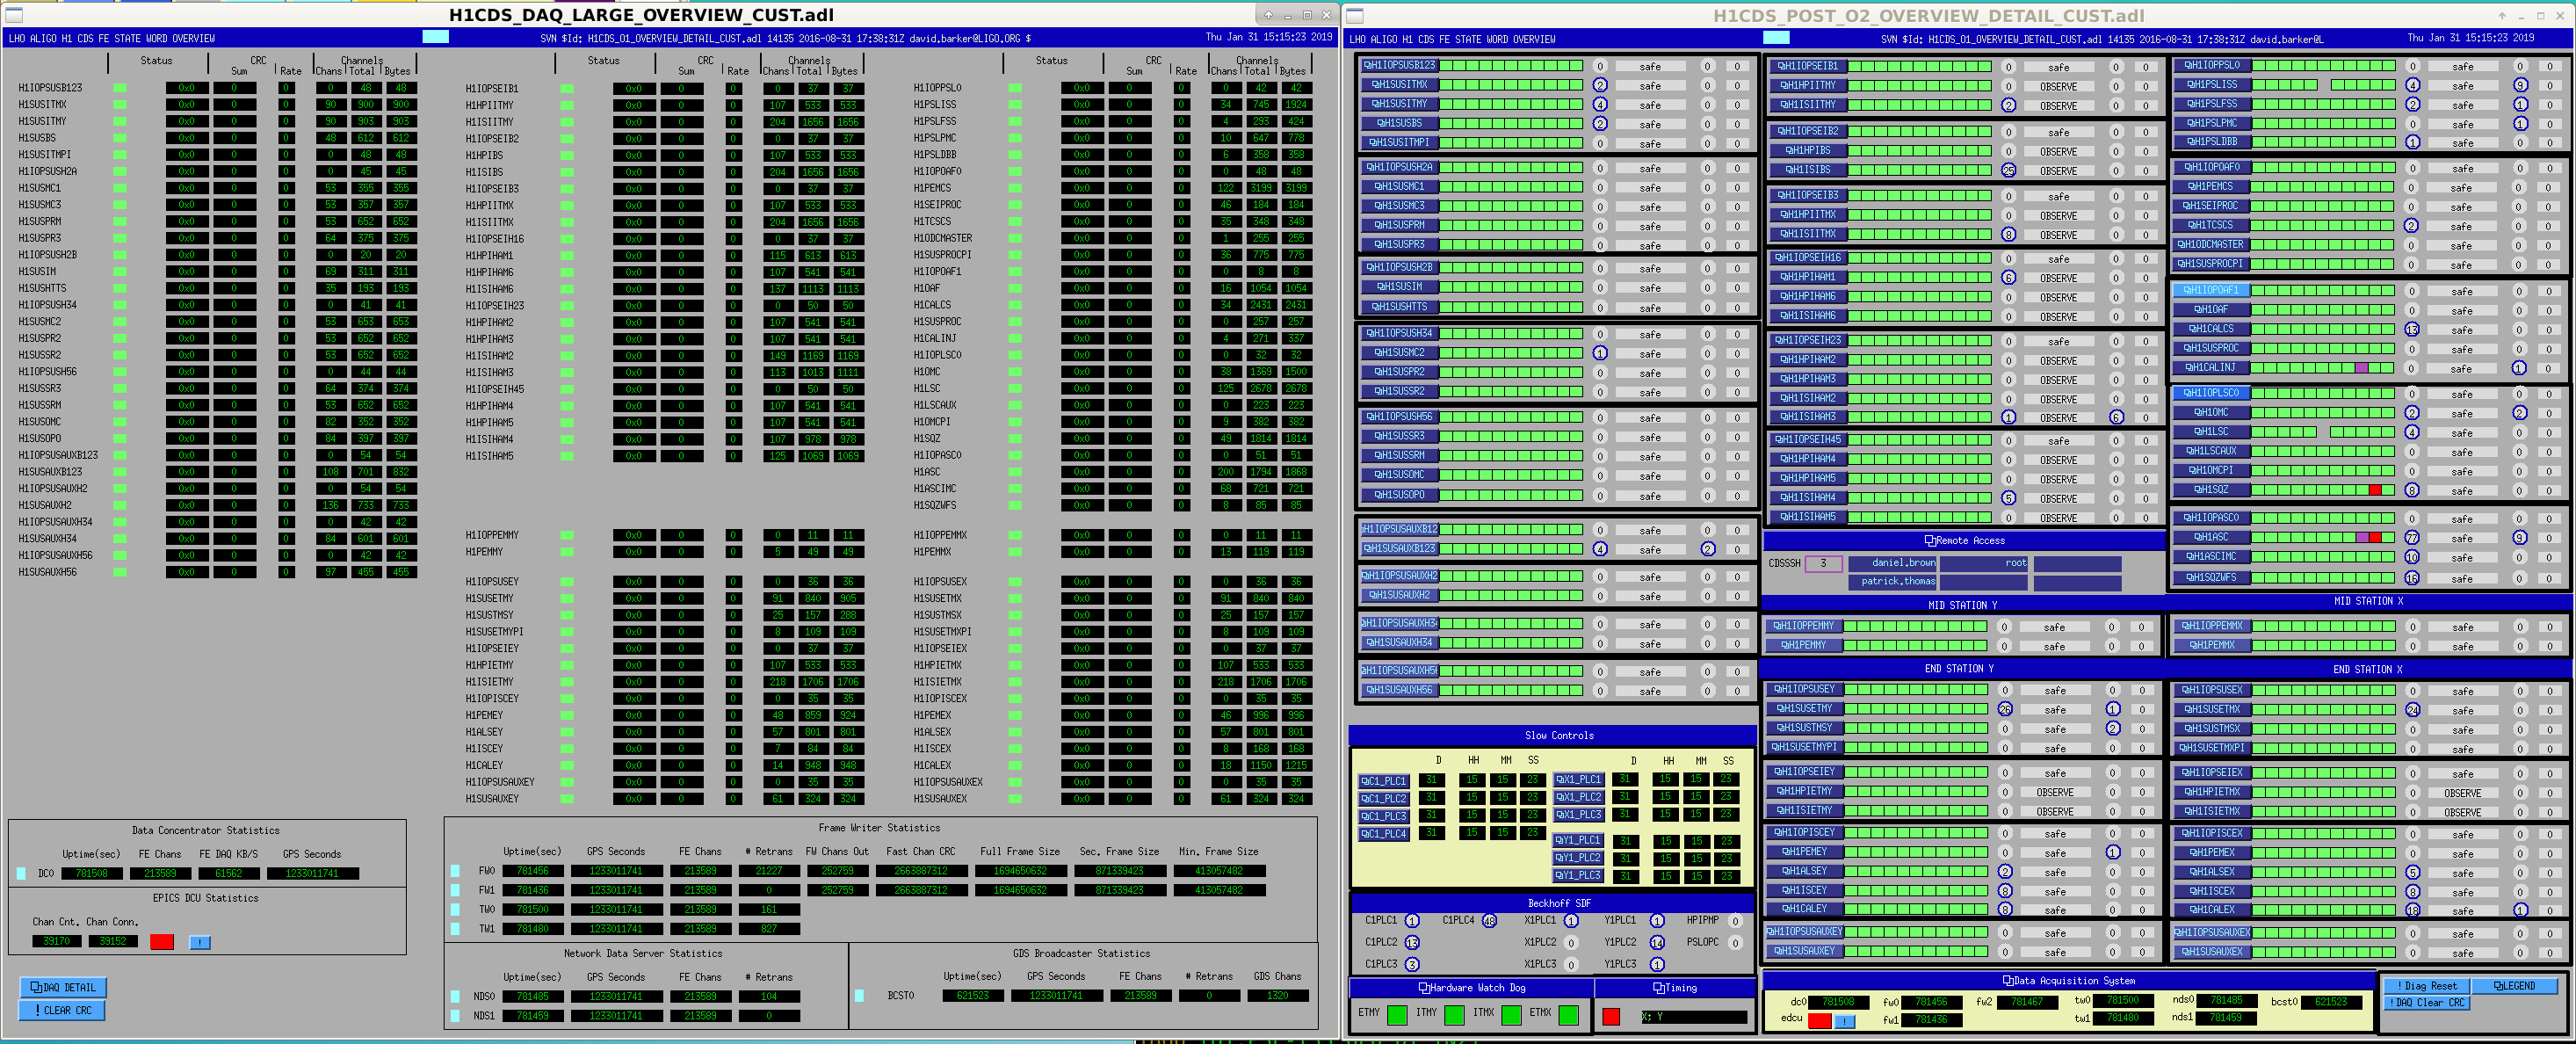
I've taken LLO's large DAQ overview MEDM screen and converted it for LHO. I've macrotized the front end blocks and given them roughly the same layout as the main CDS Overview MEDM (attachment shows them side-by-side). The old DAQ detail screen can be opened using the lower-left button.

Images attached to this report
H1 CDS
jonathan.hanks@LIGO.ORG - posted 13:55, Thursday 31 January 2019 (46725)
Matlab on the workstations should find the nds2 client automatically
Matlab 2015b on the workstations will now automatically load the nds2 client.  No more need to do javaaddpath(...).
H1 General (ISC, SUS)
stuart.aston@LIGO.ORG - posted 13:51, Thursday 31 January 2019 - last comment - 12:39, Monday 04 February 2019(46711)
QUAD suspension 3.3 Hz ring-up investigations
[Jeff K, Stuart A]

IIET: #11730

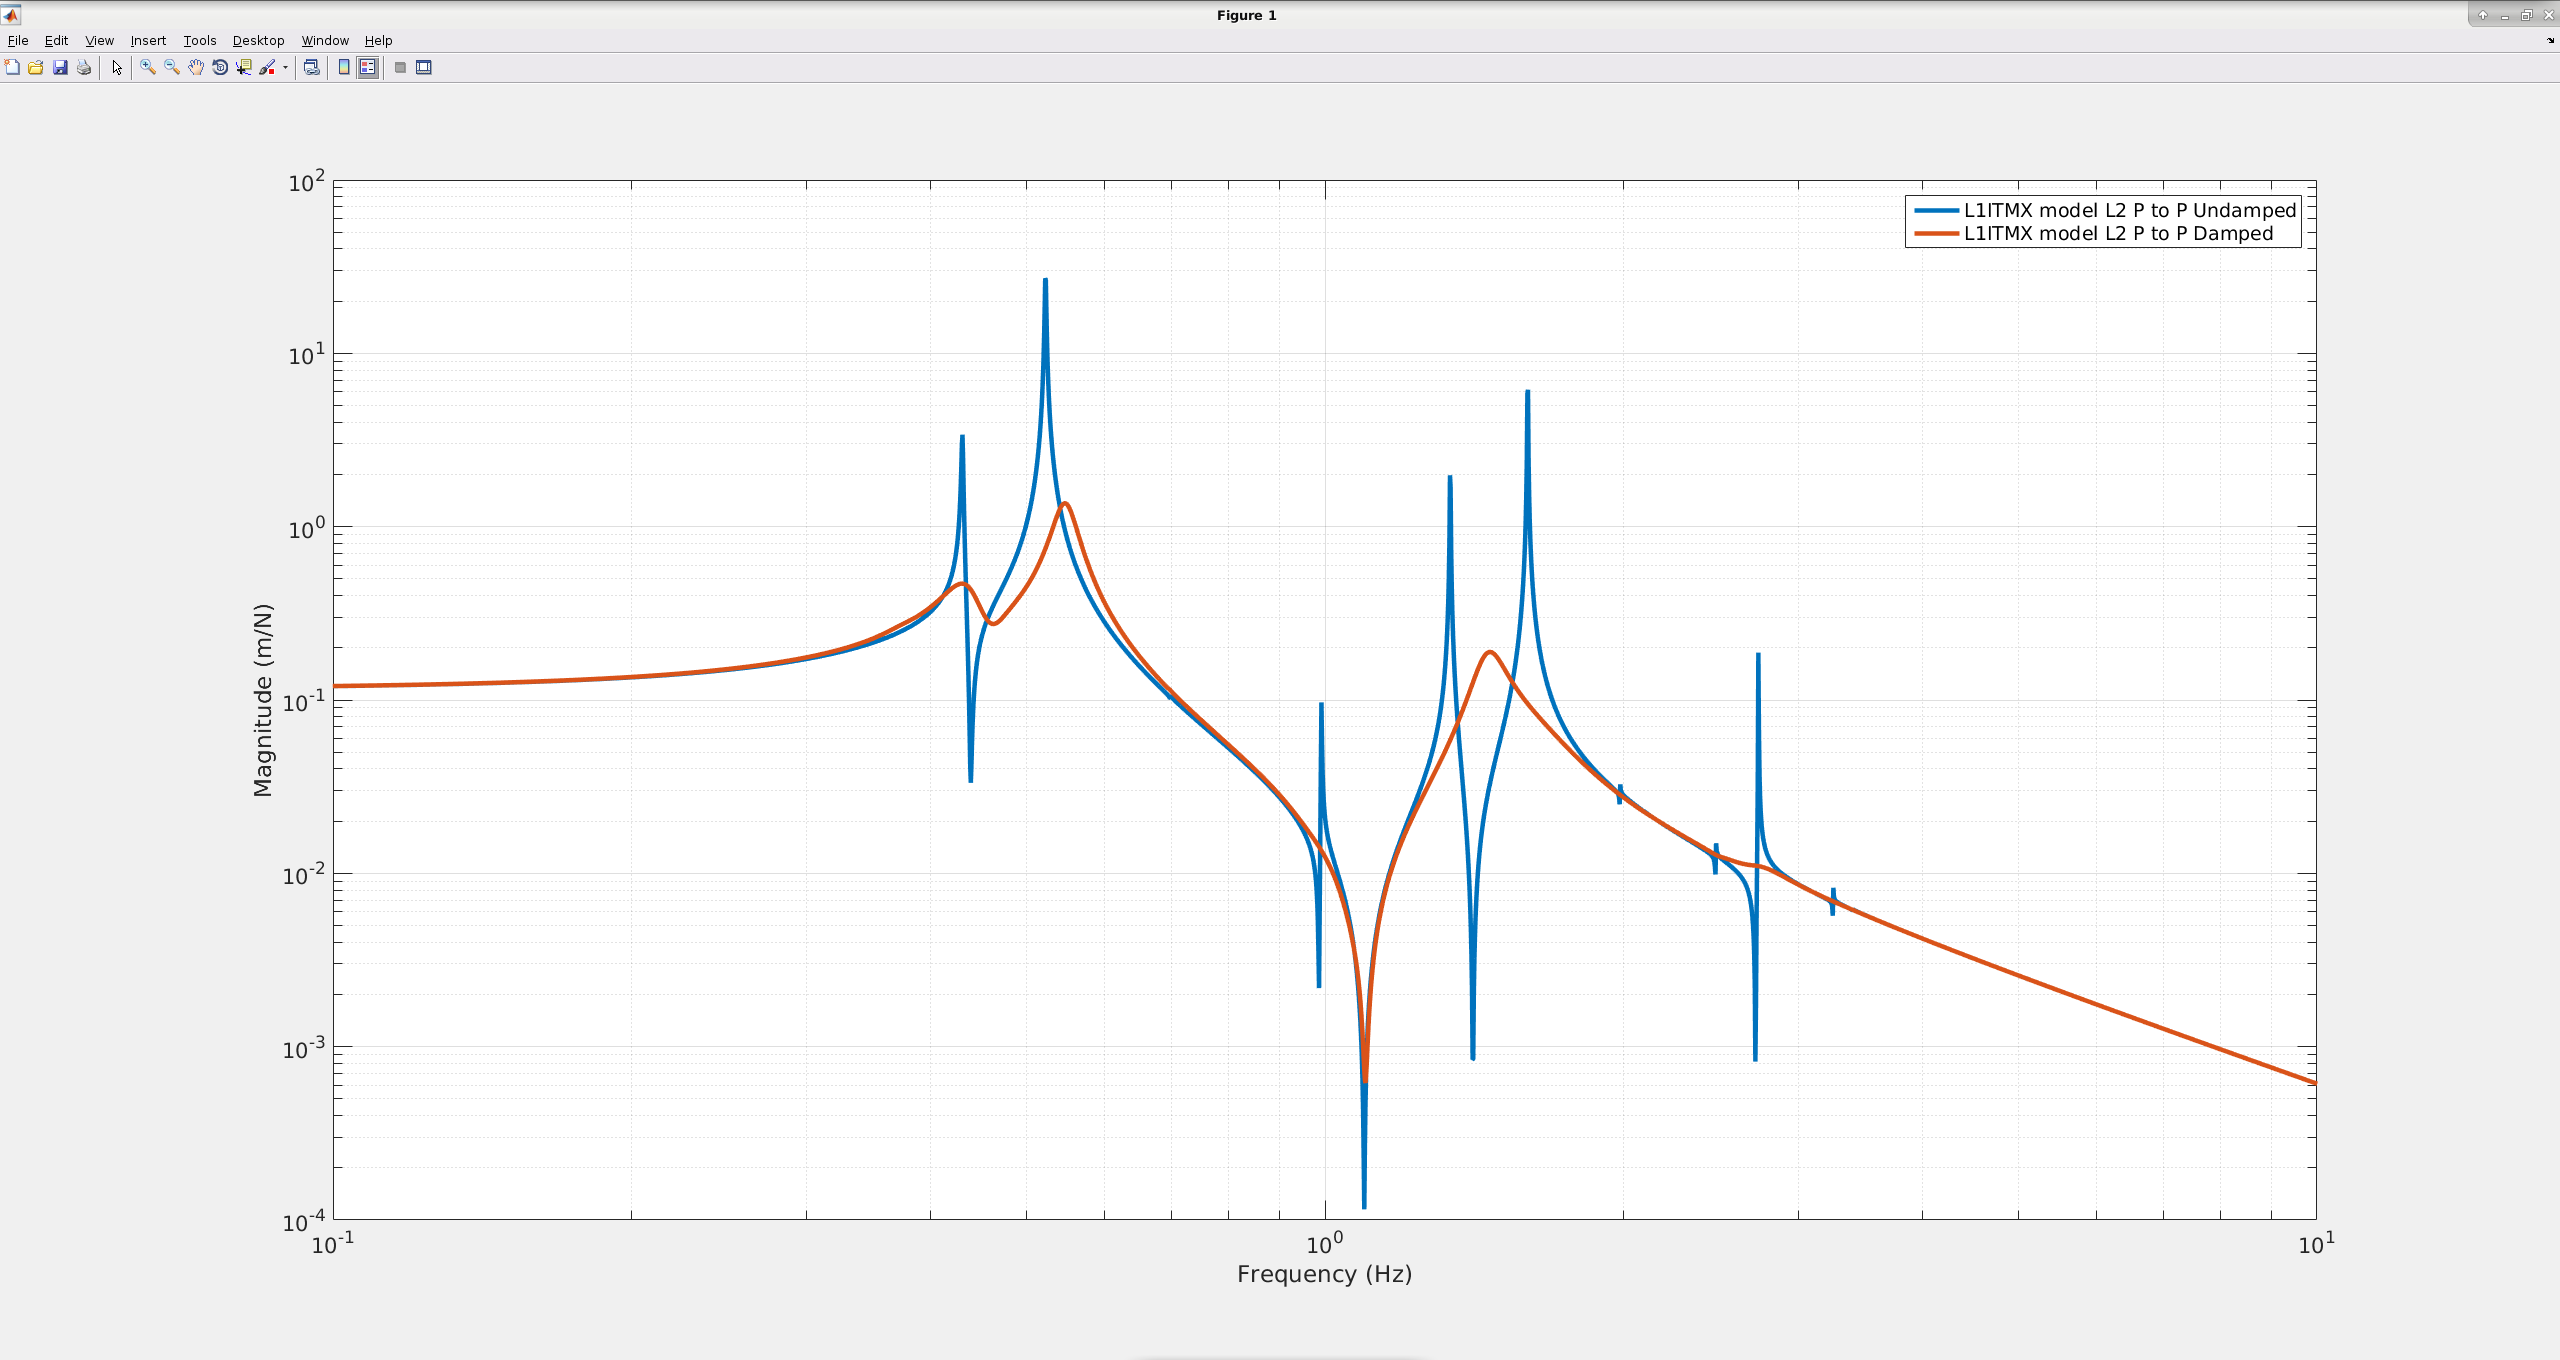
ITM QUAD suspensions at LLO have exhibited sharp ring-ups at 3.3 Hz from ASC pitch drive resulting in IFO lock-losses (see for example LLO aLOG entries: 40926, 40953, 40972 and 41501), as a work-around LLO currently employs a "TWO_LEGGED_HARDASC" scheme reducing ASC HARD drive from 4 QUADs to 2 QUADs i.e. just feeding back to the ETMs (see LLO aLOG entry 41502). The 3.3 Hz feature corresponds to the QUAD R3 Mode, which when looking at QUAD L2 P to P Damped TFs (see allquads_2019-01-30_AllSUSQUAD_Phase3b_L2_Damped_ALL_TFs.pdf below) which we have confirmed is also prominent in LHO QUAD suspensions too. However, at present, the 3.3 Hz R3 modes are not being rung-up at LHO.

Given there has been no change since O2 in the LLO QUAD local damping scheme, which demonstrates equally ineffective damping of the 3.3 Hz R3 mode as the LHO QUAD local damping scheme, thus, we believe there has been a change in the global control at LLO. This was not an issue at LLO during O2, so we suspect that changes in the ASC loops to handle higher IFO power have exacerbated the 3.3 Hz ring-up problem.

We found that the 3.3 Hz R3 mode is not well modeled in the QUAD dynamical model (see L1ITMX_Model_L2_PtoP below) which also suggests that the R3 mode should be completely damped n.b. we imported L1 ITMX live damping filters.

Therefore, we are now attempting to adjust QUAD dynamical model parameters to better fit the measured QUAD TF data. Failing this approach, we may seek to resurrect the QUAD model fitting code T1100163.
Images attached to this report
Non-image files attached to this report
Comments related to this report
stuart.aston@LIGO.ORG - 12:39, Monday 04 February 2019 (46762)SUS
Noting R3 mode frequencies for each QUAD measured from the TFs (n.b. most recent L1 TF data is taken in 2018 and most recent H1 data was from taken in 2014):

L1 ITMX = 3.32 Hz
L1 ITMY = 3.32 Hz
L1 ETMX = 3.188 Hz
L1 ETMY = 3.195 Hz

H1 ITMX = 3.32 Hz
H1 ITMY = 3.31 Hz
H1 ETMX = 3.01 Hz
H1 ETMY =  No TF Data
H1 SQZ (SQZ)
nutsinee.kijbunchoo@LIGO.ORG - posted 12:38, Thursday 31 January 2019 - last comment - 09:36, Saturday 02 February 2019(46724)
SQZ Noise Budget| H1 vs. L1 Scheme

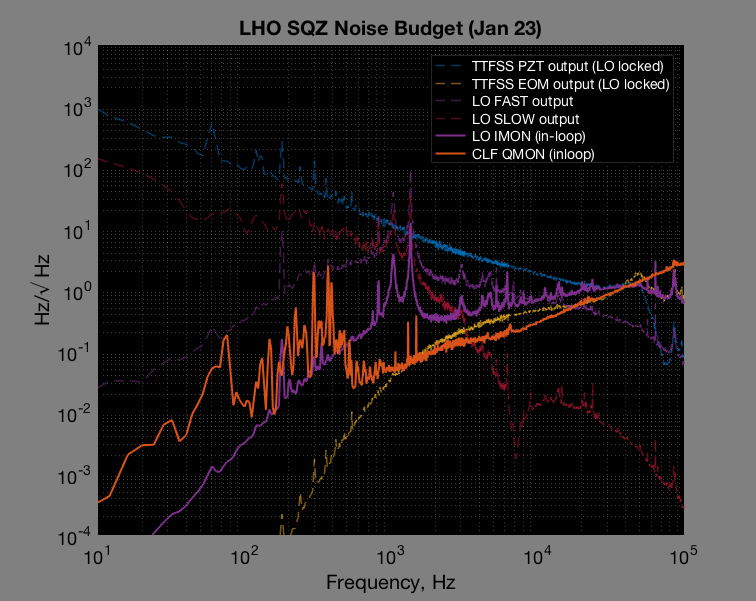
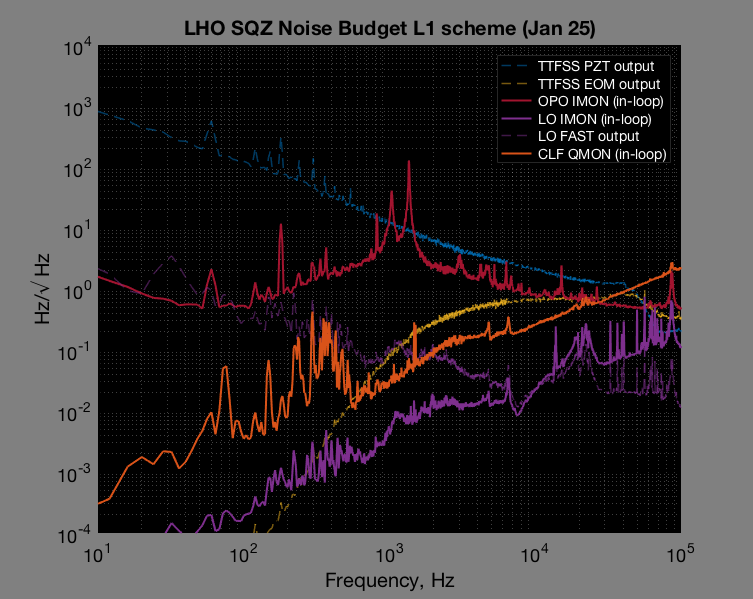
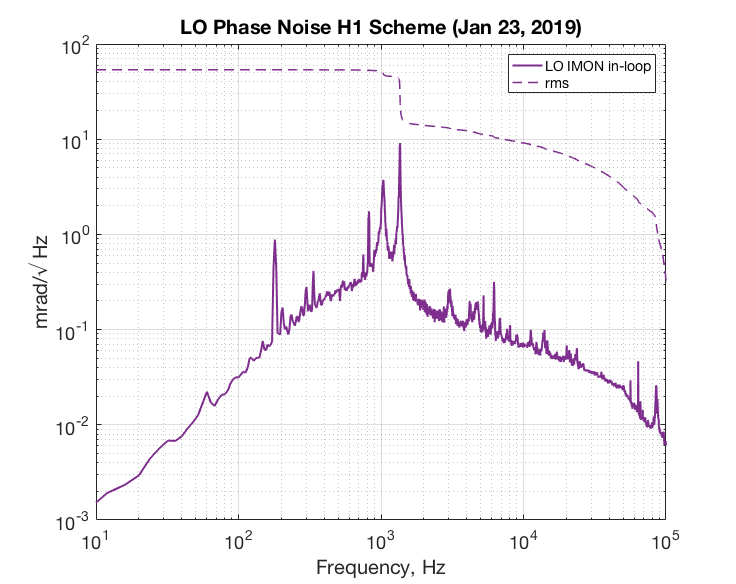
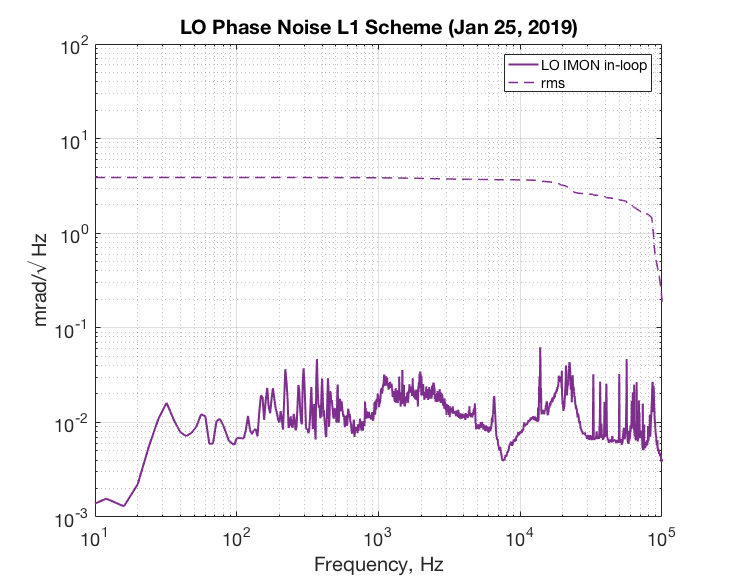
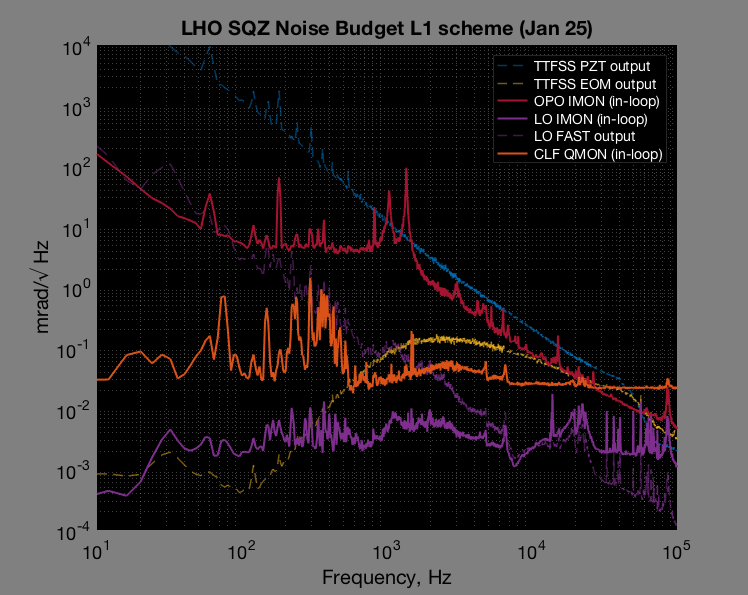
Here's what the overall noise looks like between the two scheme

This is H1 scheme, with 20dB attenuator on 80MHz LO swapped for 10dB, same CLF power used when we measured 4dB (with PSLLO):


And after we swapped, here's L1/original scheme:


One good news is that I don't think we will see OPO length noise in the IFO anymore as LO is not seeing any of it.


Looking closely at LO phase noise, I don't think this tells the whole story as previous sqz/asqz measurement with L1 scheme appeared to do (just) a little worse. In this plot L1 scheme LO phase noise seems to do much better.


Daniel found CLF correlation < 1kHz with the accelerometer on ISCT6 (alog46712). I'll look at intensity noise next to try to explain noise >1kHz.

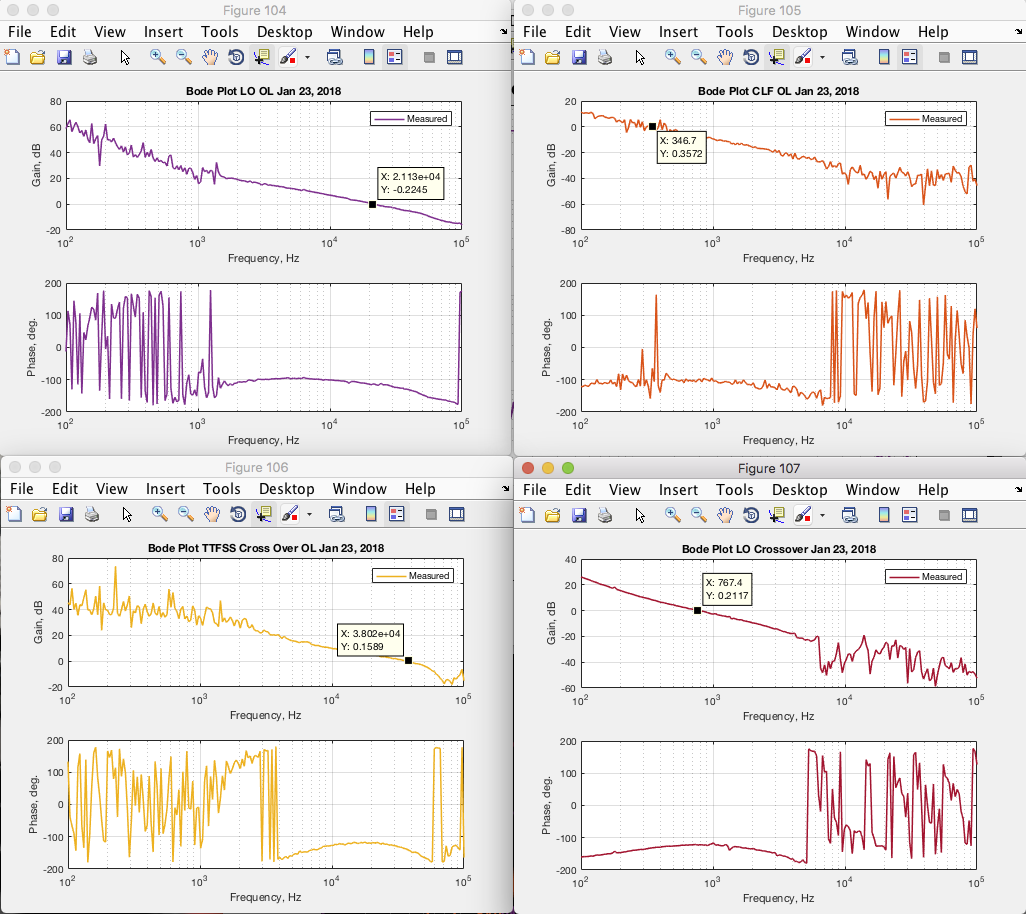
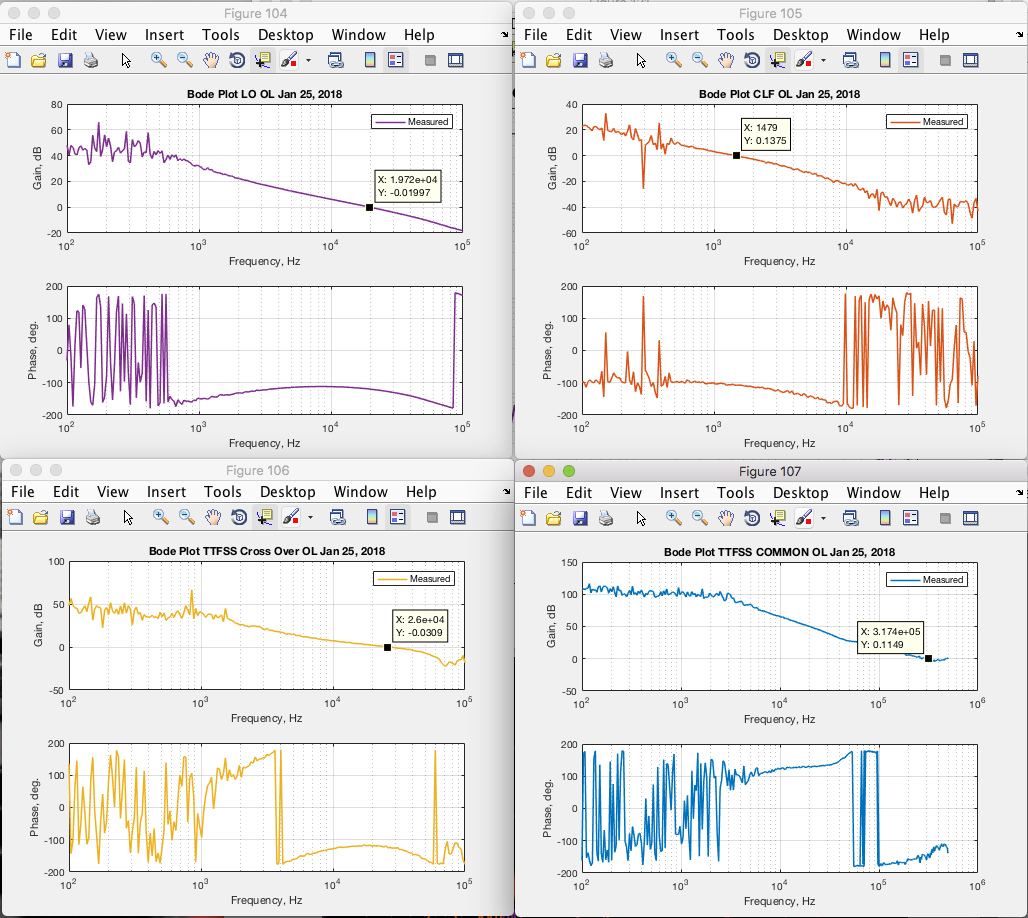
See attachment for transfer functions for both noise plots and L1 scheme noise in mrad.


Images attached to this report
Non-image files attached to this report
Comments related to this report
lee.mcculler@LIGO.ORG - 07:10, Friday 01 February 2019 (46734)

Looks like its pretty well behaved. Since it looks substantially better than LLO's current budget, despite using the same scheme and largely the same hardware, I dug slightly into your provided code.

On your CLF and LO PSDs, I see you are dividing by 2.74 for LO and .340 for CLF, which I'm guessing is the DC voltage of the conjugate phase (you're locking CLF in Q?, why is QMON plotted).

There is an additional factor of 2 on the LO, which suggests you are using the CLF phase sensitivity. As I mentioned in the meeting, I think you should move this factor to the denominator of the CLF to use the LO as the reference sensitivity. This will improve both by 2x. I could be wrong if you are dividing by the pkpk of the unlocked signal or something, I'm not sure what the divided numbers are.


I don't see the factor of 2pi to convert to the phase sensitivity though. I suspect the CLF and LO spectra are currently too small by this factor (netting a factor of pi too small if the above factor of 2 and 2pi both need to be included).


Since the budget isn't decomposed into factors, If you look at L1schemeNoisebudget_mrad.png, you see that there is on the CLF a residual with ~200Hz of 3.14mrad/rtHz (where I've added the net factor of pi). This means your current CLF operation is has ~40mrad RMS of residual noise. The sensing noise of 2e-2mrad/rtHz * pi * (2000Hz)**.5 ~= 3mrad is below that, so the CLF gain could be higher.

lee.mcculler@LIGO.ORG - 10:45, Friday 01 February 2019 (46744)

Ok, actually I was confusing myself with this factor. I did the derivation again and your code is doing it right, no additional factor of 2pi. I'll have to adjust the LLO phase noise budgets down accordingly (factor of 4pi, 2pi from this, and 2 from using CLF as the sensitivity reference instead of the LO).  In this case, the 100-150mrad seen in the IFO at LLO cannot be explained by anything but the excess at high frequencies. Looks like you should be less plagued by this given these plots.

nutsinee.kijbunchoo@LIGO.ORG - 09:36, Saturday 02 February 2019 (46752)

Just to clarify, I used Vpp of unlocked CLF and LO signal to calibrate the spectrum. CLF Vpp calibration is V/rad while LO is V/2rad.

H1 TCS (TCS)
aidan.brooks@LIGO.ORG - posted 11:28, Thursday 31 January 2019 (46722)
ETM HWS do not show strong evidence of 1064nm leakage but show some systematic variation in intensity related to IFO state

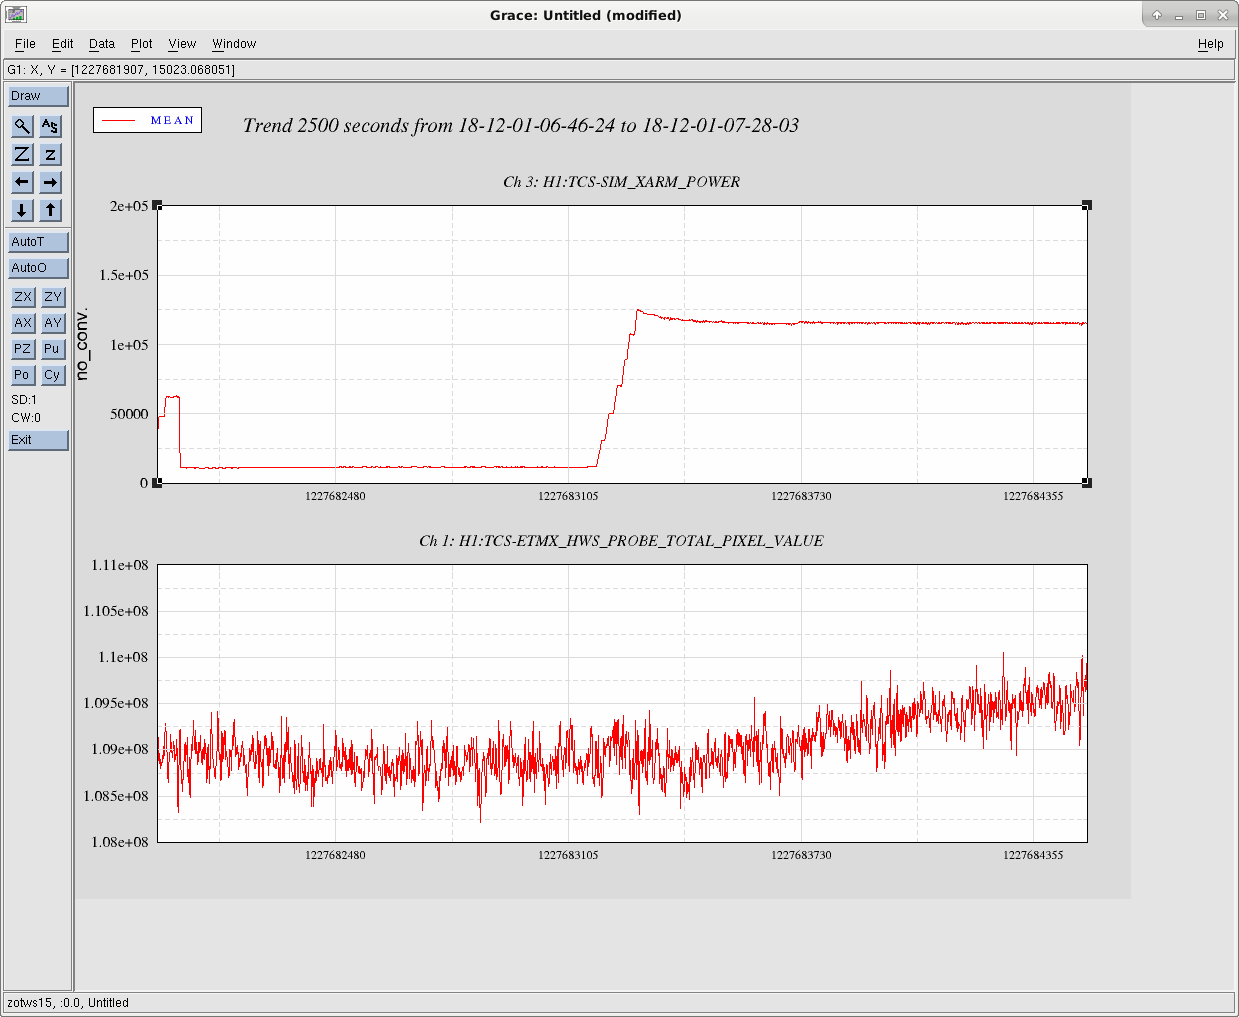
ETM HWS do not show strong evidence of 1064nm leakage but show some systematic variation in intensity related to IFO state (~1% on ETMX-HWS and ~2% on ETMY HWS).

ETMY

ETMX

Images attached to this report
H1 CAL
evan.goetz@LIGO.ORG - posted 10:38, Thursday 31 January 2019 (46723)
Script to compute corrected inspiral range near time of Pcal to CAL-DELTAL_EXTERNAL measurement
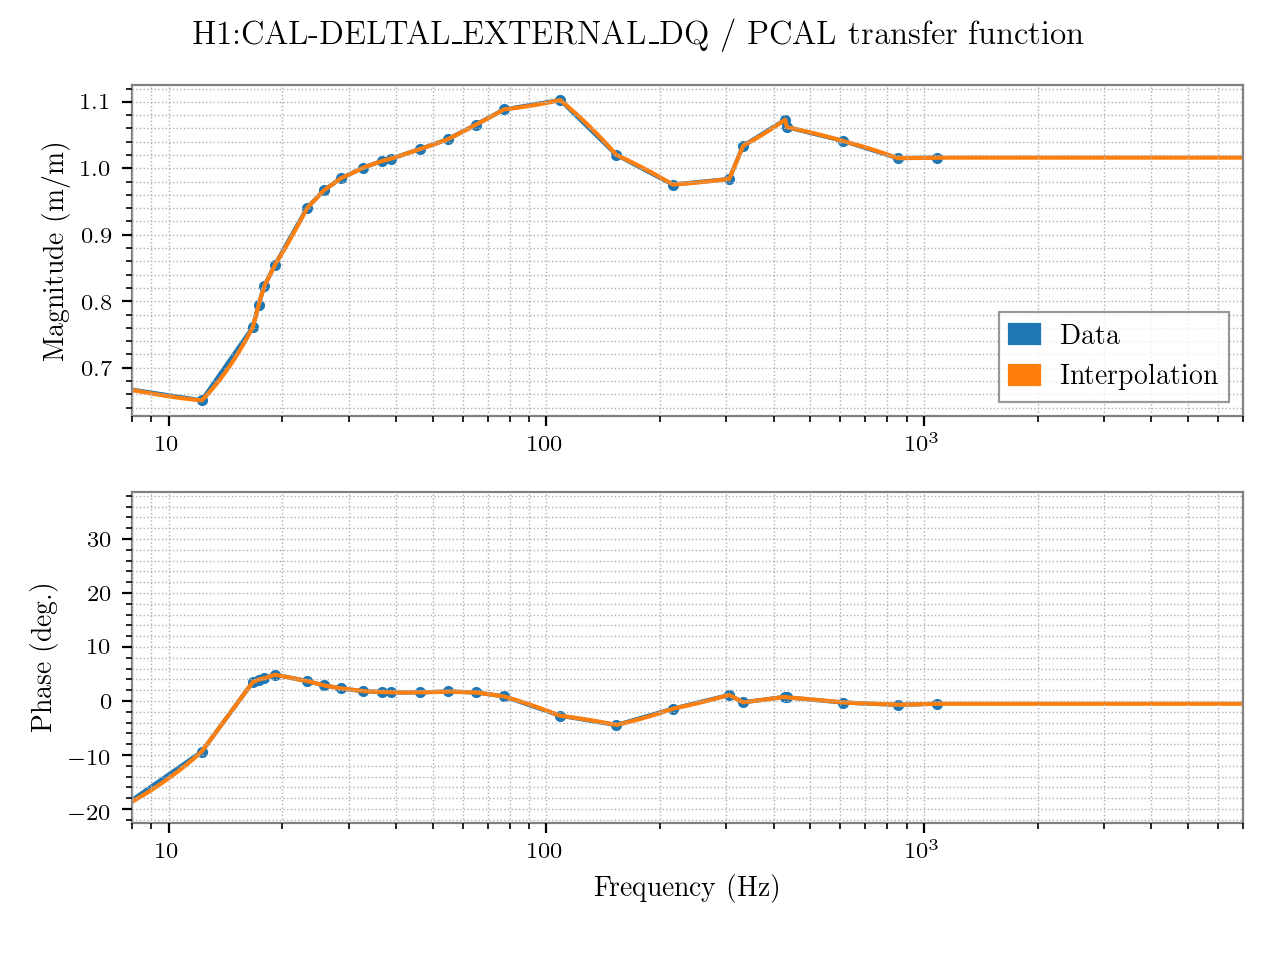
I wrote a script to compute the correct inspiral range based on a transfer function measurement using Pcal to CAL-DELTAL_EXTERNAL. I used a recent measurement (see LHO aLOG 46530) to test this script. 

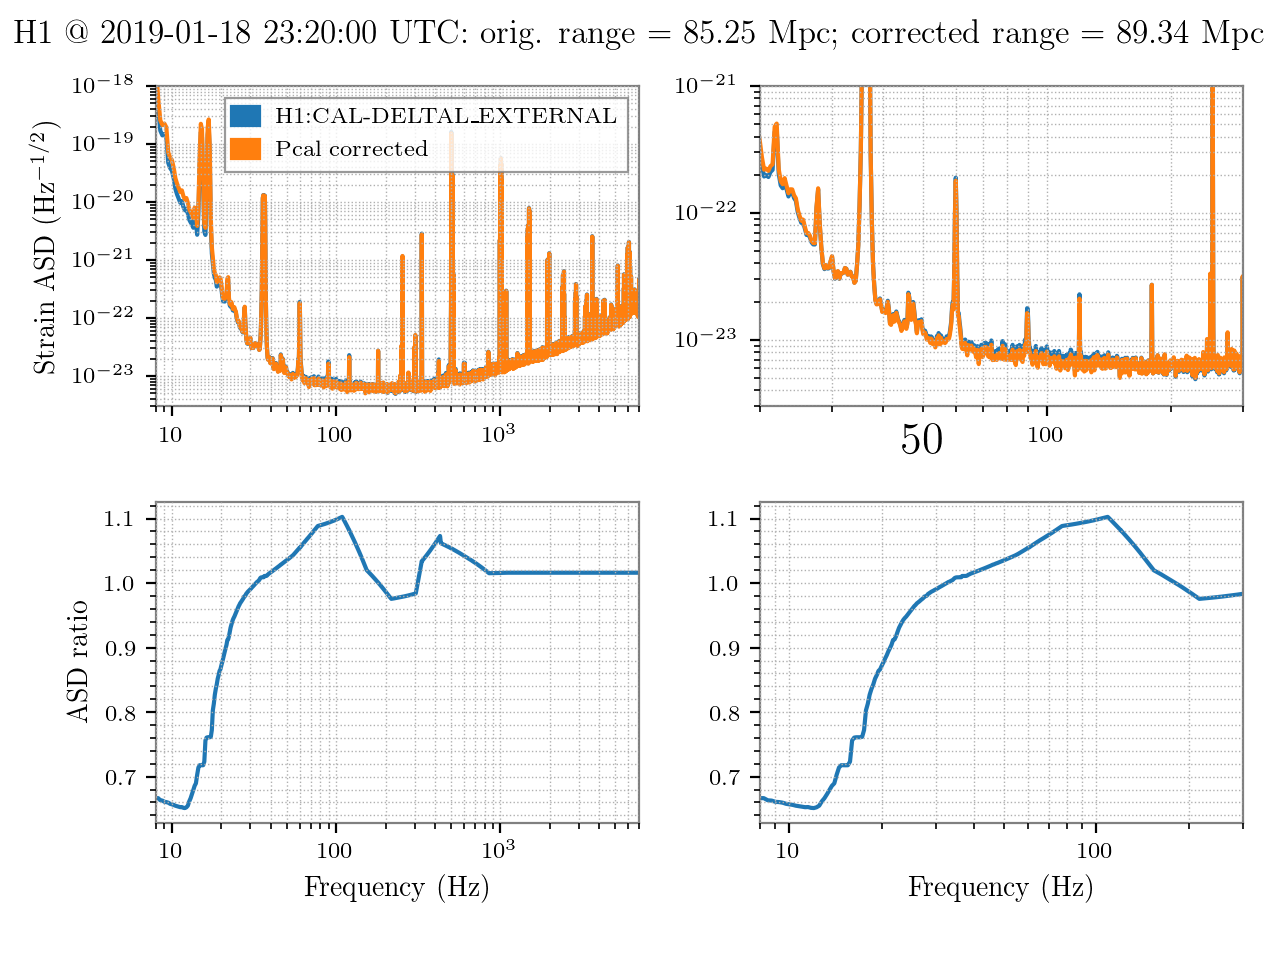
In summary, based on this measurement, the correct inspiral range (if Pcal is indeed considered the true value), then the inspiral range is 89.3 Mpc. By comparison, the original computed inspiral range was 85.3 Mpc.

The script is stored here:
$CALSVN/trunk/Common/pyDARM/correct_bns_range.py

The important caveats are:
1) the installed front end inverse sensing filter must be the same as the model file/function that you are using, and you have to point the script to this parameter file (meaning you have to know what was used to install the front end inverse sensing filters)
2) while one can put any GPS time to get a DARM spectrum, the correction is really only valid near the time of the Pcal to DARM sweep
3) the transfer function and coherence data from the DTT template has to be exported to ASCII files

I attach two figures to illustrate this code on the recent measurement link above.
1) The transfer function data between Pcal and CAL-DELTAL_EXTERNAL to measure the correction needed
2) 4-panel plot showing the correction to the DARM spectrum
Images attached to this report
H1 SEI
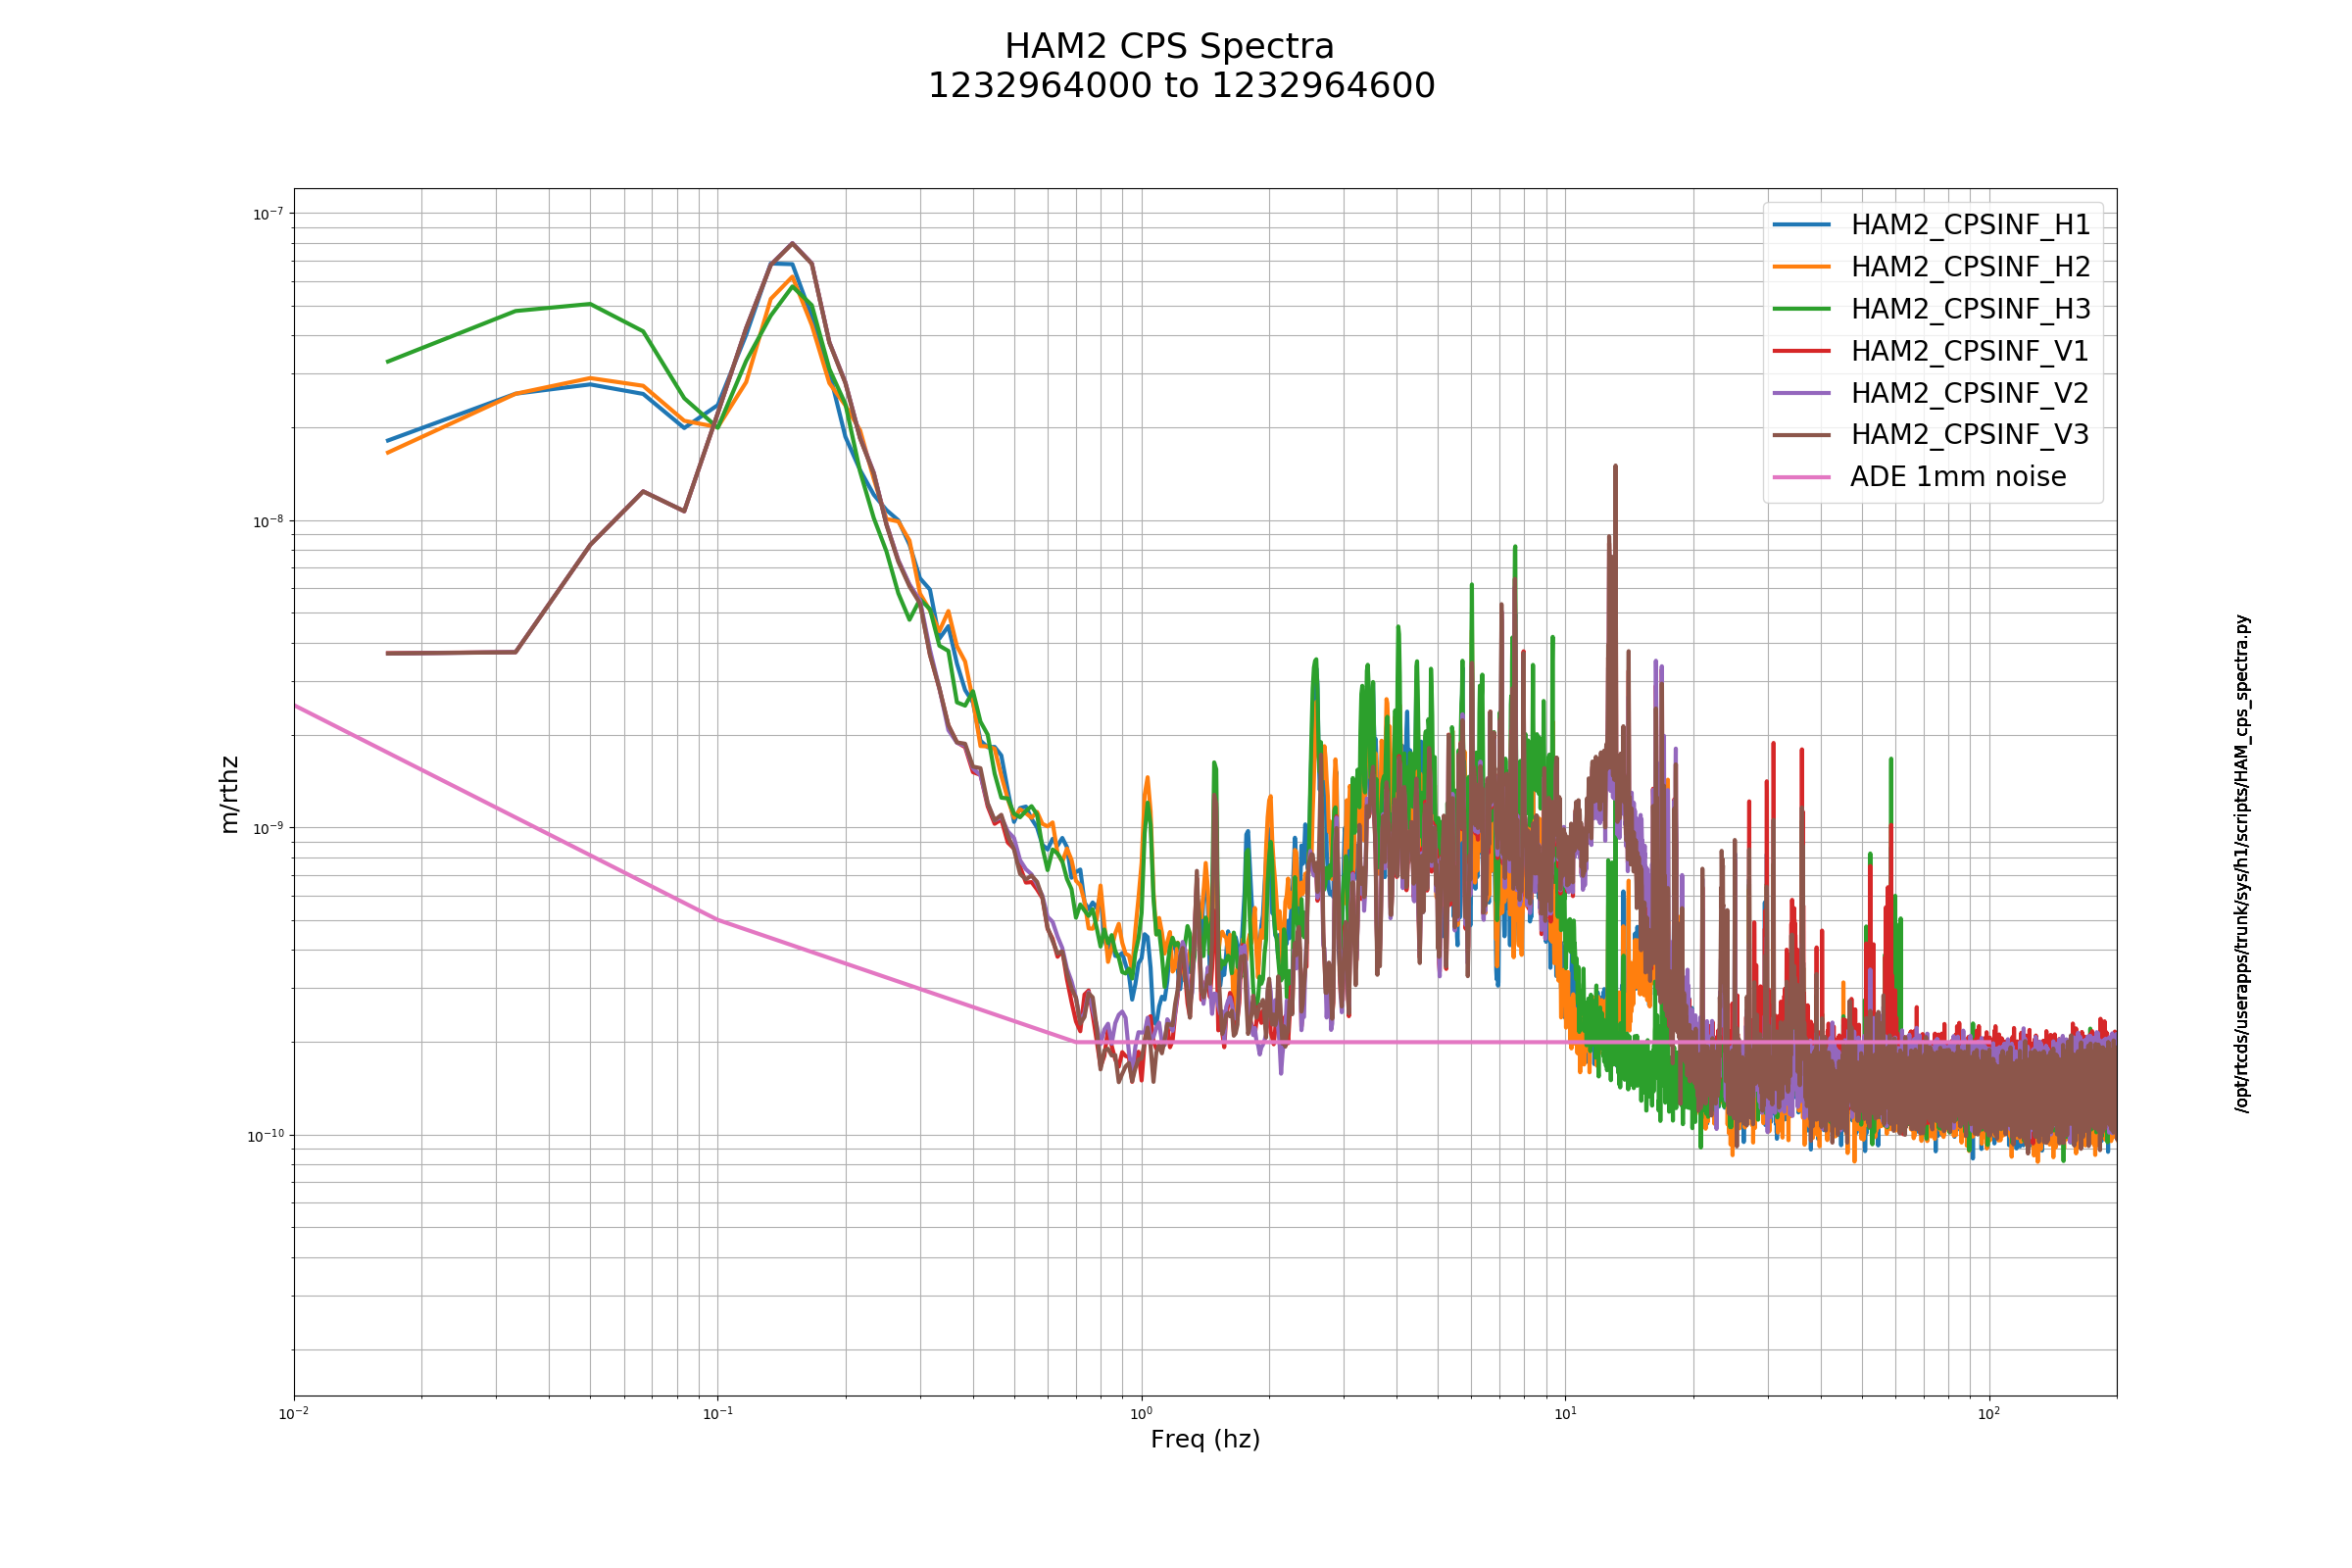
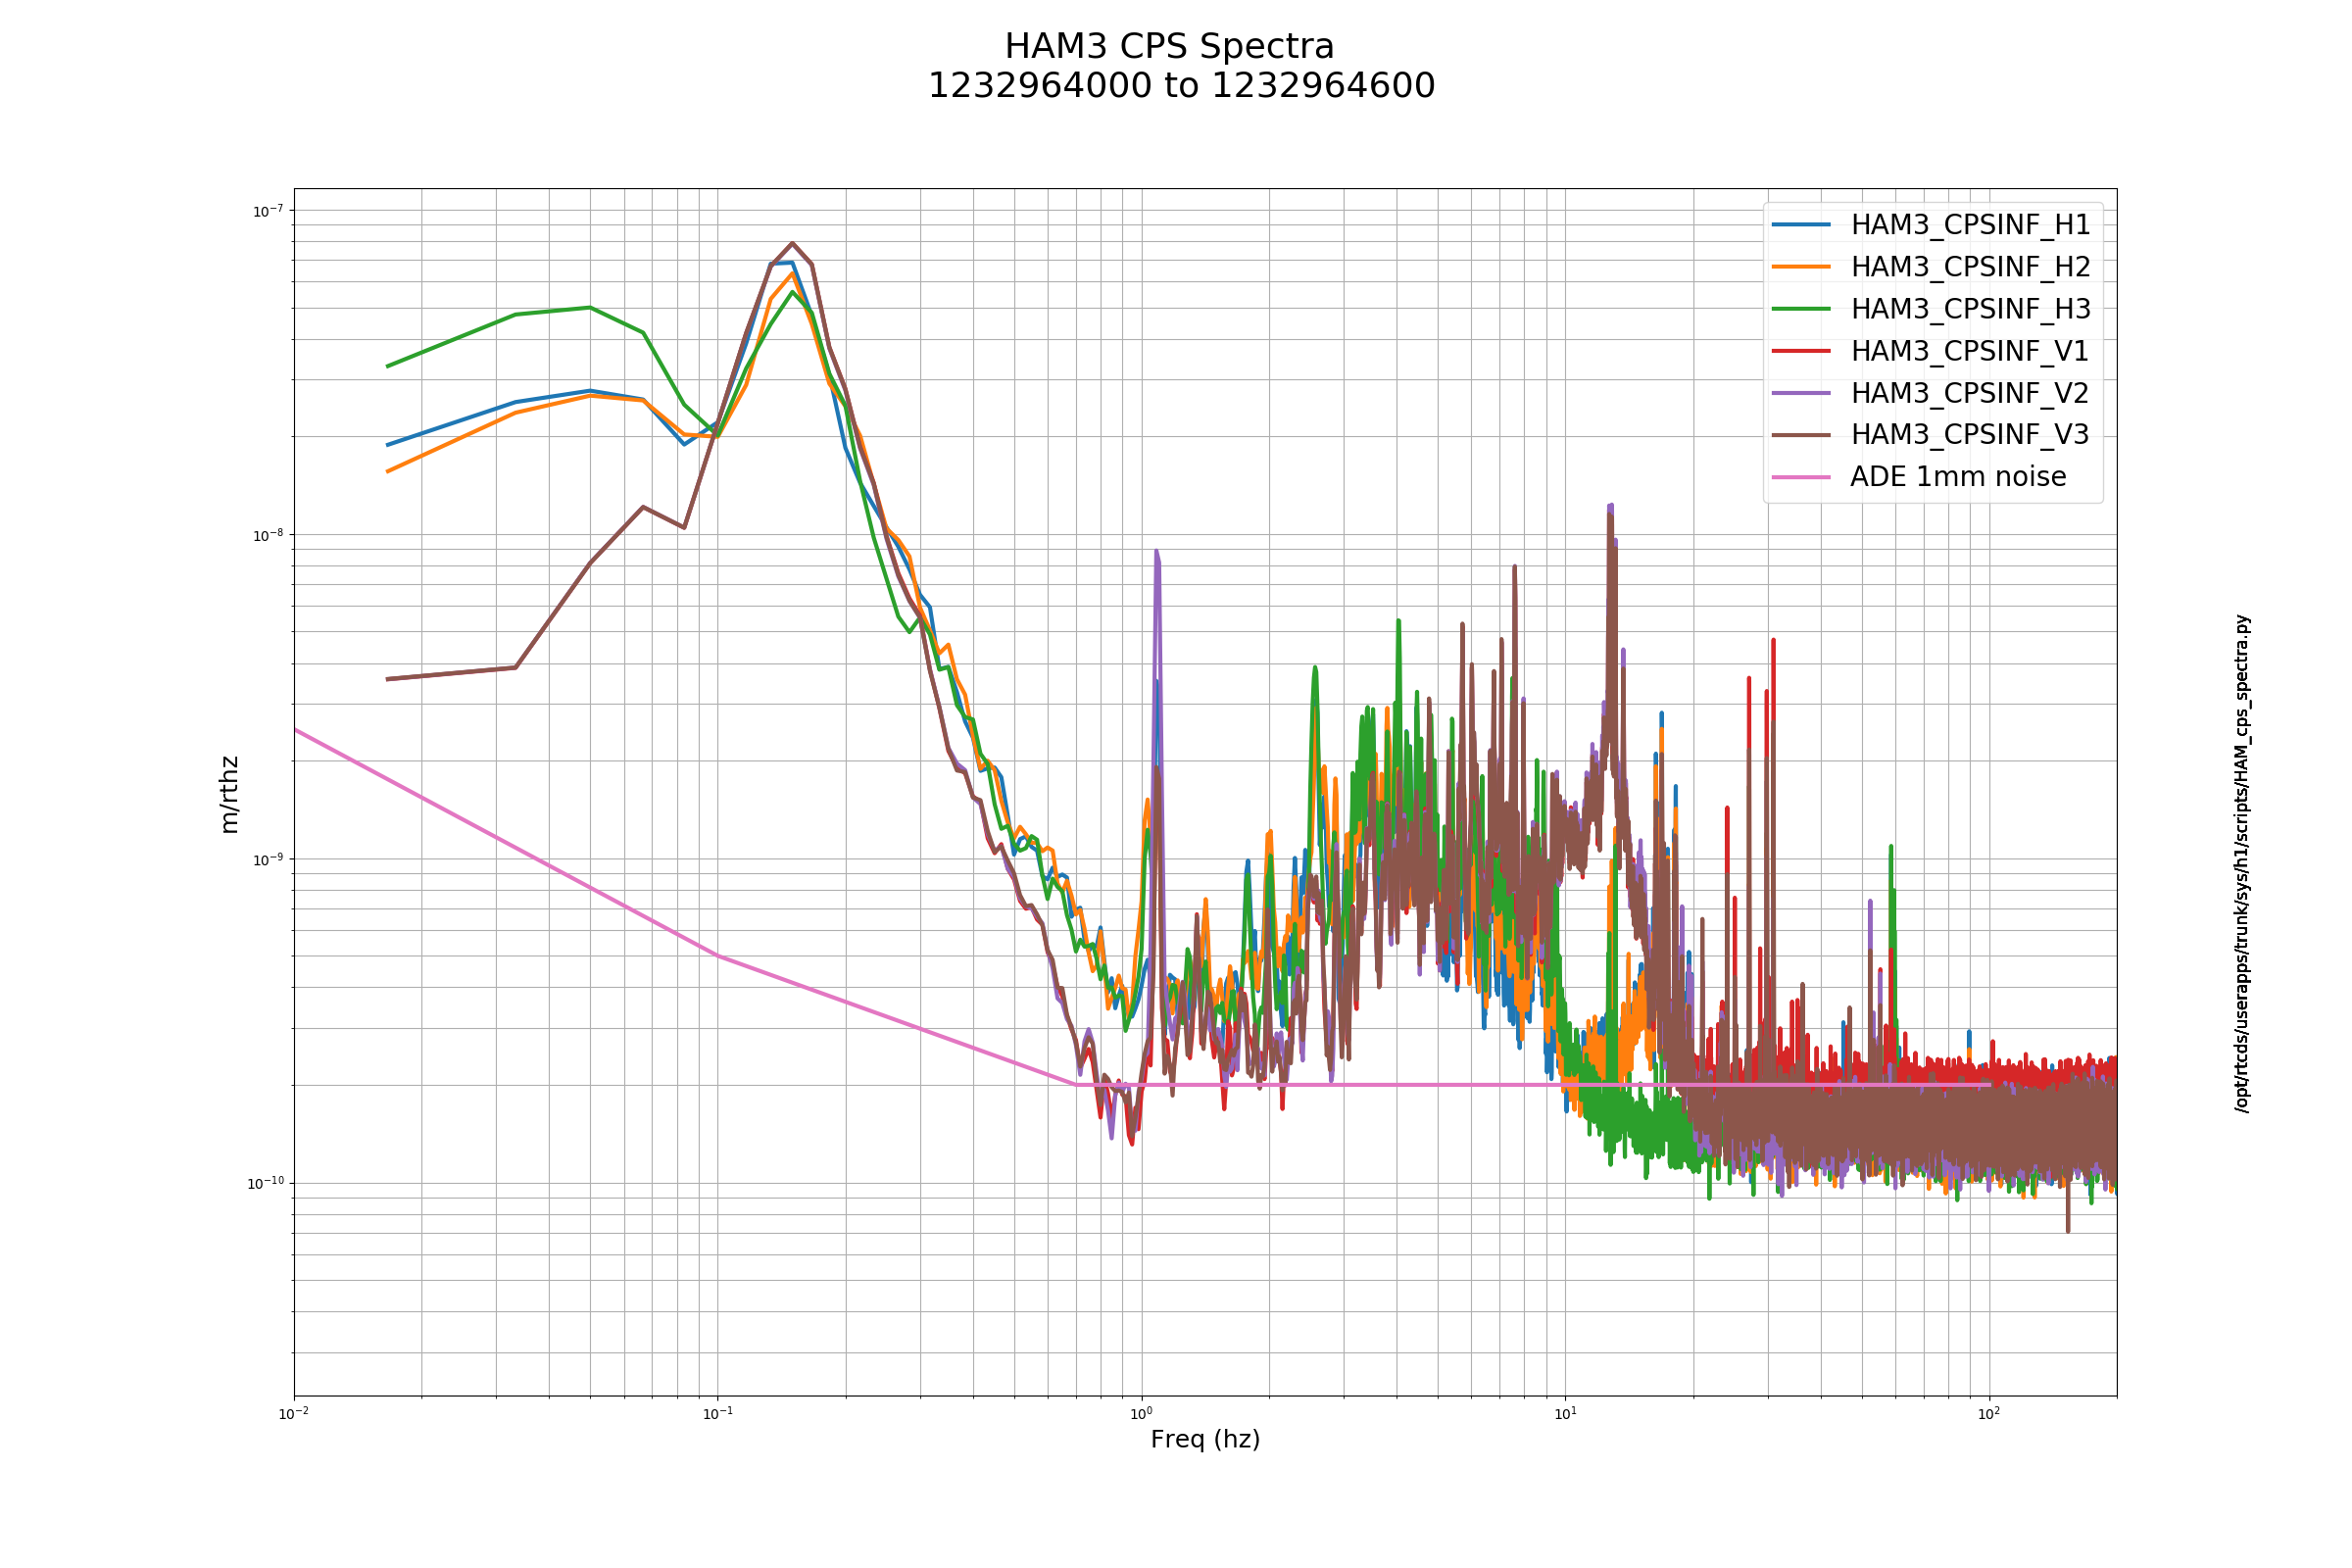
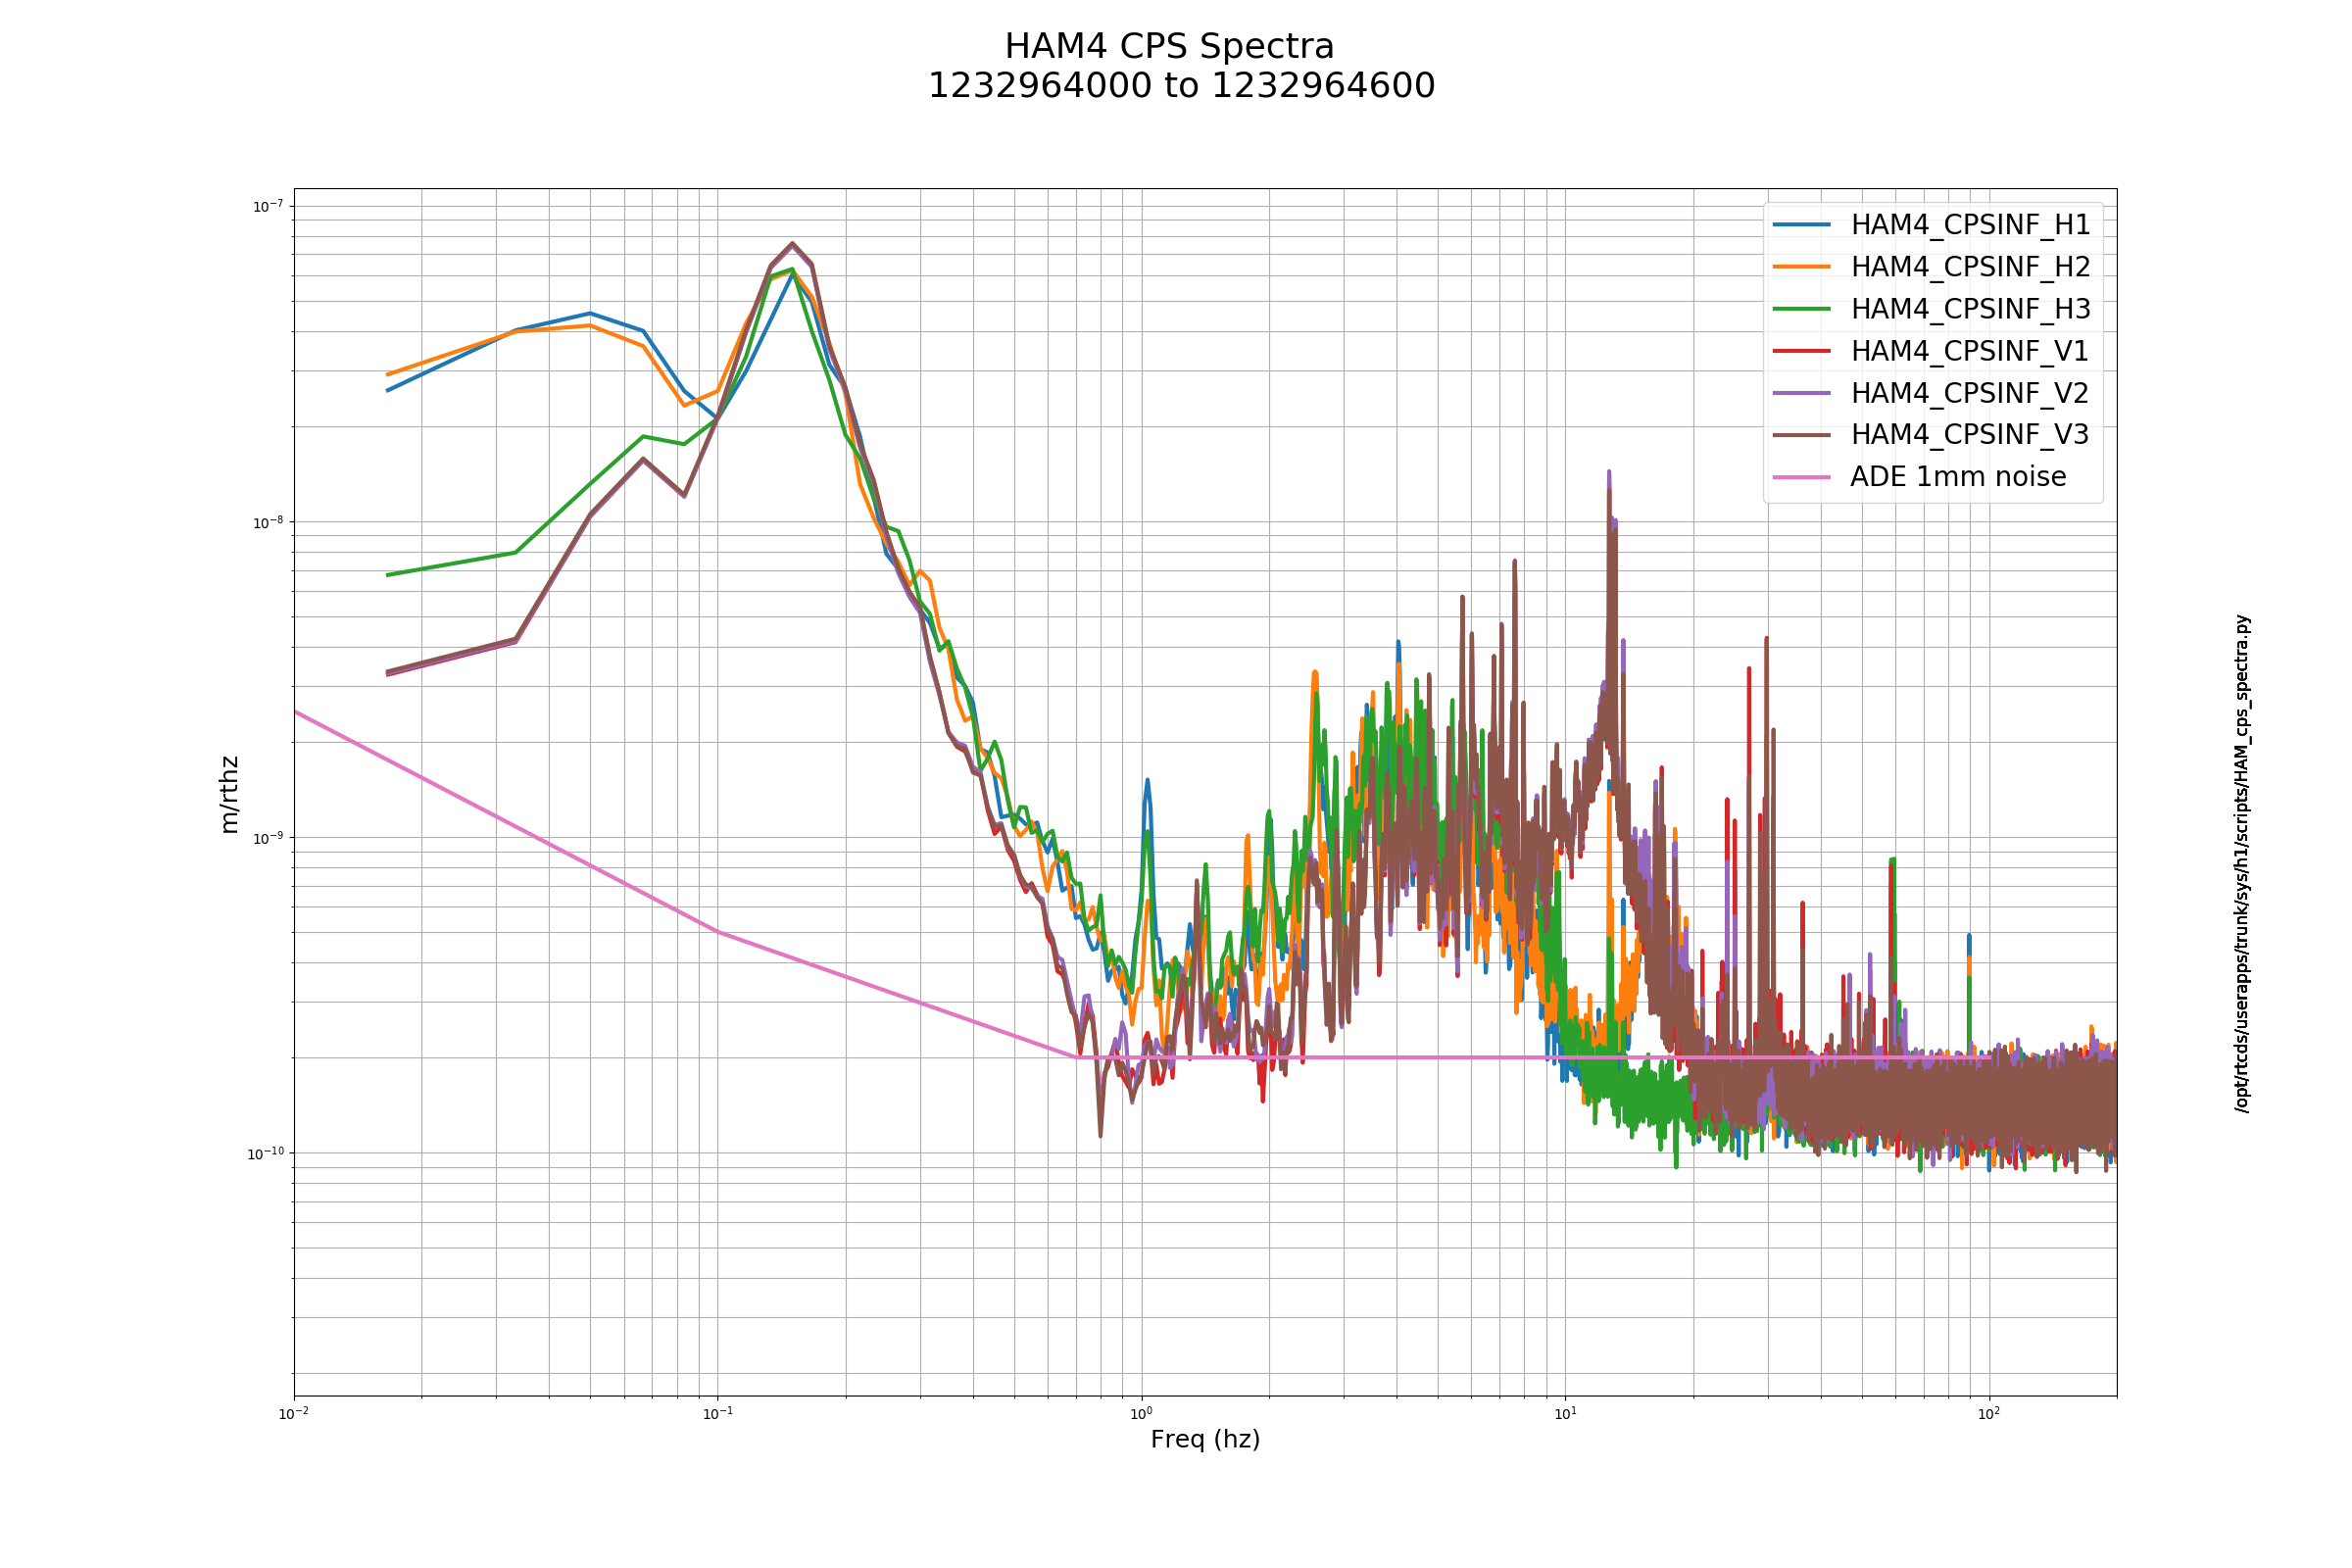
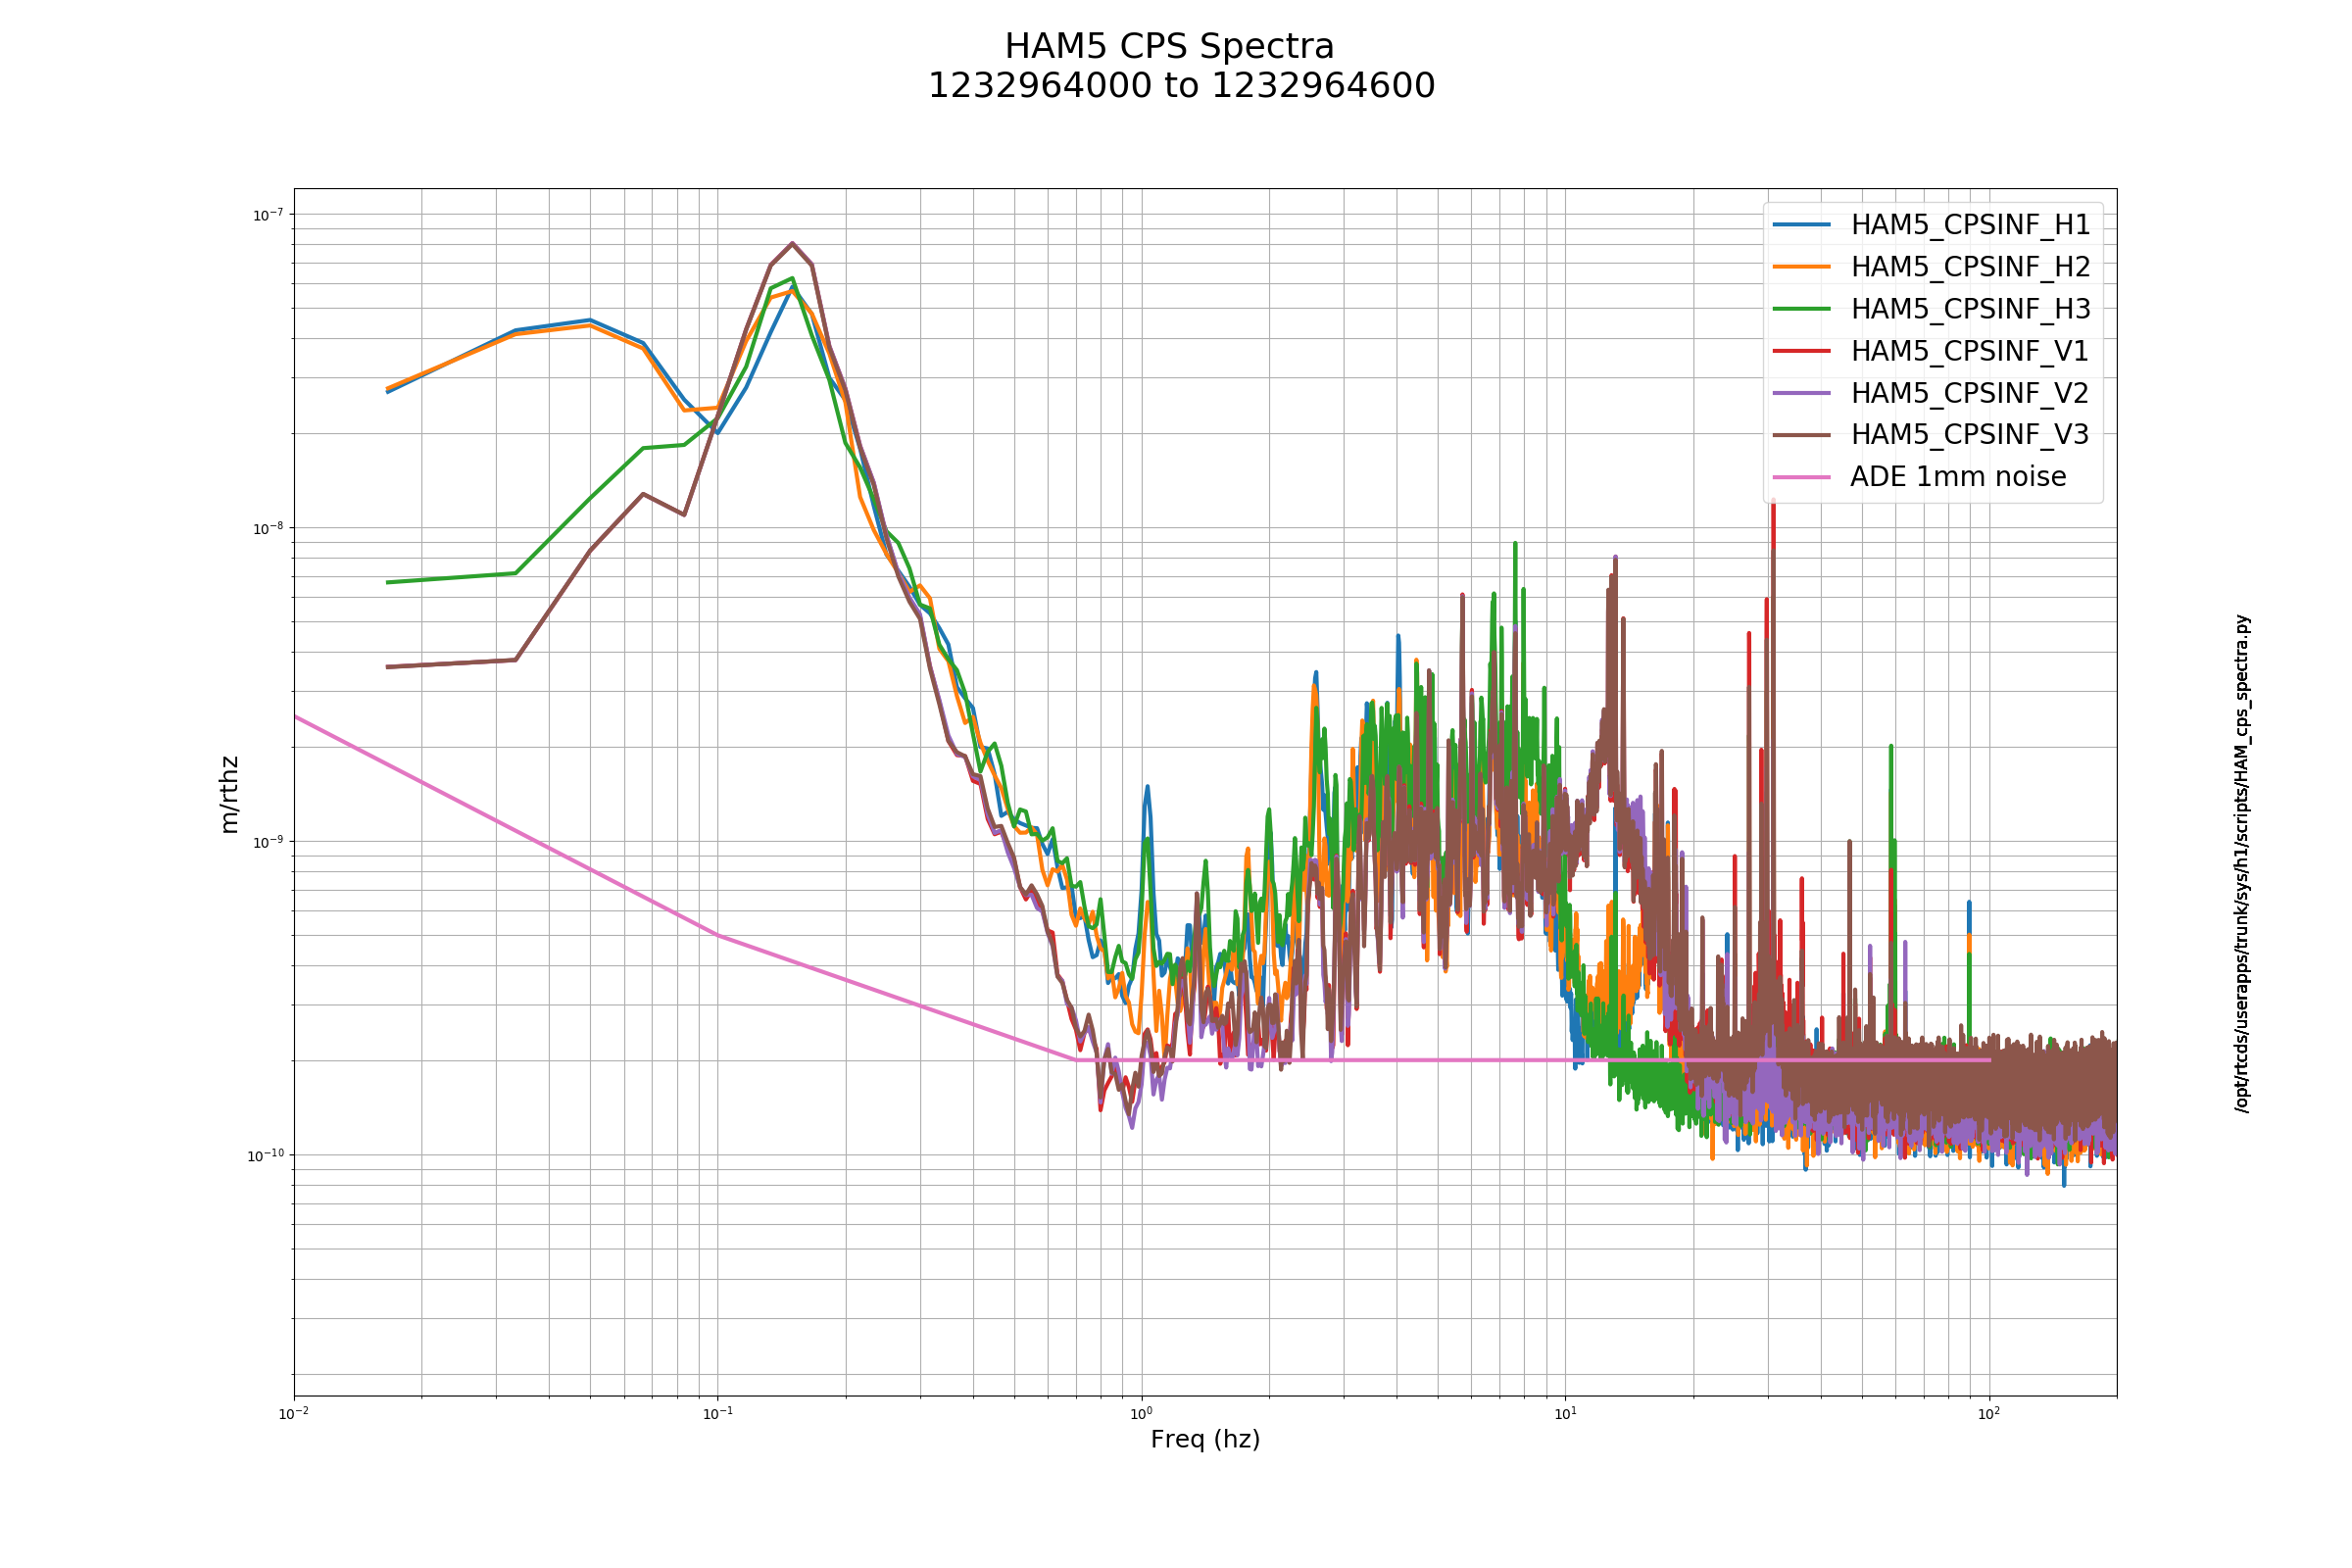
edmond.merilh@LIGO.ORG - posted 10:00, Thursday 31 January 2019 (46721)
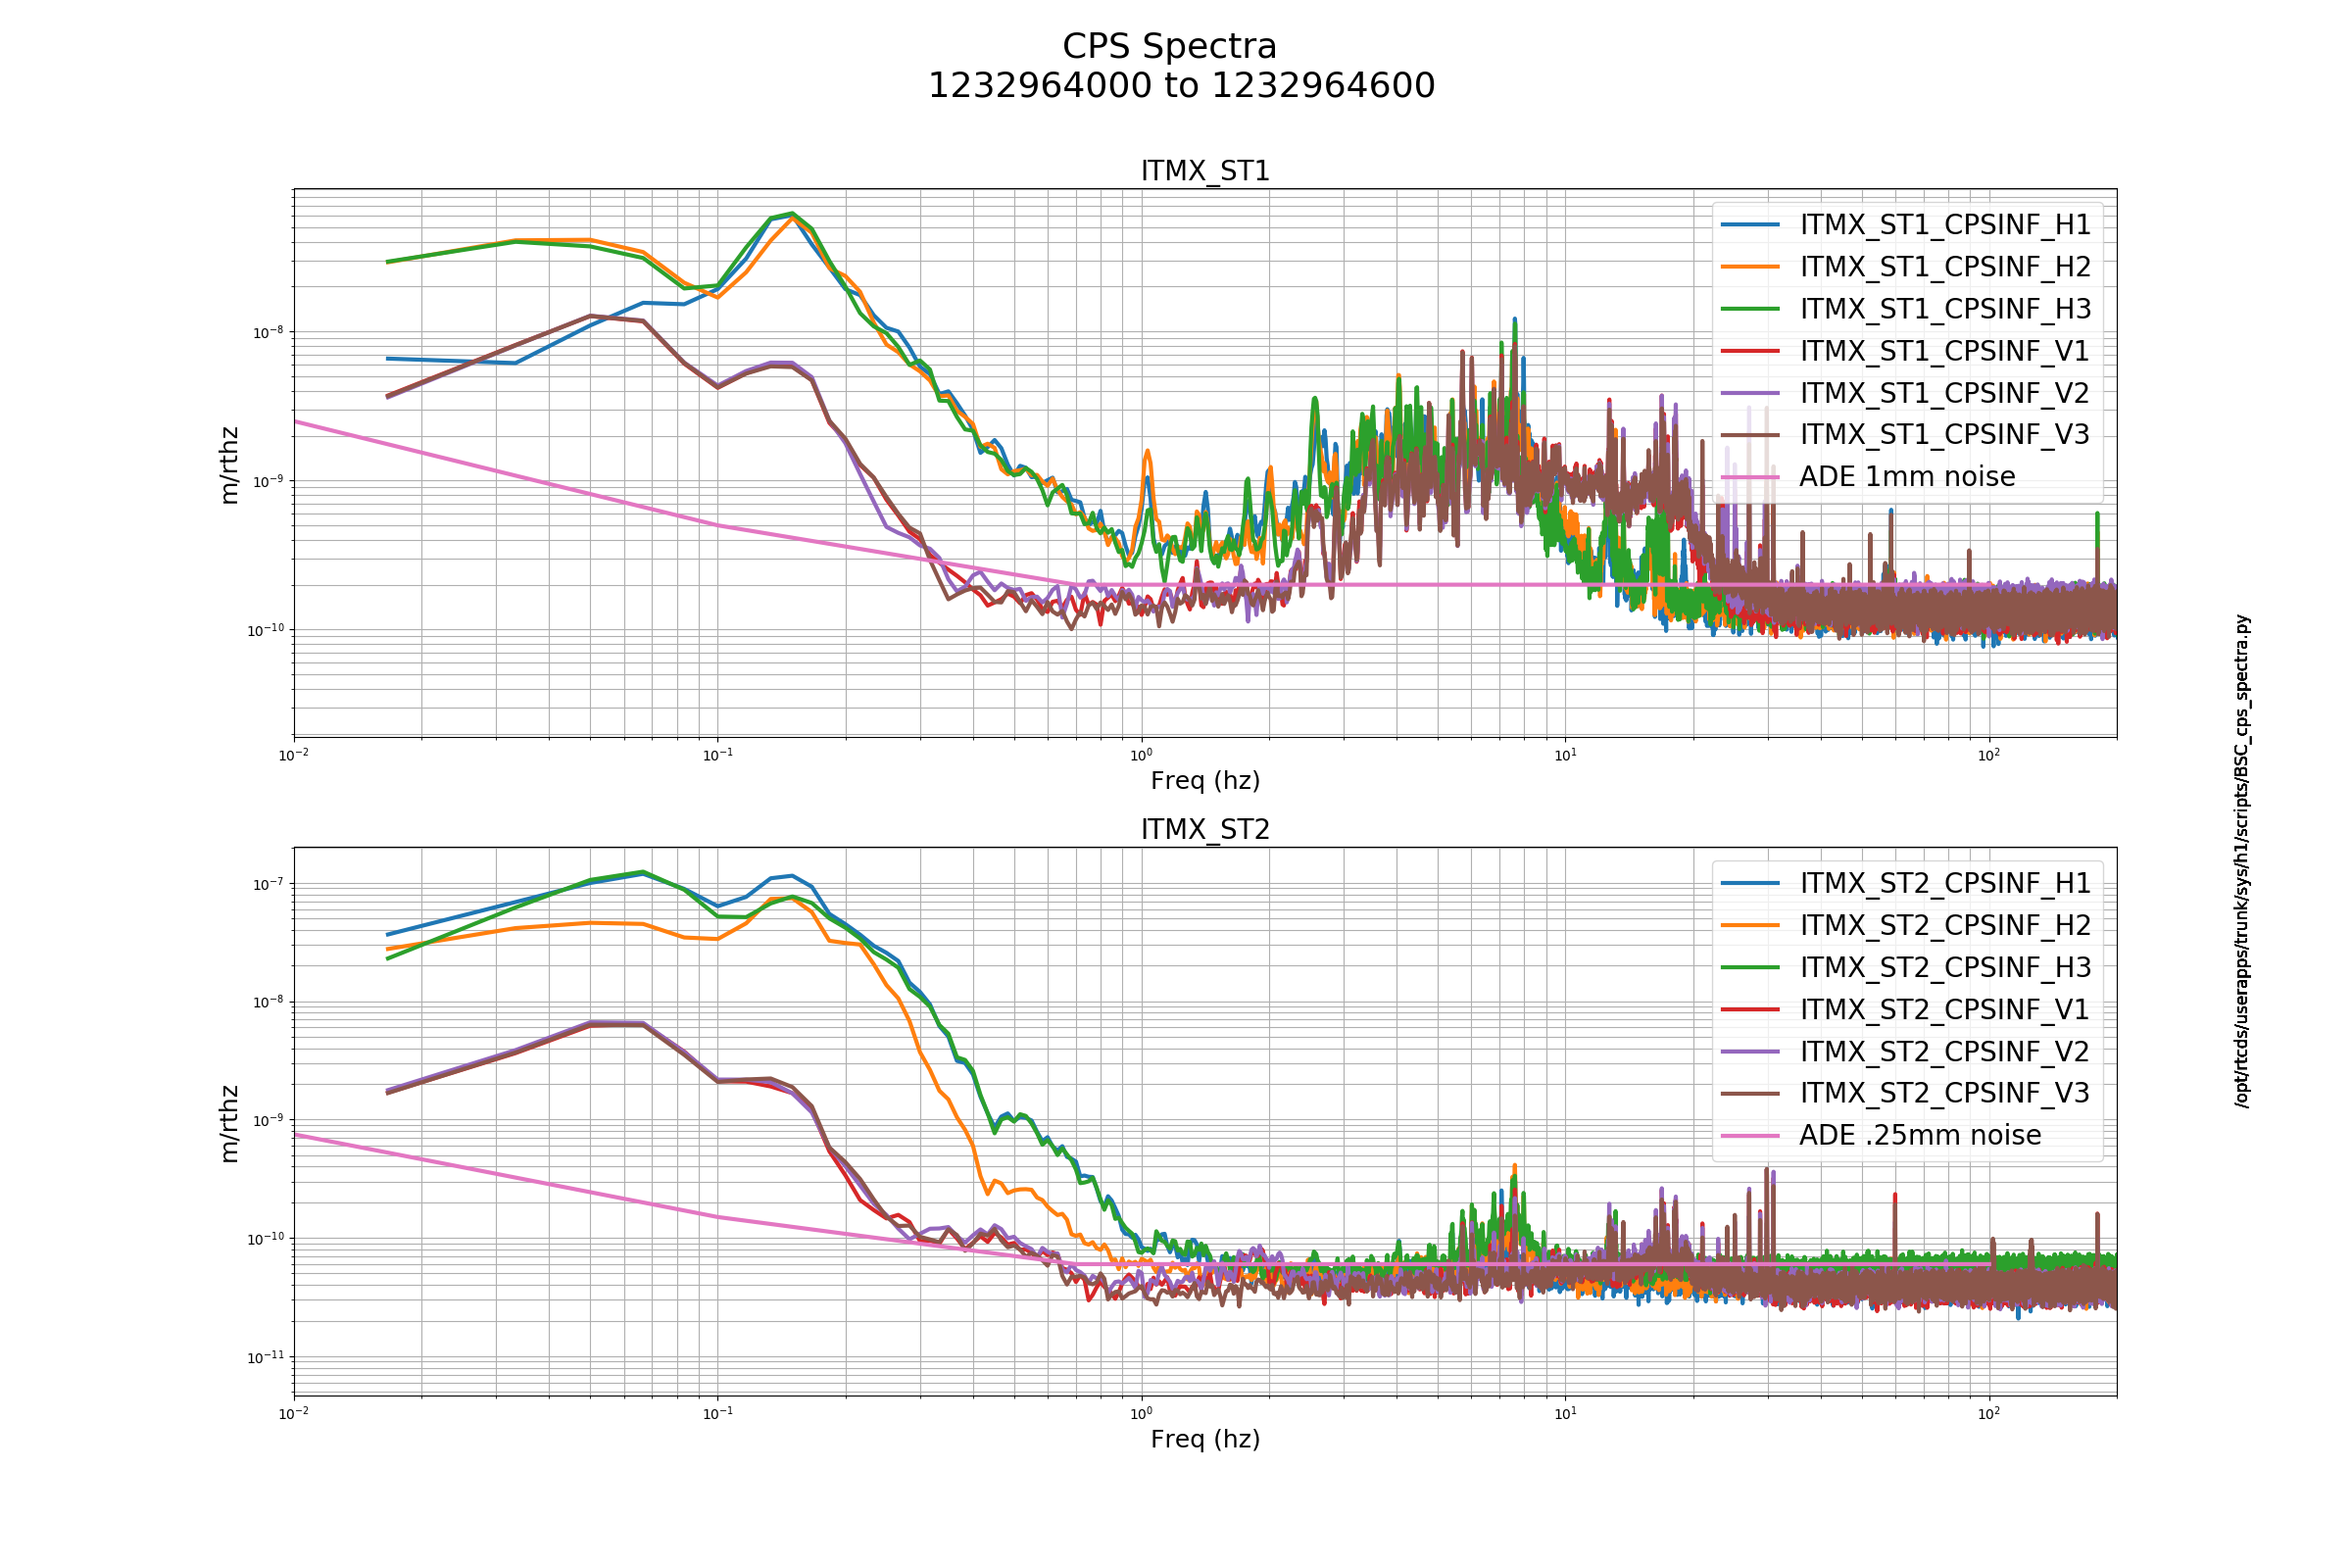
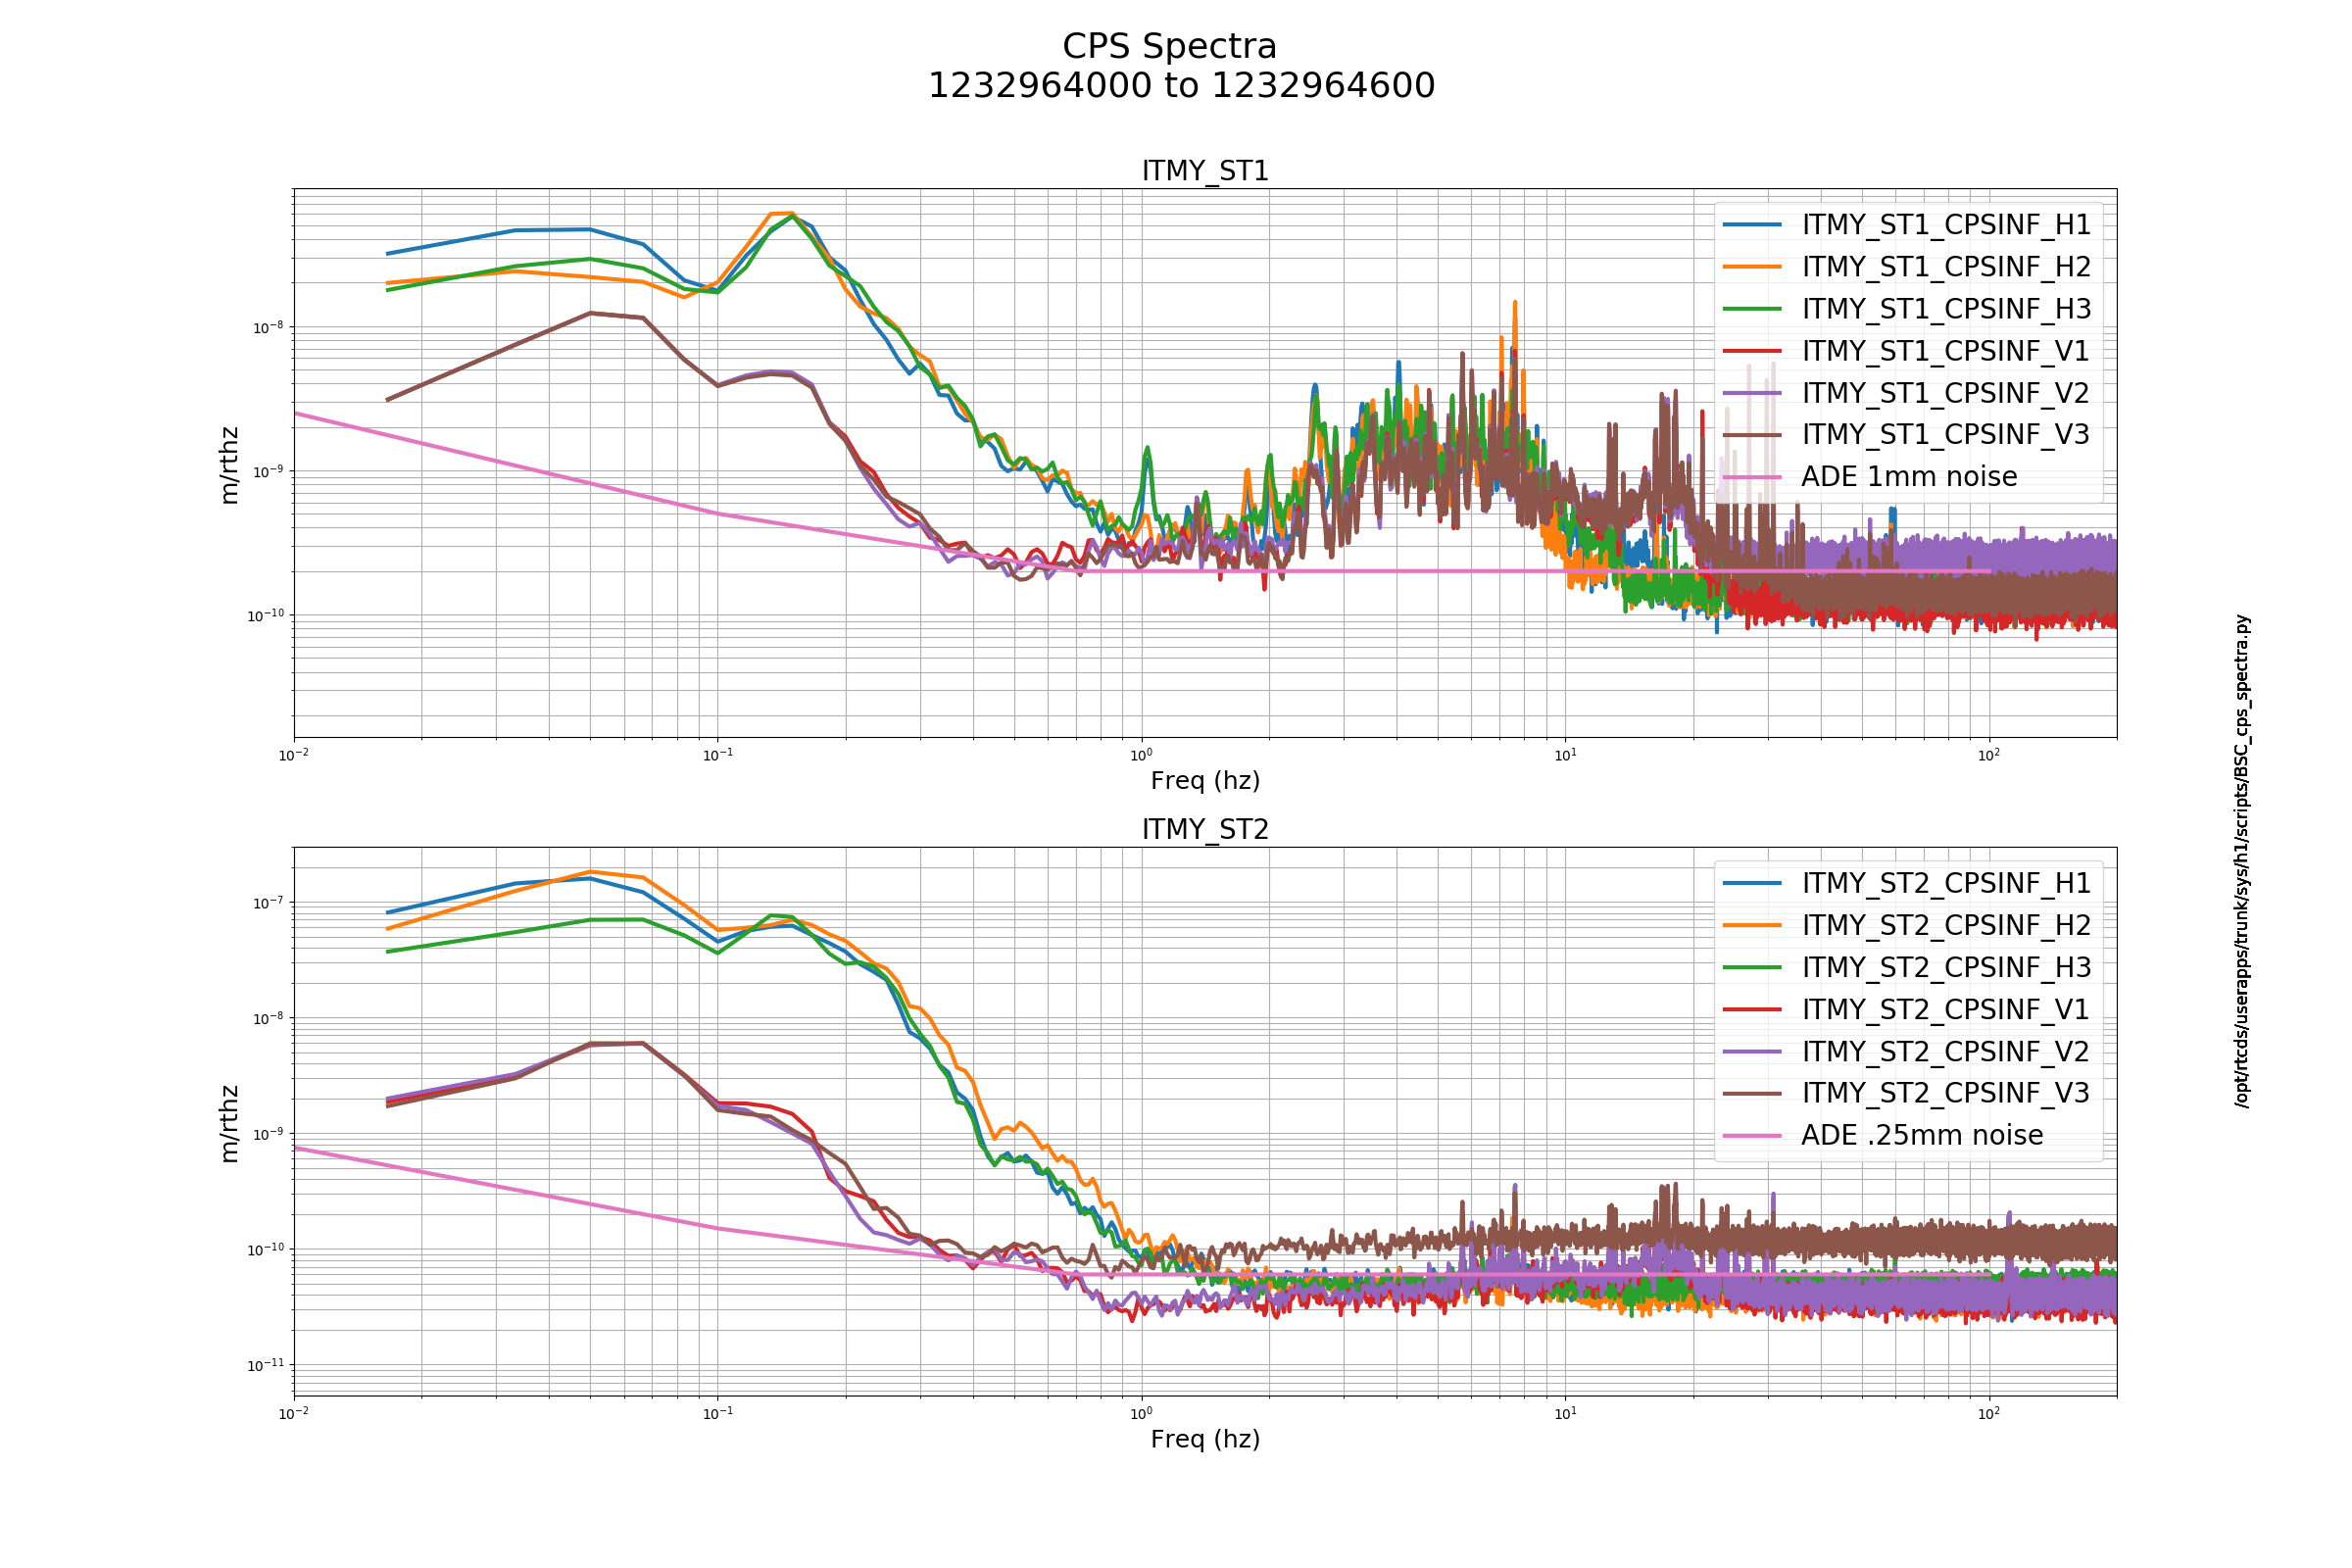
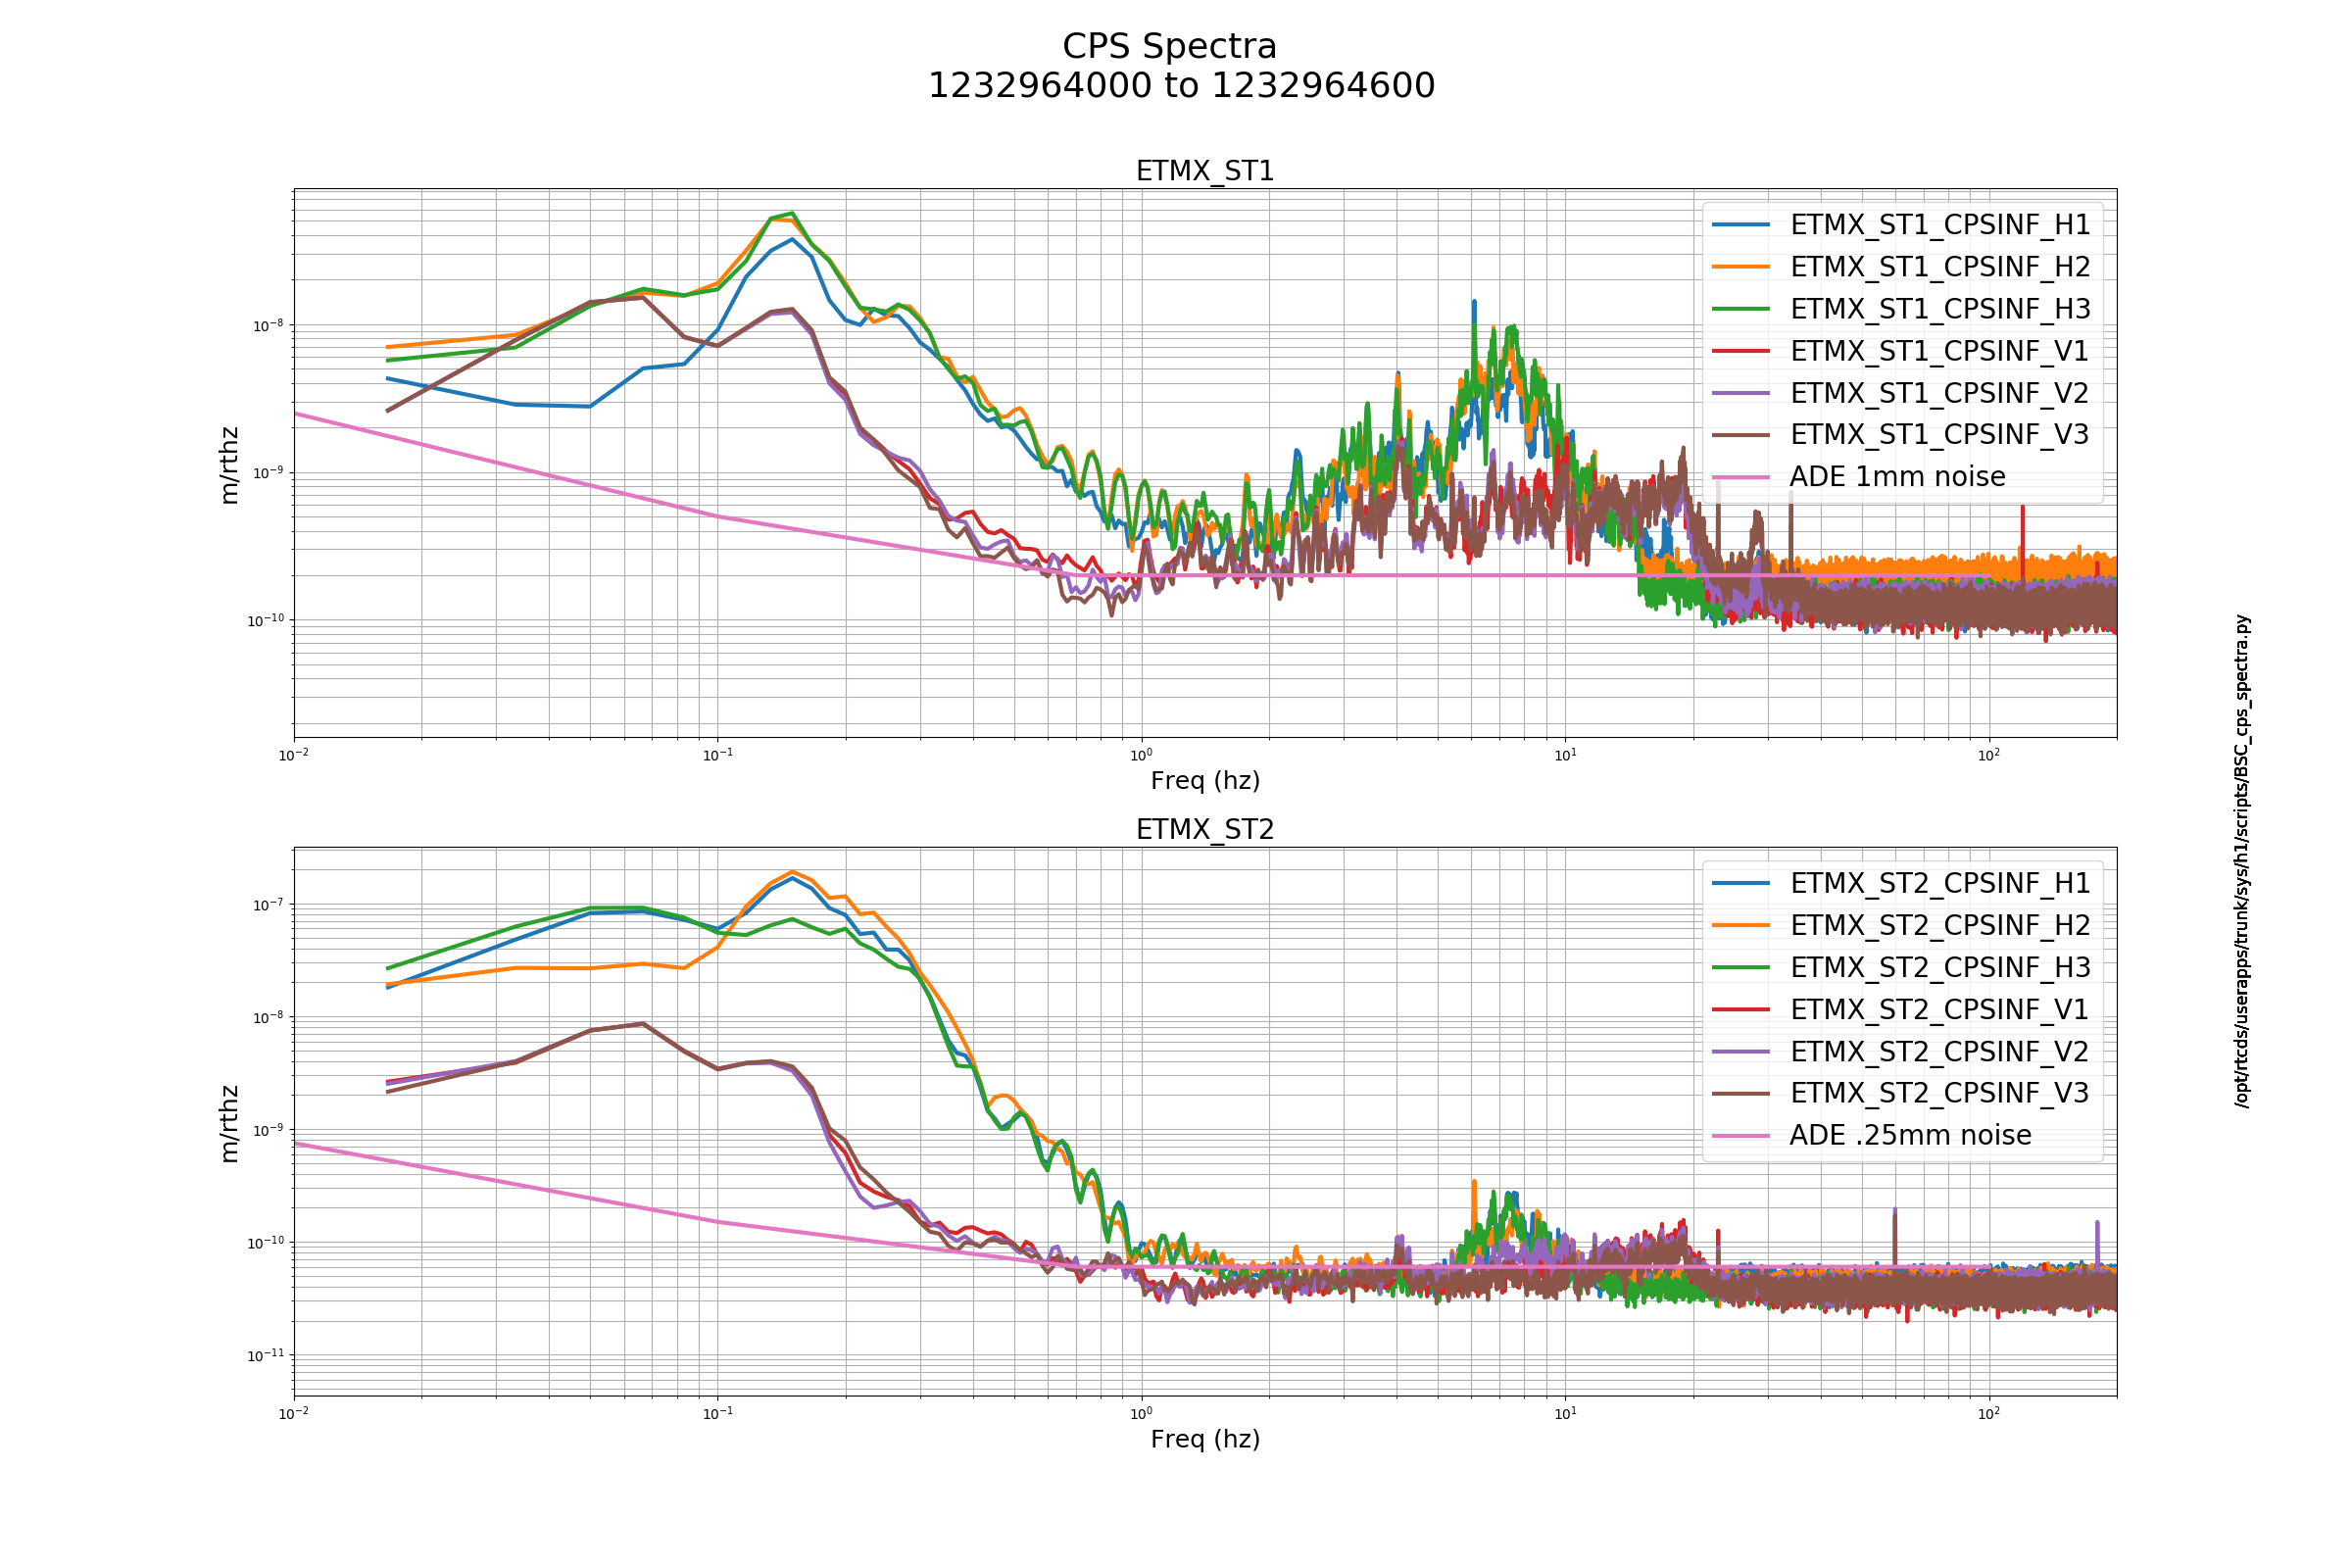
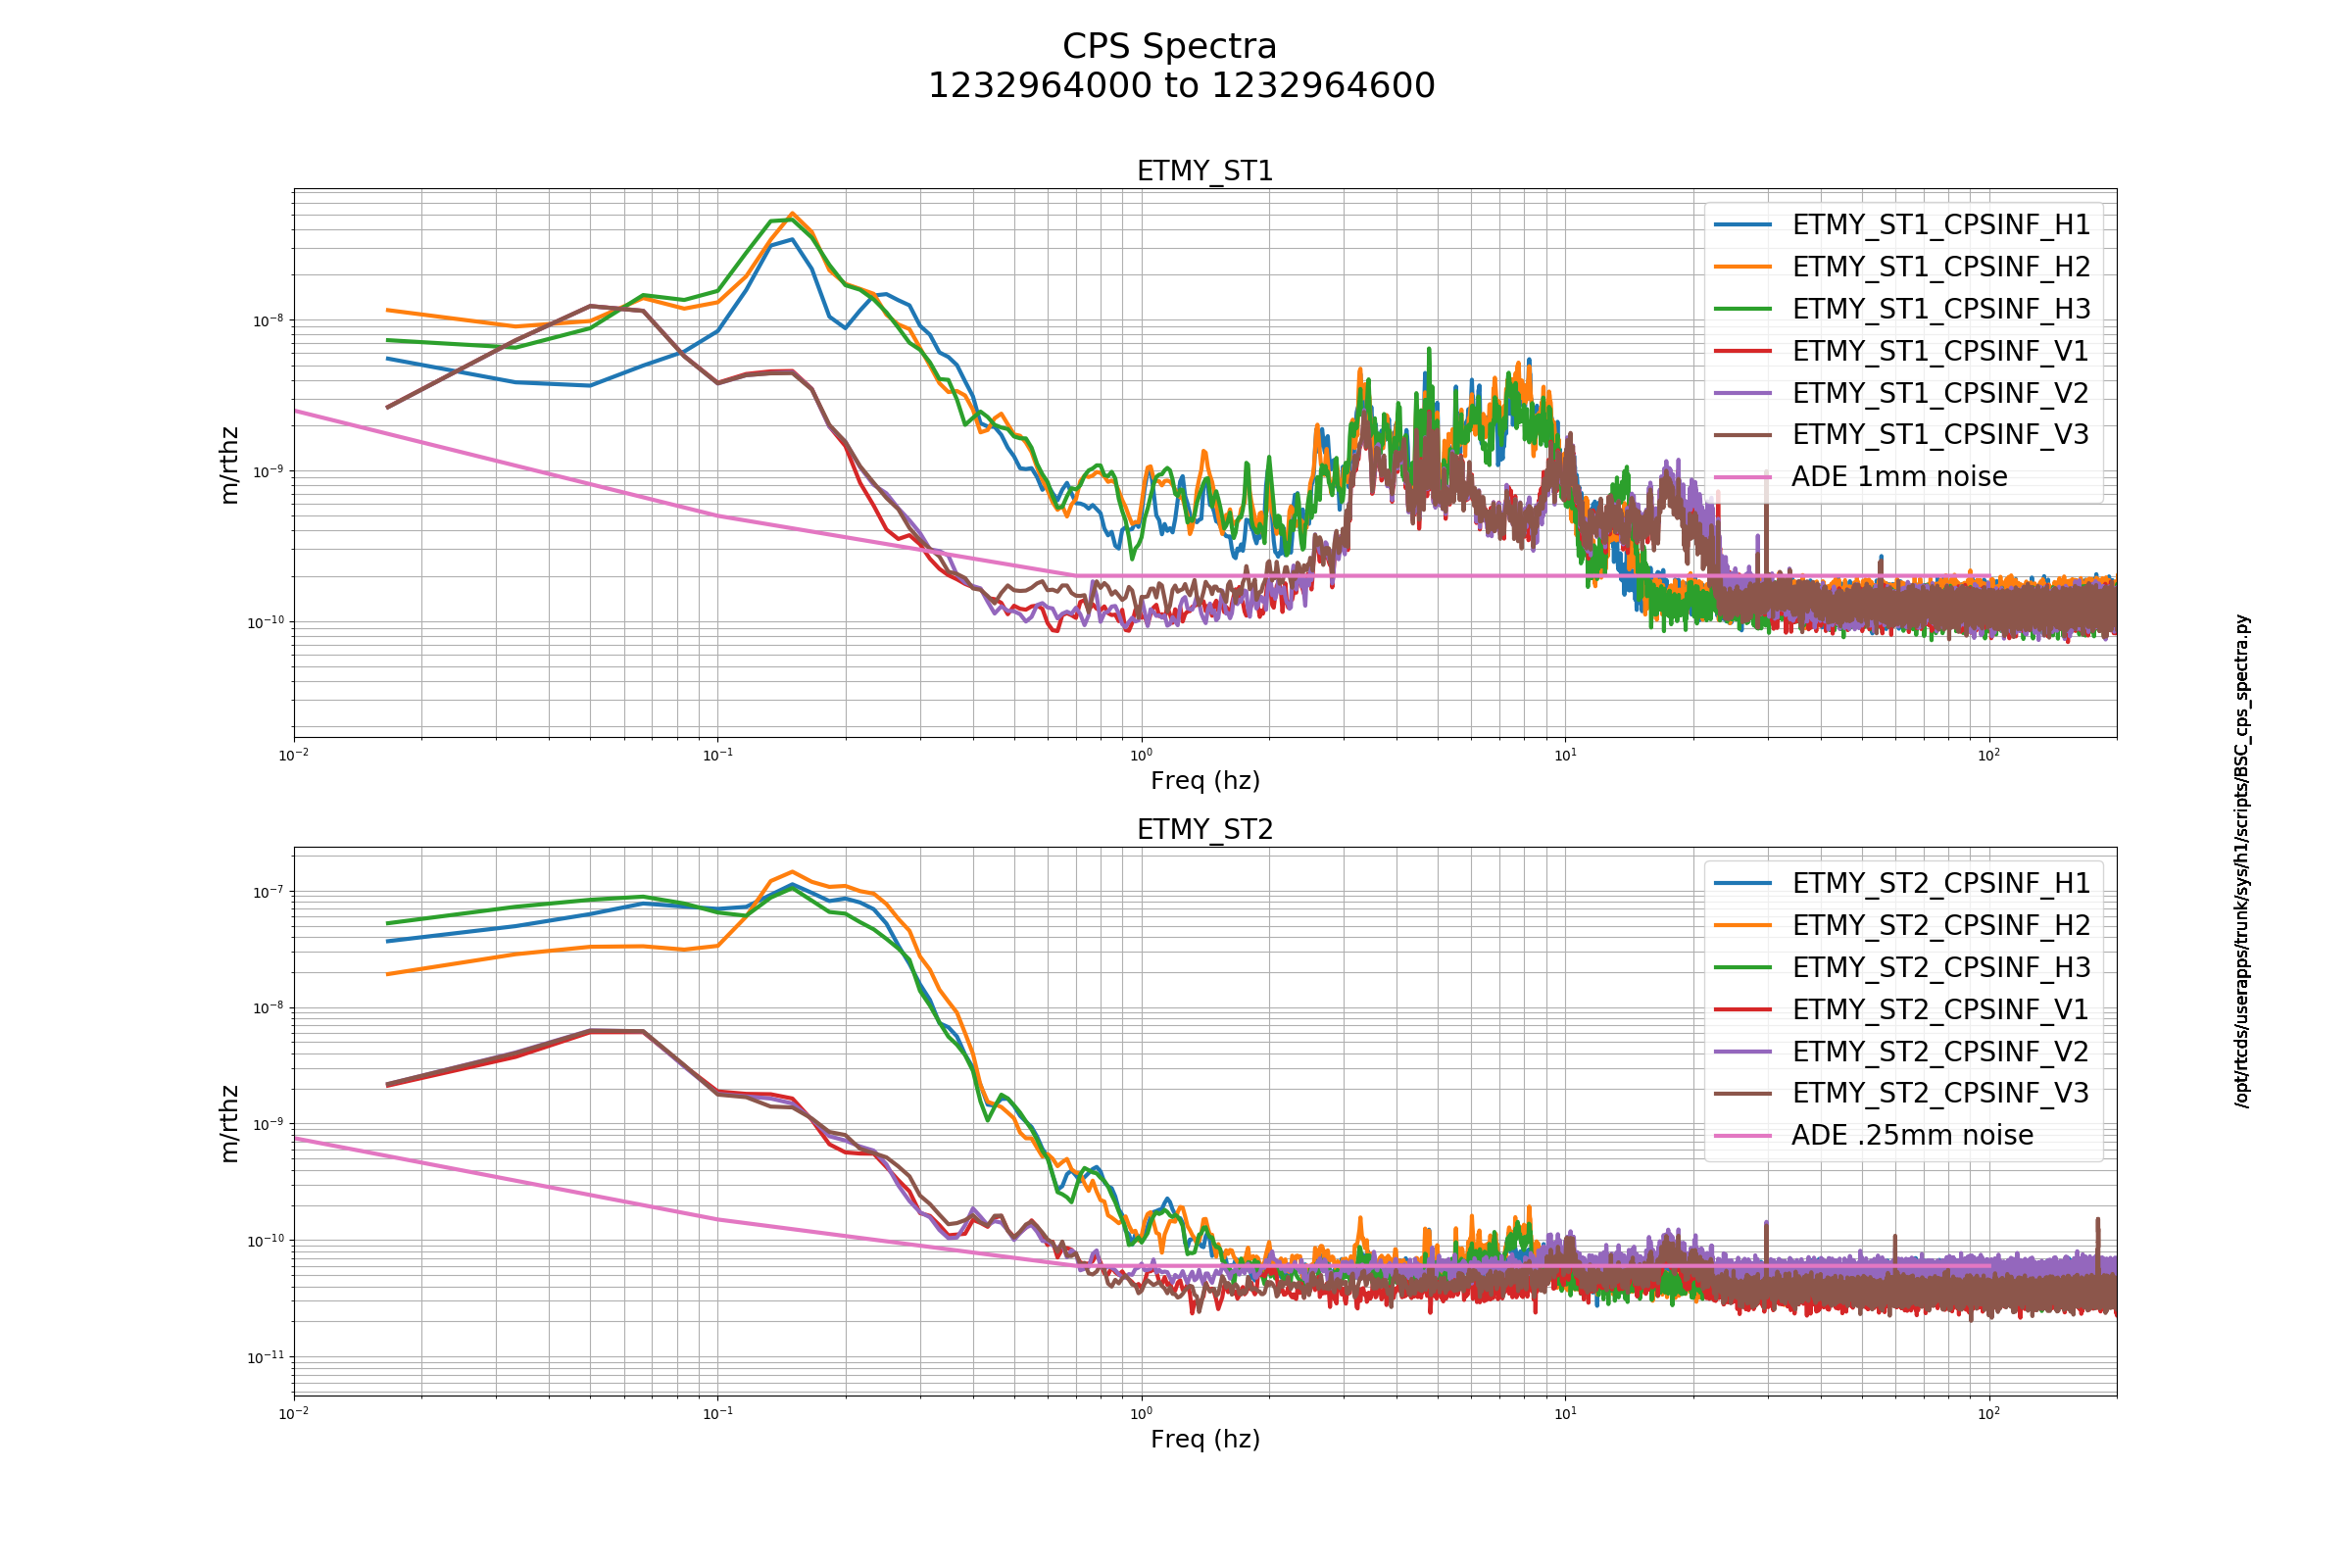
H1 ISI CPS Sensor Noise Spectra Check - Weekly FAMIS #8089

All plots seem to be nominally ok.

Images attached to this report
H1 AOS
edmond.merilh@LIGO.ORG - posted 08:11, Thursday 31 January 2019 (46718)
Shift Transition - Day

TITLE: 01/31 Day Shift: 16:00-00:00 UTC (08:00-16:00 PST), all times posted in UTC
STATE of H1: Commissioning
OUTGOING OPERATOR: None
CURRENT ENVIRONMENT:
    Wind: 3mph Gusts, 2mph 5min avg
    Primary useism: 0.02 μm/s
    Secondary useism: 0.23 μm/s
QUICK SUMMARY:

Interferometer is unlocked and fundamental violin Mode 1 is rung up rather high. Efforts to dampen will begin shortly.


H1 ISC (ISC)
craig.cahillane@LIGO.ORG - posted 04:10, Thursday 31 January 2019 (46716)
Further DHARD P investigations
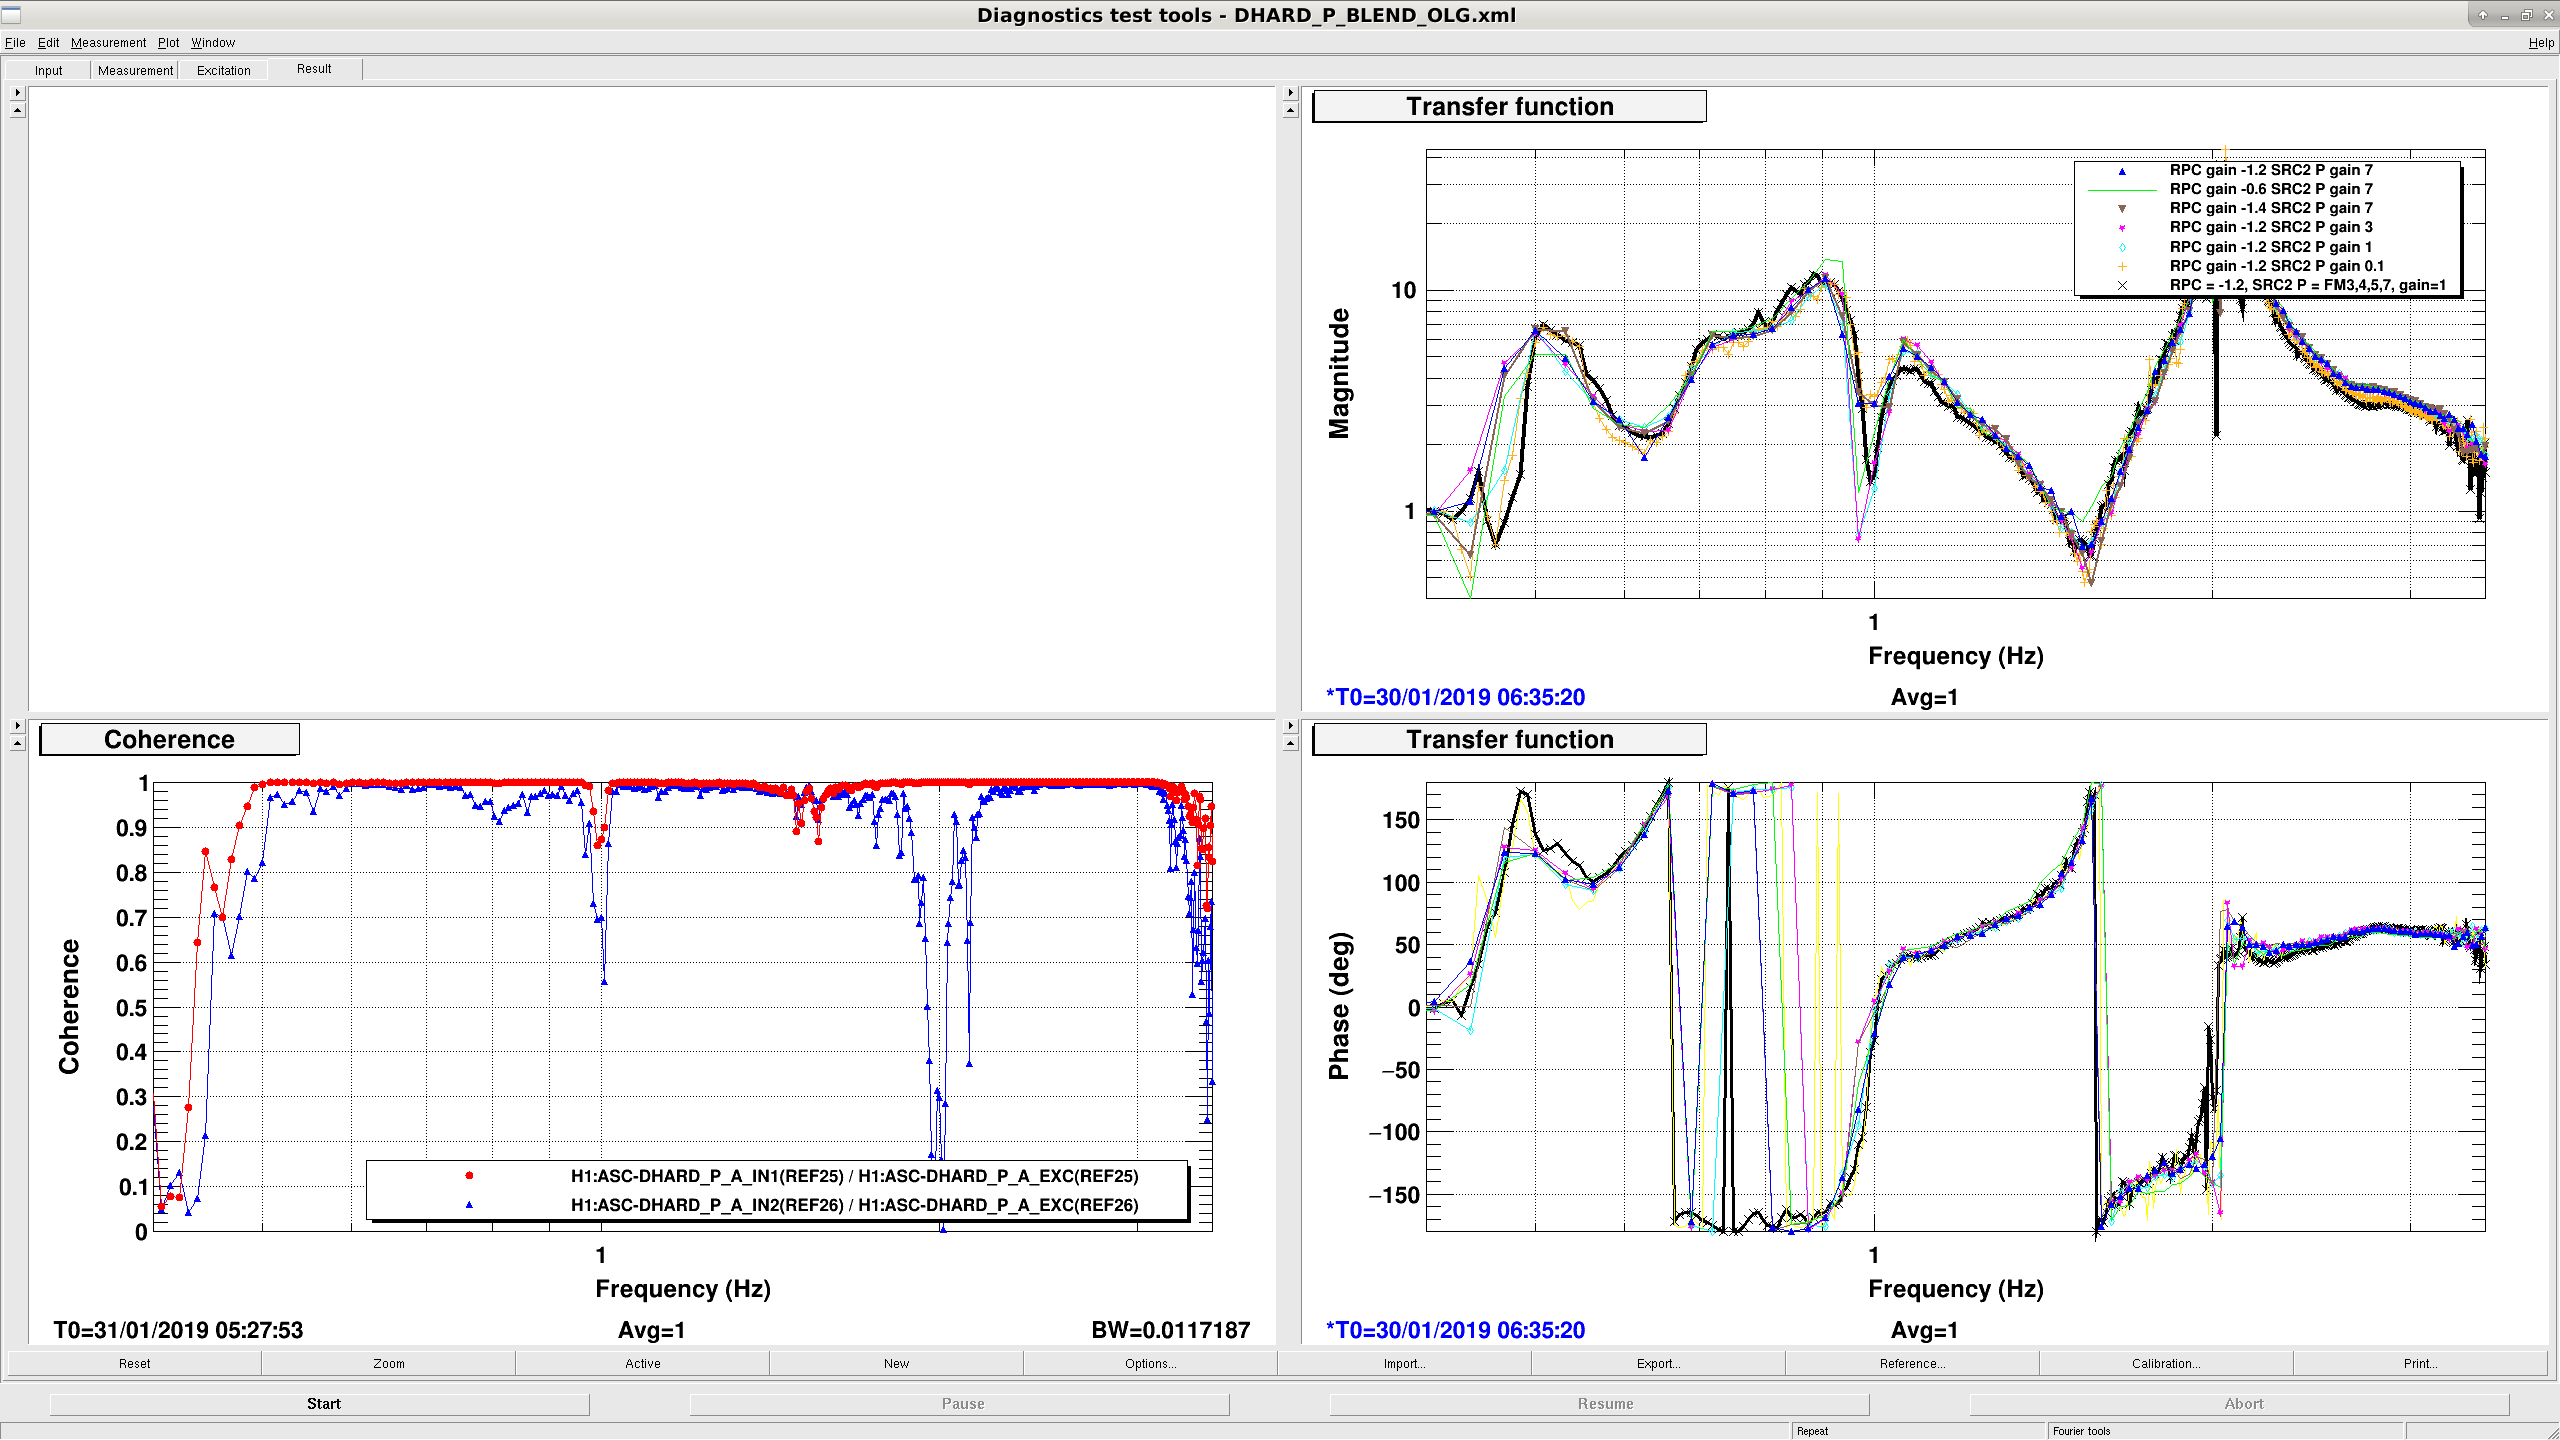
First I tried implementing the changes Sheila suggested for SRC2 P, then remeasured DHARD P with a gain of -60.  The result is the black line in attachment one.

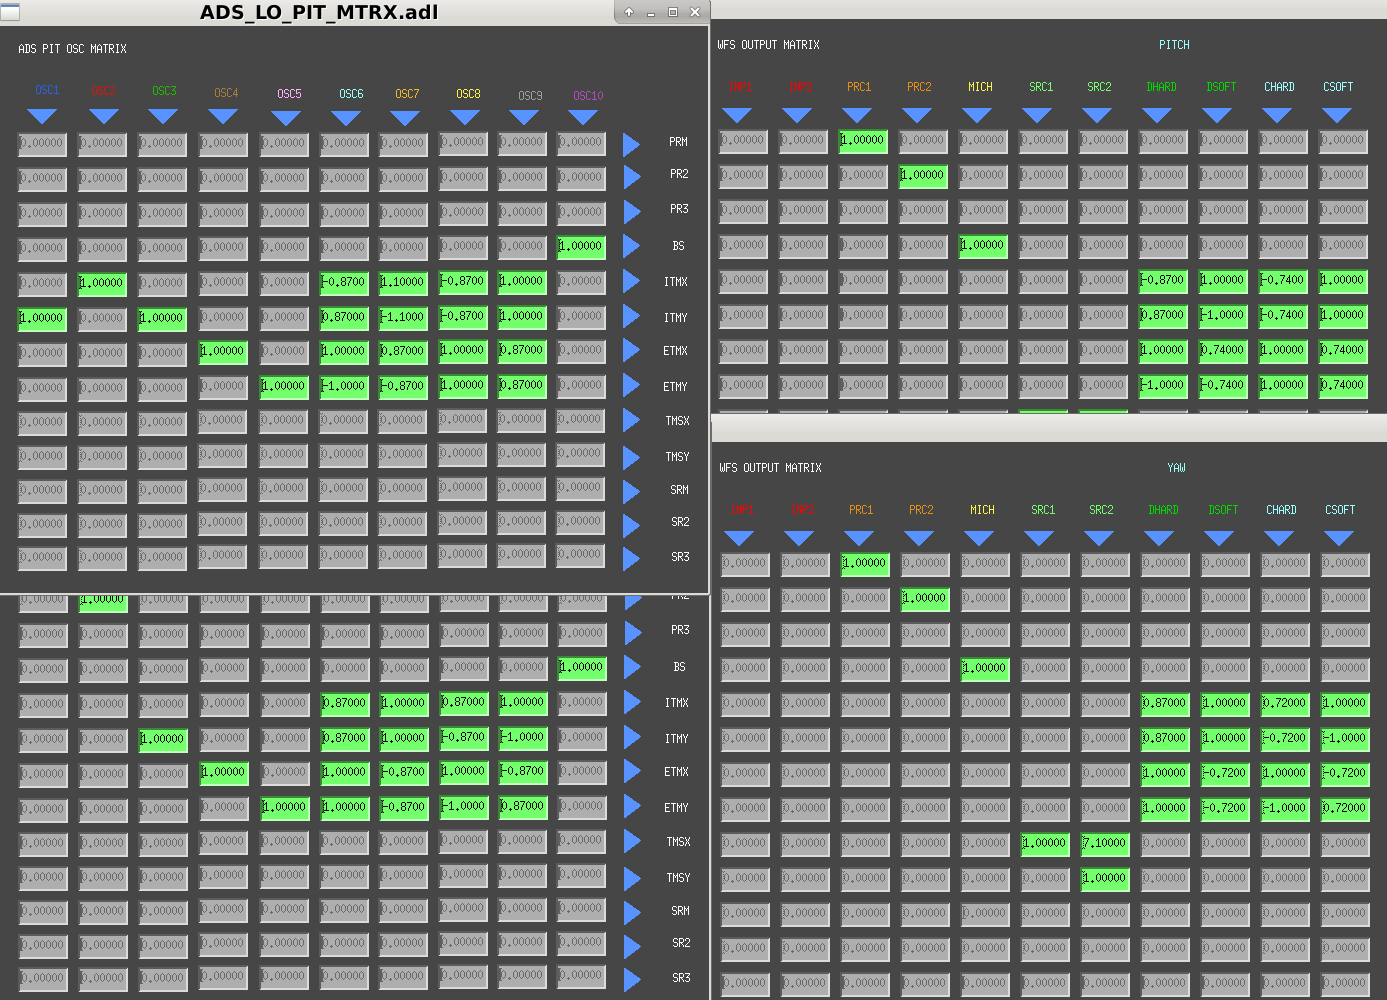
Jenne and Satoshi rebalanced the arm ASC output matrices in alog 46707.  Unfortunately in DARM_TO_RF we hardcoded the old DHARD outrix (attachment two), and this is likely how we've been operating ever since Wednesday morning.  I was able to change the outrix in lock no problem.  I lost lock when trying to redo the DHARD P measurement from before, but from the one average I got it seems like this did not make a difference to our 1 Hz DHARD P gain margin.

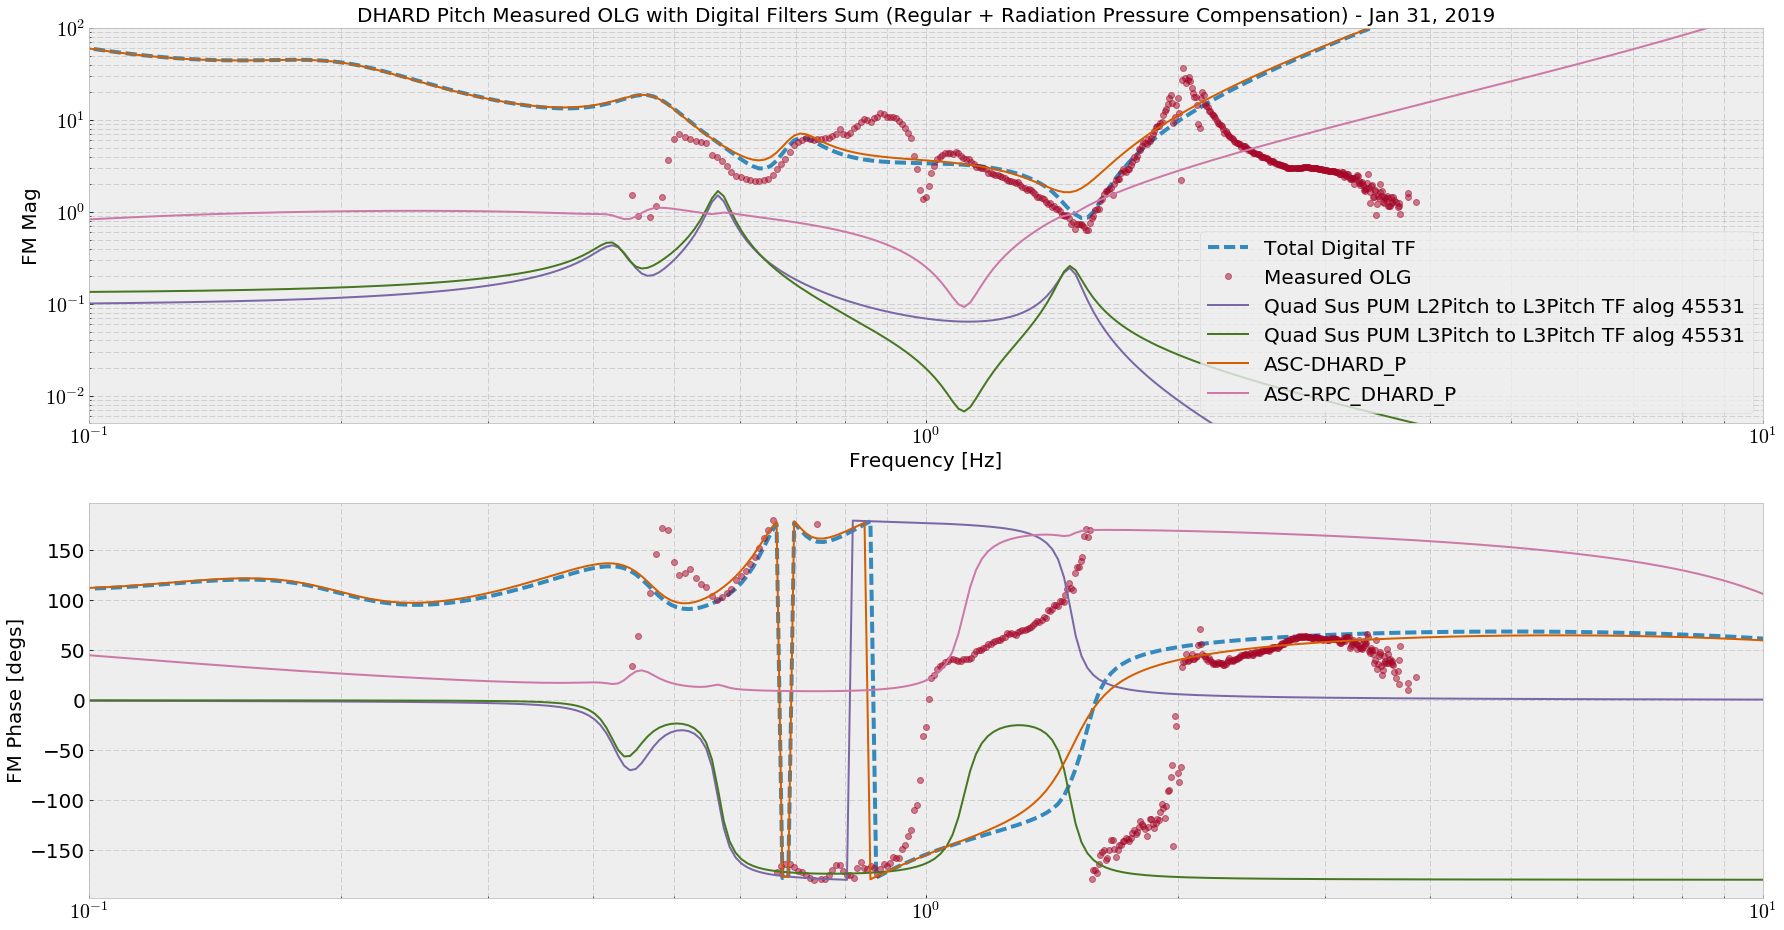
I spent some time gathering TFs related to the DHARD P loop to try and figure out who is the most relevant culprit is at 1 Hz.  This arose from a suspicion about the radiation pressure compensation and regular filters sum, but this cannot be the issue since the RPC digital filters barely affect us with -60 gain on the regular filters.
Attachment three shows the ASC-DHARD_P and ASC-RPC_DHARD_P filters, alongside the measured OLG I took, and a quad sus L2Pitch->L3Pitch TF and L3Pitch->L3Pitch TF stolen from Hang.
The OLG is well-colored by the total digital filter TF, except around 1 Hz.

------------------------------------------------------------------------------------------------------------------------------------------

Twice this evening I lost lock in POWER_30W, and when the IFO went down the IMC could not relock itself.  It just went to from LOCKED->DOWN->ACQUIRE and continually failed to acquire for up to twenty minutes.  This only happens when the IMC is super calm, so I added an automatic toggling of the MC2 M1 L2L DriveAlign offset every 15 seconds in the IMC_LOCK guardian.  Not clear if this helped, but probably did not hurt.

Damped ITMX Mode 2.  Rotated +60 degrees from where the guardian put it.  The violin modes guardian does not tolerate dissent, so I had to pause it.
- The mode bounced back and killed the lock.  I tried damping it for about an hour with no success.
- In the next lock I just reduced the gain from -5 to -1 with the same phase (-60 degs), this seems to have helped, but the mode is damping at a glacial pace...

Images attached to this report
H1 SQZ (ISC)
rich.abbott@LIGO.ORG - posted 20:23, Wednesday 30 January 2019 - last comment - 21:39, Wednesday 30 January 2019(46714)
Phase Noise Analysis of 203.125MHz CLF VCO
Calum, Daniel, Rich

An analysis was made of the phase noise content of the VCO serving the as Squeezer CLF actuator.  A comparison is included below of the VCO nominal parameters from E1700010.  Attached is a plot of the single sideband phase noise.

Specification
10Hz -110dBc
100Hz -140dBc
1kHz -160dBc
10kHz -165dBc

Measured
10Hz (not measured)
100Hz -132dBc
1kHz -145dBc
10kHz -160dBc

As can be seen from the measured vs the specification, the noise is a bit higher than expected.  This is still far below the measured CLF noise, but needed to be checked.  The data was compensated for the fact that 2 identical oscillators were beat together during the measurement (3dB correction), and compensated for single sideband (3dB correction).  During the course of the measurement, the slope of the phase detecting mixer was determined to be 1.1268 volts per radian.
Non-image files attached to this report
Comments related to this report
daniel.sigg@LIGO.ORG - 21:39, Wednesday 30 January 2019 (46715)

Even so the original specs were as above, we later moved to an AT cut crystal to give us more tuning range (see T1800062). This also resulted in a lower phase noise specification:

100 Hz -103 dBc/Hz
1 kHz -133 dBc/Hz
10 kHz -148 dBc/Hz
100 kHz -158 dBc/Hz

H1 ISC
sheila.dwyer@LIGO.ORG - posted 18:38, Wednesday 30 January 2019 (46713)
reducing DHARD P/SRC2P cross coupling

Georgia, Adam, Keita, Marie, Sheila, Jenne

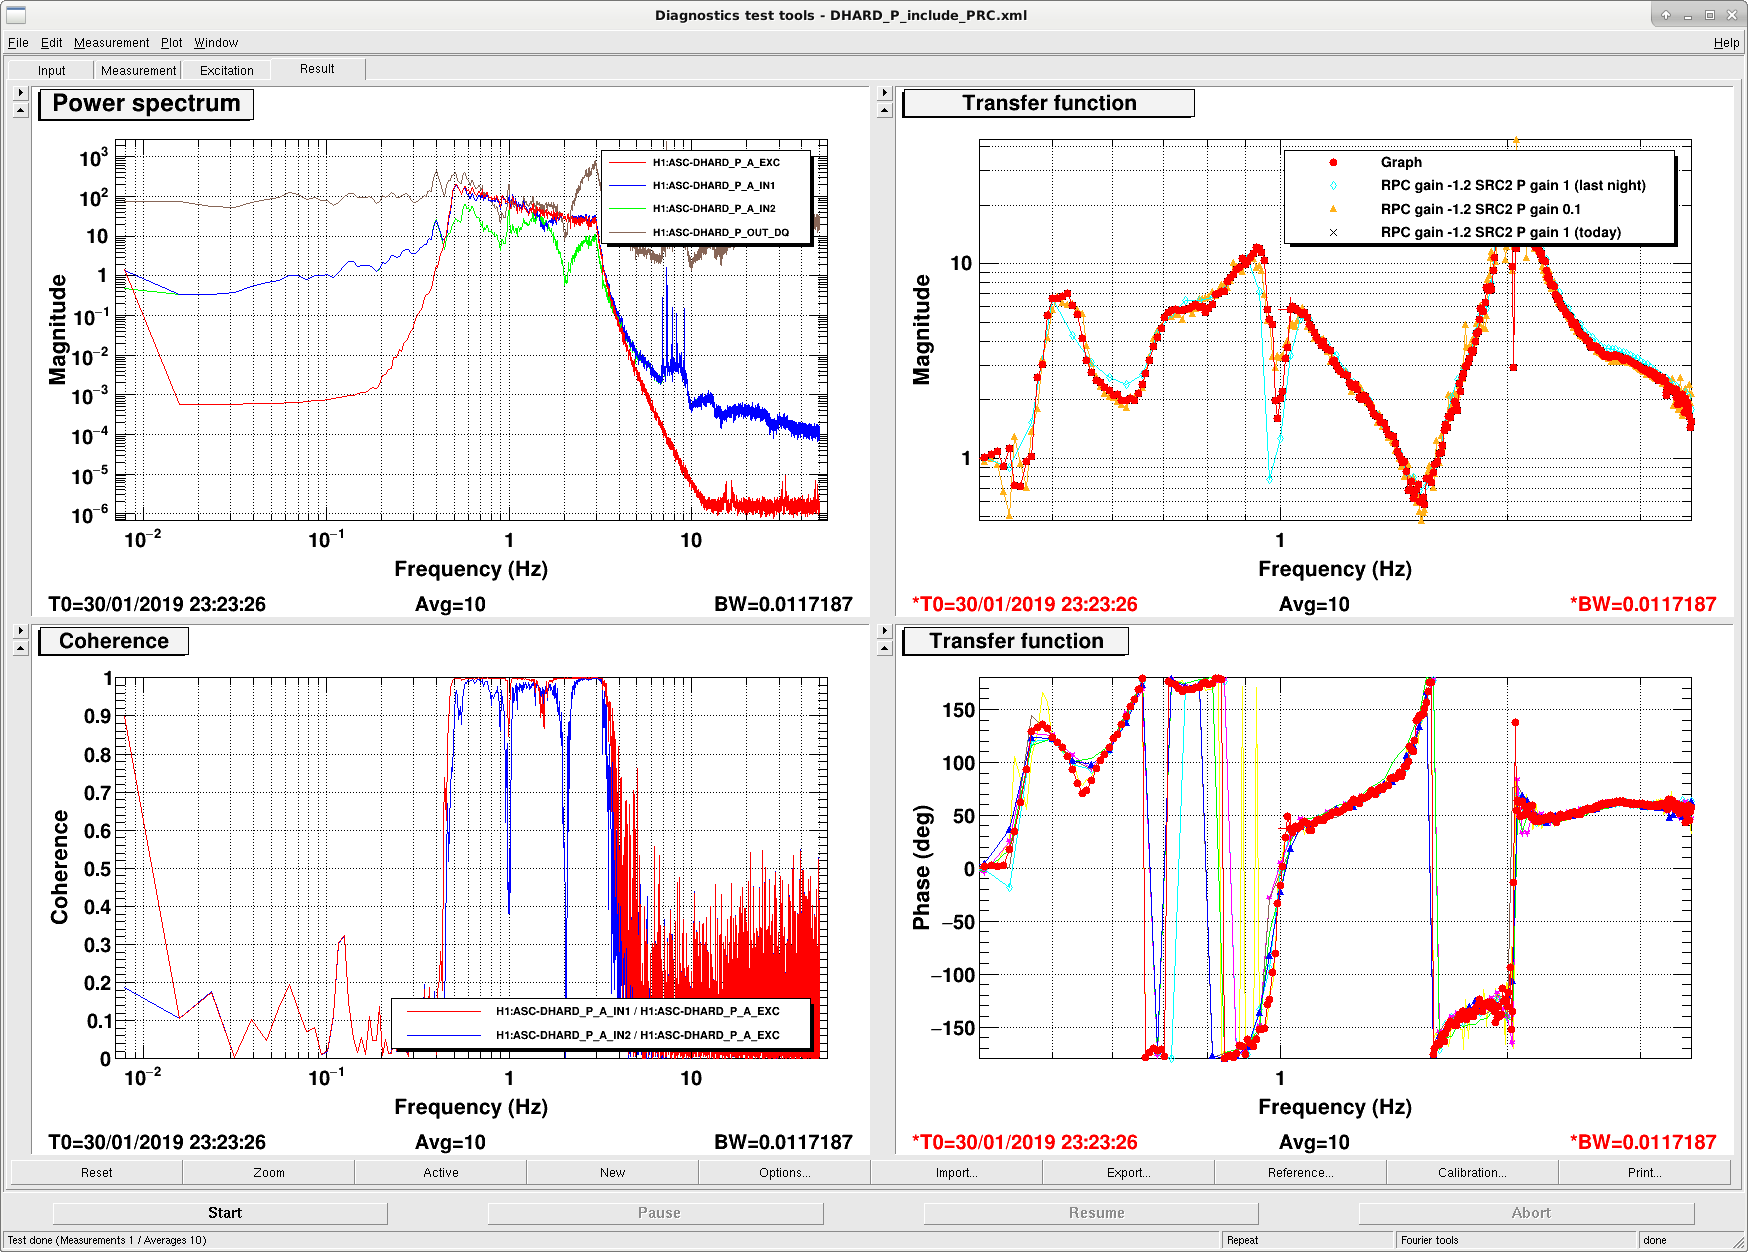
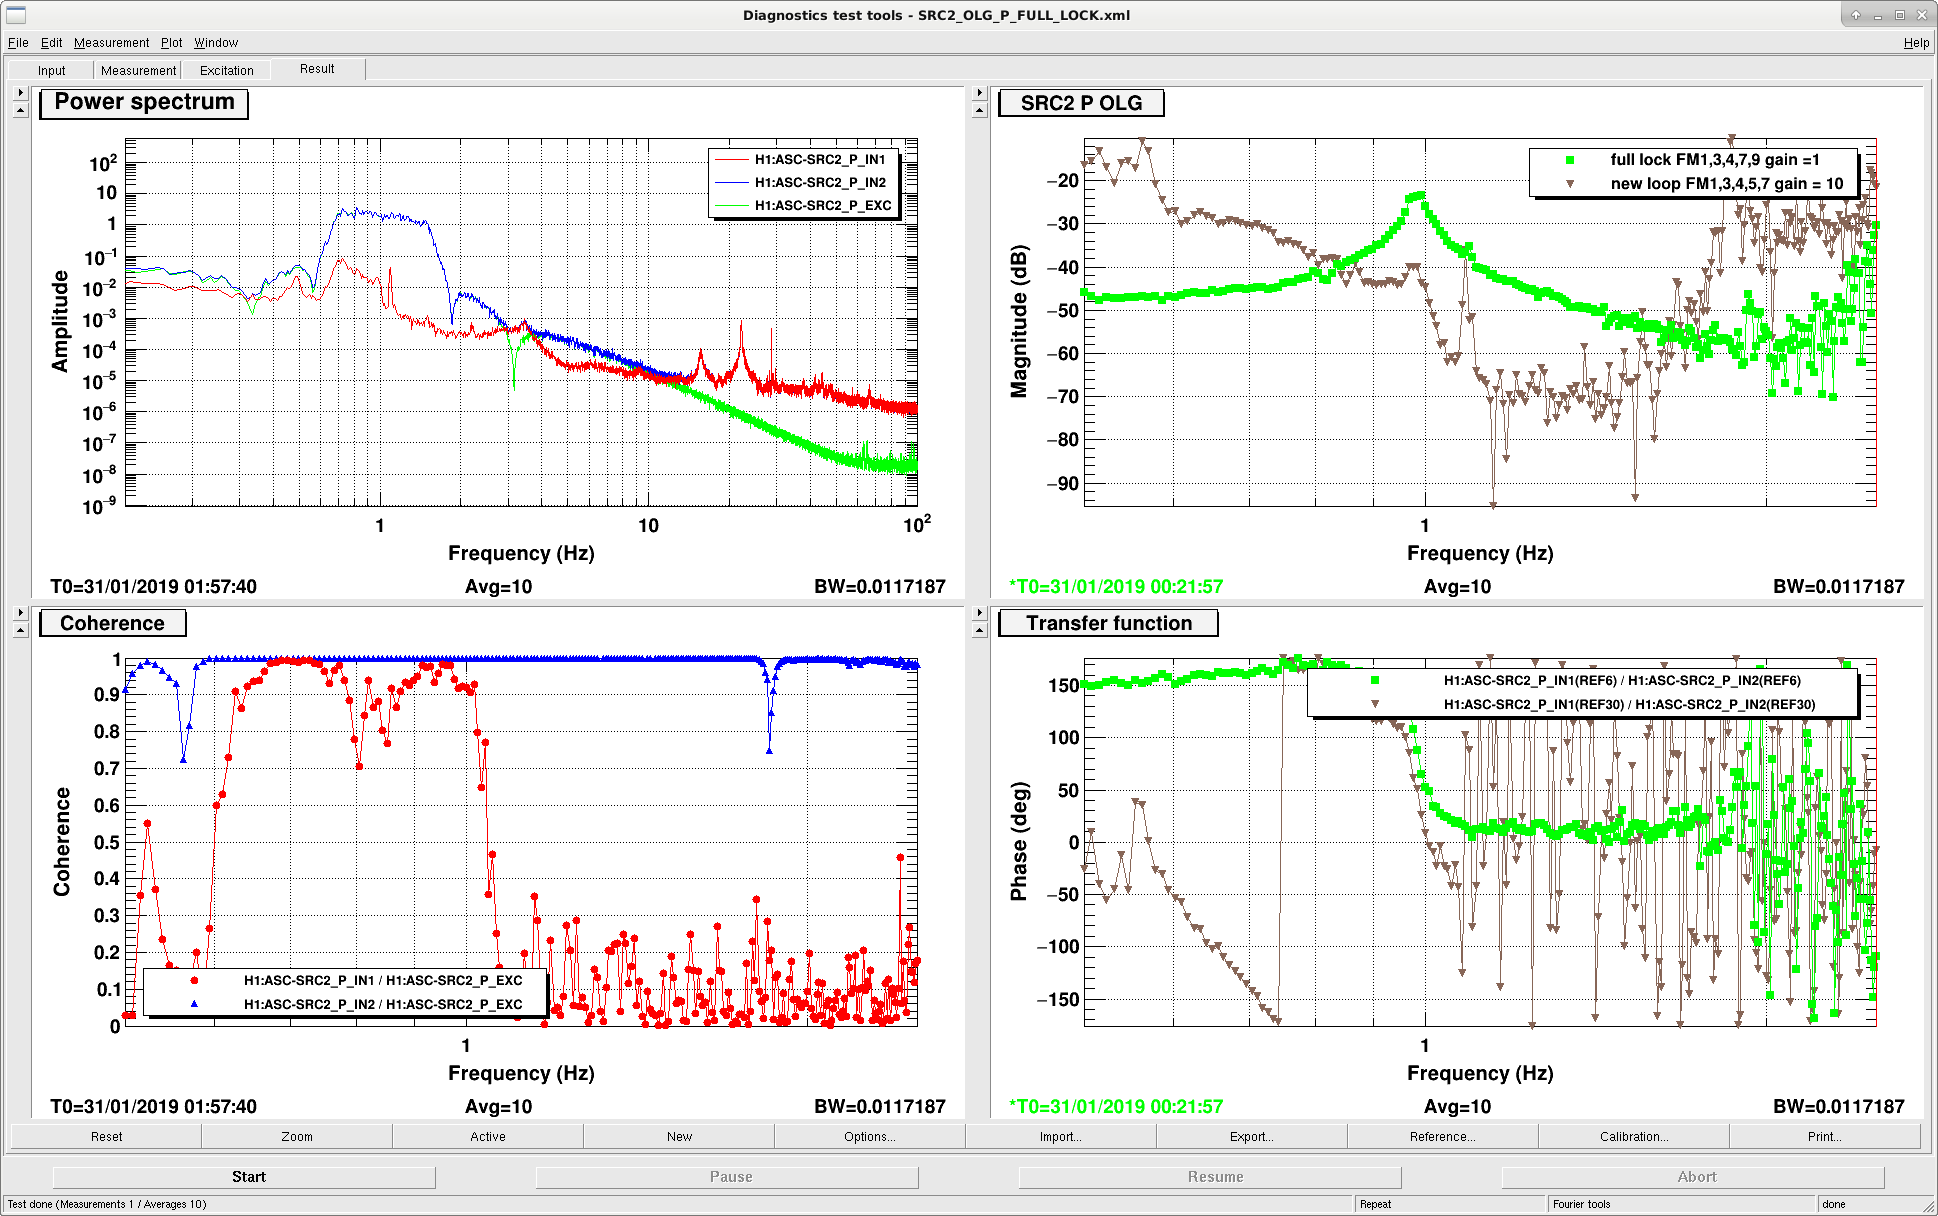
This afternoon we found that the SRC2P setting that made DHARD P stable (probably just barely) last night didn't work today.  The first attached screenshot is a measurement of the DHARD P loop with higher resolution than last night, showing that even with the SRC2P gain reduced by a factor of 15 it still has an impact on the DHARD P loop at 1 Hz.  (first screenshot)

Qualitatively, since the AS_C QPD is sensitive to DHARD when there is a DARM offset, because of the interference between the carrier 00 and the carrier 01 mode, the SRC2P closed loop response has an impact on the DHARD P loop (because the ASQ sensor is also sensitive to SR2 motion because of the DARM offset). 

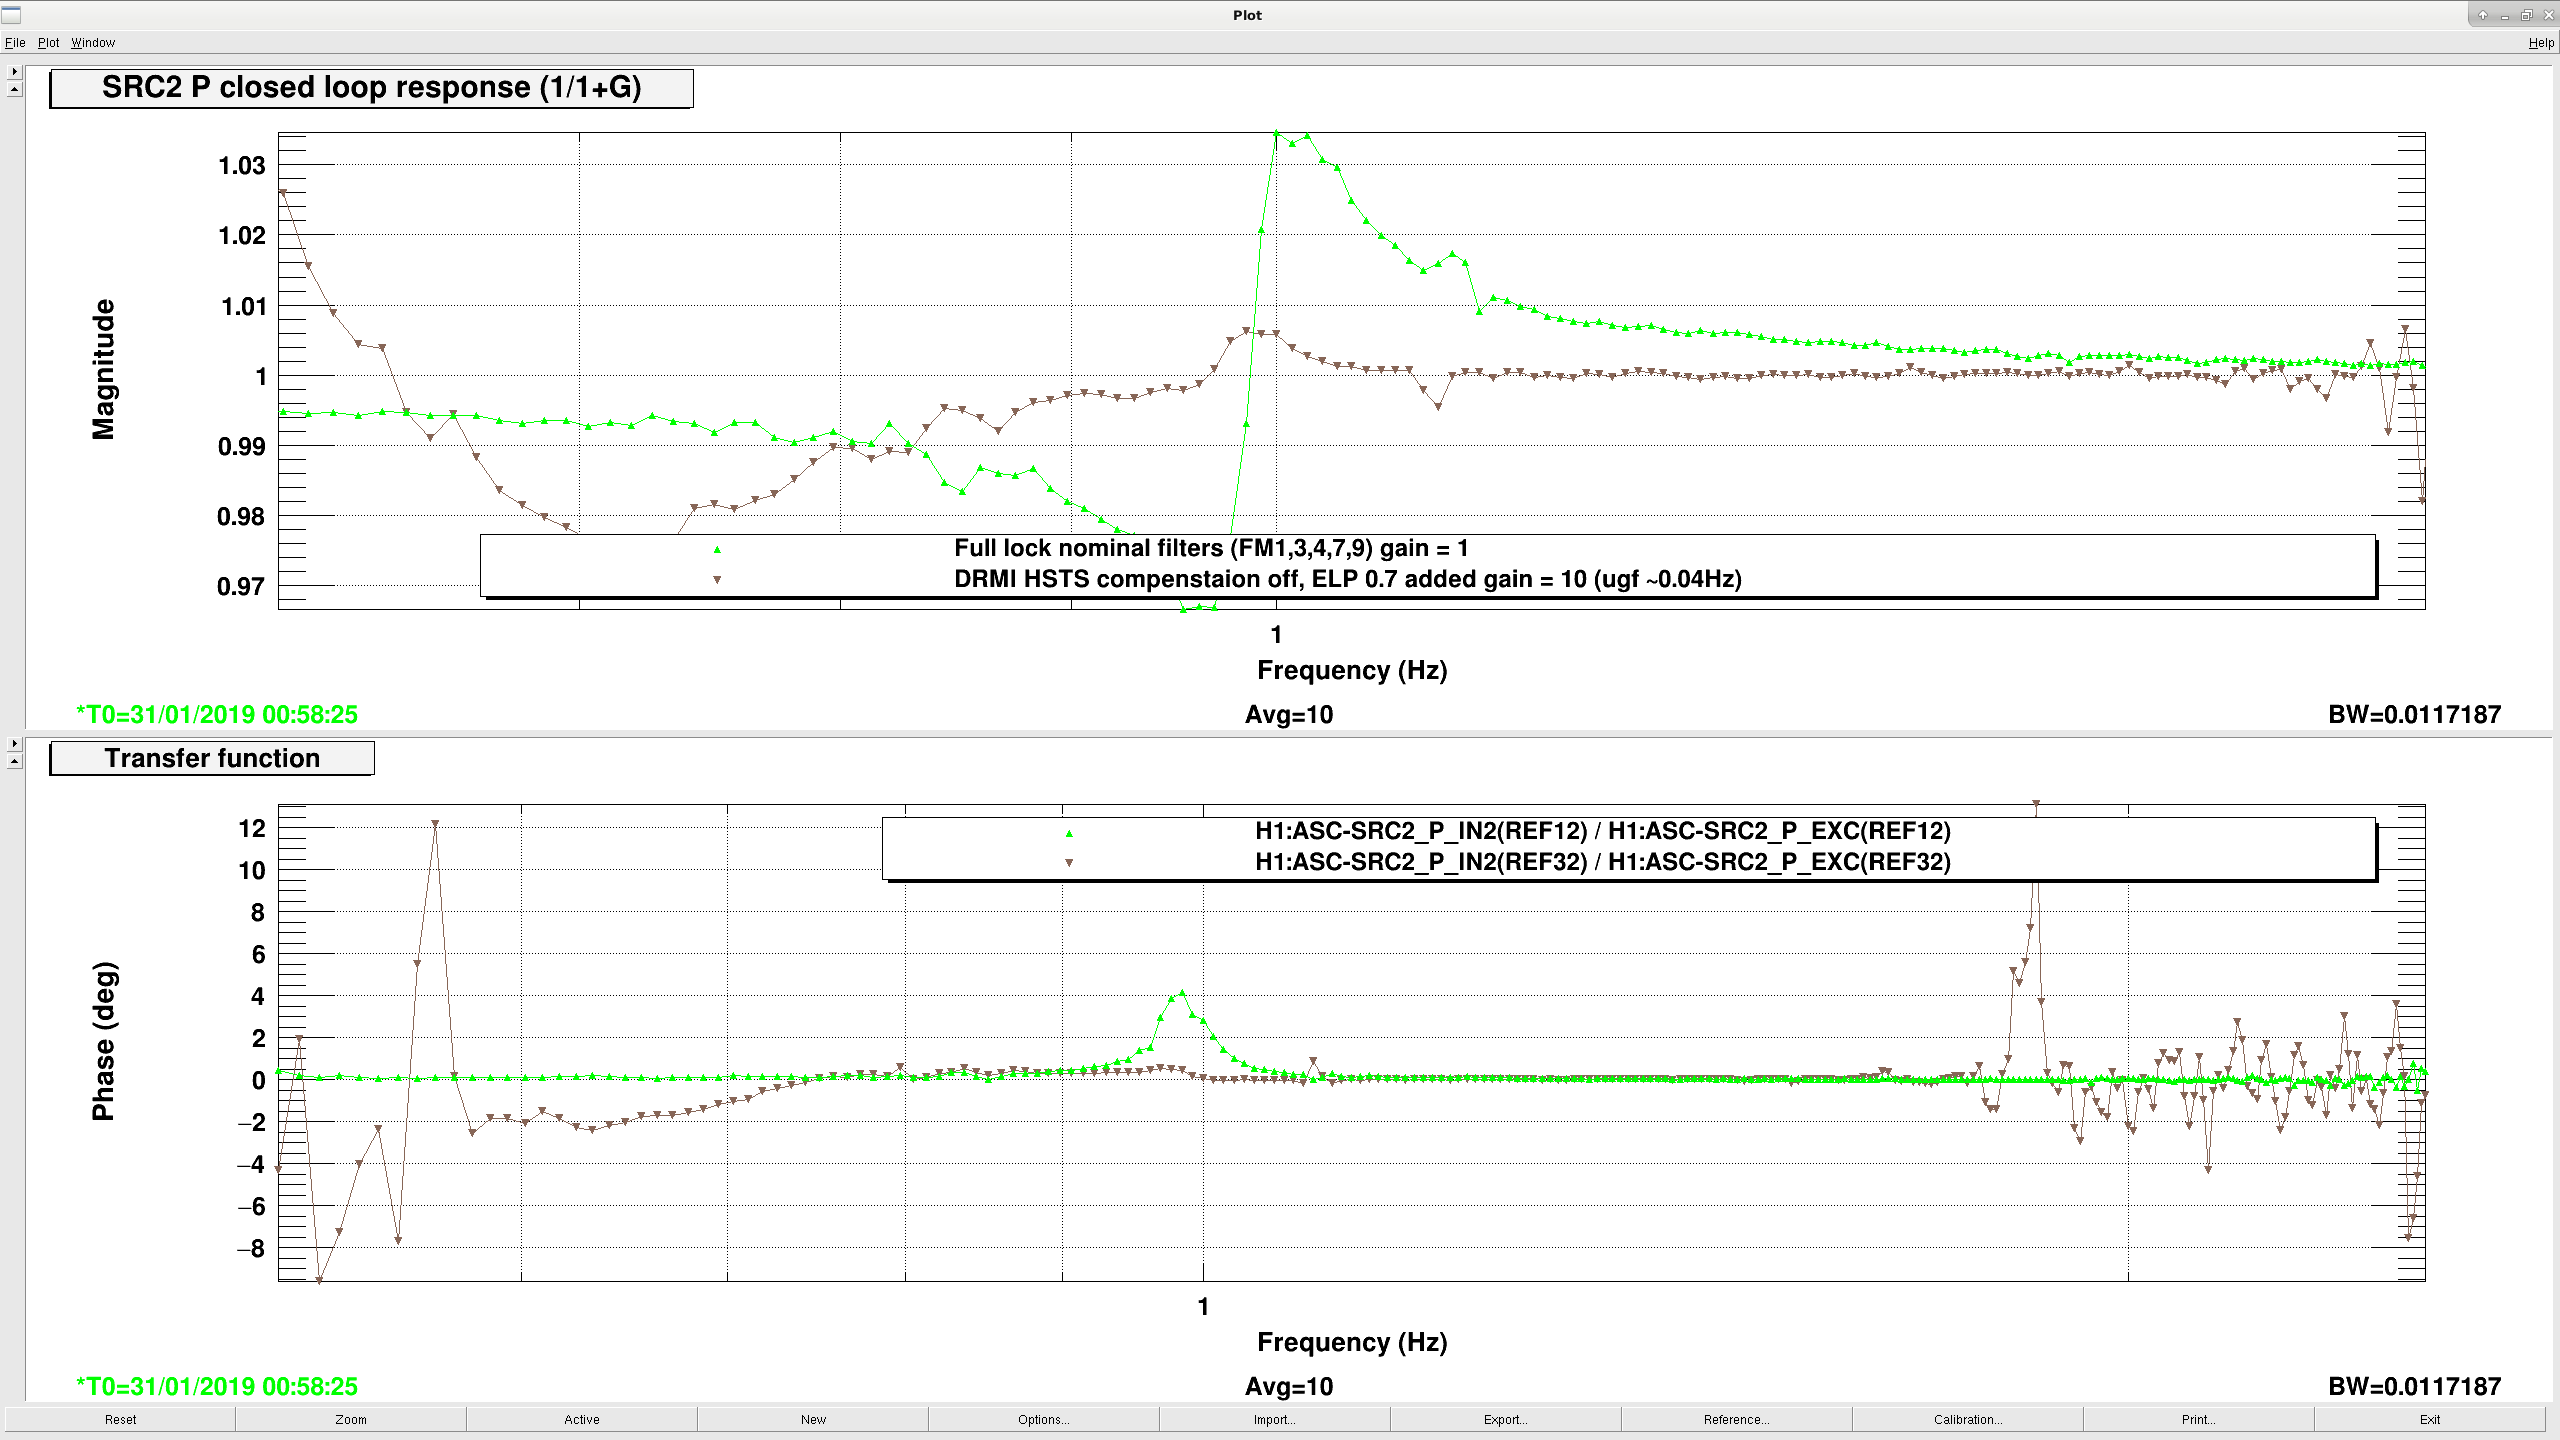
We then spent some time measuring the SRC2 P loop, both in DRMI and in full lock.  With the settings we used last night (green traces in 2nd and 3rd attachment), with a gain of 1 and a compensation filter for the HSTS engaged, the closed loop response of the SRC2P loop has a wiggle in phase at 1 Hz, although the open loop gain is around -20dB at 1 Hz.  We changed the loop to have a ugf around 0.04 Hz, removing the HSTS compensation and adding a low pass at 0.7 Hz to reduce the phase wiggle in the open loop response at 1 Hz.  

We have not put these new settings in the guardian, but we would like to try to engage the SRC2 P loop with the gain of 10, and FM1,3,4,5,7 to see what the impact of this on DHARD is.  

This may not stabilize DHARD, but at least it will remove one cross coupling that is causing the loop shape to change around the zero phase margin frequency.  

Images attached to this report
H1 ISC (ISC)
hang.yu@LIGO.ORG - posted 16:16, Wednesday 30 January 2019 (46709)
ASC bandwidth should be reduced as powering up

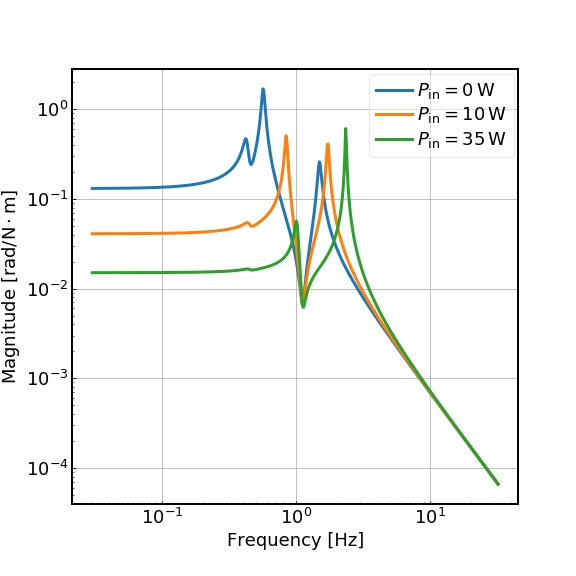
Conclusion:

If our goal is to keep the residual angular motion has a roughly constant rms, then we should try to reduce the ASC bandwidth as we power up, which would further allow us to lower the cutoff frequency to improve DARM. 

Detail:

The closed-loop torque to angle transfer function can be written as 

    G_cl = S_rad / (1 + K*S_rad),

where S_rad is the L3 suspension torque to angle transfer function and K is the control filter.

In the attached plot we show S_rad for the hard pitch mode at different input levels (to get arm power, we assumed G_p=42 and G_a=265). We can see that the DC level of S_rad decreases as we power up. 

Now we focus on G_cl at around the microseismic frequency of ~ 0.2 Hz. It dominates the residual rms motion and it is below the sus resonances and the loop UGF. Consider two scenarios:

    1). we keep the overall open-loop gain, (K*S_rad), roughly the same at different power levels. Then this means

        G_cl ~ S_rad, which decreases as the power increases. 

        Since the raw seismic input in torque is independent of input power, as G_cl decreases with S_rad, we are clearly "wasting" control bandwidth by trying to keep (K*S_rad) the same. This cause us inject more sensing noise to the system then we need to. This is not optimal.

    2). We should instead keep the loop suppression the same. Note that G_cl ~ S_rad/(K*S_rad) ~ 1/K at microseismic freq. As we power up, we should not increase the DC gain of K but just keep it roughly constant. This means the UGF of the CH/DH loops should decrease as S_rad decreases. 

Images attached to this report
H1 General
edmond.merilh@LIGO.ORG - posted 15:54, Wednesday 30 January 2019 (46704)
Shift Summary - Day

TITLE: 01/30 Day Shift: 16:00-00:00 UTC (08:00-16:00 PST), all times posted in UTC
STATE of H1: Commissioning
INCOMING OPERATOR: None
SHIFT SUMMARY:
LOG:

15:50 Chris S out to MY for scaffold setup

18:00 Marc out to MX for LEMI signal testing

18:29 Marc back

18:38 Aiden out to optics lab

18:50 Betsy out to LVEA W Bay to get something

19:29 Betsy back

19:56 - 20:23 Nutsinee out to LVEA - ISCT6

21:00 Nutsinee back

23:39 Chris back

23:00 Weekly Site Meeting

H1 SEI
arnaud.pele@LIGO.ORG - posted 02:02, Wednesday 30 January 2019 - last comment - 14:02, Wednesday 30 January 2019(46702)
HAM3 ISI Ry loop off for testing

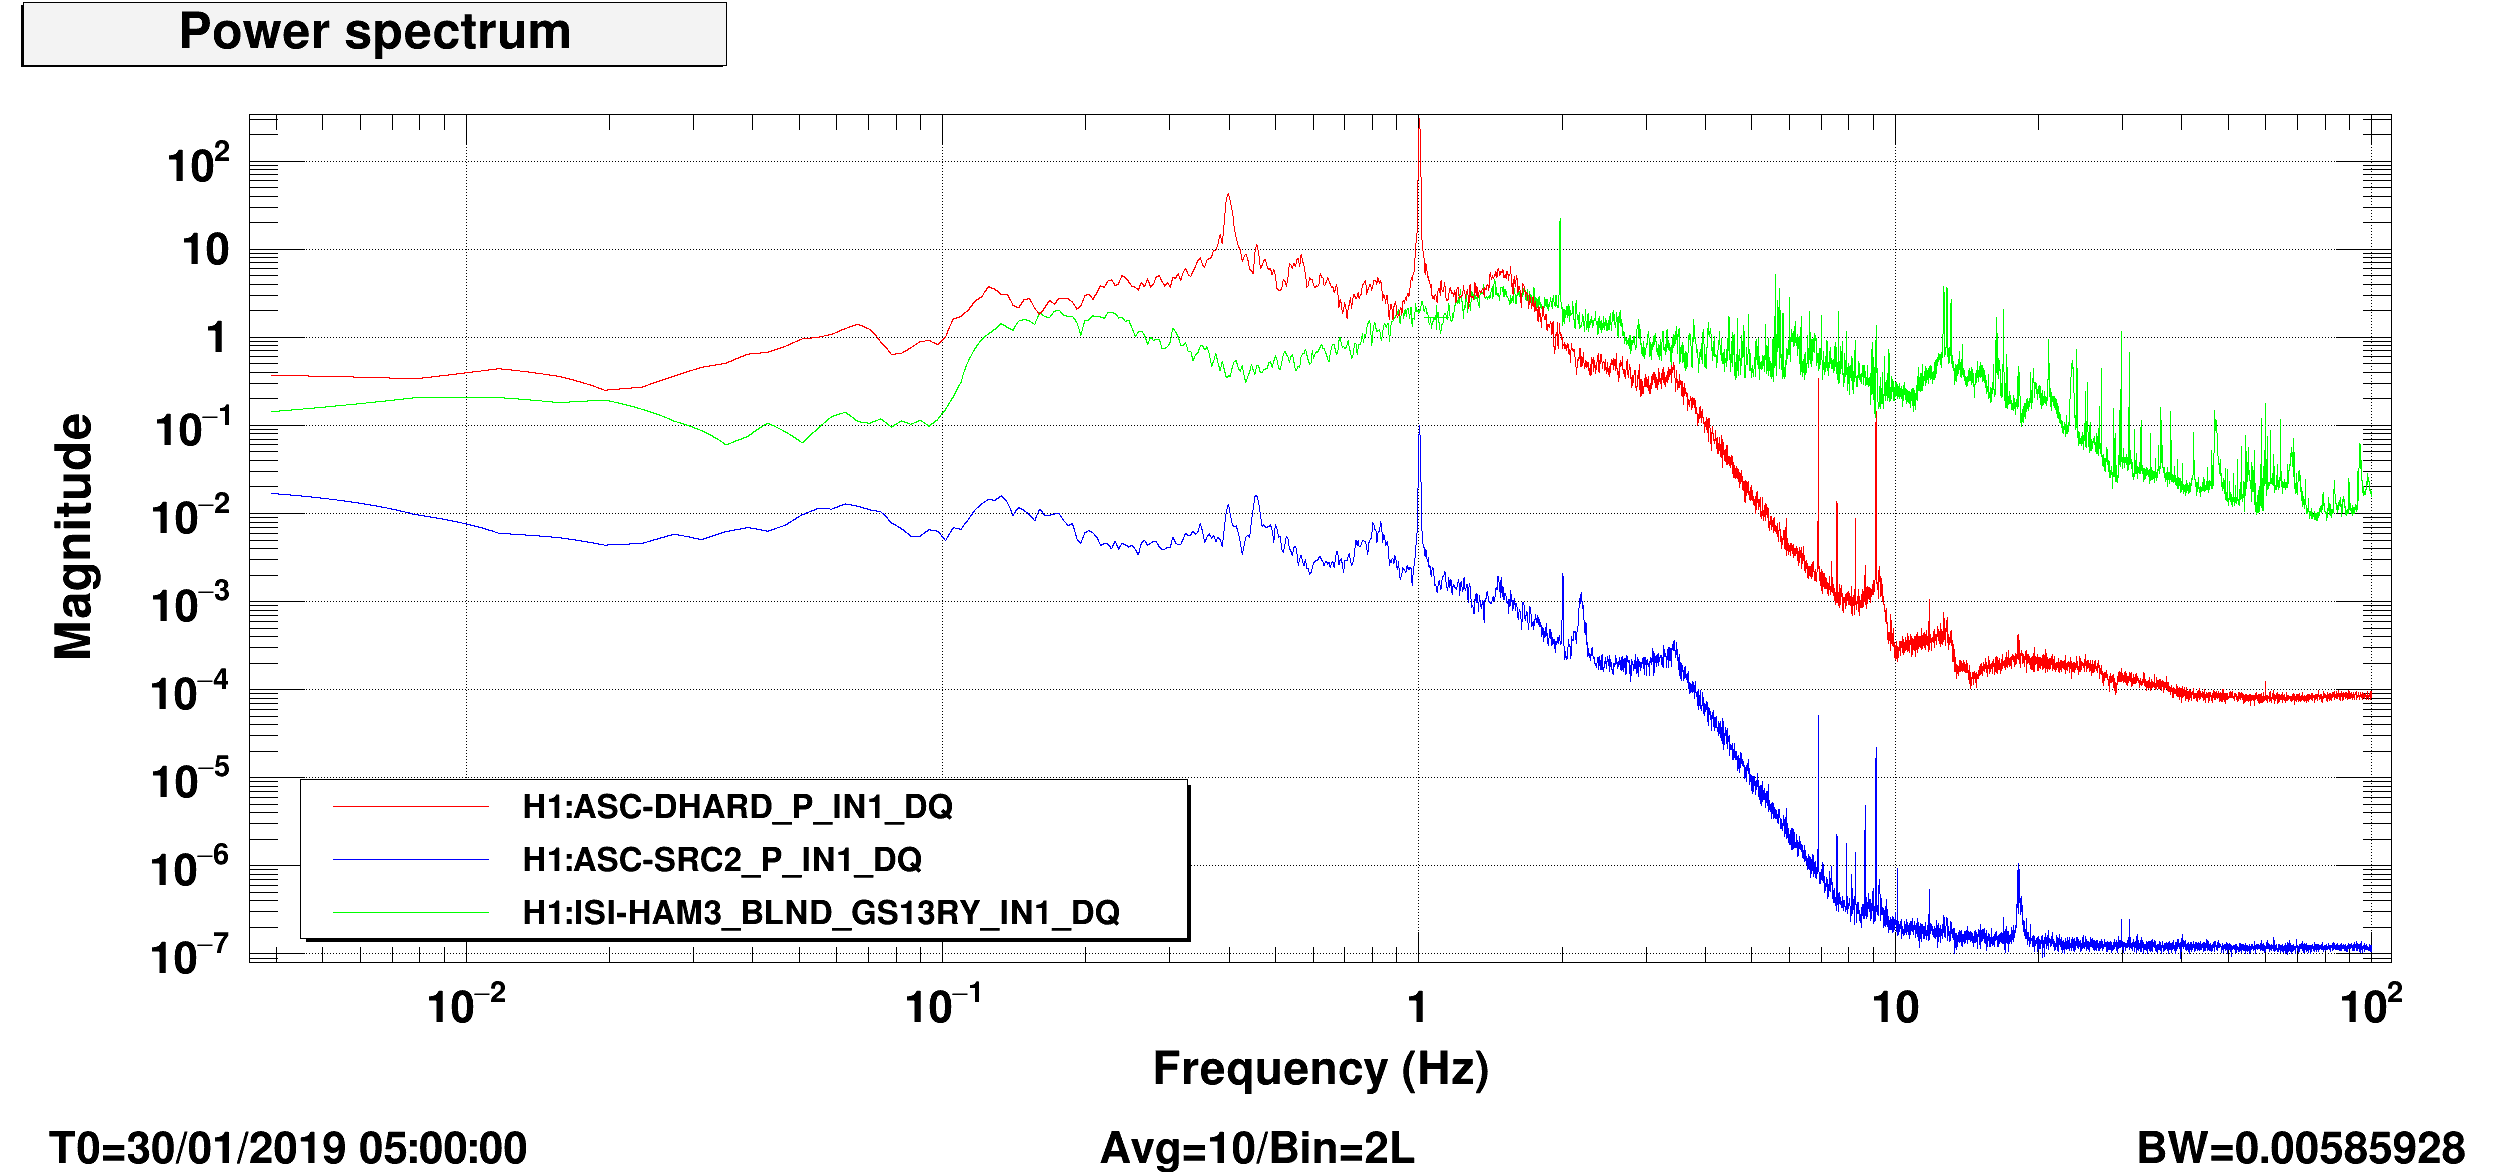
I tried more tests to investigate the 1.1Hz HAM3-ISI line, following up on Jim and Hugh's effort. I am keeping track of the tests done so far in this document. One of the ways to remove the peak is to turn off the Ry isolation loop, at the expense of low-frequency horizontal motion, see the X motion before vs after, or Ry motion before vs after.

With low enough useism, the ifo was locked in this configuration to test if this would change the 1Hz ASC behavior. The two problems look independent since we found ASC to be still marginally stable around 1Hz but with no peak present on the ISI, see attached screenshot.

Will keep investigating.

Images attached to this report
Comments related to this report
jim.warner@LIGO.ORG - 14:02, Wednesday 30 January 2019 (46708)

This morning, I was looking at some other stuff on HAM3 and trying to clean up SDF, when I must have misclicked and turned the gain back to 1 on the RY loop. Because Arnaud had disengaged the boost, the ISI stayed isolated, but it glitched some of the IFO signals. It also made an immediate improvement in the PR recycling gain, making it much quieter, but this brought back the 1.1hz feature on the ISI. The take away is that leaving the RY loop off is good for PRCL, bad for the PR gain (when the soft loops are off), but this may only be true because the microseism is low right now. 

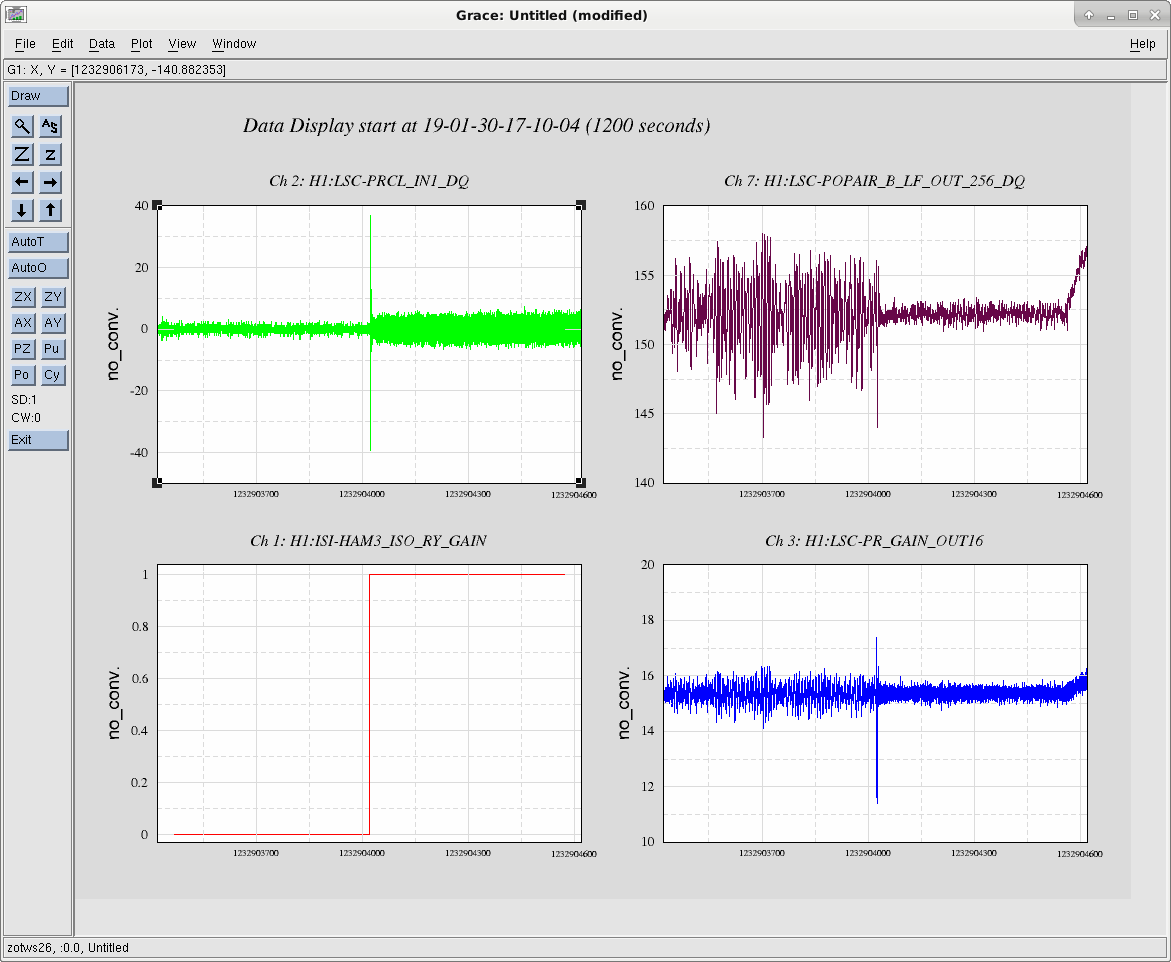
First attached image are timeseries of PRCL, POPAIR_B_LF, the HAM3 RY loop gain and LSC_PR_GAIN. The glitch in the middle of each window is me accidentally turning on the RY loop, PRCL immediately gets noisy, but POPAIR_B gets quiet.

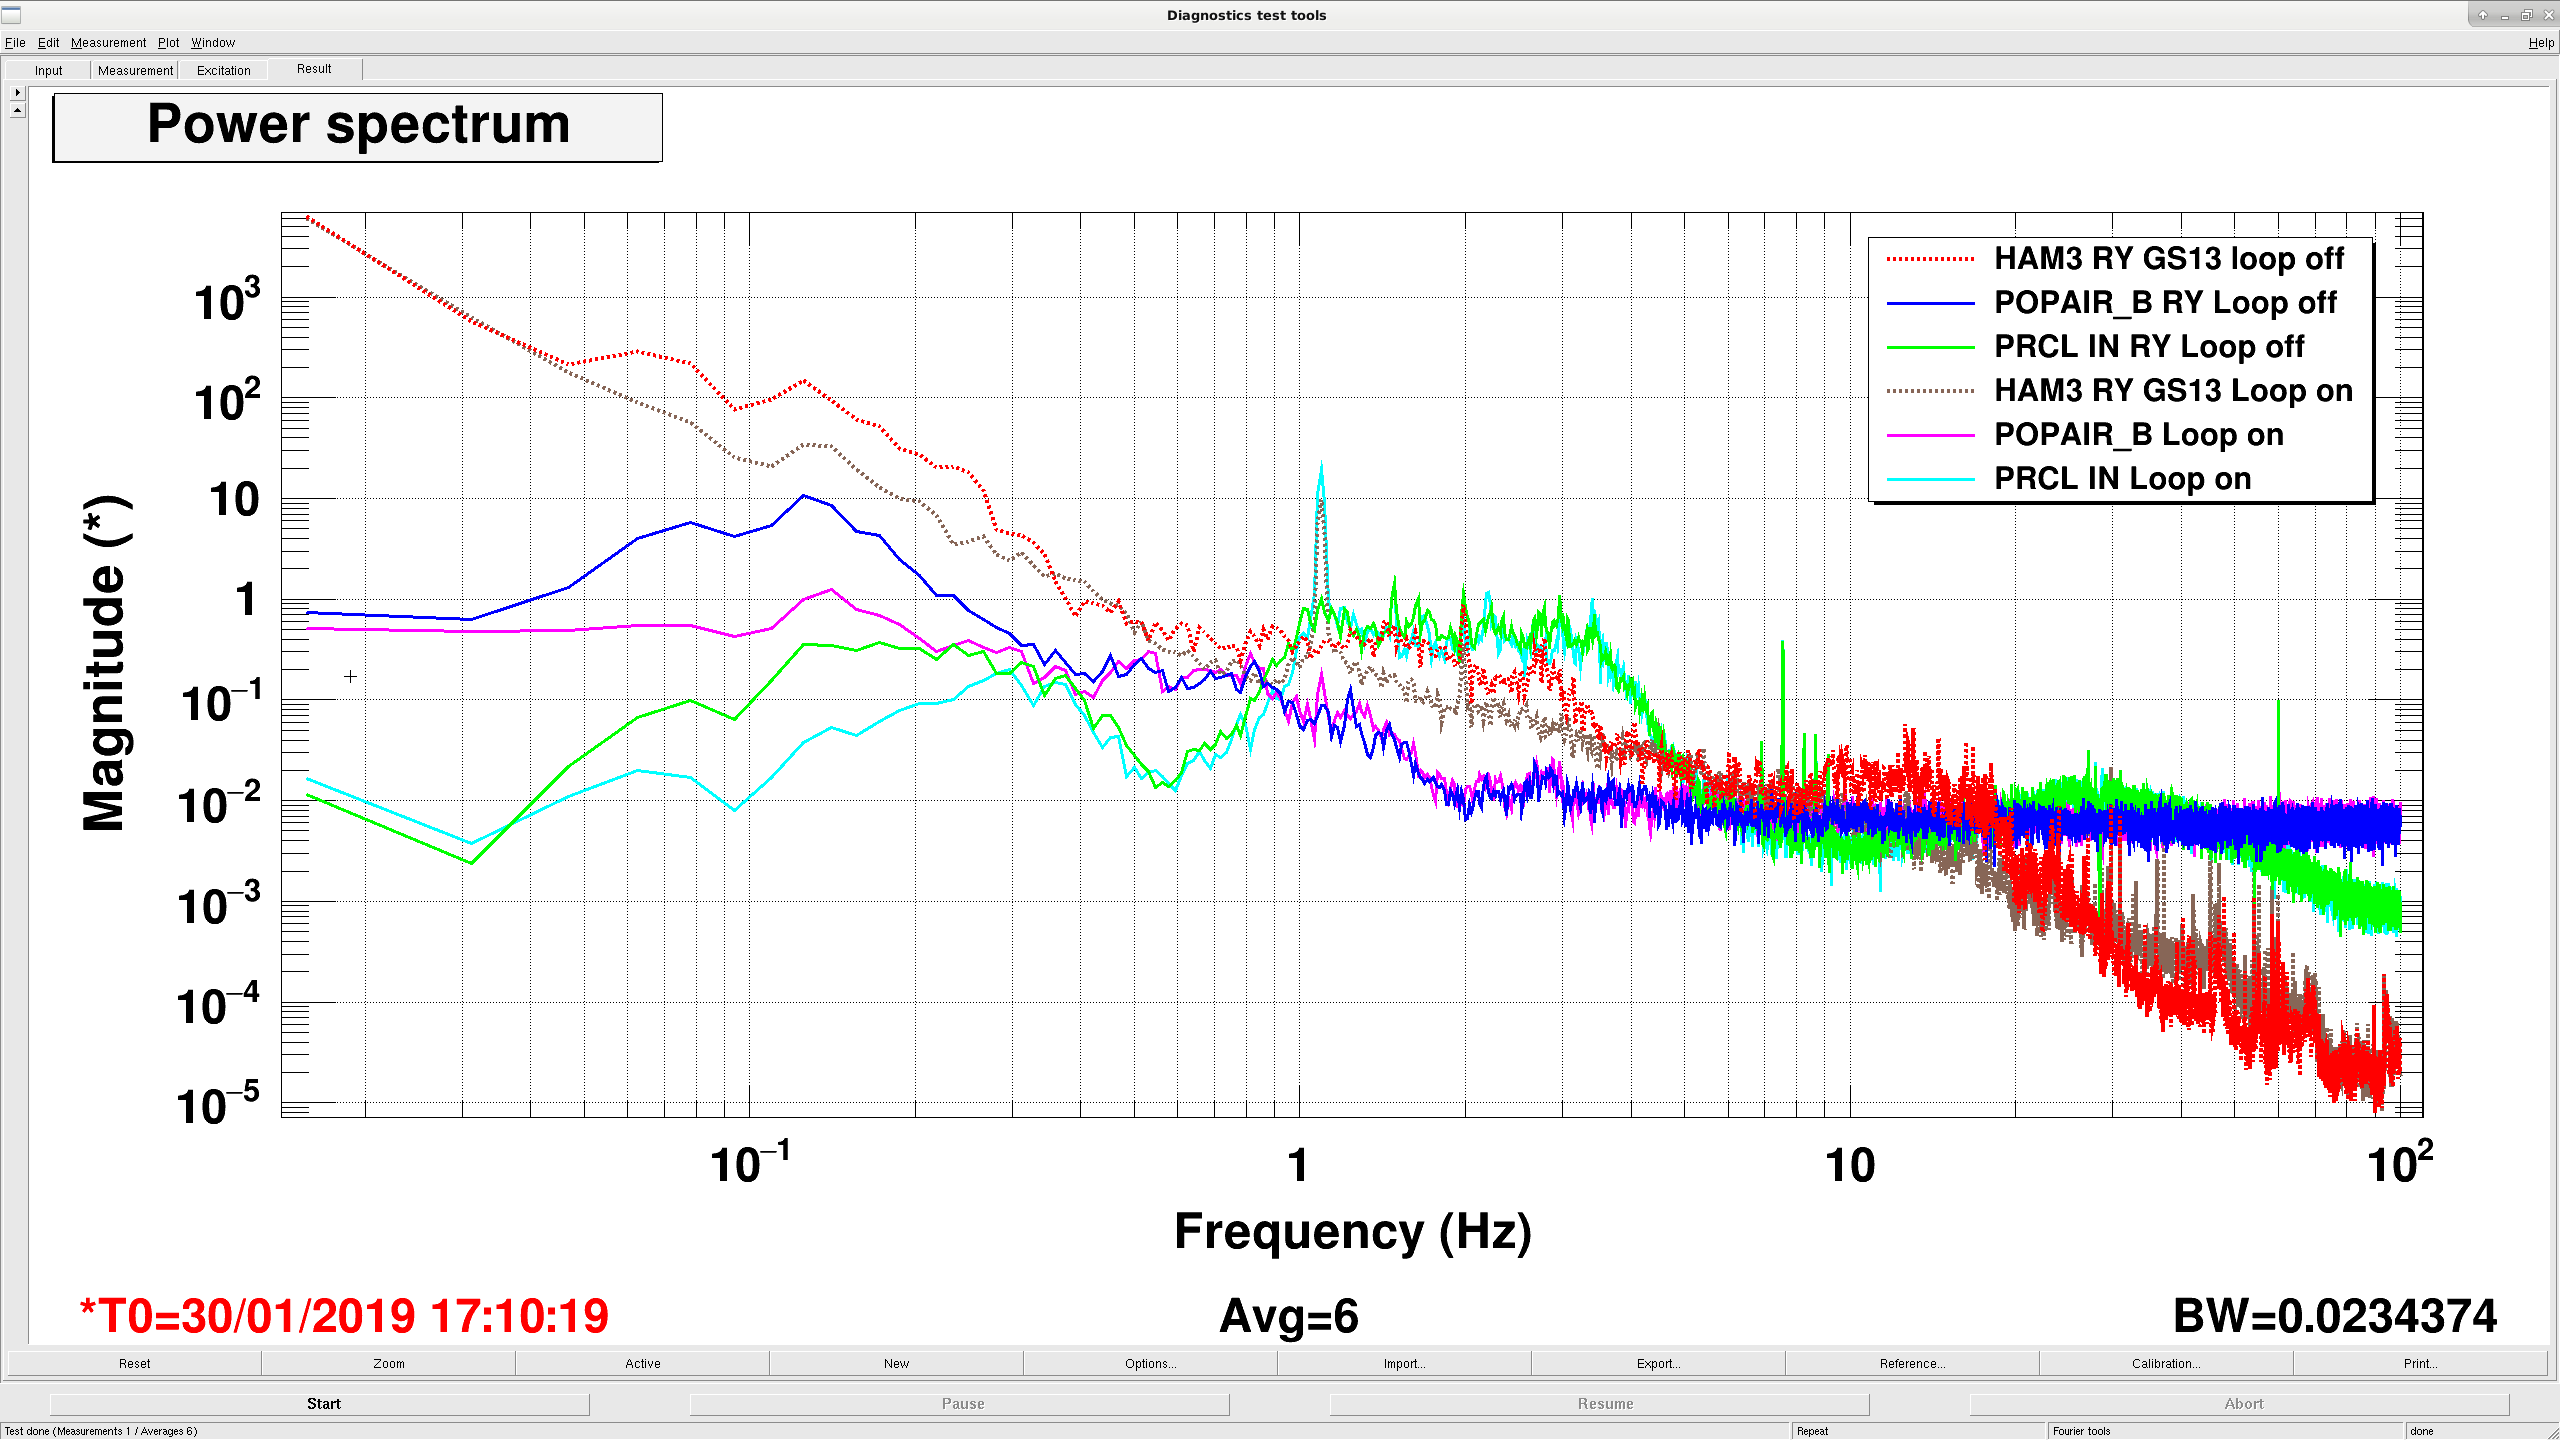
Second plot is asds comparing before and after. The dashed lines are the HAM3 RY gs13s, blue and pink are POPAIR_B, green and light blue are PRCL. With the RY loop off, POPAIR_B is dominated by the extra .05-.3hz extra motion in HAM3 RY. With the loop on, this extra motion goes away, but PRCL is dominated by the 1.1hz peak. 

Images attached to this comment
H1 AOS (ISC)
craig.cahillane@LIGO.ORG - posted 17:42, Tuesday 29 January 2019 - last comment - 20:49, Monday 04 February 2019(46683)
What is the arm power 2
On January 8th I tried to measure the average arm power by dithering SRCL.  Last night I did it again, this time with better TFs taken simultaneously.
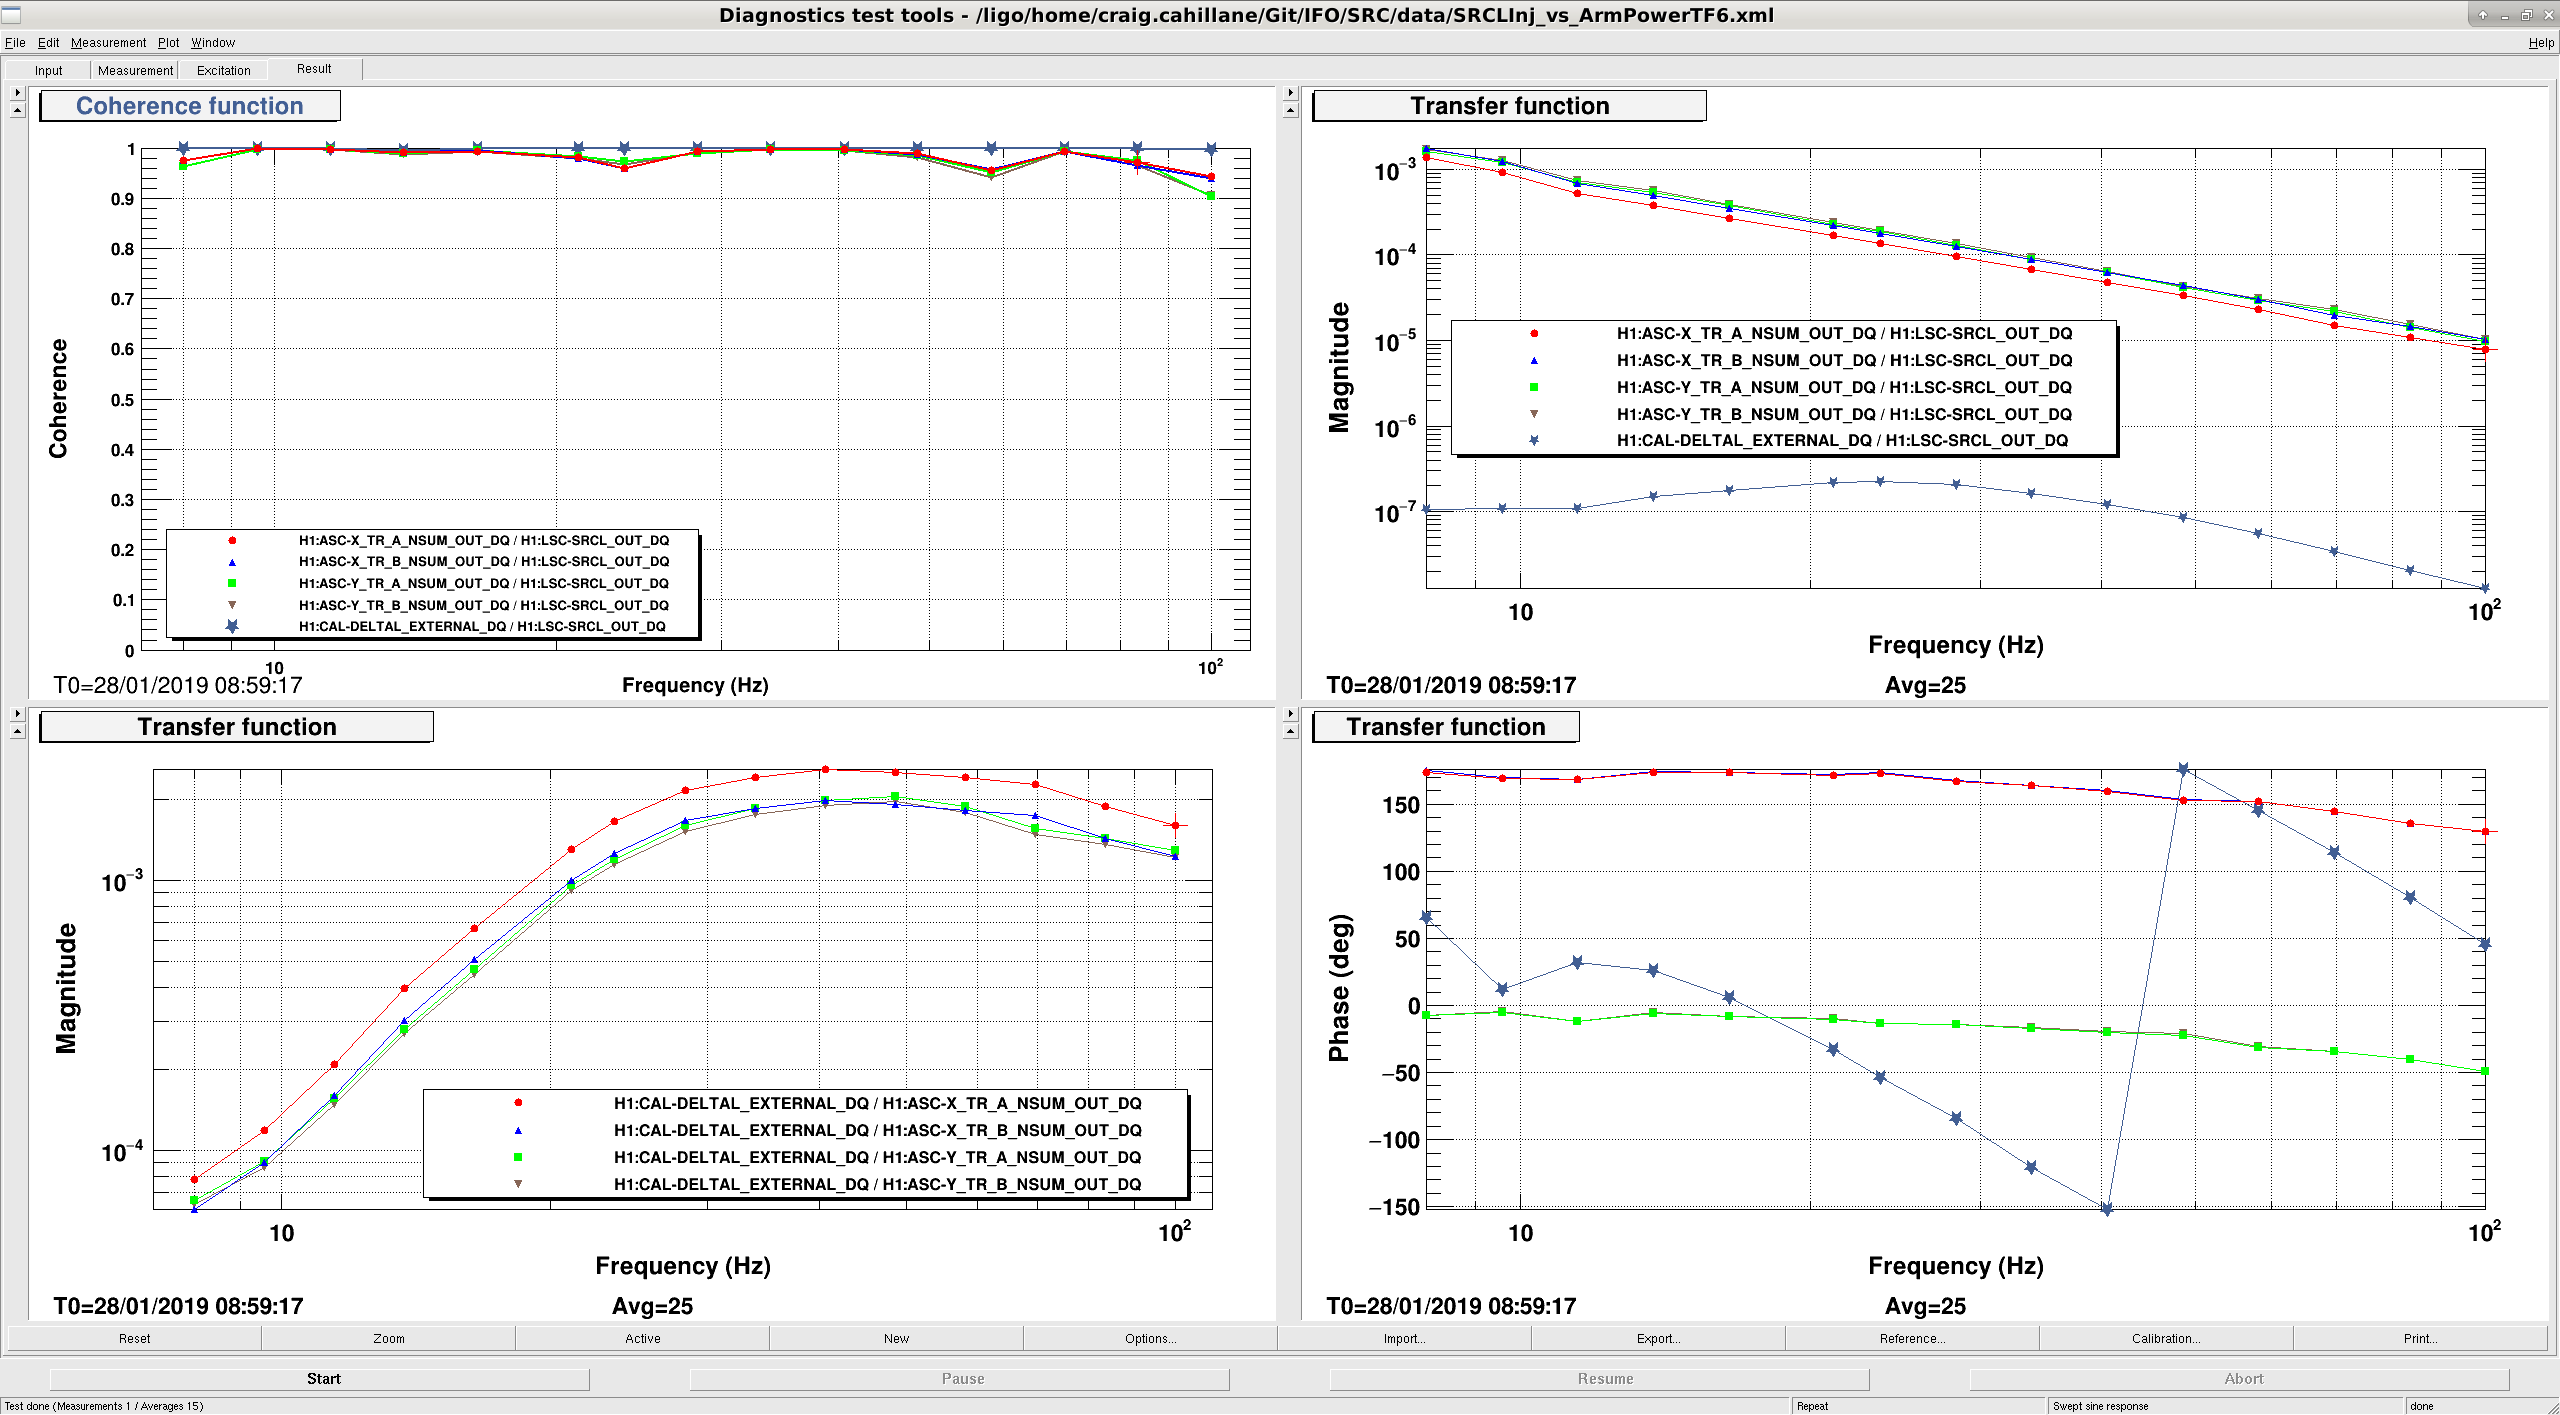
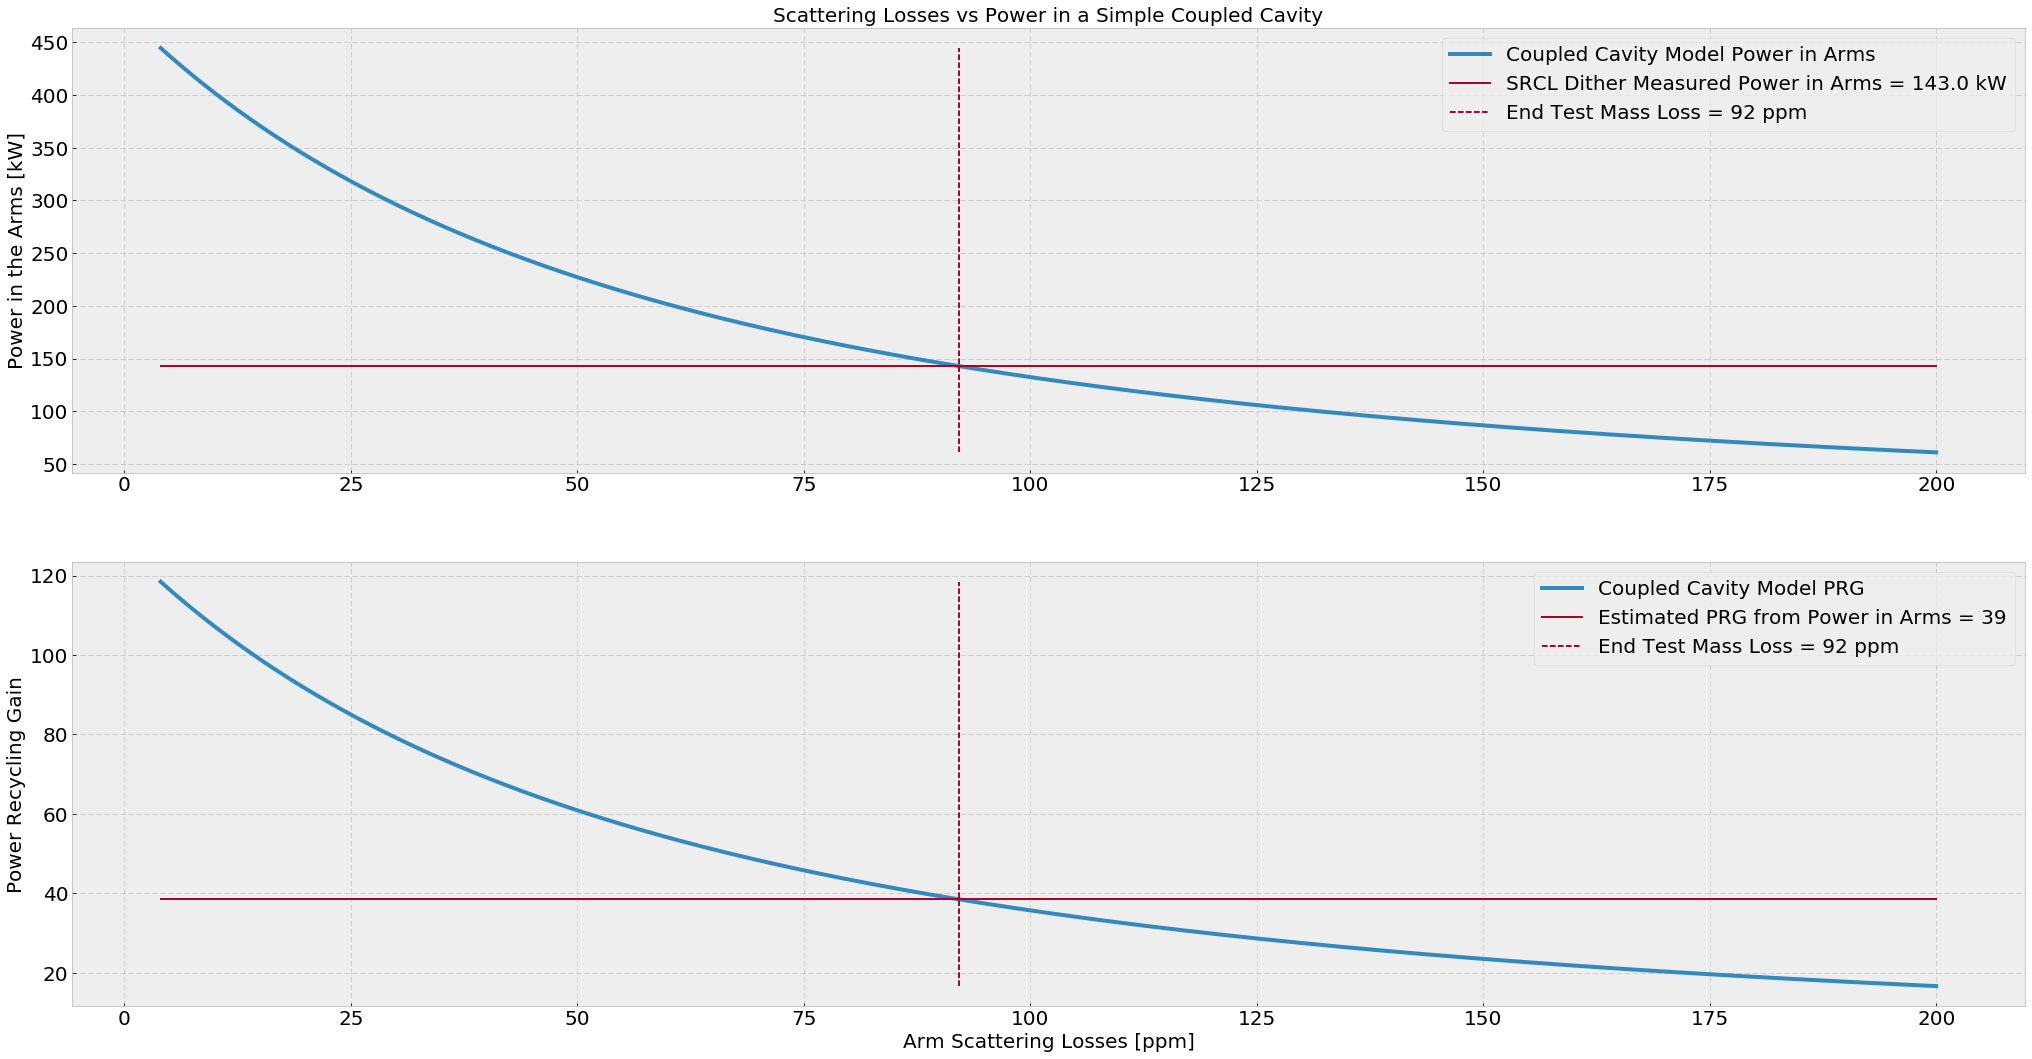
Average Arm Power = 143.0 +- 5.8 kW

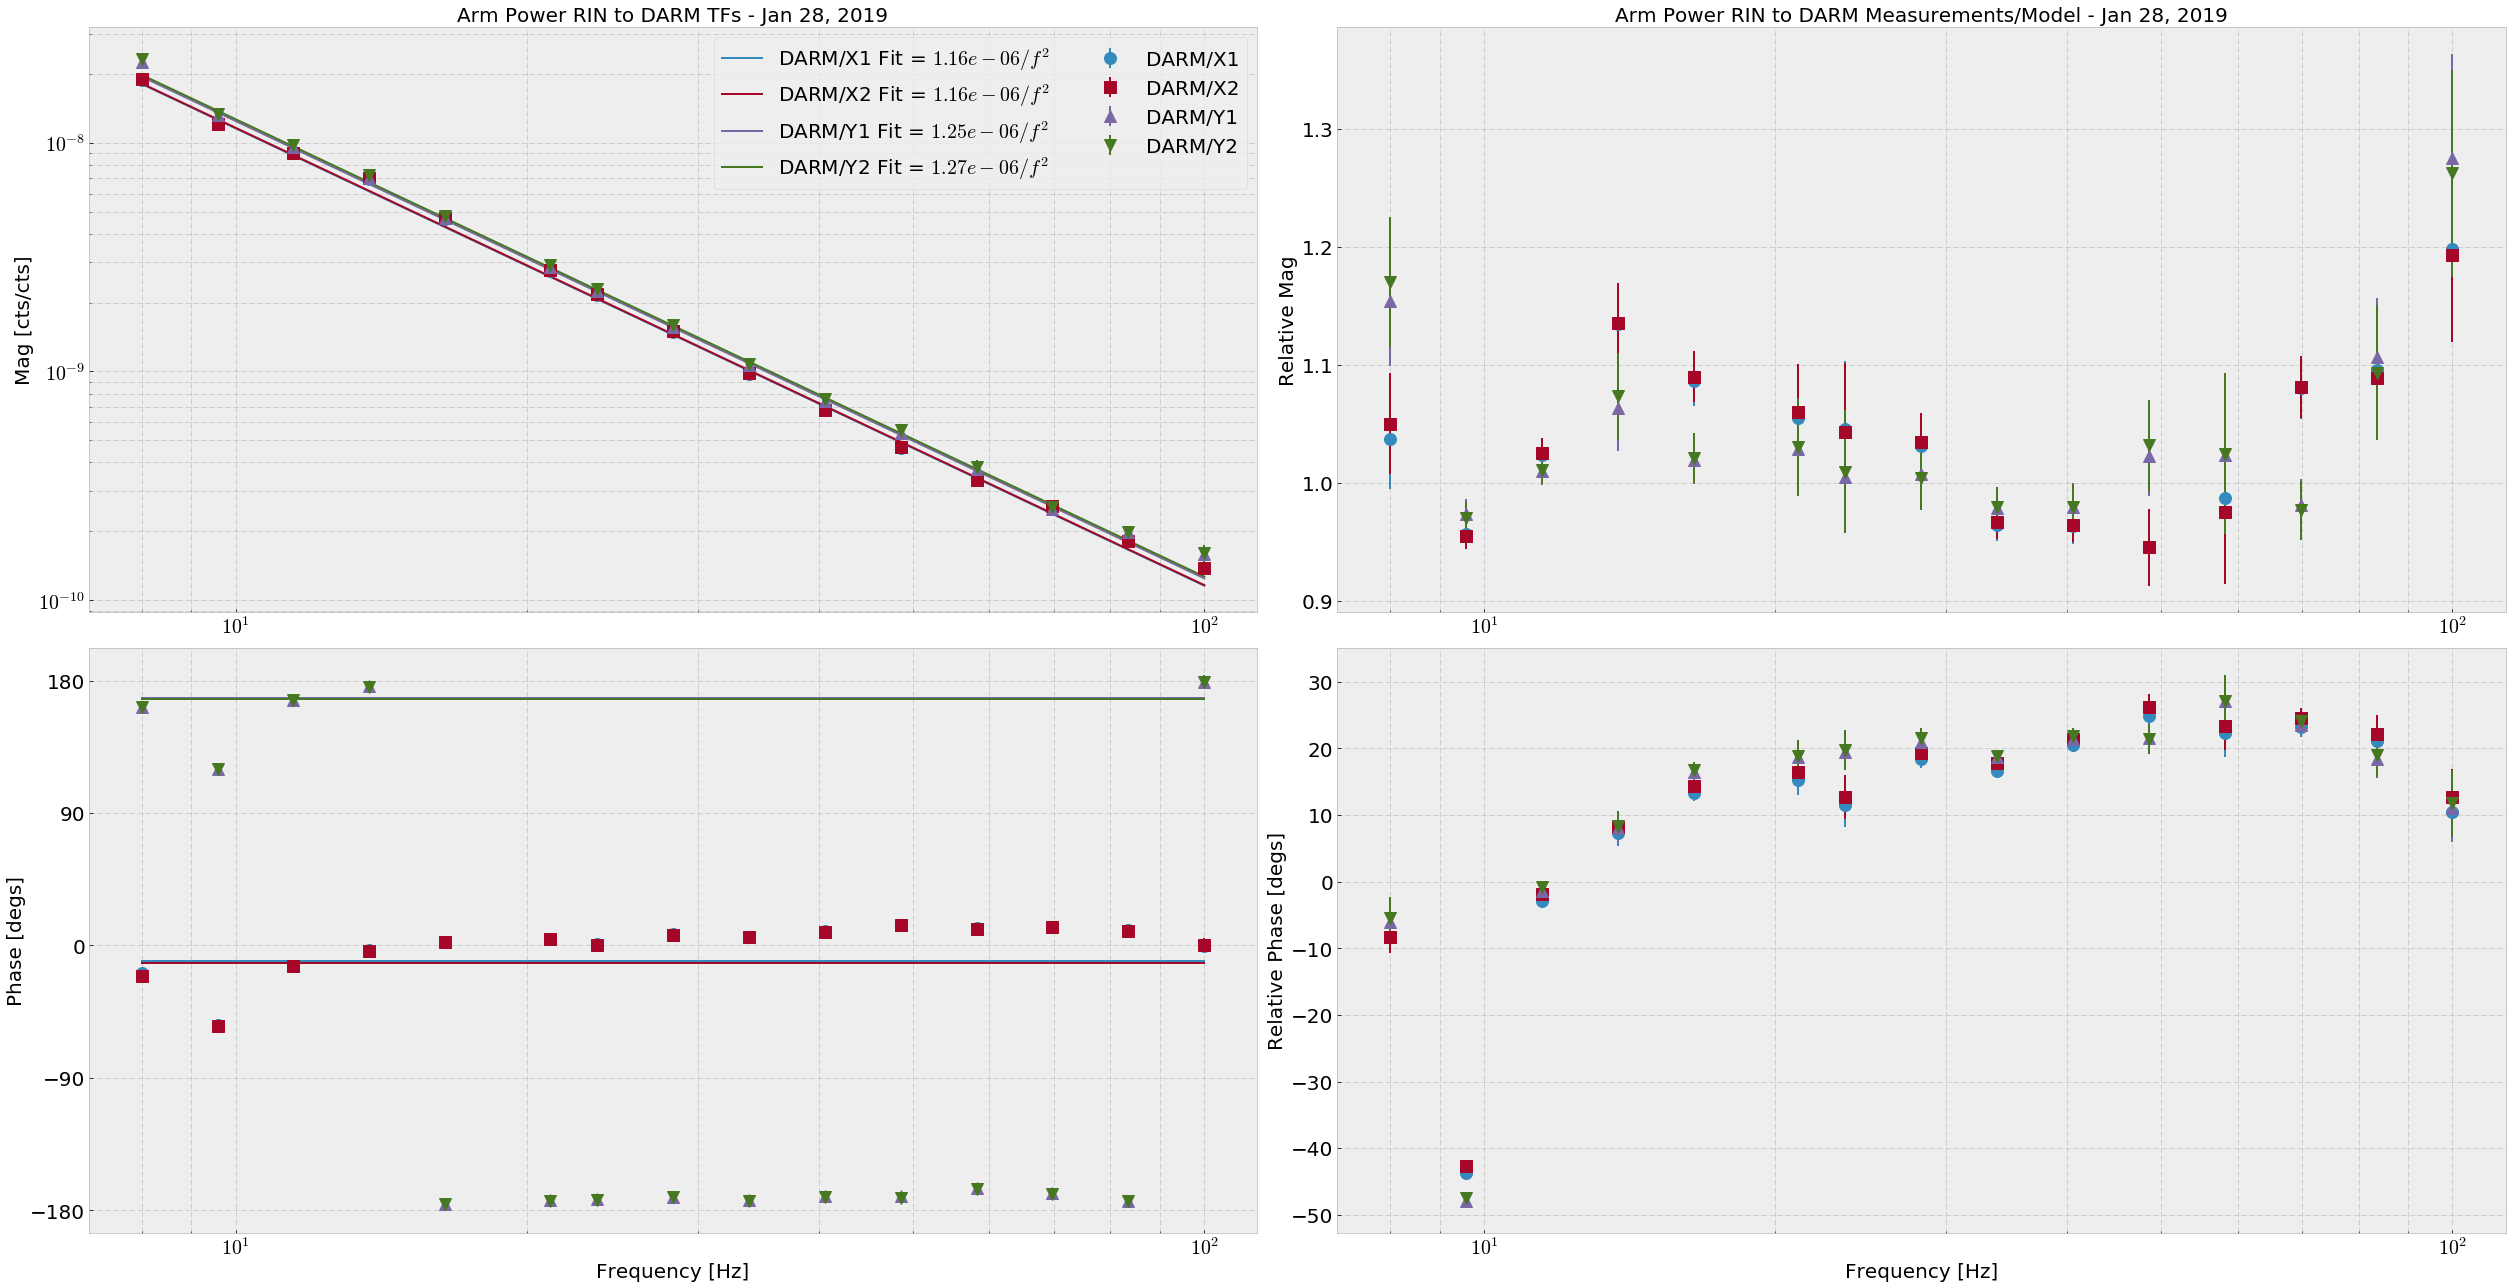
This time I directly fit each of the four Arm Trans QPD RINs (H1:ASC-{X,Y}_TR_{A,B}_NSUM_OUT_DQ) to DARM (H1:CAL-DELTAL_EXTERNAL_DQ), then fit a 1/f2 (attachment one).  The DARM calibration used was the stop gap made by Keita.  The average powers for the RIN calculation are as follows, and are good to +- 300 cts:
Arm Trans QPD counts
XA      145658
XB      191409
YA      207723
YB      221769


This time the math is simpler: 
P_arm = DARM/ArmTransRIN Fit × π2 × m × c


If we look at the different in the arm trans RIN response between the arms, and say that the RIN we see is entirely due to radiation pressure in the arms, we get (DARM/Y)/(DARM/X) = X/Y = 1.08, meaning there may be 8% more light in the X arm than the Y arm.  EDIT: It is actually the Y arm with 8% more light than the X arm.

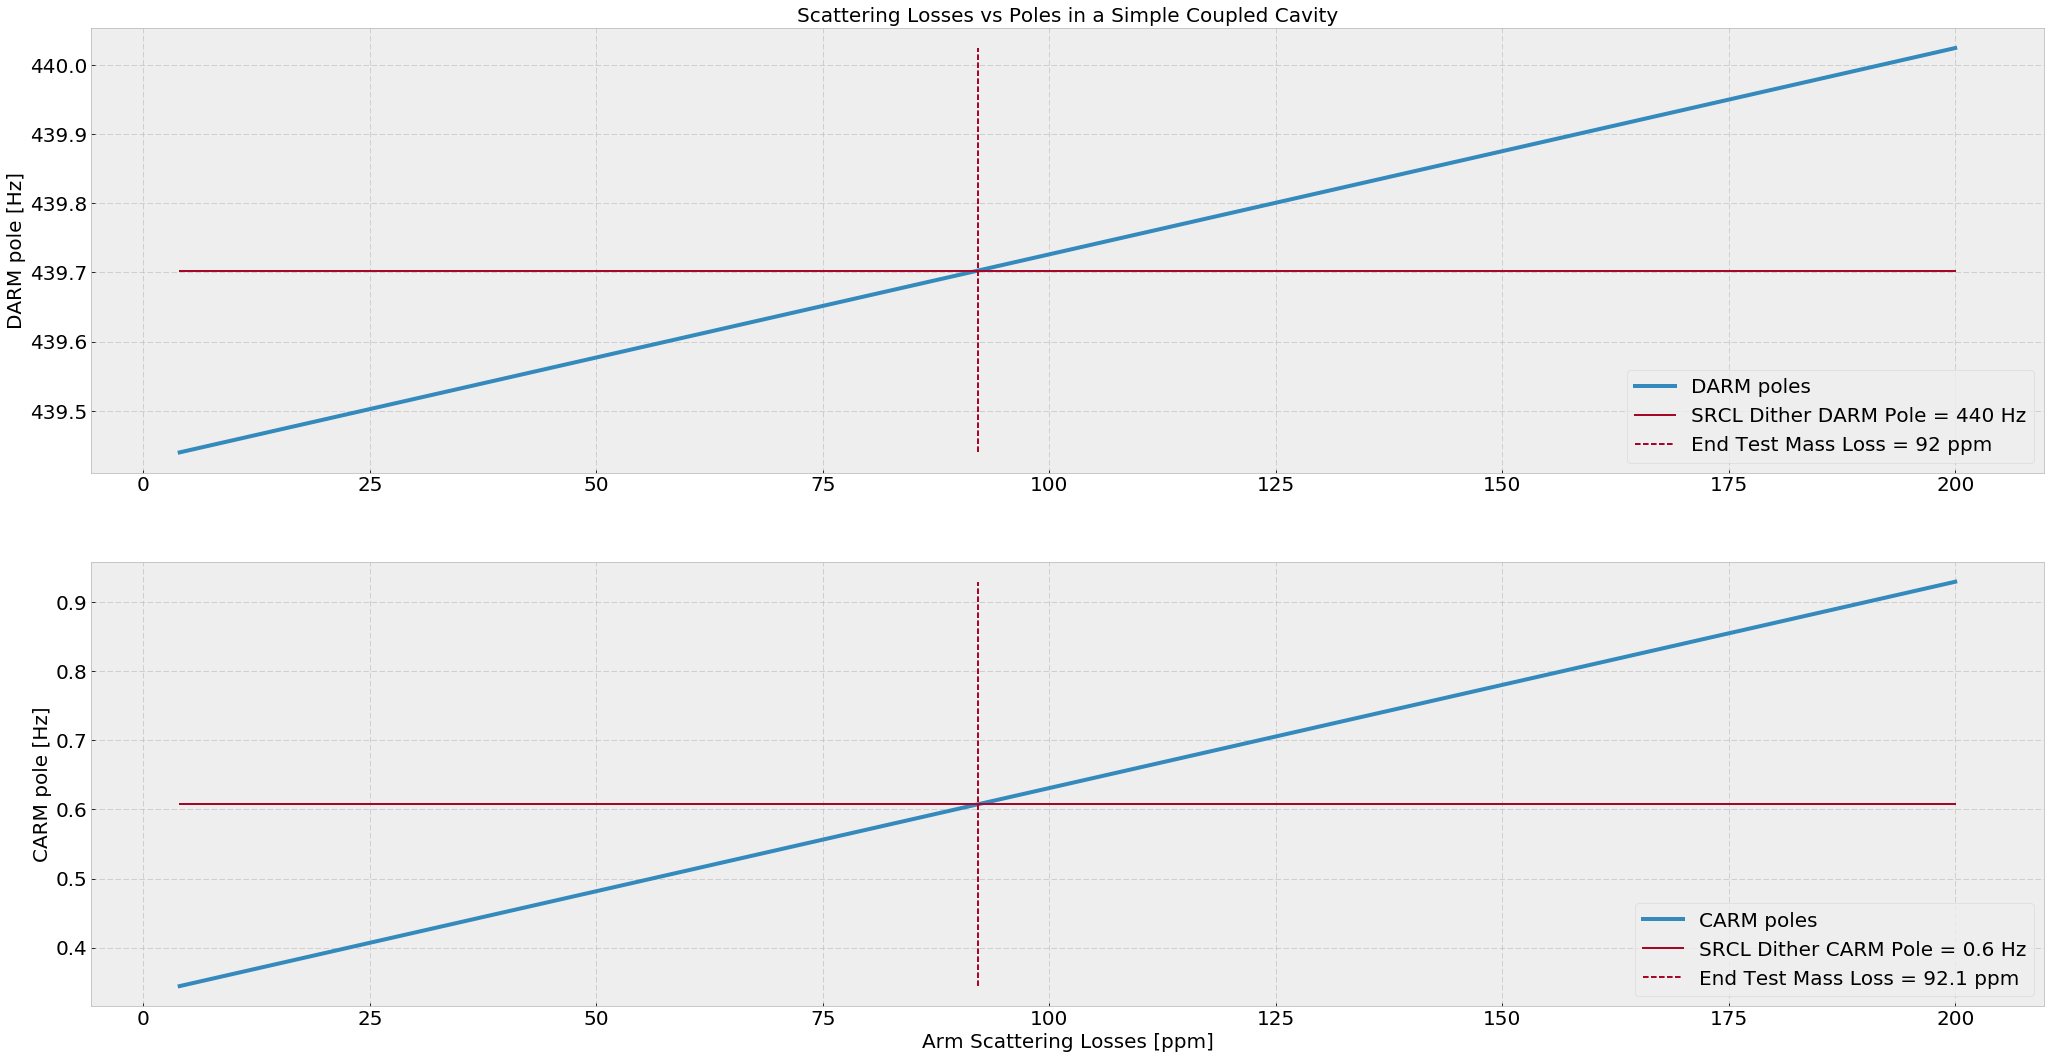
If we calculate the simple power recycling coupled cavity, I find that the estimated average ETM scatter losses are around 92 ppm and the estimated PRG here is 39.  (attachment three)

The measured value of PRG at the time of the measurement is 41.8, and the true input power was 26.5 W (requested was 30W).  If we take these numbers to be true, then our arm gain according to the SRCL dither is 258.
Images attached to this report
Comments related to this report
gabriele.vajente@LIGO.ORG - 15:04, Tuesday 29 January 2019 (46694)

Some simulation work related to this measurement.

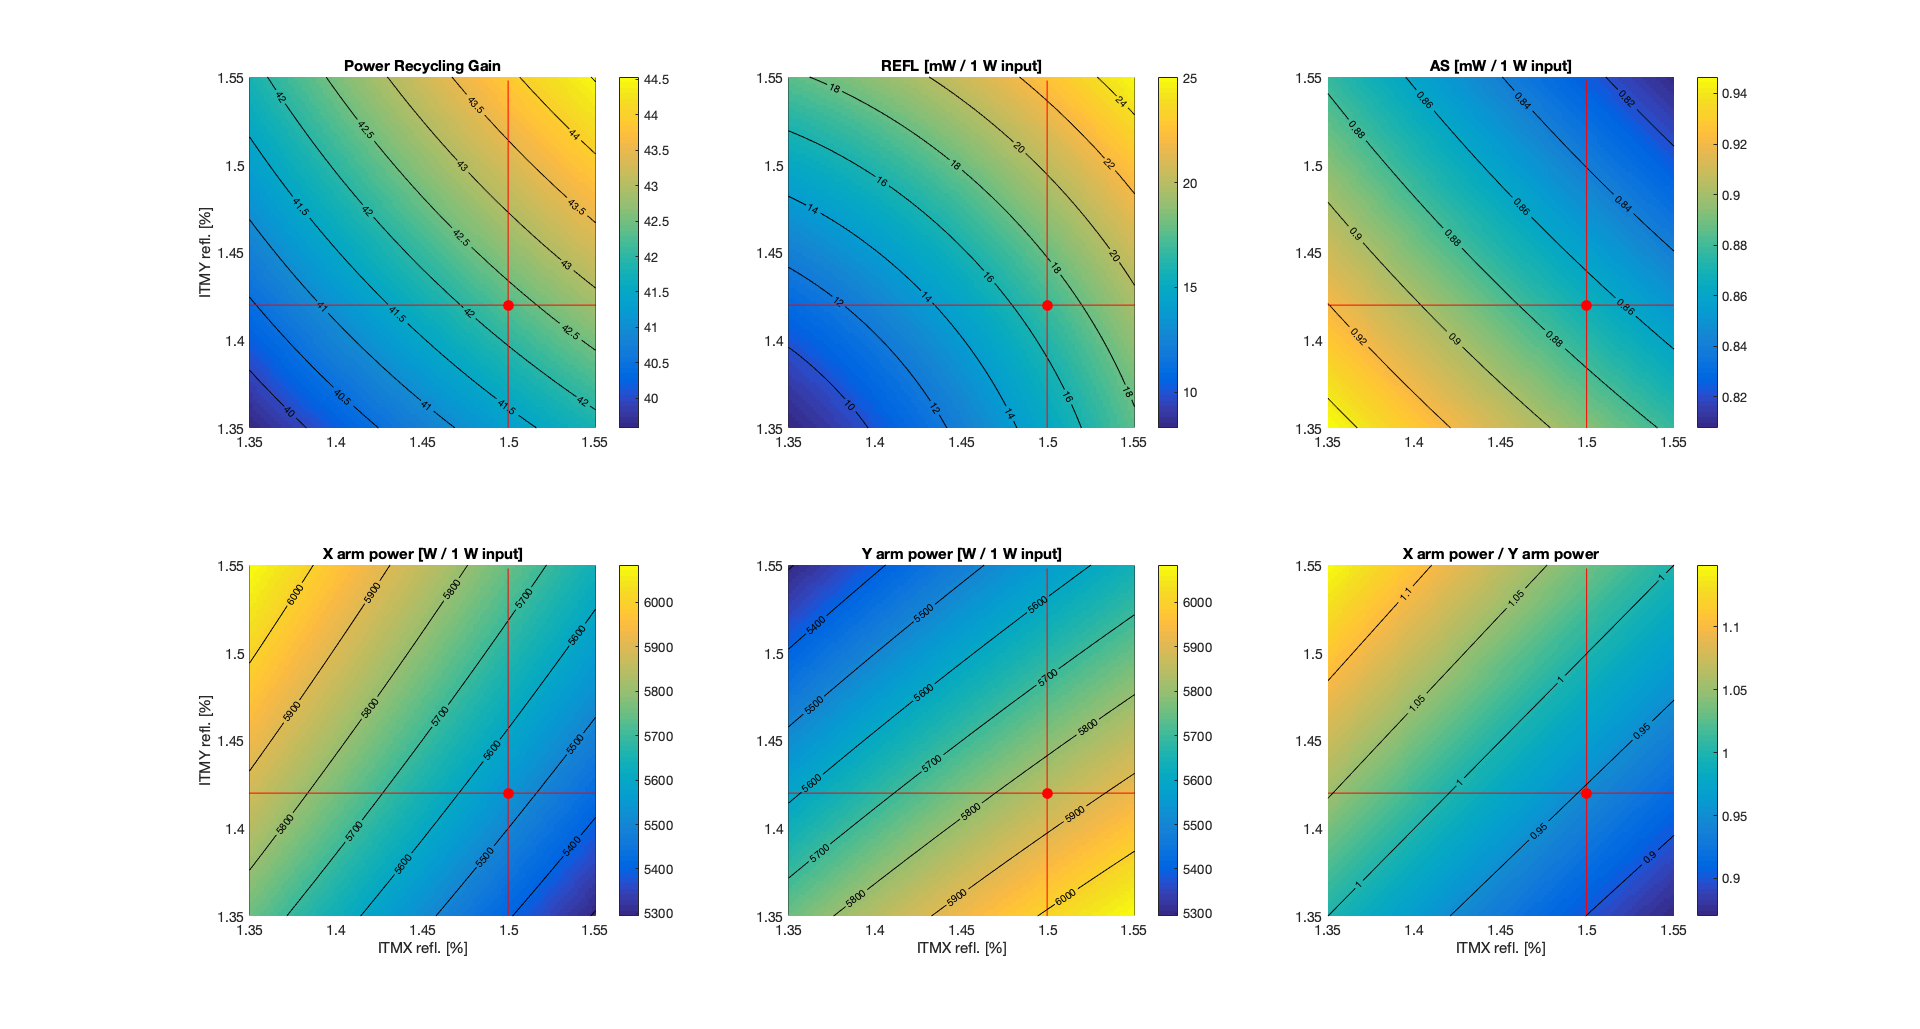
From galaxy, I find that LHO's ITMX (ITM07) has a reflectivity of R_ITMX = 1.50%, while LHO's ITMY (ITM11) has a reflectivity of 1.42%. So there's quite an imbalance there.

I set up a simple simulation, using only the TEM00 mode, so without including any mismatch. Each arm has about 92 ppm of total round trip losses, following Craig's estimate. The first plot below shows some powers as a function of the two ITM reflectivities. 


The red dot represent the nominal condition, which gives, for 1 W input power

PRG = 42.3
REFL = 17 mW (carrier only, TEM00, perfect matching)
AS = 0.9 mW (carrier only, TEM00m, perfect matching, nominal DARM offset of 1.2e-11 m
XARM = 5536 W
YARM = 5848 W
X/Y = 0.946 [more power in Y arm than X arm]

So there is more power in the Y arm than in the X arm, as one would expect since ITMY has higher reflectivity, so that the Y arm has higher finesse.

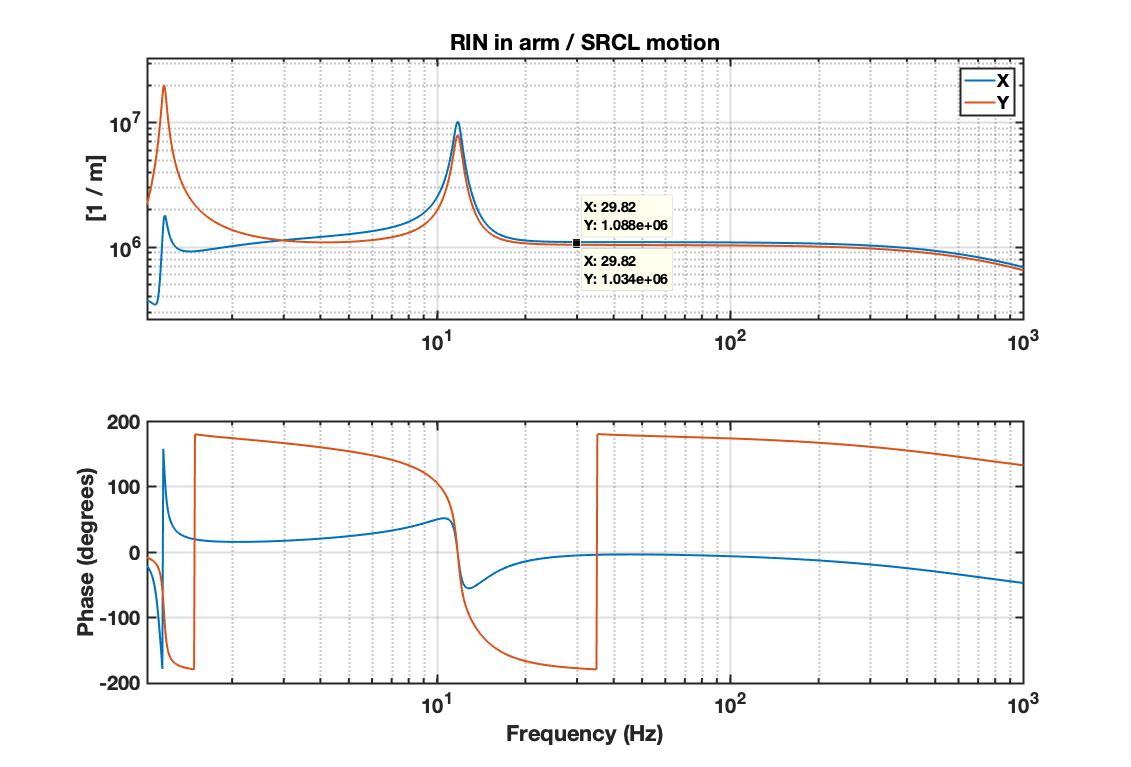
I also tried to reproduce more closely Craig's SRCL dither measurement. So in simulation, I computed the transfer function from SRCL motion to the RIN as measured in transmission of both arms. The plot below shows the simulated transfer functions RIN_ARM / SRCL for X and Y:


The numerical values are

RIN_X / SRCL_z = 1.088e6 /m
RIN_Y / SRCL_z = 1.034e6 /m

so (RIN_X / SRCL_z ) / (RIN_Y / SRCL_z) = 1.052. This is the ratio of powers, since the simulated transfer functions from SRCL to powers are equal for both X and Y, so the transfer functions to RIN are scaled by the inverse of the power. 

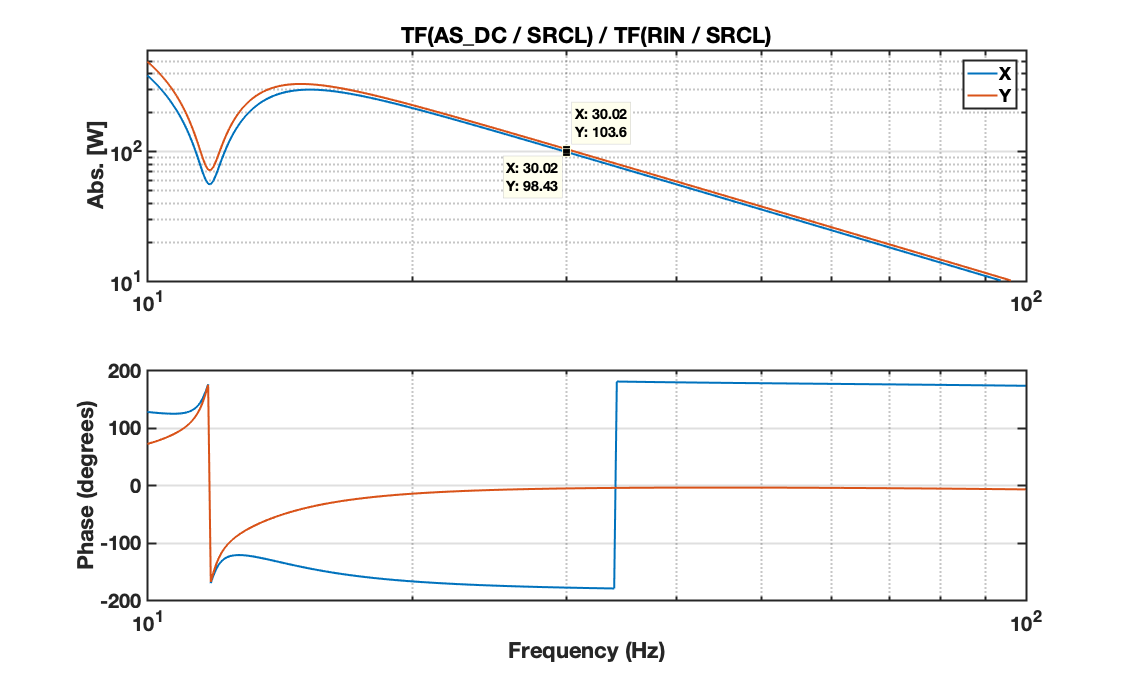
Craig's measurement is actually the transfer function DARM / RIN while injecting on SRCL. In simulation, I used the AS port power as a proxy for DARM and computed the transfer functions TF(AS_DC / SRCL) and TF(RIN / SRCL). Then the equivalent of Craig's DARM / X and DARM / Y should be, at 30 Hz,

TF(AS_DC /  SRCL) / TF(RIN_X / SRCL) = 98.4 W
TF(AS_DC /  SRCL) / TF(RIN_Y / SRCL) = 103.6 W

and the frequency dependency is shown in the plot below (1/f^2 as expected).


So the equivalent of Craig's ratio (DARM / Y) / (DARM / X) should be 

[ TF(AS_DC /  SRCL) / TF(RIN_Y / SRCL) ] / [ TF(AS_DC /  SRCL) / TF(RIN_X / SRCL) ] = 103.6 / 98.4 = 1.053

which is greater than one as in Craig's measurement, but corresponds to the ratio POWER_Y / POWER_X. 

So the conclusion from my simulation is that the ITM different reflectivities gives a ratio of TF (as measured by Craig) greater than 1, which corresponds to higher power in the Y arm than in the X arm (the opposite of what Craig's concluded...)


Images attached to this comment
craig.cahillane@LIGO.ORG - 17:17, Tuesday 29 January 2019 (46698)
I didn't know that the ITMs were not the same reflectivity.  This is absolutely mind-blowing information.
I reported higher arm power in the Y arm before, from the HEPI measurement.  
The RIN/SRCL TF corresponds to Equation 12 here.  It is not dependent on the arm power at all, but rather the optical response γ of each arm to the SRCL dither.
Also, the DARM/RIN TF in Equations 20 and 21 also indicate that DARM/RIN = 4*Parm/(m c ω2), so I made a mistake last night.
gabriele.vajente@LIGO.ORG - 20:41, Tuesday 29 January 2019 (46700)

Good that the measurement and the prediction agree that there is more power in Y than in X.

Now we have to figure out why the measurement gives 8% imbalance while from the ITM reflectivities we only get 5%.

gabriele.vajente@LIGO.ORG - 16:50, Wednesday 30 January 2019 (46710)

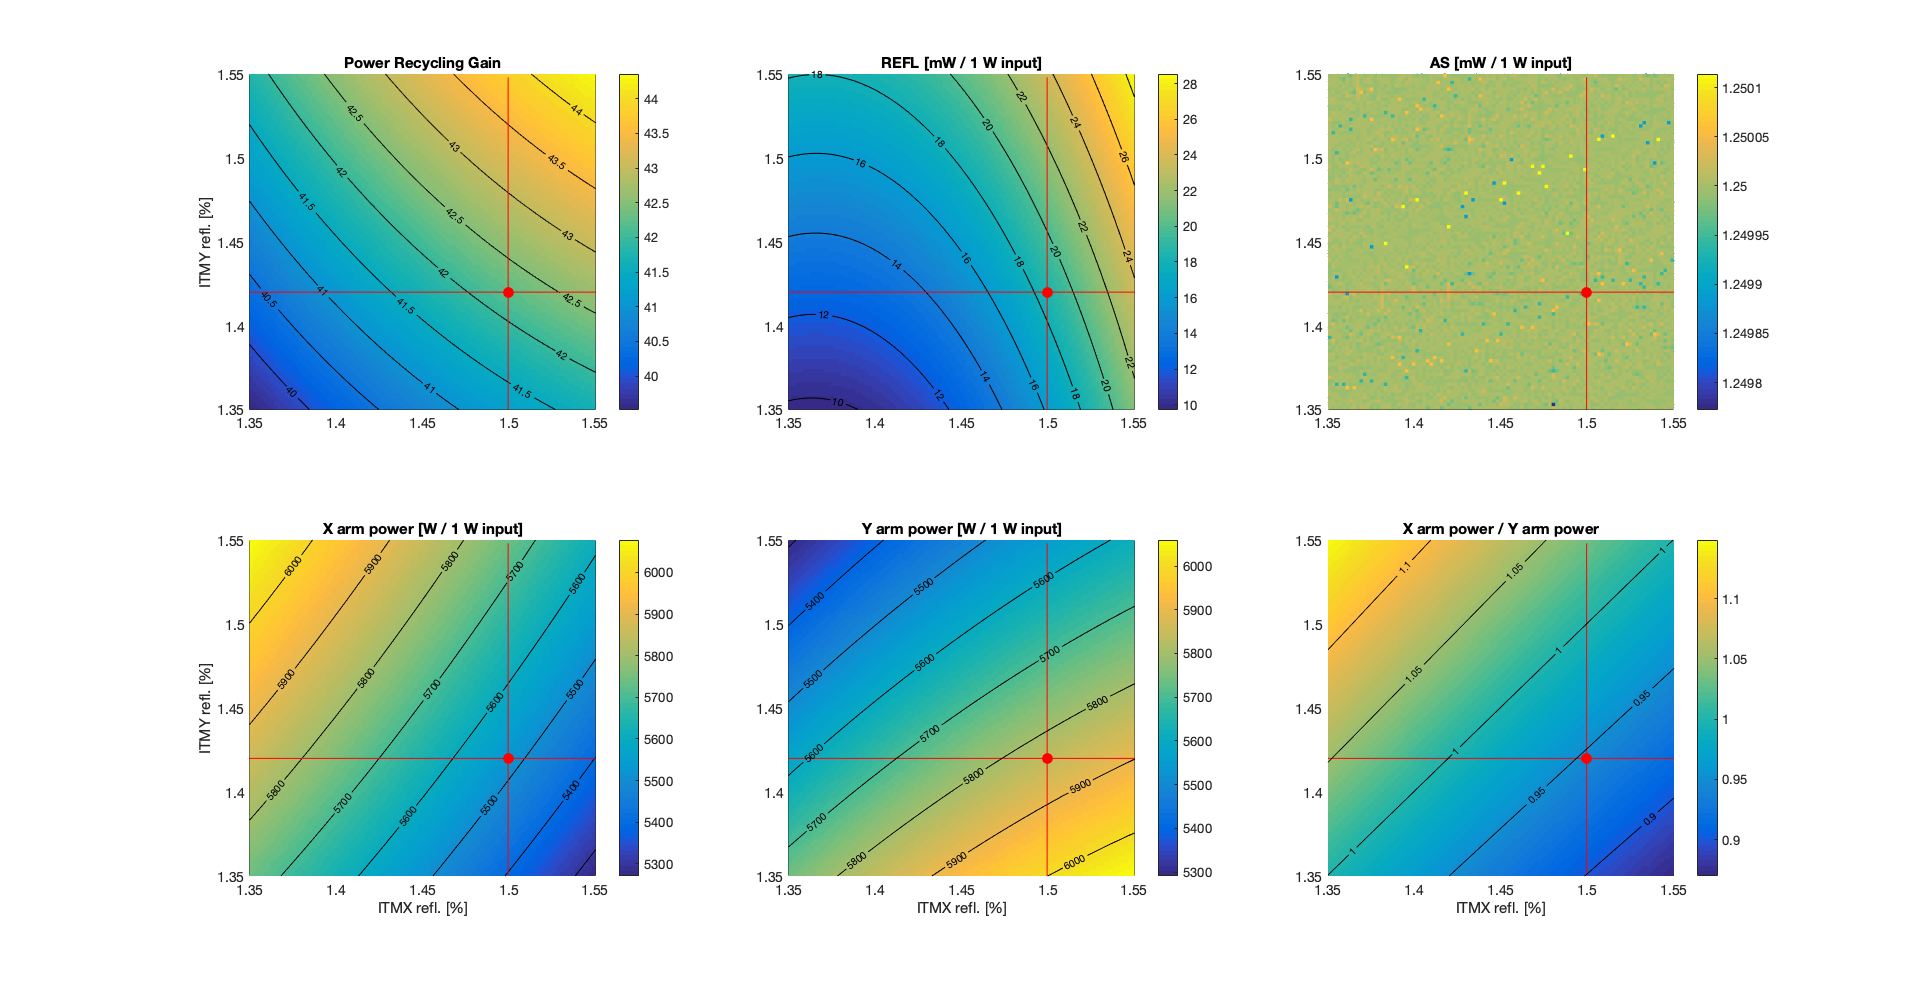
Updated simulation: 

  1. added higher order modes (n+m<=10), measured test mass radii of curvature
  2. locked DARM to have an AS power that corresponds to 20 mA at 26 W input power (1.25 mW on the OMC transmission for 1 W input)

No change in the conclusions. Same imbalance of the arm powers as before (about 5%) 


Images attached to this comment
gabriele.vajente@LIGO.ORG - 09:43, Thursday 31 January 2019 (46720)

Adding the substrate lenses do not change significantly the power imbalance. 

ITMX: static lens -310km, thermal lens +770km
ITMY: static lens +570kn, thermal lens +350km

gabriele.vajente@LIGO.ORG - 14:46, Friday 01 February 2019 (46749)

Follow up to the discussion at today's commissioning call.

I computed the transfer function from laser relative intensity noise at the IFO input (called rin below) to DARM (calibrated in meters). 

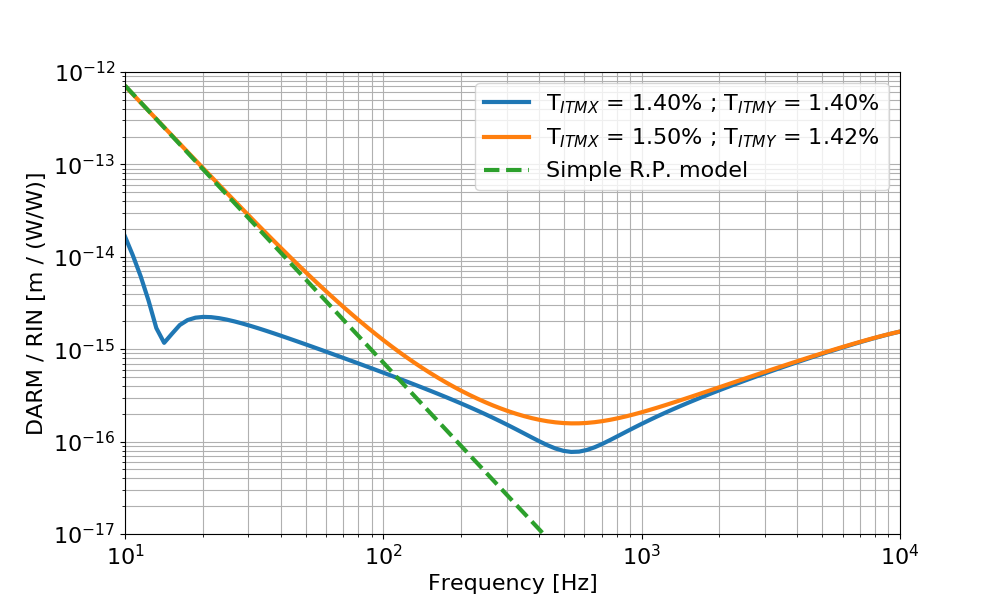
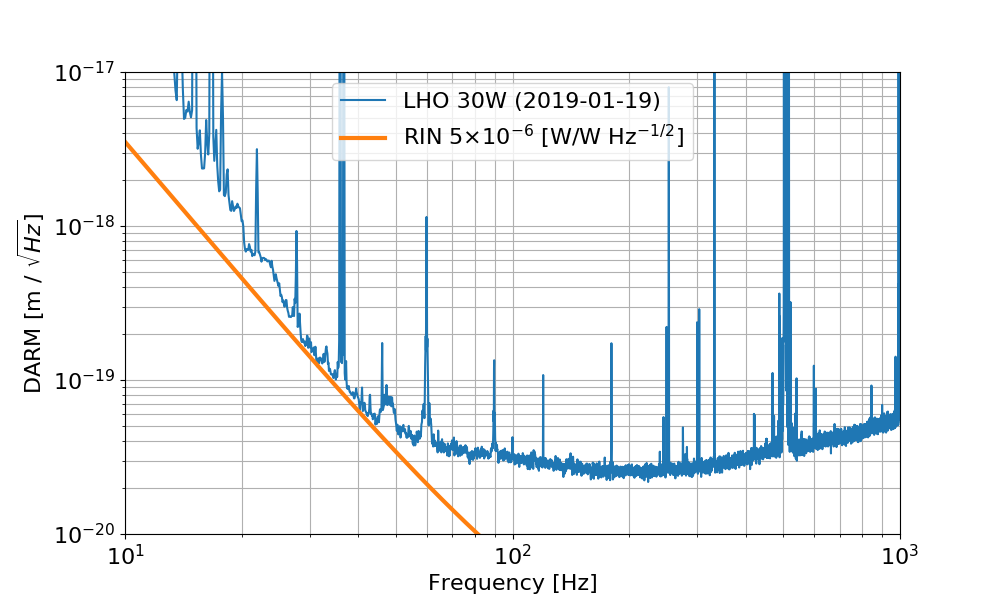
The input power is 26 W, and the round trip losses are adjusted to get a recycling gain of about 42. In the blue trace below, the two ITMs have the same reflectivity, equal to the nominal value of 1.4%. In the orange trace the two ITMs have different reflectivities, ITMX = 1.50% and ITMY = 1.42%, from the measured values from galaxy. This is the same configuration used in the other simulations, that gives a 5% power imbalance. 

The dashed green curve is a simple radiation pressure model according to the equation below:


where RIN_arm / RIN_input is basically the double cavity pole (since input RIN is filtered by this transfer function. I used the simulated result), Delta P is the DC power difference in the arms ( Y - X = 7.7 kW) and m is the mirror mass. This matches quite well the low frequency simulation.


Using the simulated transfer function I can see what level of RIN at the IFO input would limit the sensitivity. It turns out that one needs a RIN of about 5e-6 (W/W)/rHz. 


Images attached to this comment
gabriele.vajente@LIGO.ORG - 11:18, Monday 04 February 2019 (46759)

I found a mistake in my previous RIN simulation (many thanks to Matt Evans for spotting the inconsistency). Here's the correct results and plots.

Follow up to the discussion at today's commissioning call.

I computed the transfer function from laser relative intensity noise at the IFO input (called rin below) to DARM (calibrated in meters). 

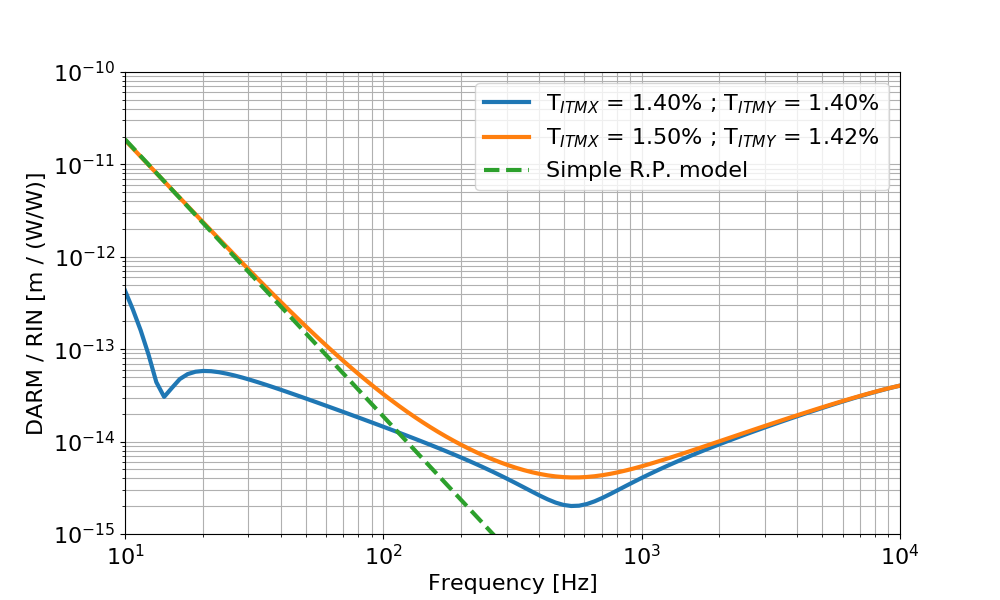
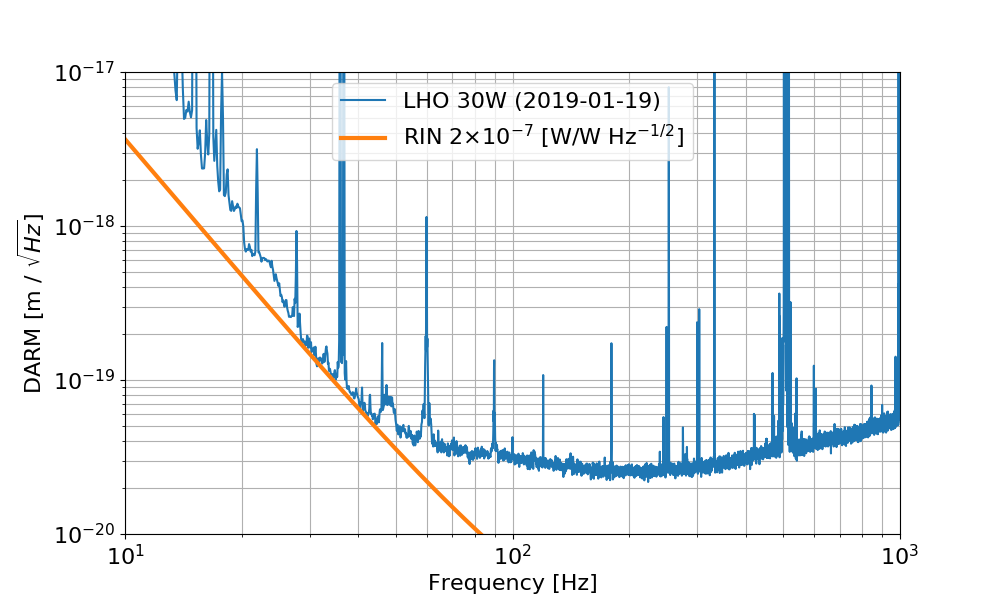
The input power is 26 W, and the round trip losses are adjusted to get a recycling gain of about 42. In the blue trace below, the two ITMs have the same reflectivity, equal to the nominal value of 1.4%. In the orange trace the two ITMs have different reflectivities, ITMX = 1.50% and ITMY = 1.42%, from the measured values from galaxy. This is the same configuration used in the other simulations, that gives a 5% power imbalance. 

The dashed green curve is a simple radiation pressure model according to the equation below:


where RIN_arm / RIN_input is basically the double cavity pole 0.6Hz/fr (since input RIN is filtered by this transfer function), Delta P is the DC power difference in the arms ( Y - X = 7.7 kW) and m is the mirror mass. This matches quite well the low frequency simulation.

Using the simulated transfer function I can see what level of RIN at the IFO input would limit the sensitivity. It turns out that one needs a RIN of about 2e-7 (W/W)/rHz


Images attached to this comment
matthew.evans@LIGO.ORG - 15:35, Monday 04 February 2019 (46772)

Doesn't this 2e-7 /rtHz RIN seem dangerously close to the measured value at 30Hz?

sheila.dwyer@LIGO.ORG - 20:49, Monday 04 February 2019 (46780)

The intensity noise projection in the noise budget is made by injecting into the ISS second loop.  It shows that the intensity noise is not close to DARM.  45828


H1 SQZ (SQZ)
nutsinee.kijbunchoo@LIGO.ORG - posted 23:00, Monday 28 January 2019 - last comment - 18:14, Wednesday 30 January 2019(46679)
CLF noise at various power

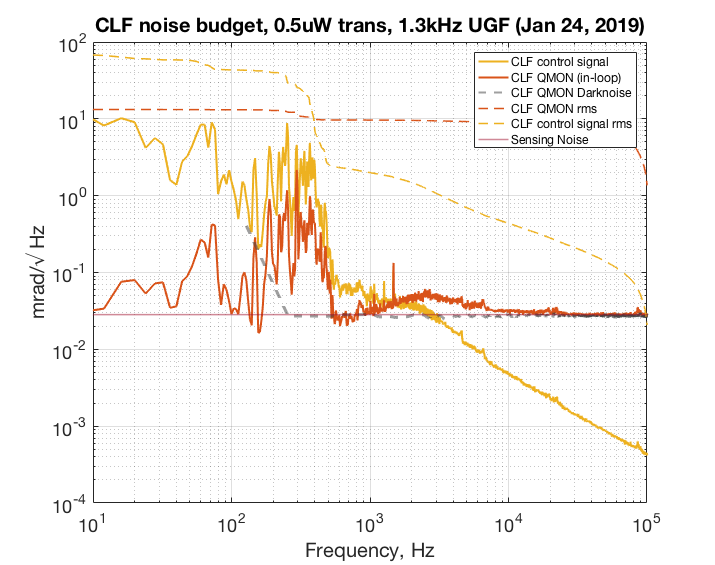
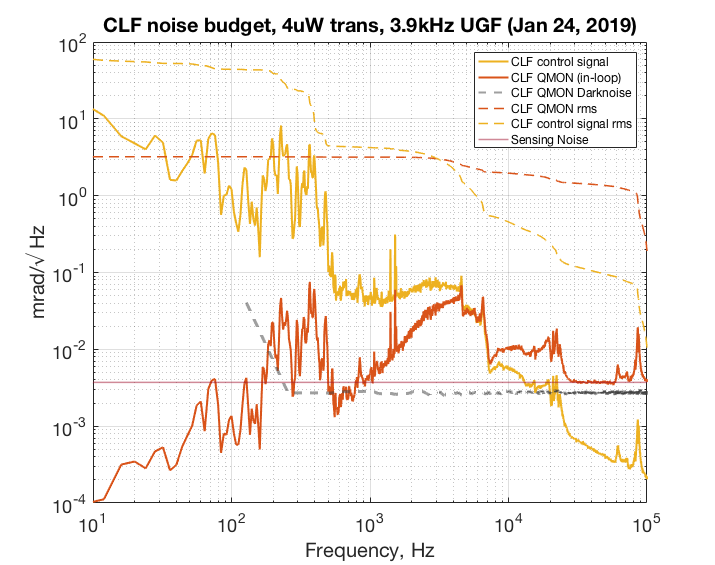
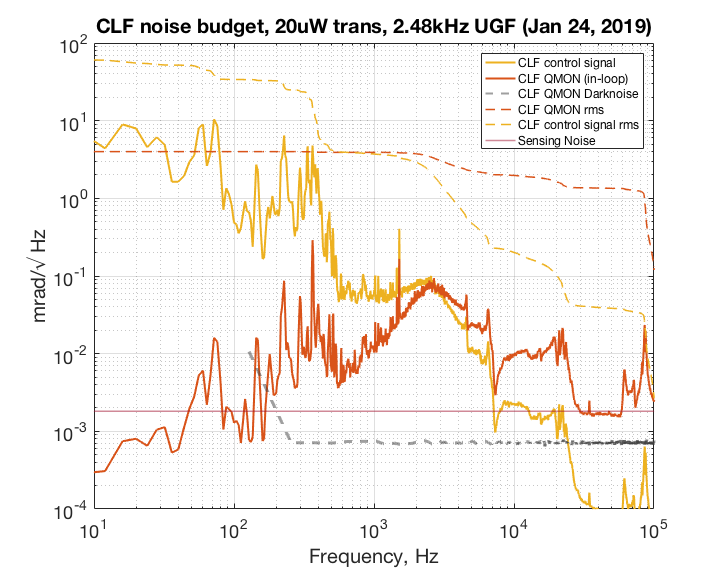
Daniel, Nutsinee

We will later be using this information to calculate the overall phase noise contribution from CLF and what is the best power to operate when injected into the IFO. But for now these plots are just showing noise at various CLF power. At 1X power (0.5 uW CLF transmitted) we are mostly limited by sensing noise. At 10X (4uW transmitted) and 60X (20uW transmitted) power we cleared the sensing noise for the most part. The UGF for 10X and 60X measurement were chosen where the phase margin is ~30deg. The UGF for 1X measurement were chosen simply because we begin to be sensing noise limited right around there. In all case the suppressed CLF signal hangs around 3mrad. 

The RF amplifier (minicircuits ZFL-500LN) was taken out during 60X power measurement. The calibration factor is a bit lower than what we would expected even taken the factor of 25 of the RF amp into account. That part is still unclear why. The manual suggests a gain of ~25 at 3MHz.

The shotnoise was calibrated using a halogen light bulb. By subtracting DN from combined DN SN in quadrature we recover SN which we use to calibrate the RF transimpedance. 


Images attached to this report
Non-image files attached to this report
Comments related to this report
terry.mcrae@LIGO.ORG - 09:24, Tuesday 29 January 2019 (46685)

Just to clarify these CLF noise measurements were taken with the "old" locking scheme, where the OPO is used as the reference (not the PSL reference cavity).

daniel.sigg@LIGO.ORG - 18:14, Wednesday 30 January 2019 (46712)

Errata: The shown uW are half of the actual uW.

Not surprisingly, the forest below 1 kHz is due to acoustic couplings (most likely to the fiber). The attached plot shows the coherence between the CLF controls signal and the accelerometer on ISCT6. The noise above 1 kHz is still a mystery.

Non-image files attached to this comment
H1 PSL (ISC)
jenne.driggers@LIGO.ORG - posted 14:28, Thursday 24 January 2019 - last comment - 06:44, Thursday 31 January 2019(46626)
FSS noisy sometimes??

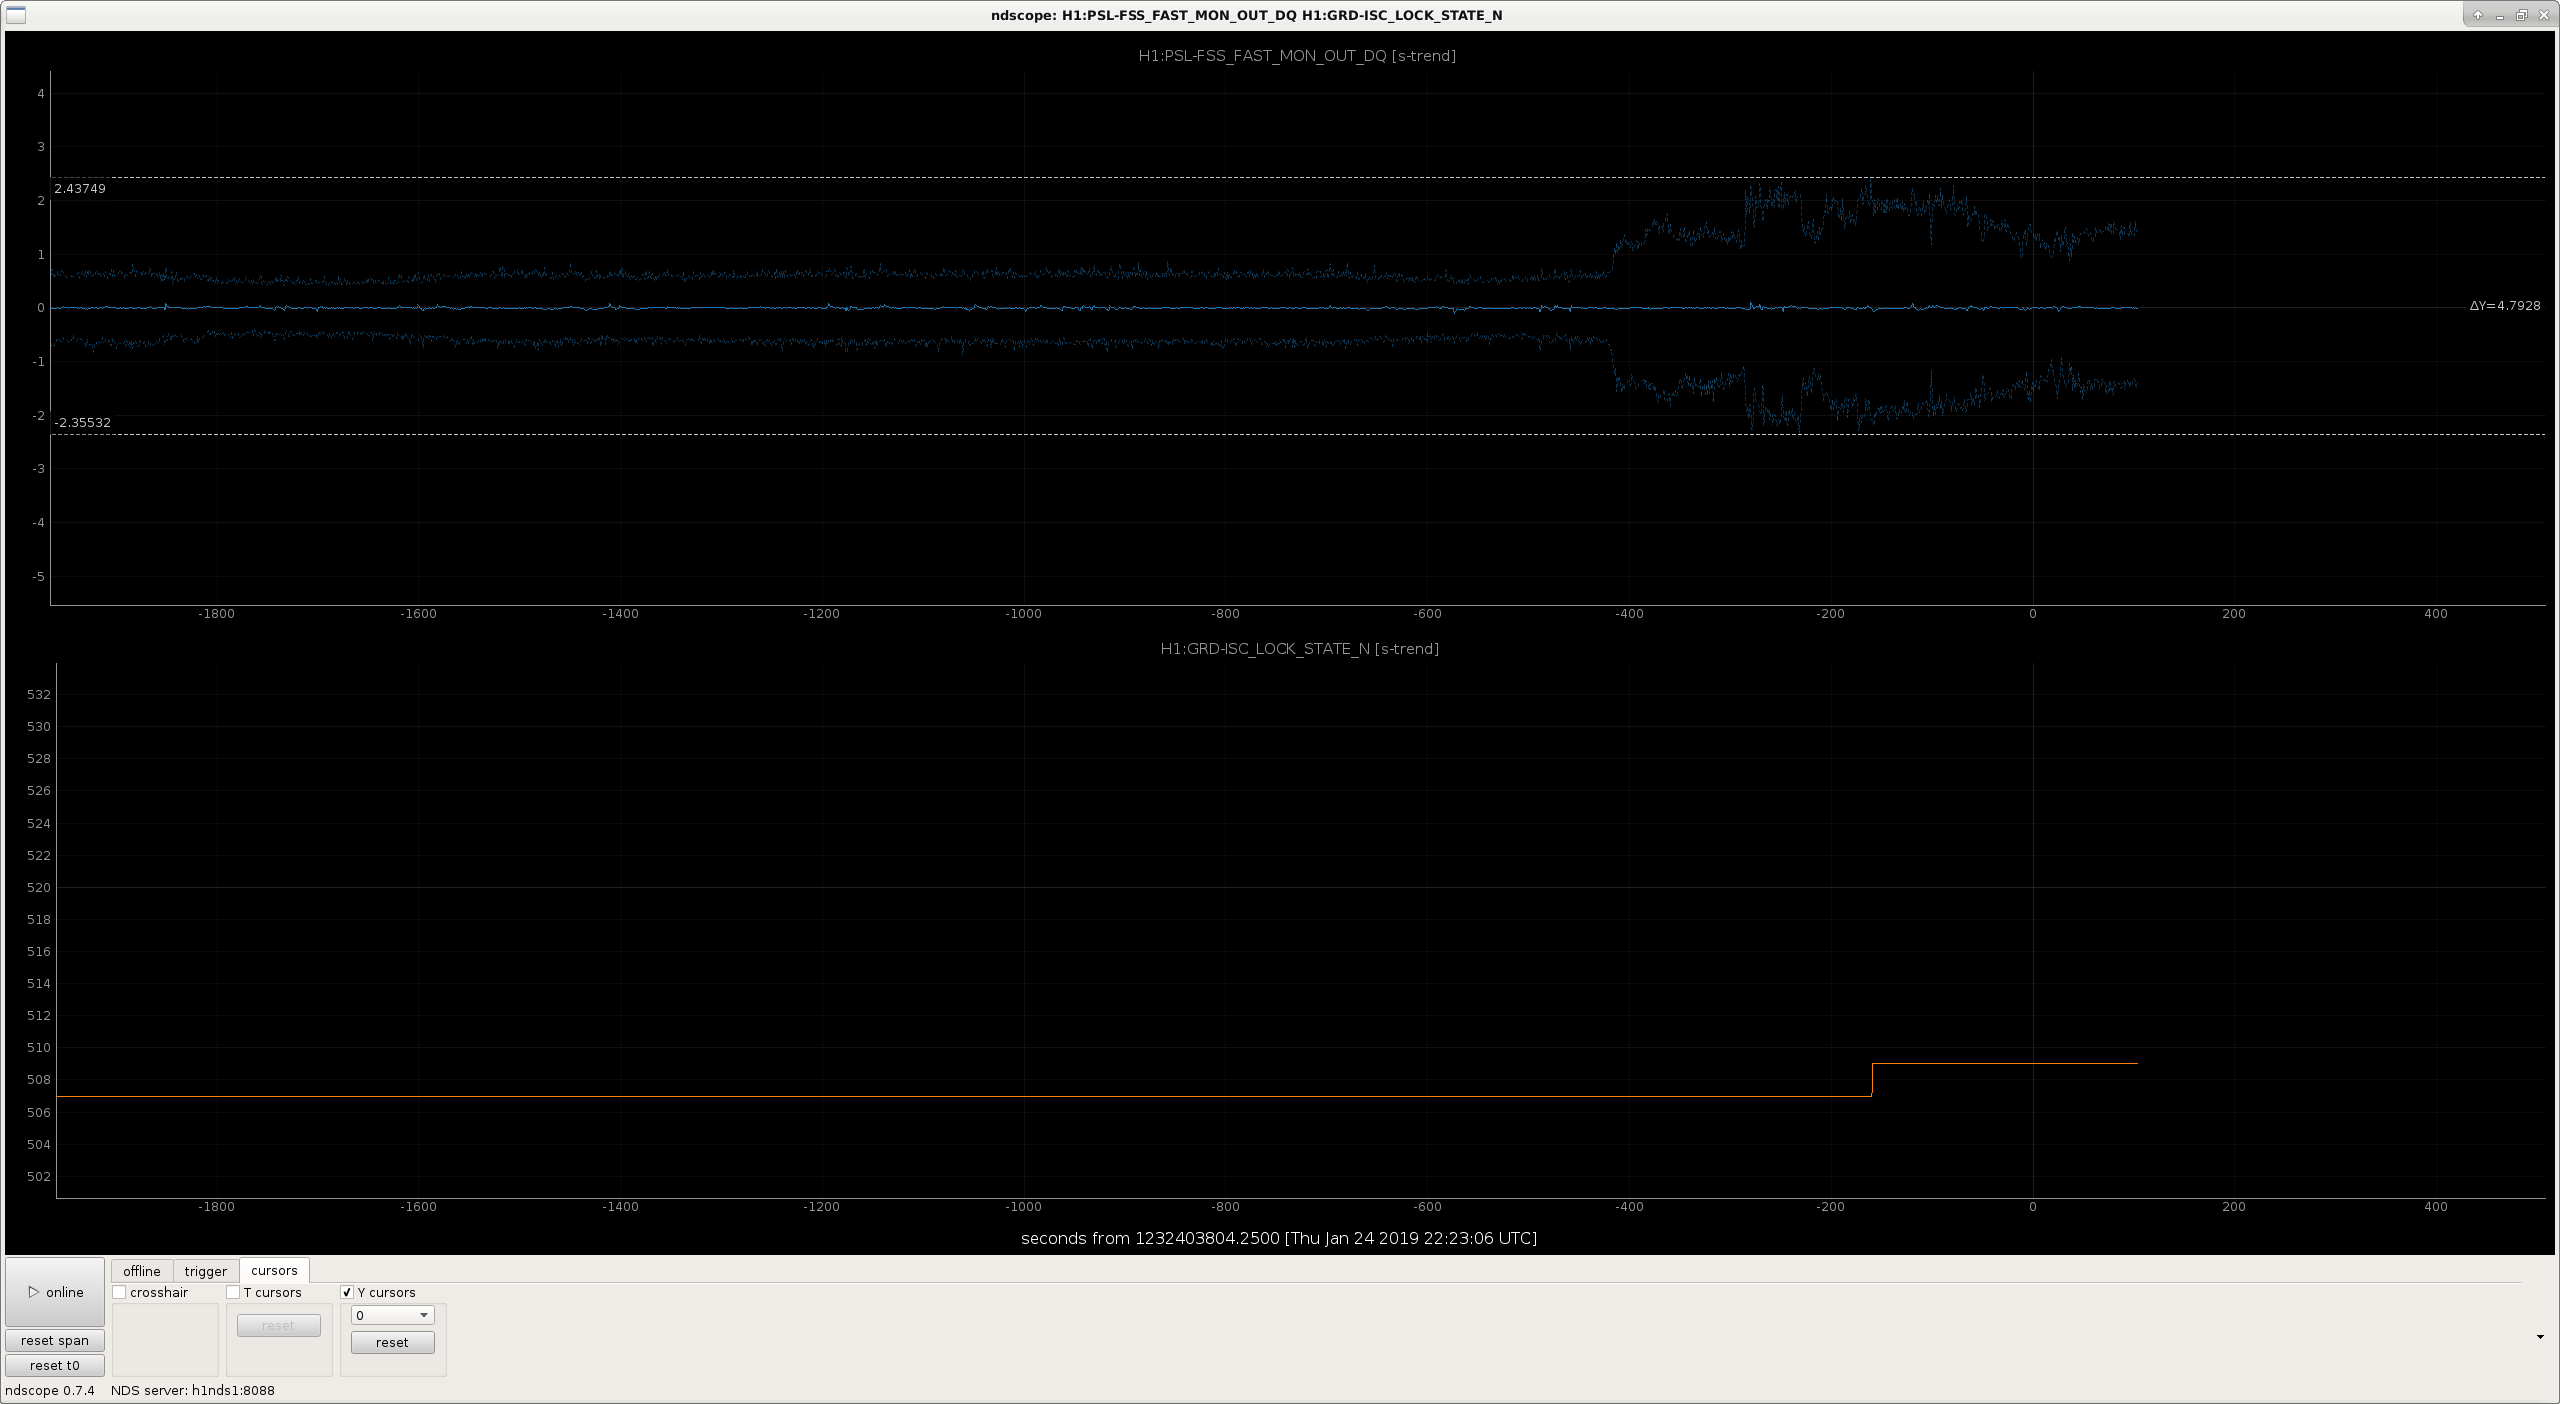
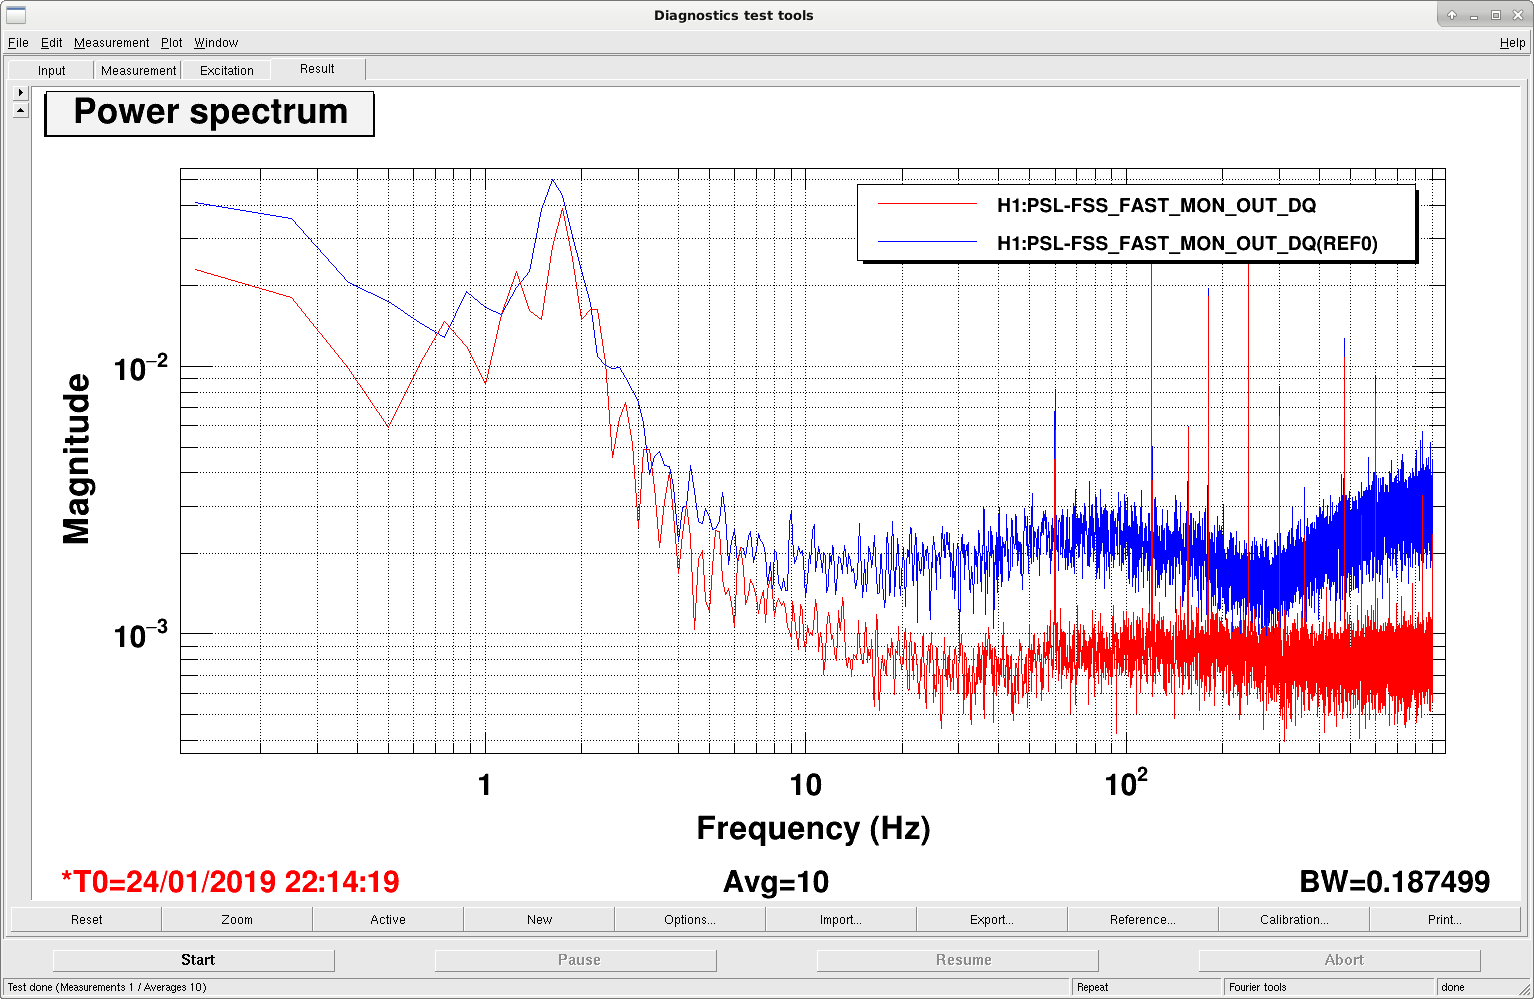
Sometimes it seems like the FSS gets noisy, and I don't think anything else is happening in the IFO.

I caught it happening again, and am posting a quick time series and spectrum to show that it's definitely changing.  Does anyone in PSL-land know what this might be?  Perhaps (as Sheila suggests) someone could take a look at PSL PEM sensors to see if anything changed in there?

Images attached to this report
Comments related to this report
jason.oberling@LIGO.ORG - 12:24, Friday 25 January 2019 (46639)DetChar

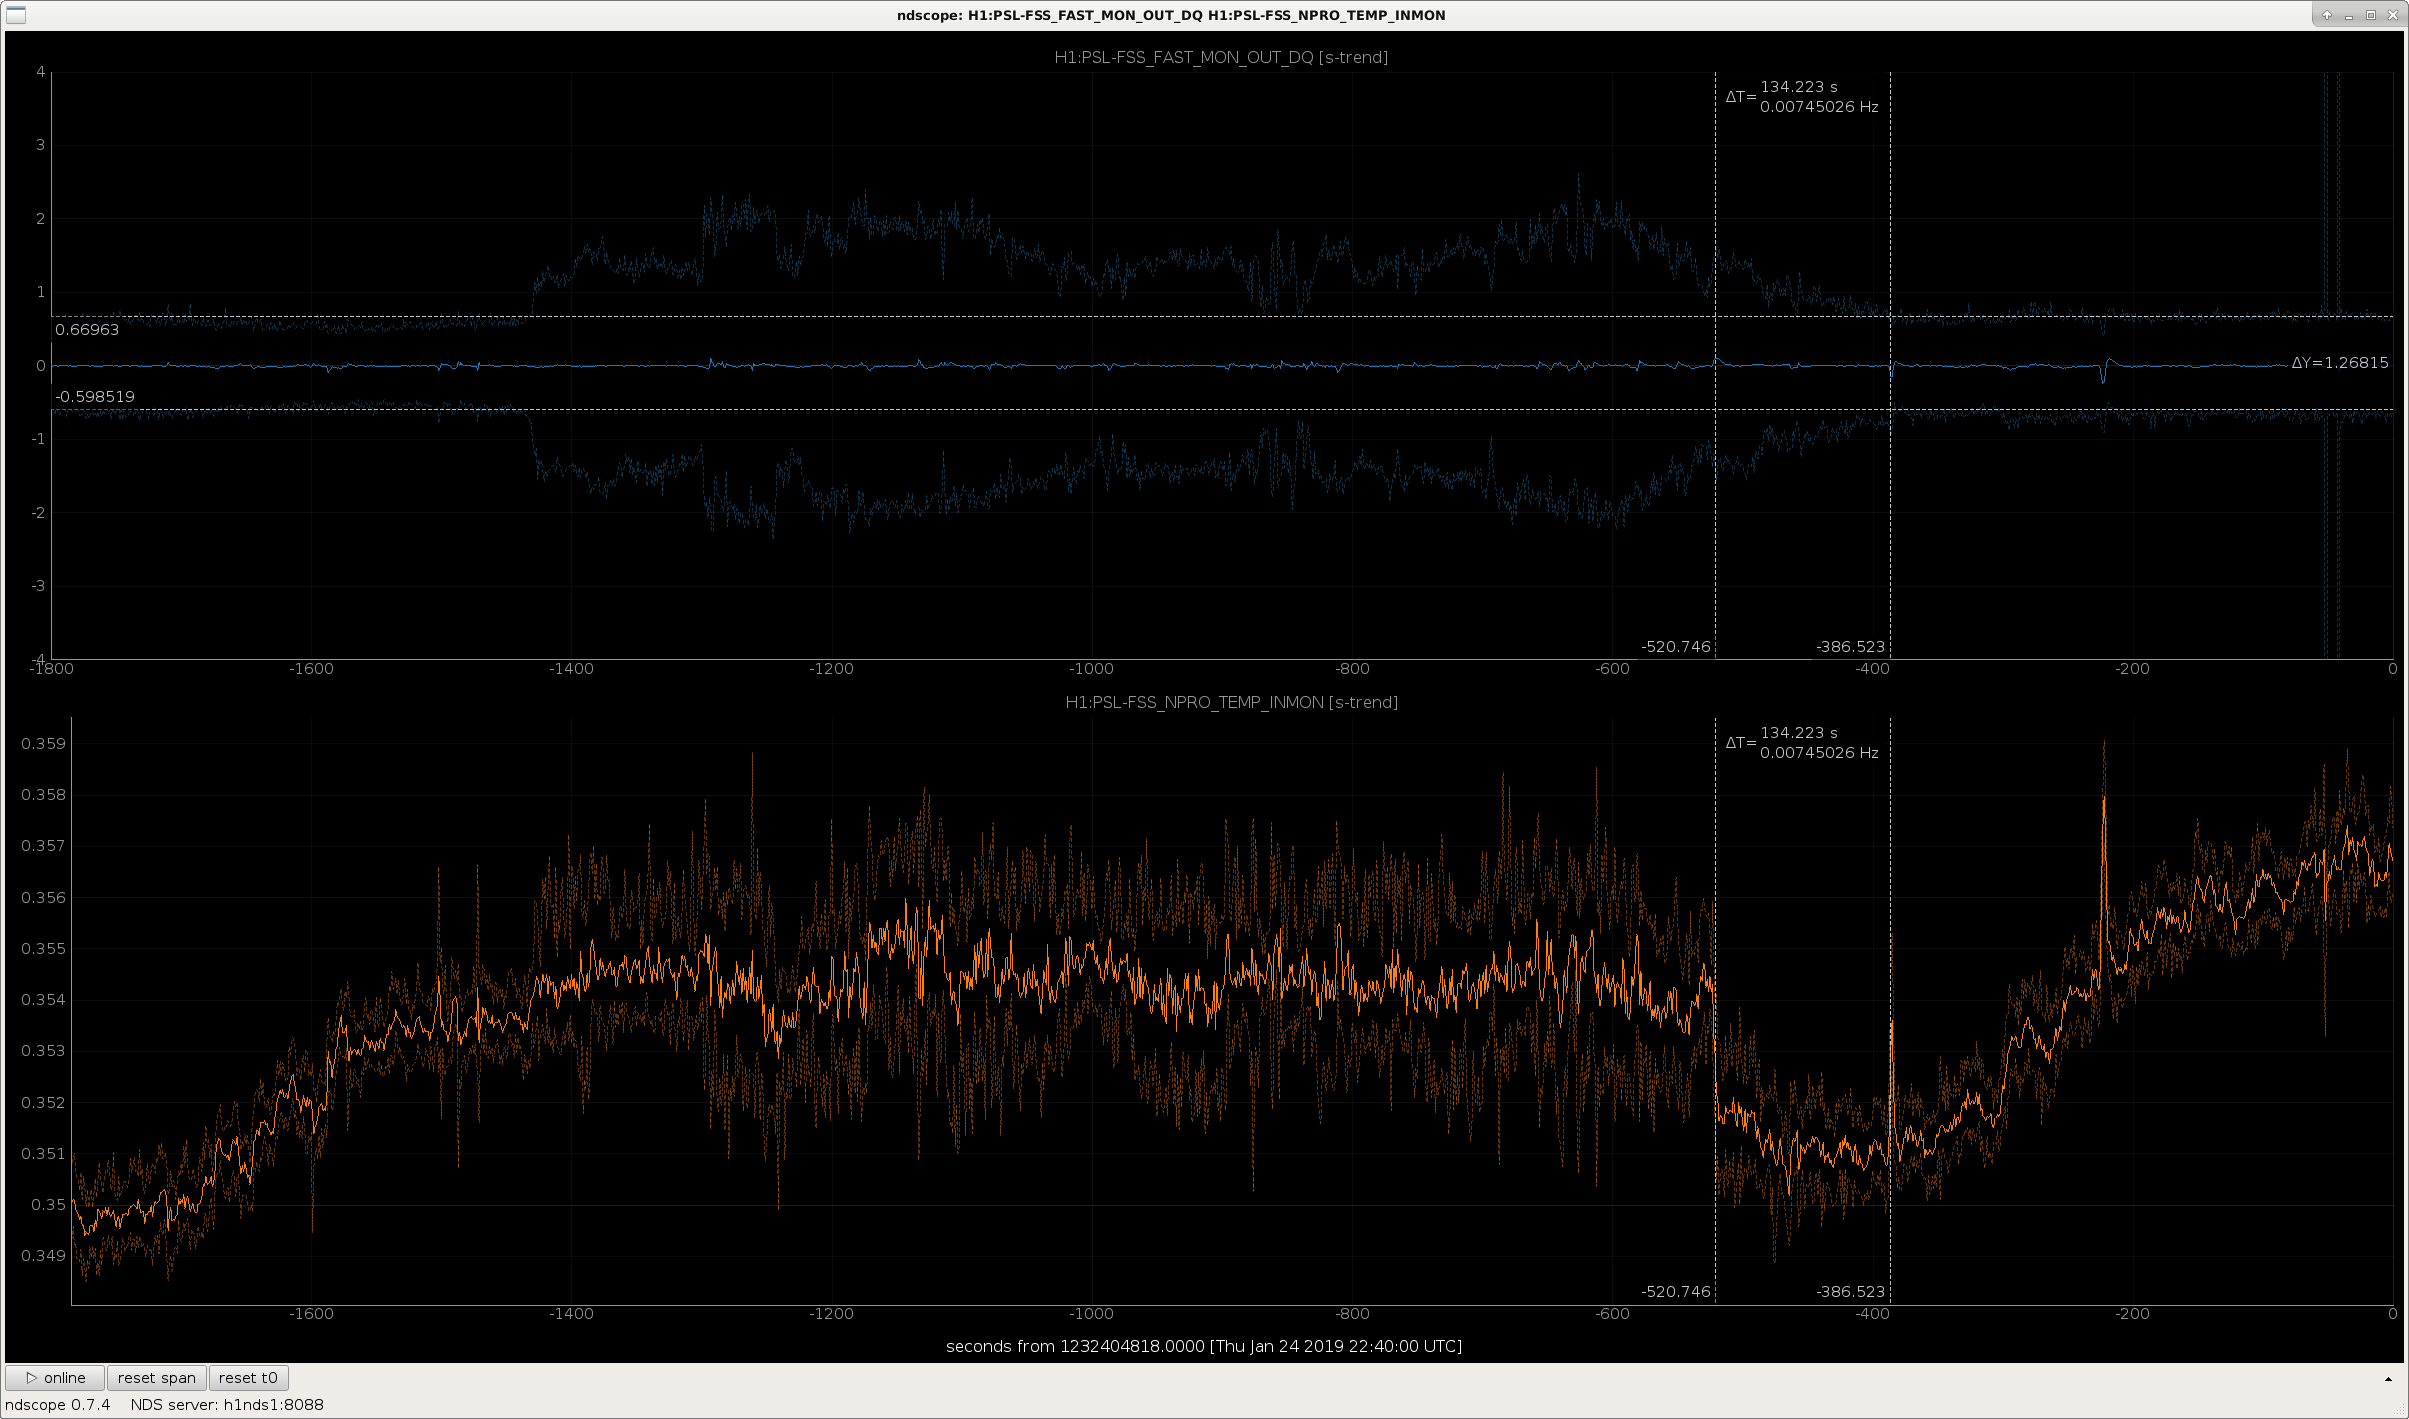
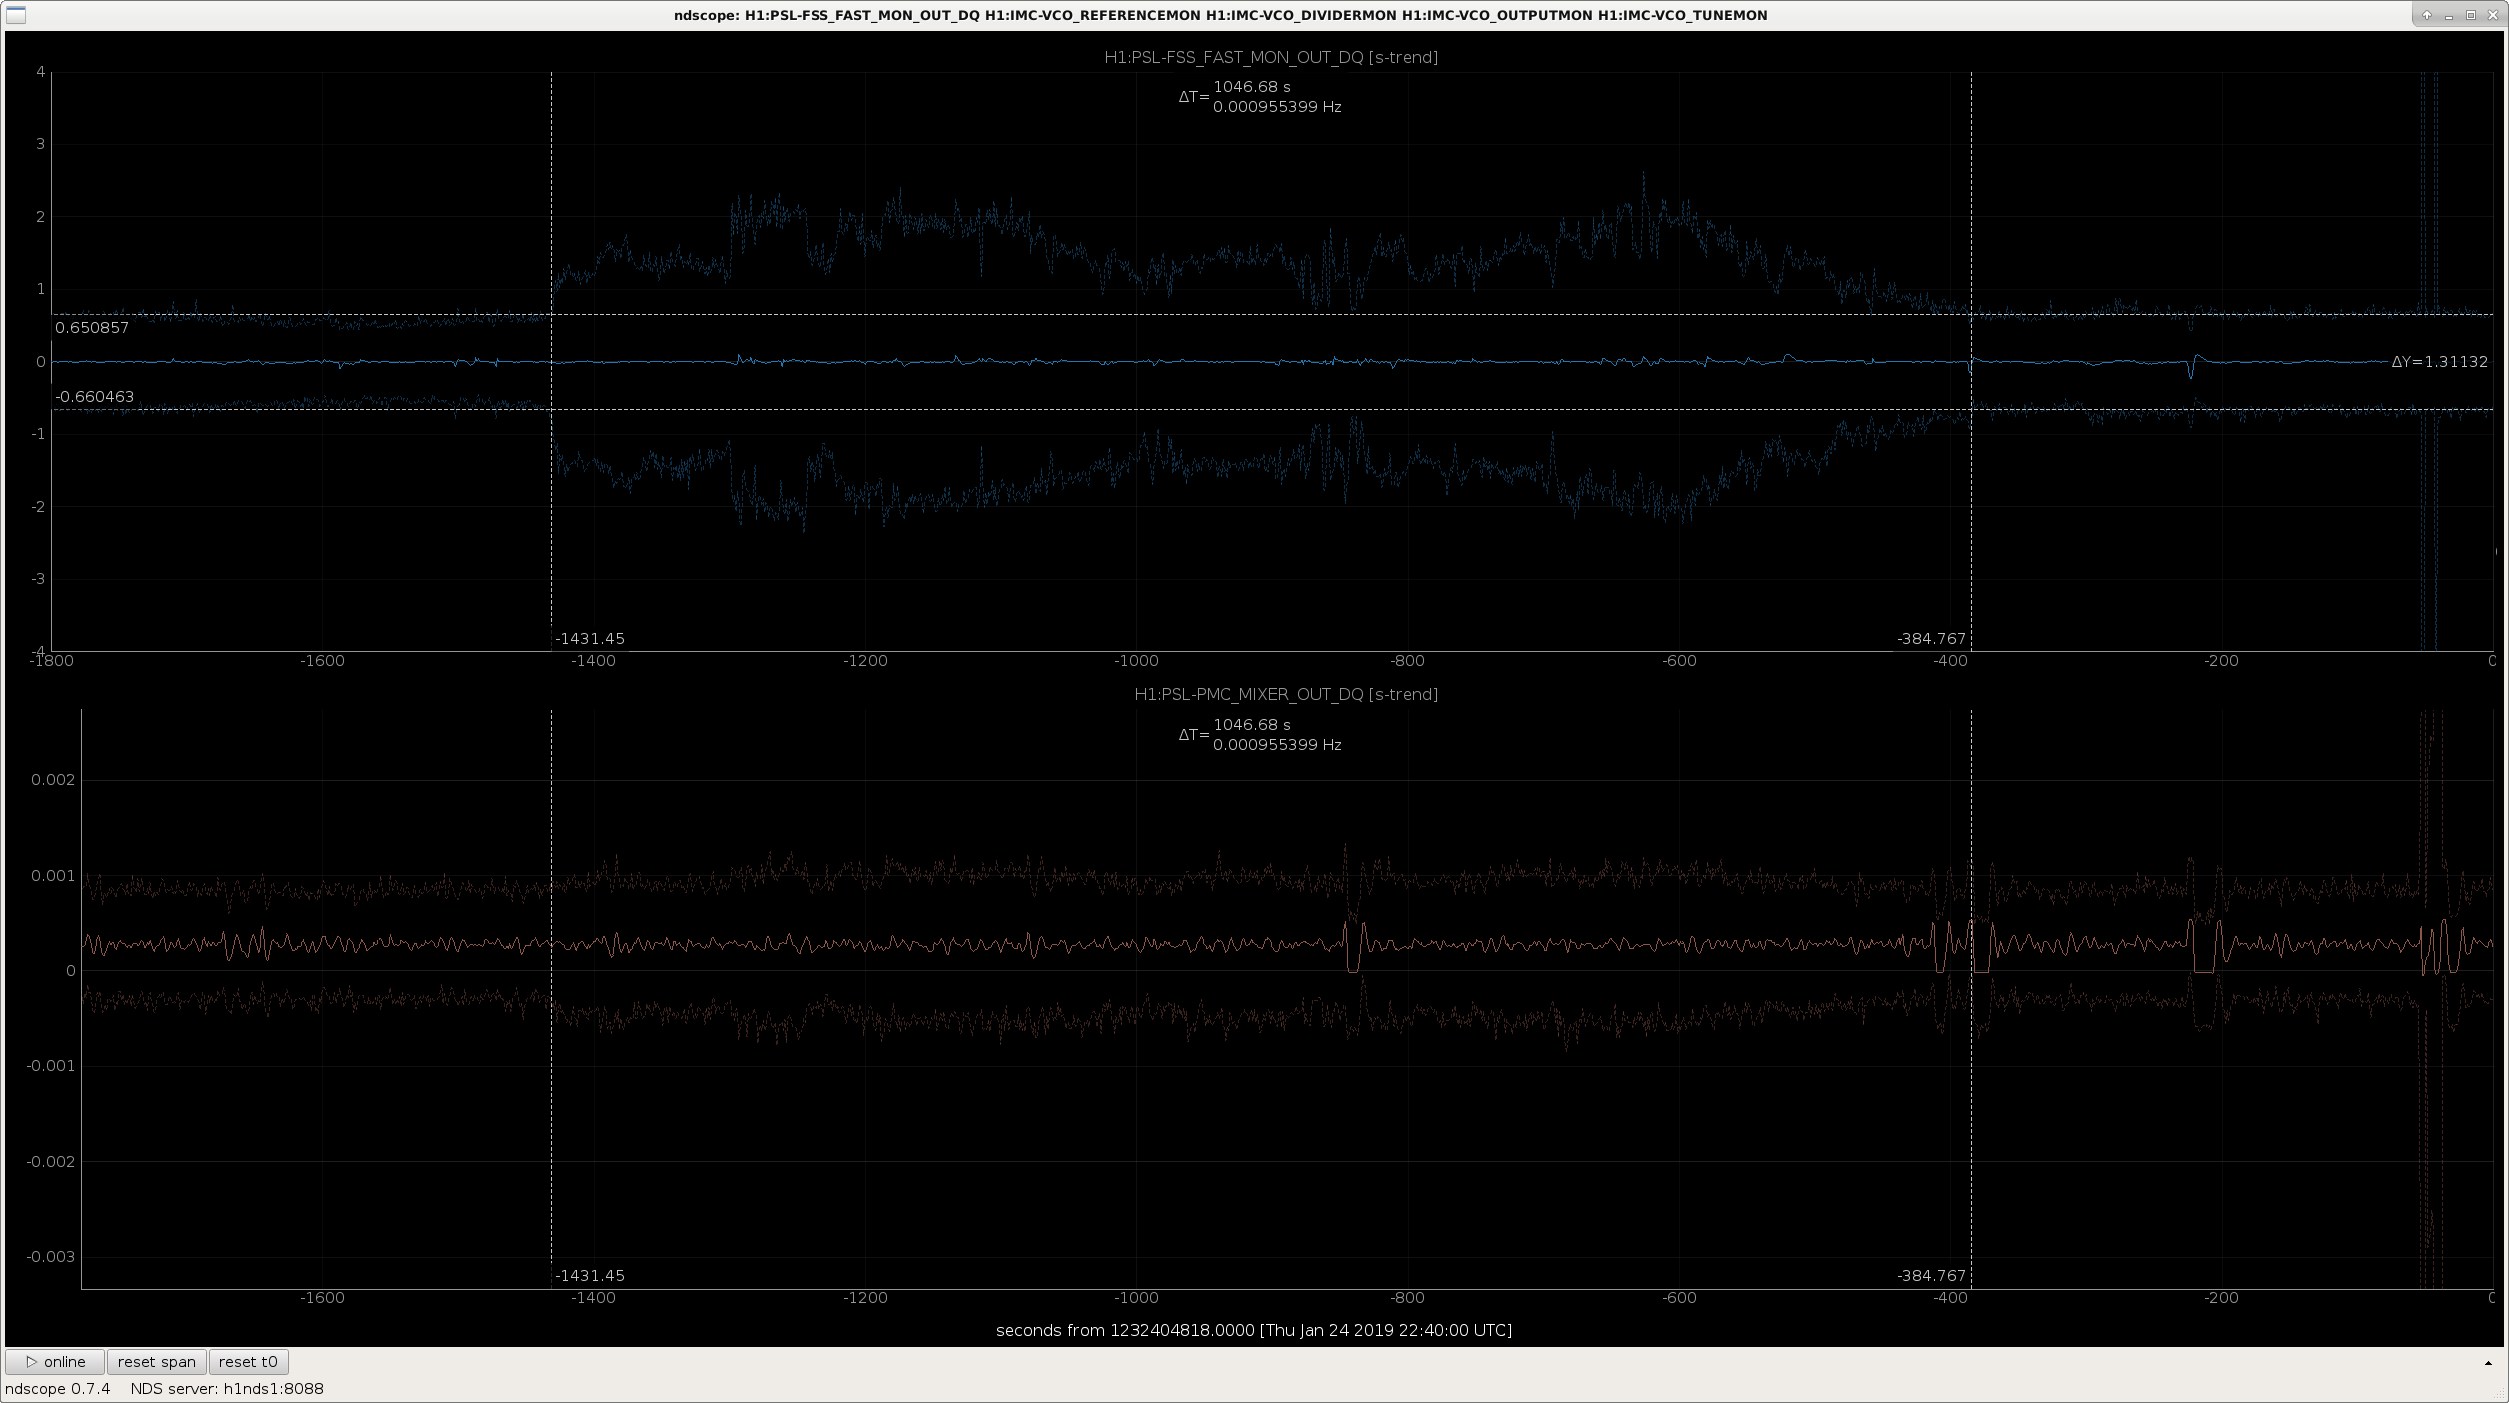
First attachment contains the 2 FSS control channels, the NPRO PZT (fast) and the NPRO crystal temperature (slow), and covers the entire period of the noise "event" Jenne notes above.  As can be seen the noise is visible in both channels (not entirely surprising) and lasts for ~1047 seconds.  ~134 seconds before the NPRO PZT returns to its usual peak-to-peak swings, the NPRO crystal temperature sees a small downward jump and then slowly returns to its normal peak-to-peak behavior over those 134 seconds.

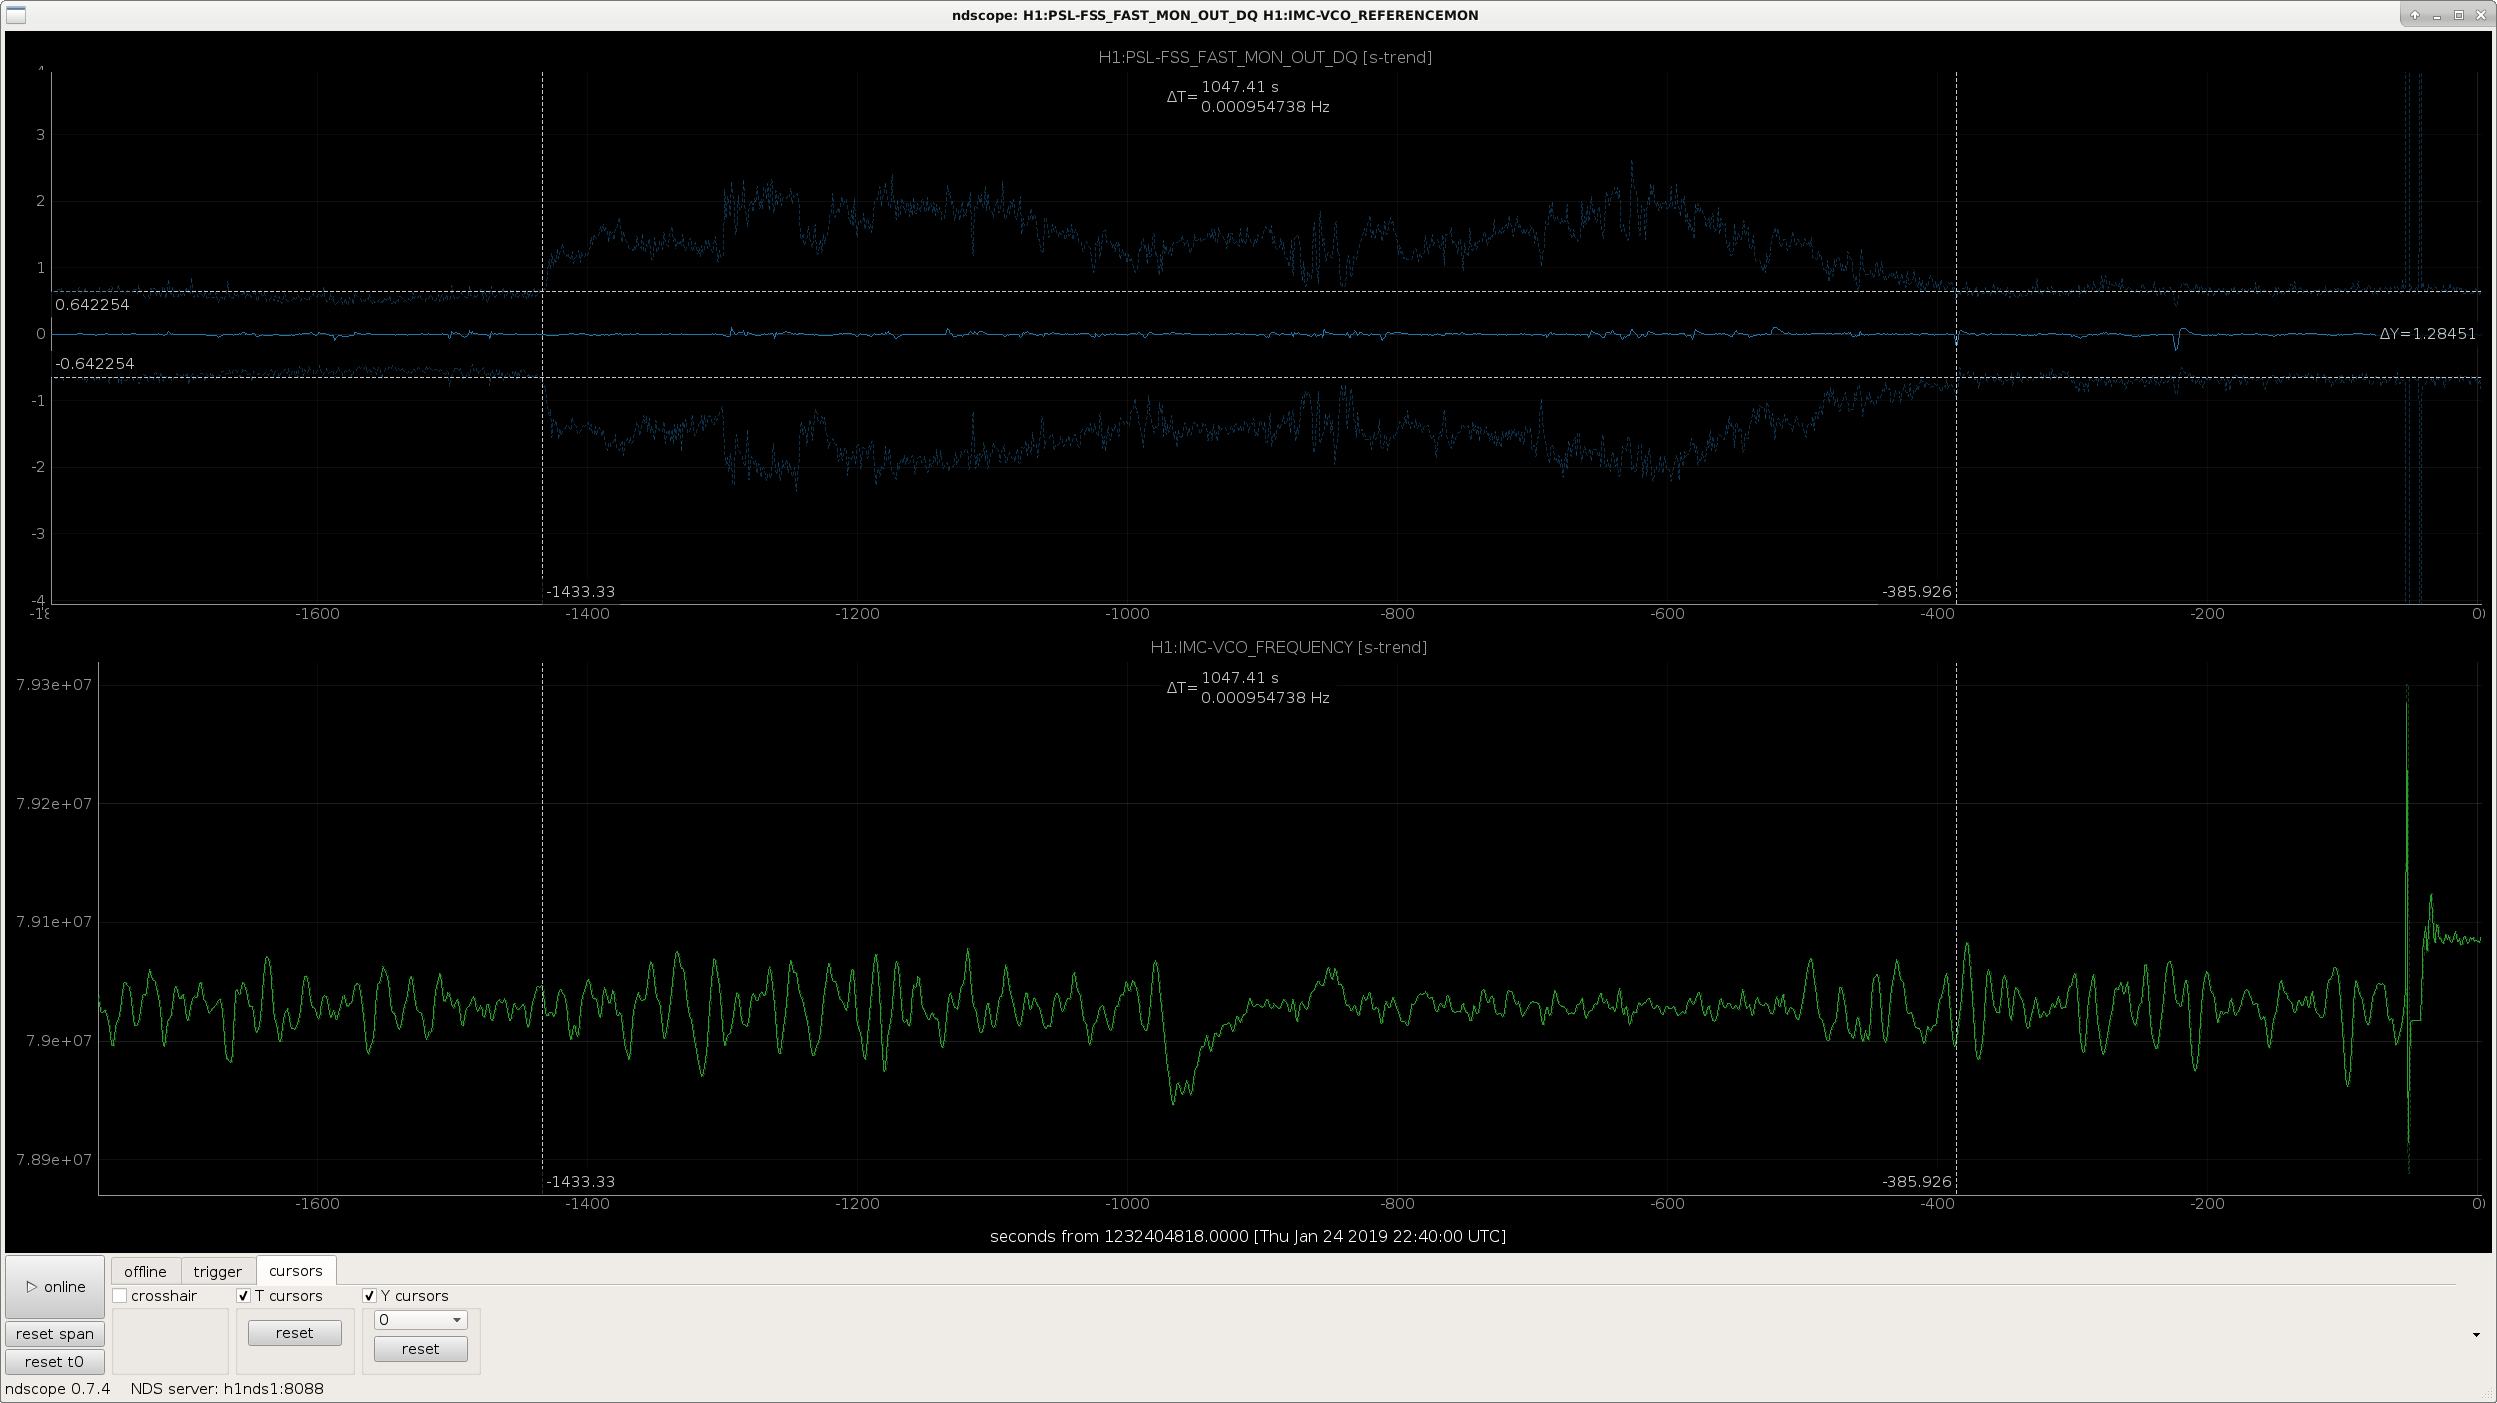
I also looked at several other signals over the same time frame and compared them to the FSS fast signal:

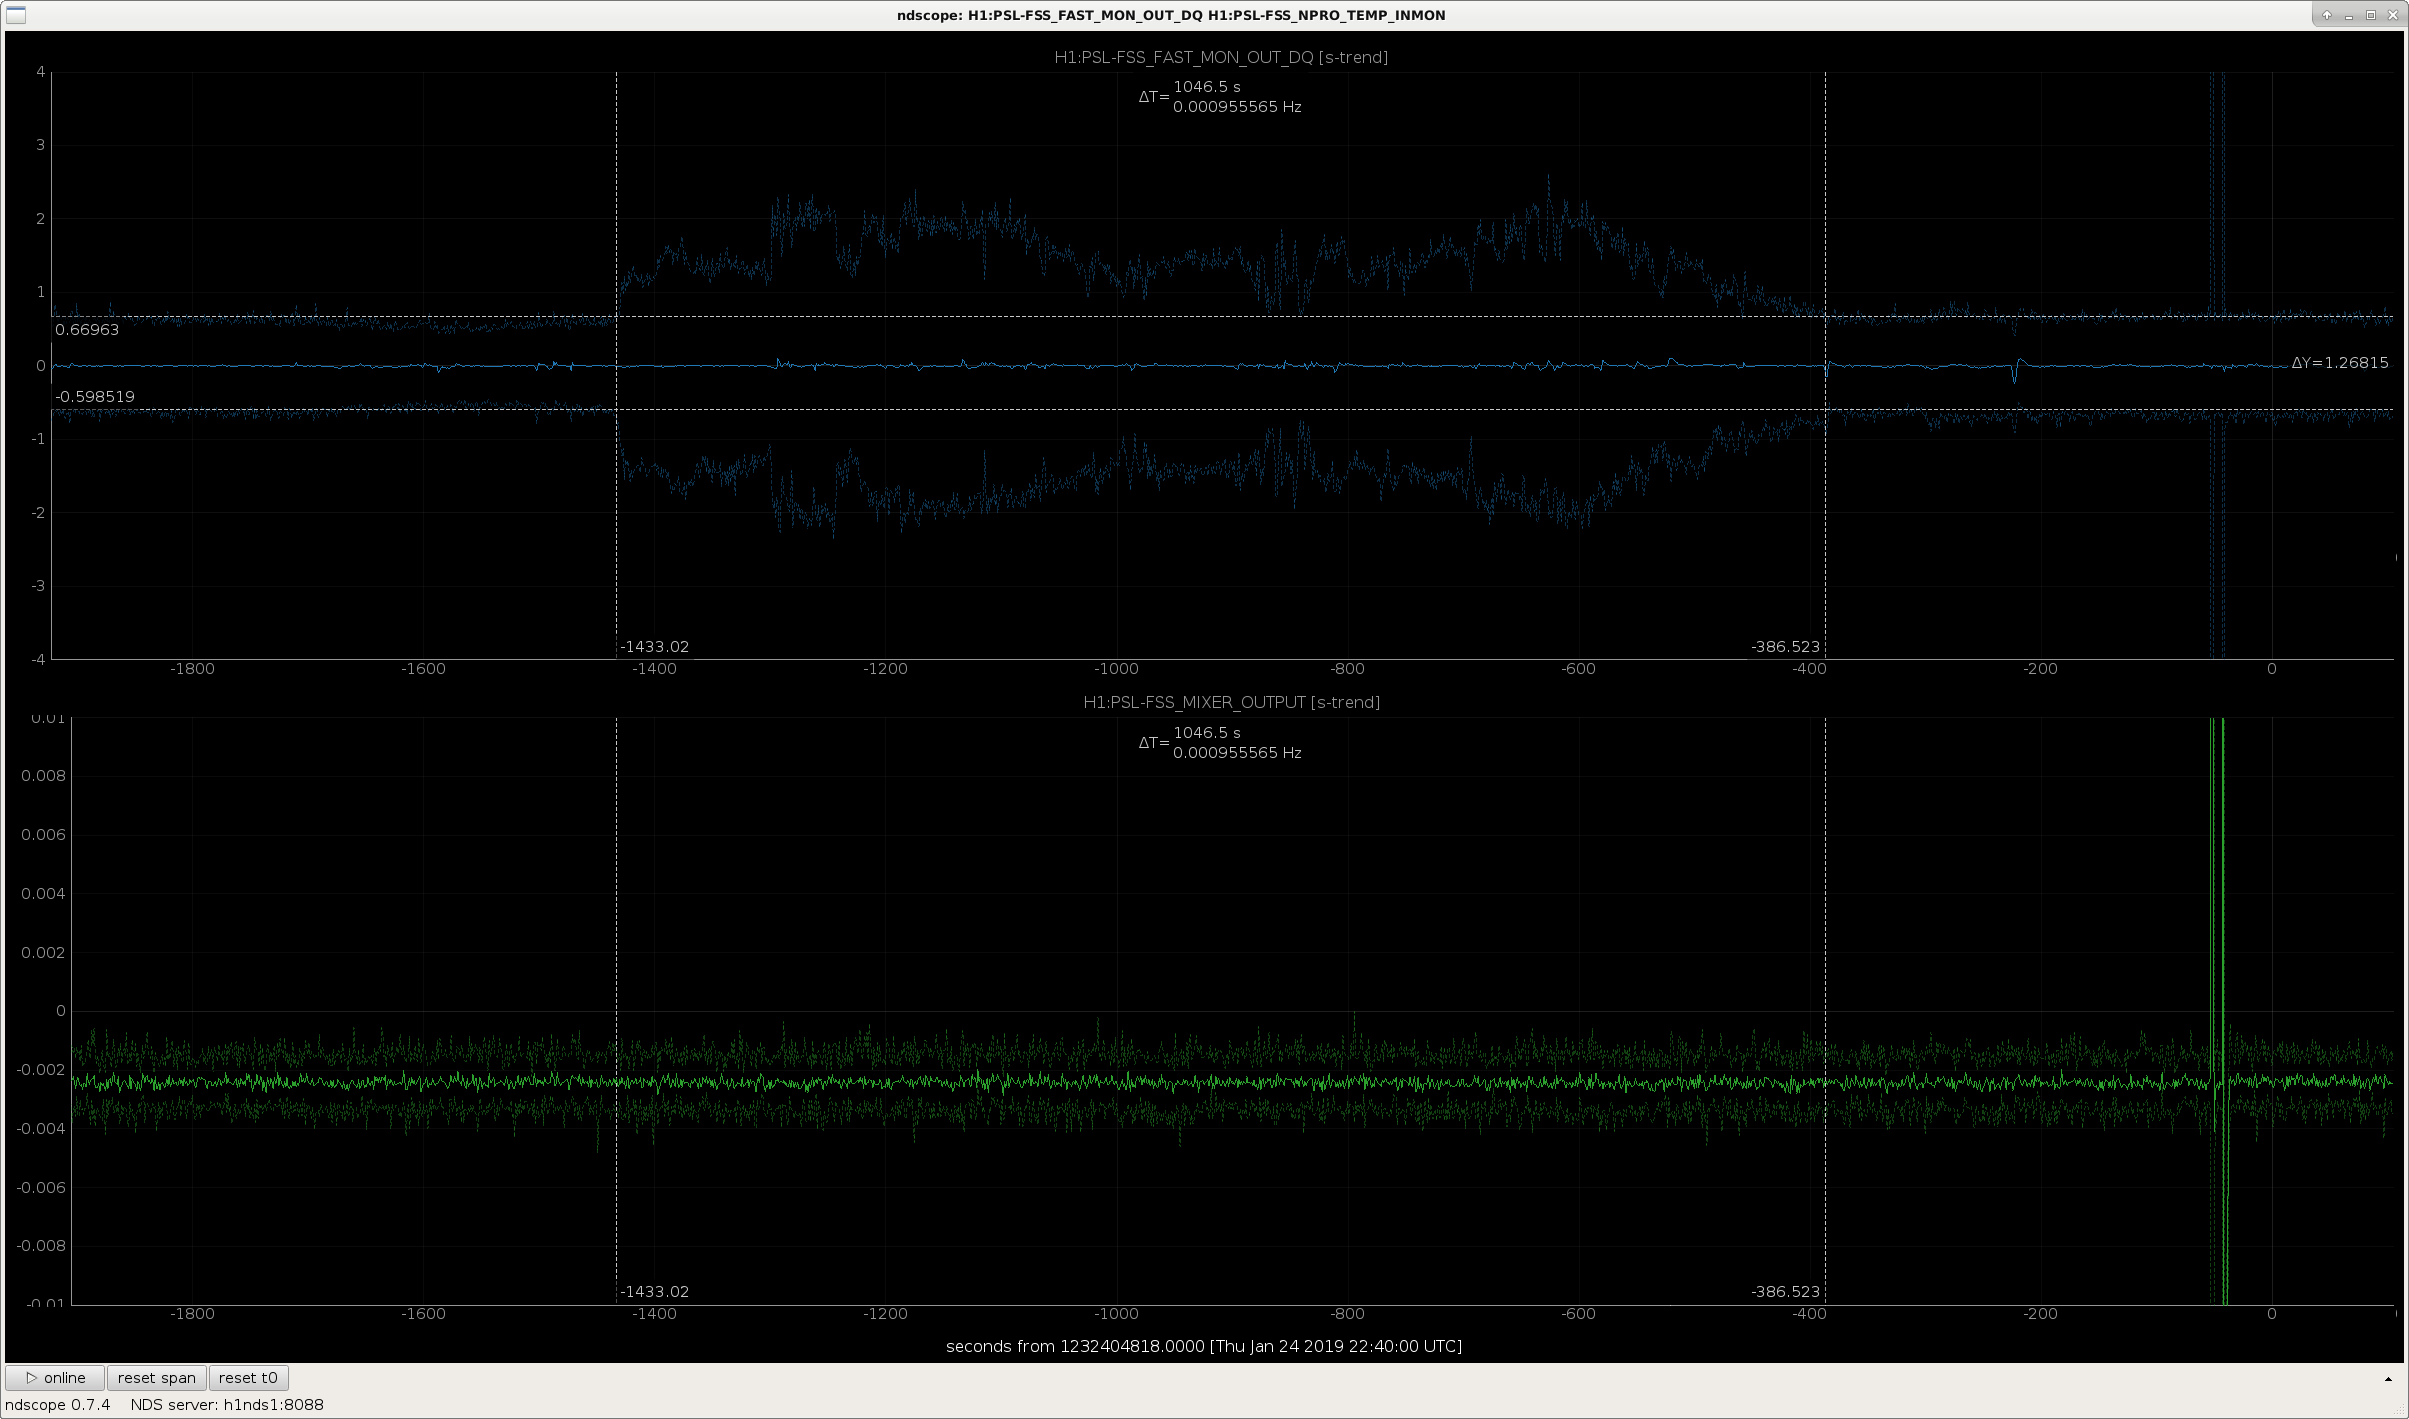
  • 2nd attachment: FSS fast with FSS RefCav mixer
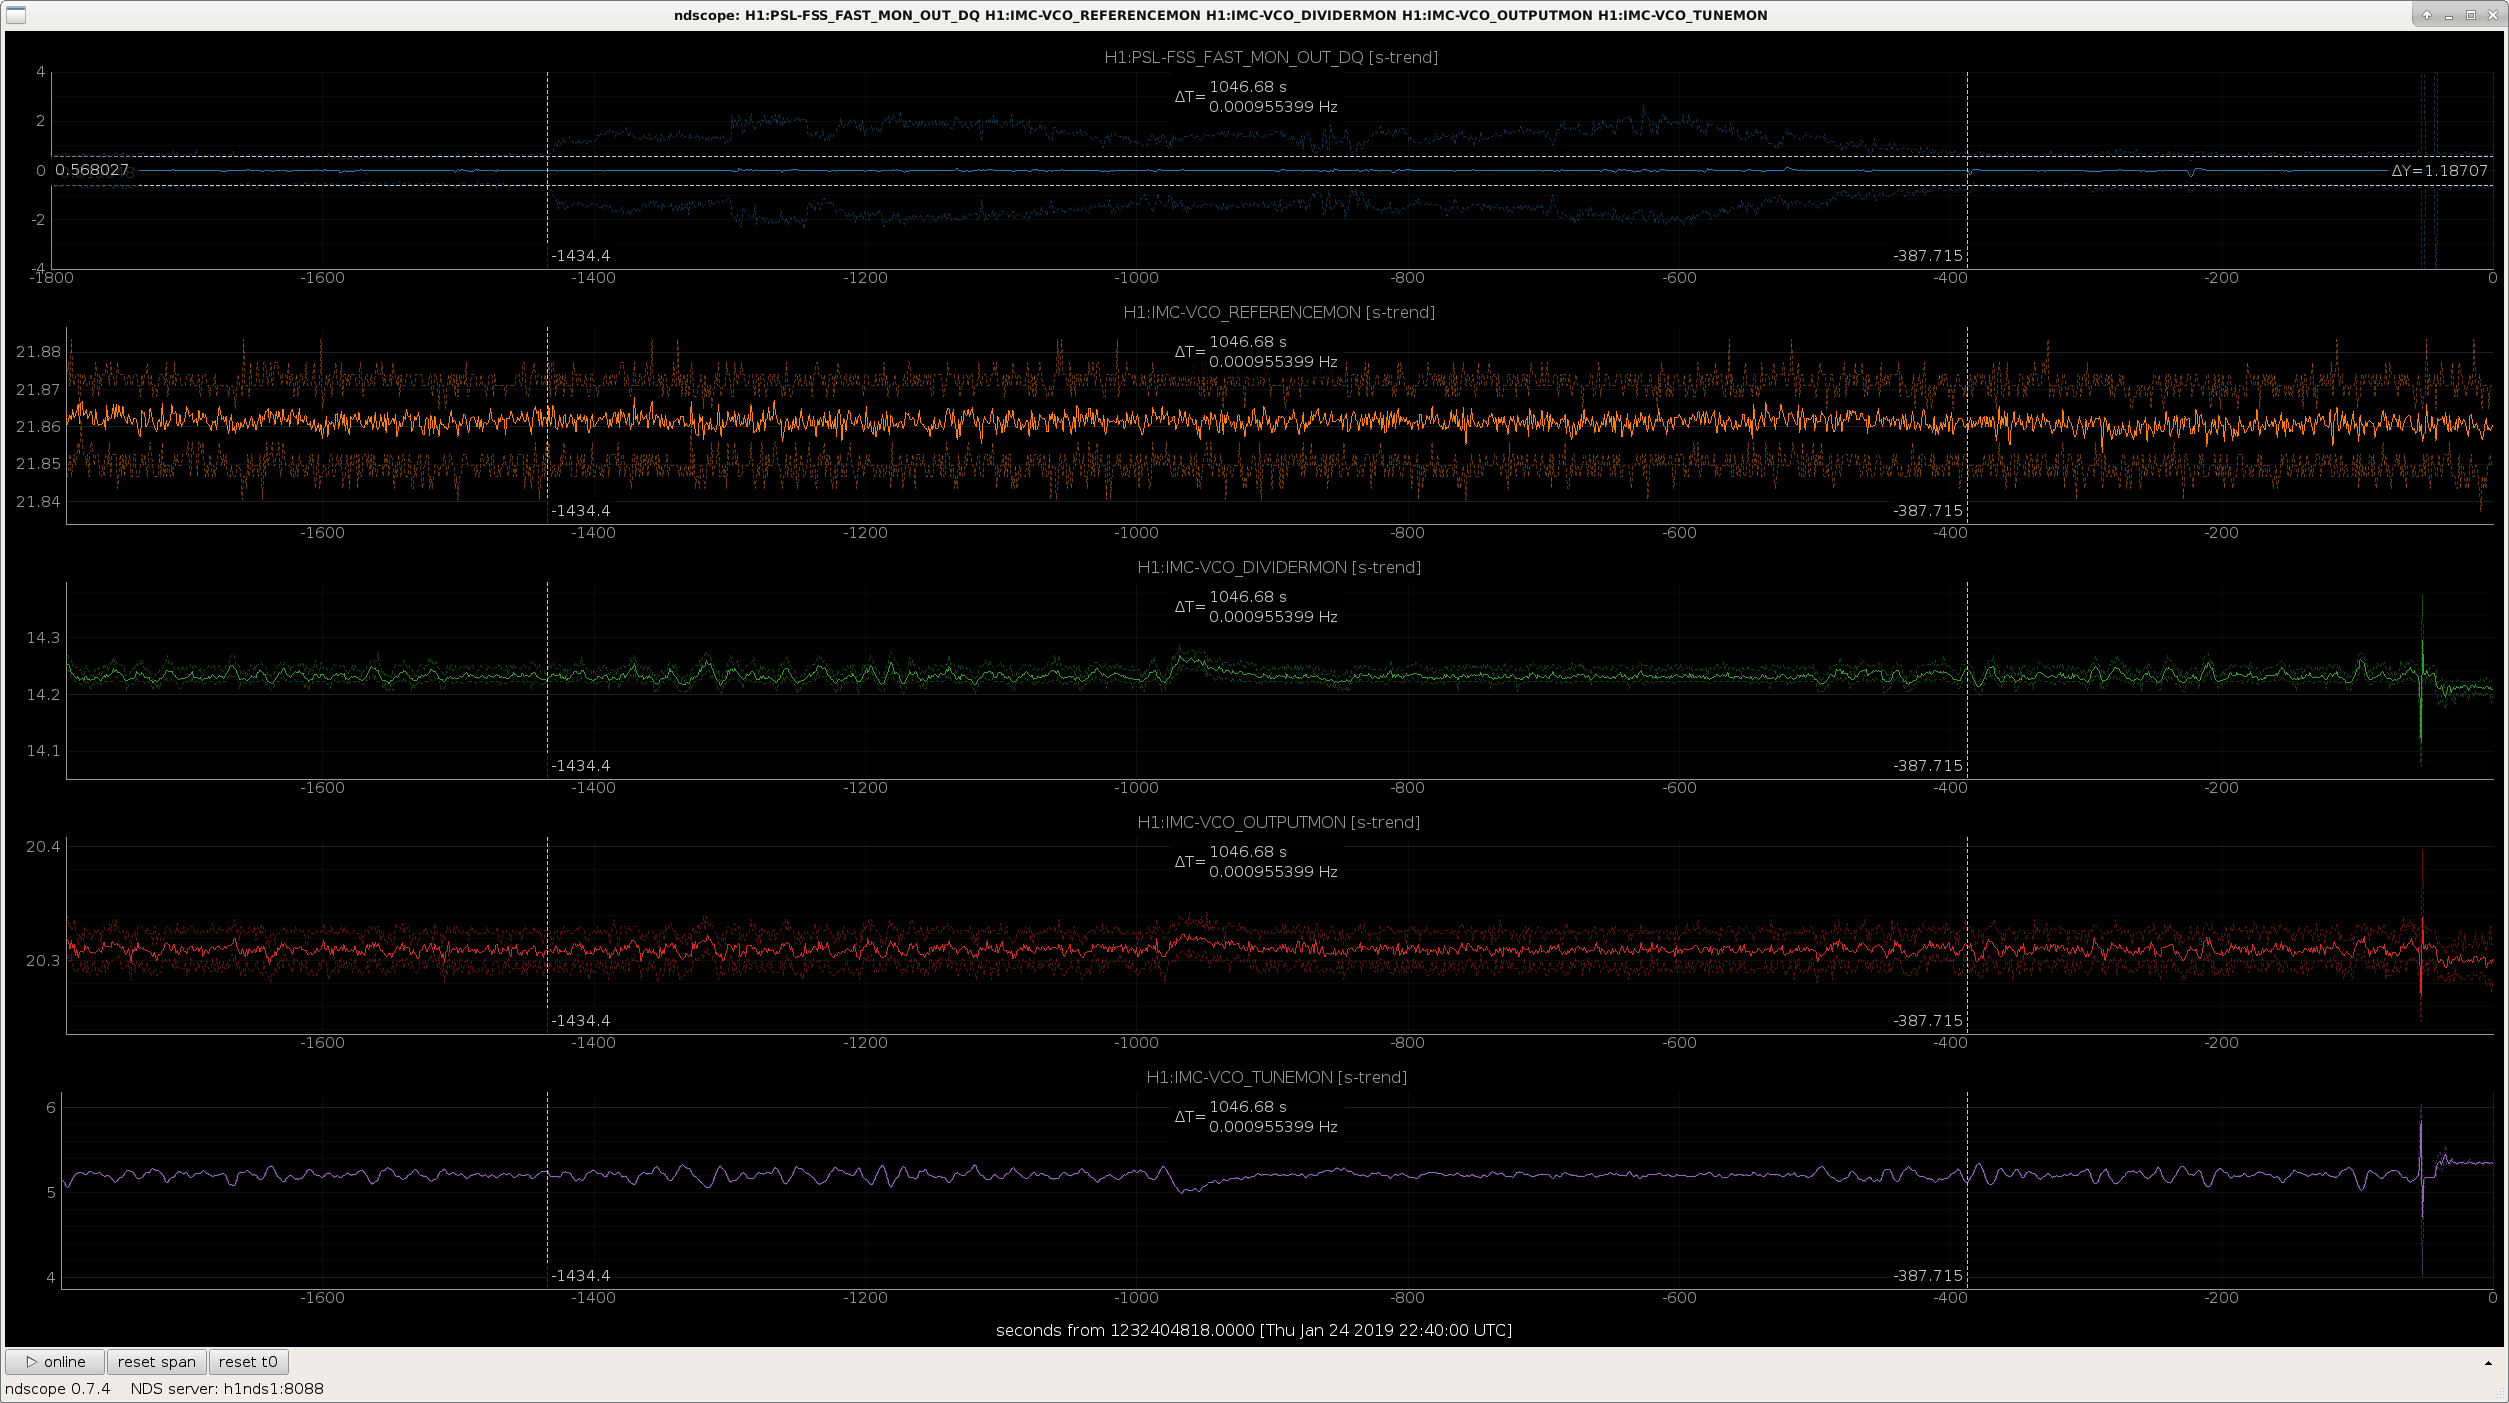
  • 3rd attachment: FSS fast with various VCO signals
  • 4th attachment: FSS fast with PMC mixer
  • 5th attachment: FSS fast with VCO frequency

This noise does not appear in any of these other channels that I can see; so far I've only seen it in the FSS fast and slow channels.  After a quick chat with Peter we have 2 possibilities to explore:

  • Does the noise coincide with VCO whistles?
    • Maybe unlikely, but could someone from DetChar check this?  Thanks.
  • The PSL NPRO could be close to a mode hop region
Images attached to this comment
daniel.sigg@LIGO.ORG - 15:06, Friday 25 January 2019 (46645)

Excess high frequency signals are clearly visible in the PC_MON. This is an RMS measure of the signal sent to the Pockels cell.

Non-image files attached to this comment
kara.merfeld@LIGO.ORG - 11:54, Tuesday 29 January 2019 (46688)DetChar, PEM
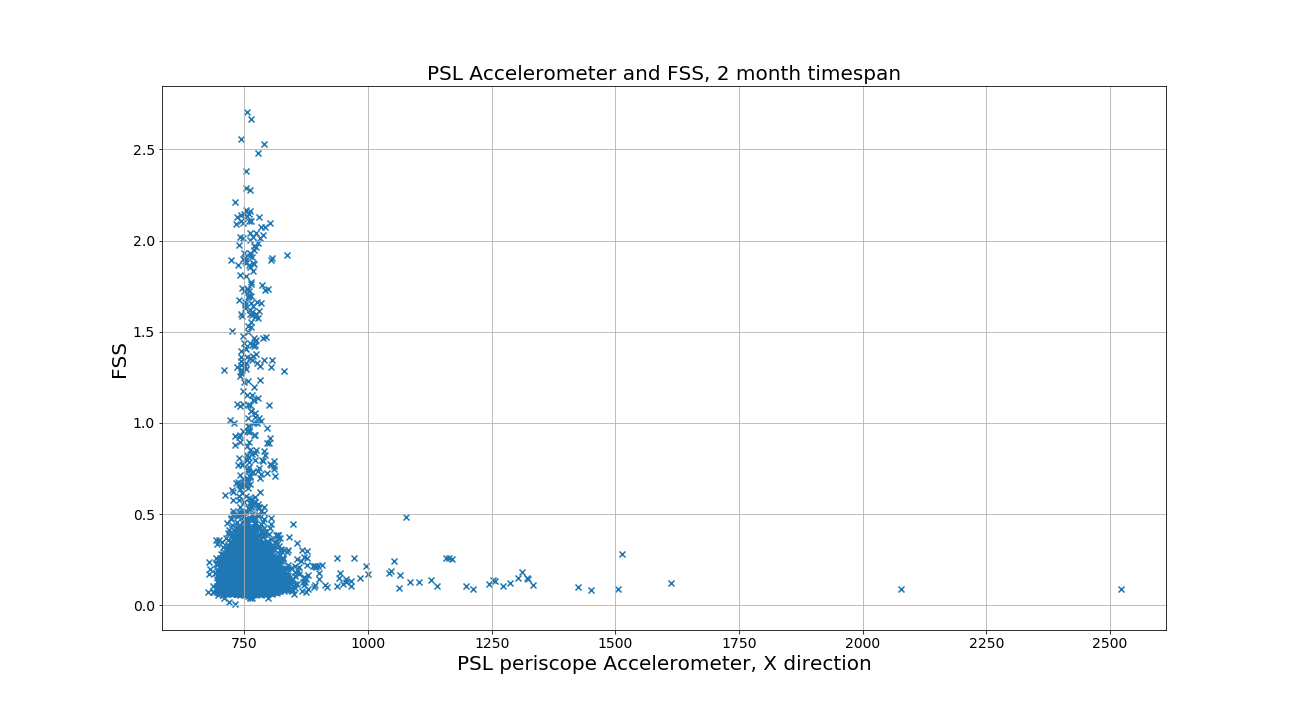
I looked at correlations between the FSS and several PEM monitors in the PSL, these were: the microphone, the dust monitor, and the x-direction accelerometer on the periscope.  I compared the 10s maxima of the PEM channels with the 10s maxima of the FSS over a 2 month span of time using only time segments when the interferometer was in nominal low-noise, and found no correlations.  Attached is a plot comparing the PSL periscope accelerometer, and the FSS.  

Jenne saw this noise in FSS while the interferometer was still acquiring lock, and as long as it doesn't interfere with locking, it shouldn't be a problem.
Images attached to this comment
peter.king@LIGO.ORG - 06:44, Thursday 31 January 2019 (46717)
During the Commissioning Meeting yesterday I kept an eye on the PZT voltage, the laser crystal temperature and the EOM monitor
drive voltage.  The larger fluctuations in the PZT voltage seem to coincide with large values of the EOM voltage.  A brief
discussion with Daniel the other day where he suggested looking at increasing the EOM gain to reduce the EOM voltage since its
average value is somewhat above 0, led me to think about the cross over.

    This morning I moved the cross over around by adjusting the fast gain.  Sure enough increasing the fast gain reduces the
EOM drive and lowering it, increases the EOM drive.  The EOM drive voltage seems to be minimised when the fast gain is set
to 19 dB.  More than this and the EOM drive voltage increases, whilst the PZT remains pretty much the same.  Adjusting the
common gain had little or no effect.

    The cross over bears some re-examination.  The last time this was measured, as I recall, was around the time of the
installation of the 70 W amplifier where a series of transfer function measurements were made.
Displaying reports 43281-43300 of 88618.Go to page Start 2161 2162 2163 2164 2165 2166 2167 2168 2169 End