Keita, Jason, Ed, Betsy
After the IO group installed the MC bypass today, Keita, Jason, Ed and I embarked on the beam pointing from the PR to the ITMs. We centered PR2 to PR3, then PR3 to ITMx-CP. We utilized the new target that was already on PR3, but the beam is many inches in diameter and viewing was difficult (as anticipated). Still we think we could see it well enough to have it centered to within ~1cm on the target. We then removed this target and the iris in front of PR2 (which likely was clipping the diameter a bit), and looked down at the BS and then CPX. Again this was difficult, but also doable to within ~1cm. Jason and Keita were inside the BSC chamber and used a series of rulers and IR viewers to find reference of the beam placement on the optic centerline.
Attached is the snapshot of the IFO alignment slider settings as we've left it for the night. We'll resume the BS to SR cavity optics tomorrow. (We'll also continue on the Elliptical baffle alignments when the newly fabbed target is out of clean and bake tomorrow morning.
Note, we had to ask Chandra to turn down the purge a tad in order to quiet the beam a bit.
Ed talked to Kyle and Ed is turning the purge back up.
[Kyle, Chandra]
We opened back up GV6 this afternoon after closing it last Friday to leak hunt. Recap: we checked the annulus systems on GV 5,6 & all in between for inner o-ring leaks (no leaks). We discovered 10" GV on CP1 was not tight and the volume capped by ISO flange was up to air, likely causing a slow leak into main volume. We did not spray GV 5,6, CP1, spool with helium.
We replaced the ISO with conflat reducing cross that can accommodate a turbo pump plus full range gauge and pump port. There seems to be a small (e-9 Torr-L/s) leak somewhere in this reducer cross but results are ambiguous and should not affect performance since it's behind the closed 10" valve.
The pressure reading on PT-124 (beam tube side of GV6) has dropped since tightening 10" GV, but value hasn't fallen below 5e-9 Torr which is where it is when isolated from leak. We may revisit this when we have access to the main YBM turbo for He leak checking. I would like to check the 10" GV gate seal and gappy flange at bottom of CP1.
TITLE: 11/14 Day Shift: 16:00-00:00 UTC (08:00-16:00 PST), all times posted in UTC STATE of H1: Planned Engineering LOG: Dust alarms in optics labs in morning, likely due to AHU-3 work. 15:49 UTC Email from Bubba reporting that he is taking AHU-3 down 15:50 UTC Larry M. through gate 15:59 UTC Jeff B. to YBM and resetting dust monitor 4 16:10 UTC Bubba, Richard, Larry M., Victor C. to LVEA to look at TCS table 16:18 UTC Jeff B. back. Dust monitor 4 restarted. 16:22 UTC LN2 delivery truck through gate 16:26 UTC Hugh to HAM3 to balance ISI 16:52 UTC Cintos through gate 16:56 UTC Betsy to LVEA to talk to Hugh 17:00 UTC Betsy back 17:06 UTC Jim to LVEA to help Hugh 17:11 UTC Betsy and Keita taking camera crew to bier garten. Betsy also unlocking PR3. 17:12 UTC Ed to LVEA to prep for HAM2 work 17:18 UTC Ed and Cheryl installing alignment hardware in HAM2 17:23 UTC Travis to LVEA to investigate problems with walkie-talkies 17:39 UTC Jason to LVEA to talk to Cheryl 17:43 UTC Jason back and starting adjustment of PSL diode currents 17:52 UTC Travis back 17:55 UTC Chris to LVEA for FAMIS tasks 18:03 UTC Jeff K. to LVEA to help Cheryl and Ed transition to laser hazard 18:10 UTC Chris done 18:13 UTC Jim back 18:23 UTC Jason to HAM2 18:26 UTC Marc to mid Y to pickup and drop off parts 18:33 UTC Betsy, Keita and camera crew back 18:34 UTC Jason back and reports LVEA transitioned to laser hazard 18:42 UTC Keita to HAM2. Vern taking camera crew to HAM2. 18:52 UTC Camera crew getting a different camera 19:06 UTC Karen leaving end Y 19:18 UTC Gerardo to optics lab. LN2 delivery truck through gate. Sheila and Terry to squeezer bay. Kyle and Rakesh to LVEA to leak check CP1. 19:36 UTC AHU-3 back on 20:35 UTC Betsy to LVEA to talk to HAM2 group 20:37 UTC Terry back HAM2 group out for lunch 20:58 UTC Betsy back and starting transfer functions of PR2 and PR3 21:25 UTC Terry back to squeezer bay. Turning squeezer laser on. 21:50 UTC Ed, Keita and Jason to HAM2 21:56 UTC Kyle to end Y 21:58 UTC Betsy to LVEA 22:29 UTC Kyle back 22:41 UTC Chandra to LVEA. Chandra and Kyle leak checking around CP1. 22:52 UTC Koji to optics lab 23:21 UTC Vern and camera crew back 23:44 UTC Marc to mid Y 23:49 UTC Toggled PSL FSS autolock to relock FSS
IO work as of 1PM:
To do this afternoon:
- Cheryl, Ed, Keita, JeffK
[Gerardo, Koji]
As reported before [LHO ALOG 39359], we confirmed the disqualification of the installed OFI in terms of the optical isolation. The OFI was pulled out and place in the optics lab. [LHO ALOG 39366].
Yesterday, the optical performance of the OFI was tested without any adjustment and then after the performance optimization. The reasonable performance was recovered. It's hard to believe that we can keep this 43dB isolation forever under environmental fluctuations.
Next steps: Today, some of the measurement will be repeated for confirmation of the stability. In addition, a dry run of the in-situ isolation measurement will be done in the optics lab to pin down the reference numbers and accuracy/precision.
Here the detailed testing procedure can be found in E1700350.
| LHO OFI 2017/11/13 Before the adjustment |
LHO OFI 2017/11/13 After the adjustment |
|
| Transmission From the input port to the output port |
0.973 +/- 0.002 (2.7% loss) |
0.967 +/- 0.002 (3.3% loss) |
| Back-scatter isolation S-pol From the input port to the squeezer port |
1960 +/- 20 ppm | 1300 +/- 10 ppm |
| TFP AR reflection From the input port to the squeezer port |
N/A | 890 +/- 10 ppm |
| Isolation From the output port to the input port |
1800 +/- 200 ppm ( = 27.4 +/- 0.5 dB isolation) |
52 +/- 13 ppm ( = 43 +/- 1 dB isolation) |
| Back-scattering From the input port to the input port |
2.3 +/- 0.4 ppm | 3.0 +/- 0.5 ppm |
| Squeezer transmission From the squeezer port to the input port |
0.974 +/- 0.002 (2.6% loss) |
0.978 +/- 0.002 (2.2% loss) |
The transmission was checked with a Thorlabs power meter with an integrated sphere. The numbers were 0.972+/-0.004 and 0.971+/-0.006. But the systematics is large (+/-1%) everytime the number is measured.
Other OFI Performance to compare:
LLO OFI Performance summary [LLO ALOG 25788]
Previous LHO OFI measurement in the opt lab [LHO ALOG 39276]
What has been done:
- A noticeable thing was that the half-wave plate (HWP) was not tightly fastened in the holder. It is a notorious holder (Attached Pic) that the HWP can still jiggle in the holder even the screw is fastened with a normal torque. This was the issue the initial OFI of the LLO (actually... this unit). This time, the screw was fastened much tighter with an Allen key.
- Other alignment was basically fine. The angle of the thin film polarizer (TFP) was a bit tweaked to minimize the backscatter iso, but it seems that this is the minimum. This may mean that the isolation was optimized by sacrificing the polarization purity of the transmitted beam through the faraday rotator and half wave plate.
Can you please note the temperature in the optics lab? Temperature changes of a few degrees will limit us to <40dB of isolation.
I don't have a thermometer right now. We will measure it.
Degradation of the isolation due to the temperature dependence of Verdet effect for TGG
When the isolation was optimized (< -40 dB), the backscatter isolation (S-pol of the transmission from FR+HWP) was 1300 ppm. Assume this was caused by the deviation of the rotation angle at the faraday rotator from the nominal 45deg.
Backward beam
Faraday: phi_0 = 45 + delta [deg]
HWP: phi_H = 45 - delta [deg]
Total: phi_0 + phi_H = 90 [deg]
Forward beam
Total: phi_0 - phi_H = 2 delta
==> S-pol power: sin[2 delta/180*pi]^2 == 1300ppm
==> delta ~ 1deg
Temp dependence of the faraday rotation
FR had the rotation of 45deg + delta at T=298. According to JOSA B 9 (1992) 1912, the Verdet effect of TGG crystal has the temperature dependence of the follwoing form: phi = a (6751/T - 6.968) [deg]. a is a constant. T is the temperature in K. In our case, phi = phi_0 at T=298. This gives us a=2.935. ==> dphi/dT @T=298 = -0.223 [deg/K]
This will cause additional dphi = dphi/dT x dT rotation on the backward beam
Temp dependence of the isolation
So, the isolation is given by the following expression:
sin[dphi/180*pi]^2 = sin[-0.223 dT/180*pi]^2
This will hit 40dB (1e-4) at dT = 2.6 K and 30dB (1e-3) at dT= 8.1 K.
Temp dependence of the backscatter-isolation (and transmission)
This 2.6K deviation cause the backscatter isolation changing {+830ppm,-630ppm}.
For the 8.1K deviation, it changes {+3300ppm, -1300ppm}. The sign depends on the sign of delta.
To be checked:
- Temp dependence of the retardation of the half wave plate
- Temp dependence of the other optical parameters
Attached are the temperature trends from inside the optics lab (lab1 channel) and the vacuum prep lab (lab2 channel), data taken from the dust monitors.
This morning I relieved the PR3 of the mechanical rubbing Kissel pointed out in 39384. The Front HR Upper Right stop was grounded on the face of the optic. I also freed up the locked down PR2. We'll run some TFs at lunch when IO is finished with the MC bypass install, but before alignment through the PR chain.
At lunch I took the needed TFs. Both suspensions look healthy now according to the 6 DOF TFs (each) which can be found in the usual spot at:
/ligo/svncommon/SusSVN/sus/trunk/HSTS/H1/PR2/SAGM1/Data/2017-11-14*.xml
and
/ligo/svncommon/SusSVN/sus/trunk/HLTS/H1/PR3/SAGM1/Data/2017-11-14*.xml
We'd like to go back at this after IO completes today to consolidate and put viton under another table mass. Otherwise we are pretty well balanced and have repeating locking. The delta tilts on the table are +44.6urad in RX and +23.7urad in RY. This delta is the difference from when we first locked the ISI after venting but before work commenced to the current repeatable locked position. To compare, on HAM4 the deltas were -46 and +11urads.
This morning I completed the weekly PSL FAMIS tasks.
HPO Pump Diode Current Adjustment (FAMIS 8448)
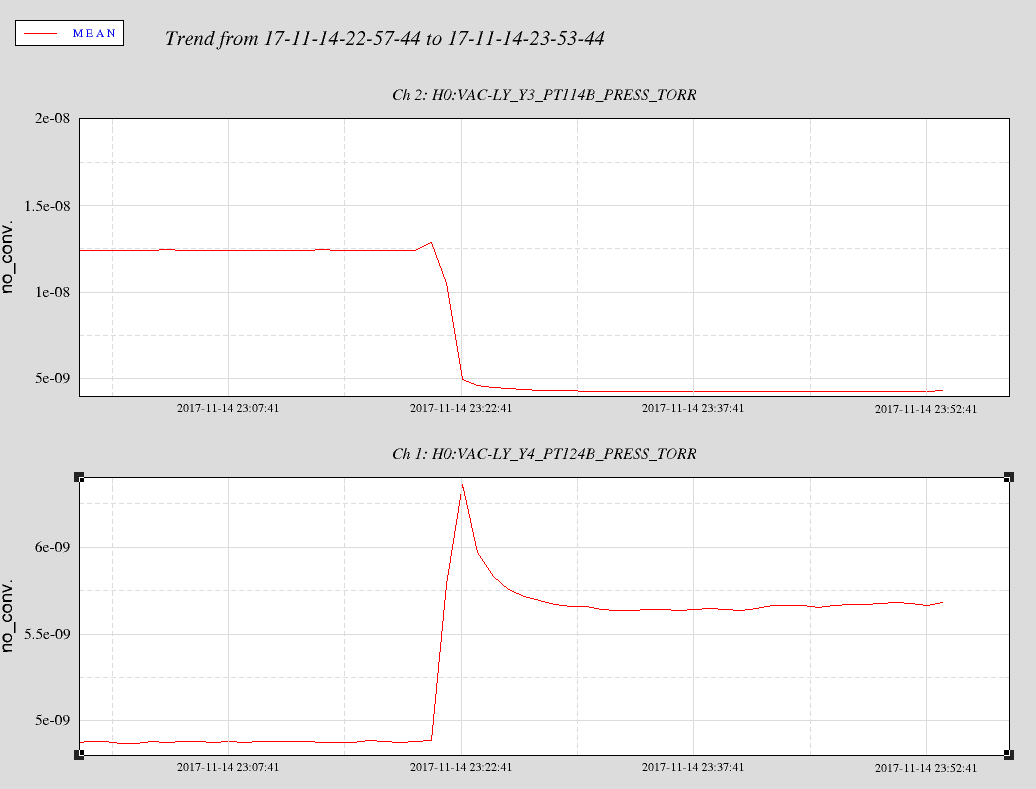
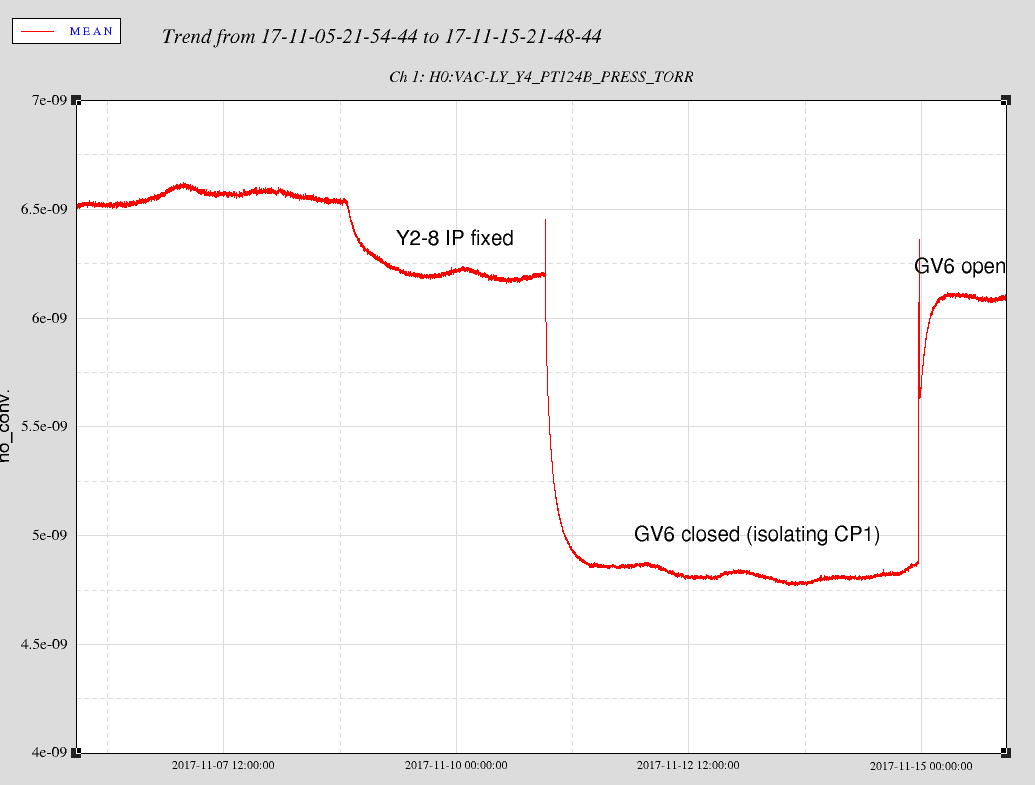
I immediately noticed that something was off; the power reading for DB1 was around 83%, when it was > 86% when I finished last week. That is a large decline over 7 days, so I trended the individual laser diodes of the diode box (1st attachment). Something happened with Diode 3 of DB1 on November 10th. The laser diode power was last adjusted on Nov. 7, and the increase can be seen in the attached trend. After this though, the power for laser diode 3 began increasing, finally hitting some tipping point on Nov. 10th at ~17:41 UTC; at this point the diode laser dropped over the course of ~7 hours and stabilized. The effect this had on the overall diode box power can be seen in the final plot of the attachment (H1:PSL-OSC_DB1_PWR). It is unclear at this time what caused this behavior; investigation continues.
Continuing with the FAMIS task, I turned the ISS OFF and adjusted the operating current of the HPO DBs. The results are summarized in the below table and a screenshot of the PSL Beckhoff main screen is attached for future reference.
| Operating Current (A) | ||
| Old | New | |
| DB1 | 51.6 | 51.9 |
| DB2 | 54.0 | 54.1 |
| DB3 | 54.0 | 54.1 |
| DB4 | 54.0 | 54.1 |
I should note that in the last 2 weeks, I have had to increase the operating current of DB1 by 0.6 A (0.3 A per week). This is a change from the usual 0.1-0.2 A weekly increase. It should also be noted that all of the DBs were increase by 0.3 A last week. The increase should remain roughly linear, and a departure from linearity can be an early indication of a failing DB. I will continue to monitor this.
I also adjusted the operating temperatures of the HPO DBs, changes summarized in the below table.
| Operating Temperature (°C) | ||||||||
| DB1 | DB2 | DB3 | DB4 | |||||
| Old | New | Old | New | Old | New | Old | New | |
| D1 | 27.5 | 26.5 | 19.5 | 19.5 | 21.0 | 20.5 | 22.0 | 22.0 |
| D2 | 27.5 | 26.5 | 19.0 | 19.0 | 25.0 | 24.5 | 19.5 | 19.5 |
| D3 | 27.5 | 26.5 | 20.0 | 20.0 | 25.0 | 24.5 | 21.0 | 21.0 |
| D4 | 27.5 | 26.5 | 18.0 | 18.0 | 22.0 | 21.5 | 19.5 | 19.5 |
| D5 | 27.5 | 26.5 | 18.0 | 18.0 | 26.0 | 25.5 | 21.5 | 21.5 |
| D6 | 27.5 | 26.5 | 18.5 | 18.5 | 20.5 | 20.0 | 21.5 | 21.5 |
| D7 | 27.5 | 26.5 | 19.0 | 19.0 | 21.5 | 21.0 | 21.5 | 21.5 |
Despite this, the HPO is still only outputting 154.1 W, down from the 155.0 W I left it at after last week's adjustment. I will continue to keep an eye on DB1, and investigation into the DB1 diode #3 glitch discussed above will continue. This completes FAMIS 8448. The ISS is back ON.
PSL Power Watchdog Reset (FAMIS 3676)
I reset both PSL power watchdogs at 18:03 UTC (10:03 PST). This completes FAMIS 3676.
Attached are plots of the TEC voltage and operating temps for the individual diodes of DB1. The short spikes early in the graphs are from my adjustments from last week (testing new operating temps to see if laser output power improved). Interestingly enough, at the time of the power runaway for diode 3, the TEC voltage for that diode was also changing; this is not seen on any of the other 6 laser diodes in the DB. At this same time, however, the operating temperature of the diode did not register a change. Investigation continues.
Check of dust monitor vacuum pumps on 11/13/17 showed: End-X - Opened up air bypass to adjust pressure to 15 in/Hg. End-Y - No changes all within spec. CS - Opened up bypass just a little to fine tune pressure to 15 in/Hg. Pump is getting a bit noisy and there is carbon dust buildup on the filter. These are signs of wear on the vanes, and a pending rebuild. Have the rebuild kit in stock.
Following on the LHO recent watchdog upgrades (39392,39298) I was interested in seeing how the platforms and suspensions behaved during yesterday's earthquake (alog 36683).
At LHO, most platforms were already tripped when the earthquake happened (because of the vent, I suppose), except for the end stations, which did not fully trip during the earthquake, and were switched to the damping state instead (End-Y after the first wave peaked, and end-X after the second one). See figure 1.
At LLO, all platforms tripped, BSCs first, then HAMs when the large wave hit us, see figure 2.
It would be interesting to know how Sheila's sus guardian change helped keep the suspension damped at LHO (from the operators screen, all sus were green at the time of the eq, see screenshot from alog 36683).
Otherwise this is a positive first demonstration of the new sei watchdog scheme.
Thanks Arnaud.
It looks like none of the suspensions tripped, so we didn't get a test of the SUS guardian change. But it is nice to see that they did not trip, maybe the ISI watchdog changes helped.
The purge-air supply for the LVEA was shut down between 0900 - 1400 hrs. today for short notice maintenance. As such, in-chamber activity was prevented for much of the day.
Chandra R., Kyle R., Rakesh K. Today we replaced the 12"CFF-ISO adapter mounted to CP1's 10" gate valve (in closed position since 1998) with a 12"CFF x 8"CFF x 4.5"CFF x 2.75"CFF reducing cross. Last week, during our initial preparation for leak testing the vacuum volume bound between GV5 and GV6, i.e. CP1 plus misc. flanges, we had tightened the 10" gate valve (1/2 turn) and noticed a pressure response on PT114B. This observation, combined with the fact that this volume had been helium leak tested in the past without finding any external air leaks, caused us to suspect that the blanked-off adapter volume could be at a relatively high pressure and may have been acting as a "virtual leak" across the inadequately closed gate valve for the past 20 years. To test this theory, we "cracked" open the ISO blank so as to allow some room air into the adapter volume. In doing so, we did not perceive that any air back-filled into the adapter. Rather, it seemed as if the adapter was already at atmosphere. However, there may have been a slight pressure increase in PT114B when we did this (see attached graph). The pressure response of PT114B seems counter-intuitive but is not unprecedented. The as found adapter volume may have been less than an atmosphere and back-filled in a small amount of room air (noisy work area, may not have heard this) and thus increased the leak rate(?). This would explain the small "bump" in pressure. Following this by then pumping the newly installed reducing cross would have significantly reduced the closing force experienced by the gate which could then have resulted in more gas making it across the closed gate(?) We will continue tomorrow. For tonight, we are leaving the 10" valve closed and the reducer cross under vacuum.
More info / changes needed to find an AC-ON-all-the-time stable temperature for the PSL.
Temperature range of the table sensors change with changes to the makeup air.
| commissioning, 100% makeup air | N: 72.6F to 73.9F | S: 67.7F to 69.5F | delta N: 1.3F | delta S: 1.8F |
| commissioning, 40% makeup air | N: 71.5F to 75.1F | S: 69.4F to 72.3F | delta N: 3.6F | delta S: 2.9F |
There's a way to see/set the temperatures that controls the AC unit coming on and turning off, and with the table temperature range changing with makeup air, I suspect these AC on/off temperatures are either not set or set to a wide range, and this could be a place where a change may allow for more PSL cooling options.
J. Kissel, B. Weaver While we waited for the PSL to figure out at what temperature it would like to be (see LHO aLOG 39371), I took top-to-top mass transfer functions of all the HAM2 / HAM3 suspensions. In doing so, I discovered that MC2 was rubbing. As such, Betsy -- while out on the floor for other reasons -- dipped in to HAM3 and found that a few of the barrel stops were grazing the optic. She backed them off, and I re-ran TFs that indeed confirmed this was the source of the rubbing. I attach screenshots of the 6 DOFs of TFs. Black 2017-08-01_1733 -- pre-vent clean reference data Blue 2017-11-10_1722 while MC2 was rubbing Red 2017-11-10_1829 after Betsy releaved the EQ stop rubbing Repeat: MC2 is now free of rubbing.
For future reference -- on the barrel stops that were rubbing the optic: two of the eight were rubbing, on opposite corners (low on one side, high on the other), but it was too dark in chamber to tell to precisely identify which ones.
J. Kissel I've taken new, more comprehensive B&K hammer response measurements of the H1SUSPRM and H1SUSPR3 cages, now that they have newly installed (what I'm calling) Venetian Baffles (see attached HAM2_NewBaffling_WithLabels.pdf for names of baffles) whose installation was finished last week LHO aLOG 39170. These baffles have pretty high-Q, low-frequency drum-head / longitudinal resonances (roughly aligned with ISI / IFO Y axis). PRM Upper: 42.38 & 46.75, 91.00 PRM Lower: 42.38 & 46.75, 75.62 PR3 Upper: 36.75, 75.6 PR3 Lower: 36.75, 83.12 My guess is that the lower frequency of the modes are the baffles bending in longitudinal in concert on the Venetian bracket, and the upper frequencies are their individual longitudinal modes. This mode-shape guess is based only on intuition, and that the lower frequency modes are seen in both upper and lower excitations. The cage's transverse modes appear to be relatively unaffected by the new baffles. I'm little surprised it hasn't stiffened up any of the transverse modes; oh well. These resonances have been identified by comparing against the history or cage resonance measurements for each of the SUS -- see the three pdfs: 2017-10-30_H1SUSPR3_CageResponse.pdf 2017-10-30_H1SUSPRM_CageResponse.pdf 2017-10-30_H1SUSPRMvsPR3_CageResonance_Comparison.pdf Note, also new with these measurements -- data out to 1.1 kHz. The former data is from LHO aLOG 6014 -- VA ON vs OFF data for H1SUSPRM and H1SUSPR3 LHO aLOG 8654 -- Former Cage Baffles on H1SUSPR3 Photos attached (and remaining HitLocations.pdf) are for historical reference for future repetition.
From Stephen and Norna
We (Stephen, Norna, Calum, Cormac) have done further experiments in the lab at Caltech to better understand the effect of the addition of the "Venetian blind" baffles ( D1700256 HSTS BAFFLE ASSY.PRM), on an HSTS and to help with the interpretation of the results seen at LHO.
A few caveats which should be noted:
a) We only have a bare structure - no vibration absorbers, hanging suspension, cables etc. attached. Also not as well dogged down as on site due to potential interference with baffle (our HSTS is not on a spacer). We have included baseline results displaying excitation of this structure without baffles mounted for comparison, see figures 2a and b described below.
b) We only used one baffle panel - so it was either attached at lower or upper position. See figure 1 for set-ups.
Basic findings
1) We show with and without damped baffle in upper position, exciting at top of structure in longitudinal (beam) direction and transverse. Basic conclusion, we do not see noticeable new resonances when exciting structure itself. See figures 2a and 2b
2) We only see extra low frequency ( ~ 40 Hz in our case) resonance introduced by baffle when directly hitting on the baffle. It is not seen when excitation is done to the structure itself. It is also only seen when hitting the baffle in its upper position, not in the lower position. See figure 3 for upper position results.
*We strongly suggest that if time permits, a test where the structure itself is hit in the longitudinal (beam) direction is done at LHO to see if this finding also holds for the PRM suspension now in situ.* From our experience we expect those low frequency peak(s) not to appear or least to be less prominent when the structure itself is excited.
3) The viton O-rings in the attachment units make a significant beneficial difference to the behaviour. Adding a baffle without viton introduces extra features which are suppressed or damped with the introduction of the viton.
See figures 4 (upper) and 5 (lower) baffle results.
4) The viton also adds some damping to the original structure resonances, apart from the first two flagpole resonances at 65 Hz (longitudinal) and 75 Hz (transverse) for our set-up. The dominantly torsional mode at ~160 Hz in our set-up shows some damping, as does the ~350 Hz feature. This can be seen particularly in the transverse results.
See figures 6 (upper) and 7 (lower).
5)We also did some investigations of different tightening levels corresponding to different levels of compression of viton O-rings within the two different flavors of attachment unit, D1700232 and D1700236. Basic result: the system is quite tolerant to different levels of tightening,with similar results over a range from hand tightened plus 1/4 turn to hand + full turn.
We will write this up more fully on the DCC at T1700473, including posting all data sets.
I have added one further set of comparison traces. In figure 8 we show the effect of including the damping O-rings in the baffle attachment units, where we are now comparing the results when hitting directly on the baffle in its upper position, rather than hitting the structure as shown in figure 4. We see again that the damping makes a significant beneficial difference.
For the purpose of injecting PCAL lines, there are two channels that can be used: H1:CAL-PCALY_RX_PD_OUT_DQ (for reflected light) and H1:CAL-PCALY_TX_PD_OUT_DQ (for transmitted light). At various points during O2, we switched off between these two channels in C00 and C01 data at Livingston to account for things like PCAL clipping in the RX channel. The exact dates of each change are listed below, as documented on the filter configurations wiki page.
Version C00
Used RX from 116440990 (2016 Sep 14, 16:43:07 UTC) -- 1182618646 (2017 Jun 27, 17:10:28 UTC)
Used TX from 1182618646 (2017 Jun 27, 17:10:28 UTC) -- now
Version C01
Used RX from 1163173888 (2016 Nov 14, 15:51:11 UTC) -- 1181941760 (2017 Jun 19, 21:09:02 UTC)
Used TX from 1181941760 (2017 Jun 19, 21:09:02 UTC) -- now
The corresponding record over at Livingston is in aLOG 35948.
Attached plot show the ratio of TX PD to RX PD during O2. The size of deviations from one in that plot, when RX PD is used, indicates the systematic uncertainty introduced by the PCal clipping. The circled regions show the times when RX PD was used and the ratio was not close to one. The systematic uncertainties introduced by the clipping during those time is <3 %. This systematic would be reduced in the C02 frames. Each data point in that plot is running average of an hour of data. We plot data only during the observation times and with hoft ok state.