logbook/robot/script0.cds.ligo-wa.caltech.edu@LIGO.ORG - posted 12:10, Monday 29 May 2017 - last comment - 12:34, Monday 29 May 2017(36490)
CP3, CP4 Autofill 2017_05_29
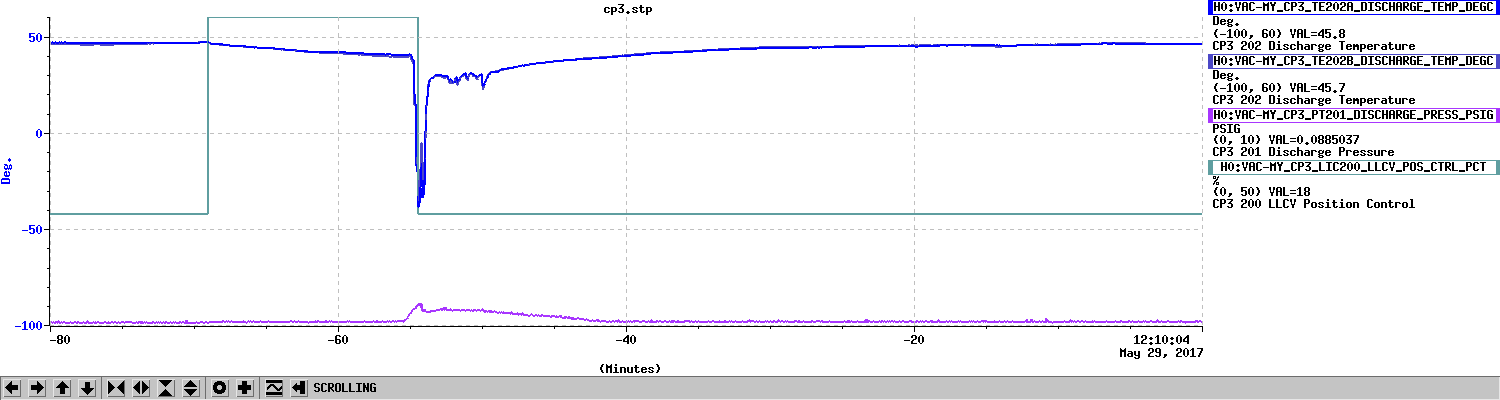
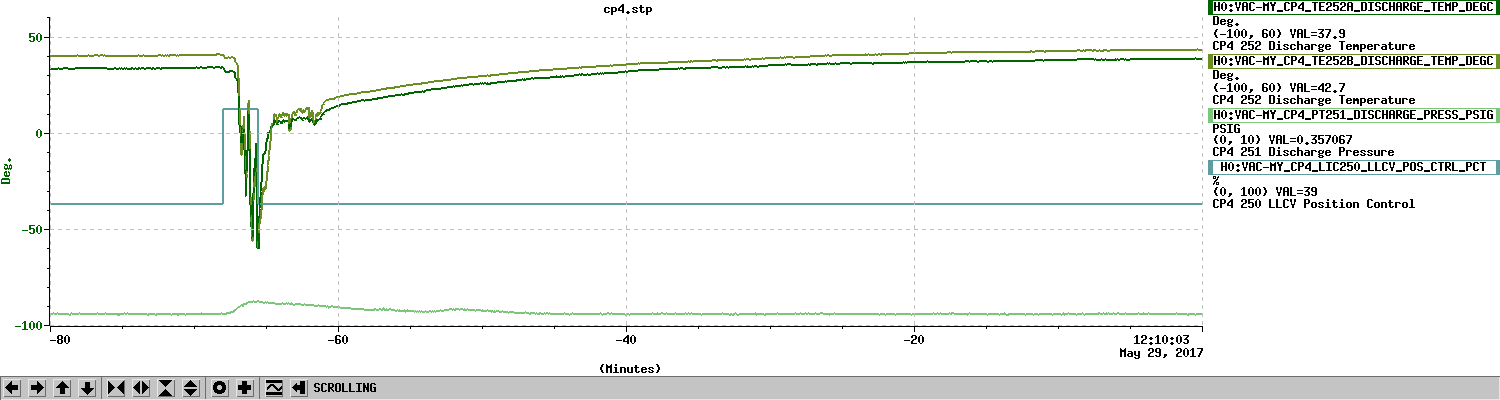
Starting CP3 fill. LLCV enabled. LLCV set to manual control. LLCV set to 50% open. Fill completed in 875 seconds. TC B did not register fill. LLCV set back to 18.0% open.
Starting CP4 fill. LLCV enabled. LLCV set to manual control. LLCV set to 70% open. Fill completed in 143 seconds. TC B did not register fill. LLCV set back to 39.0% open.
Images attached to this report
Comments related to this report
Increased CP3's LLCV %open value to 20%, up from 18%. Chandra was awarre that I was on site and suggested this value.


