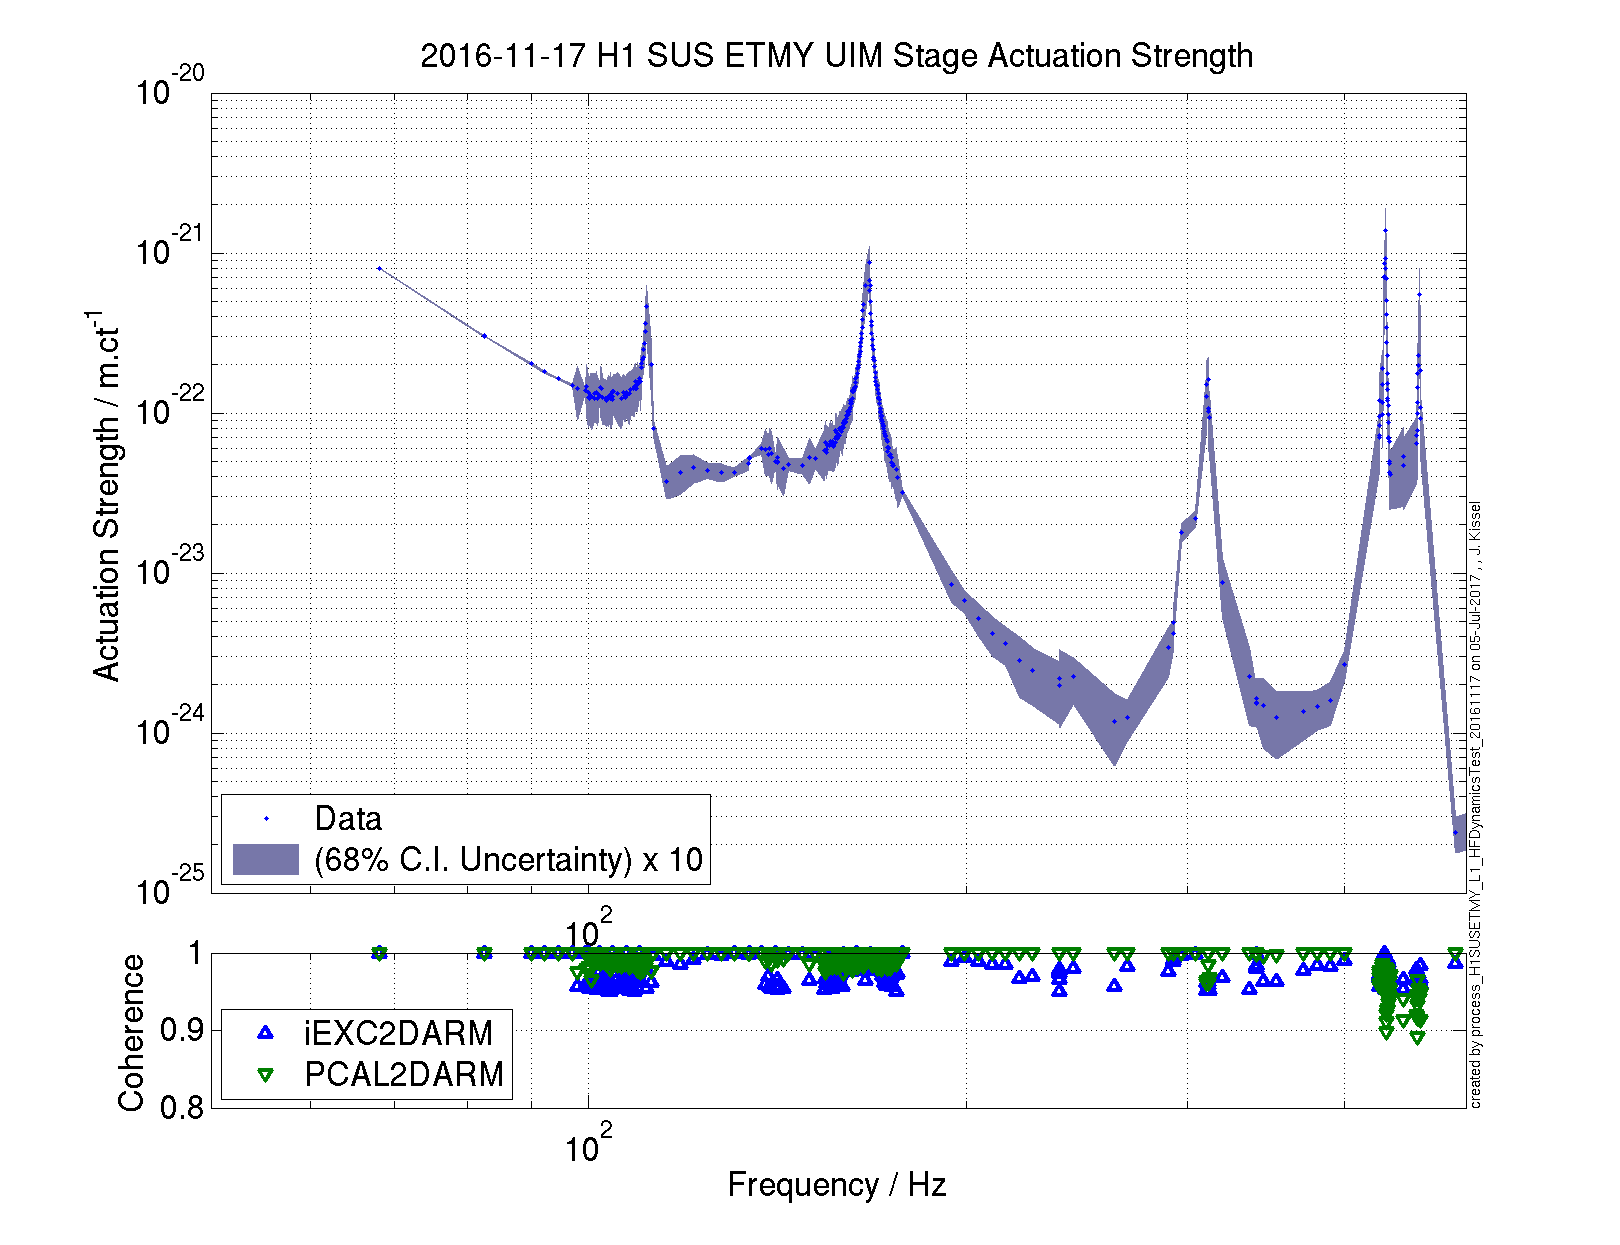
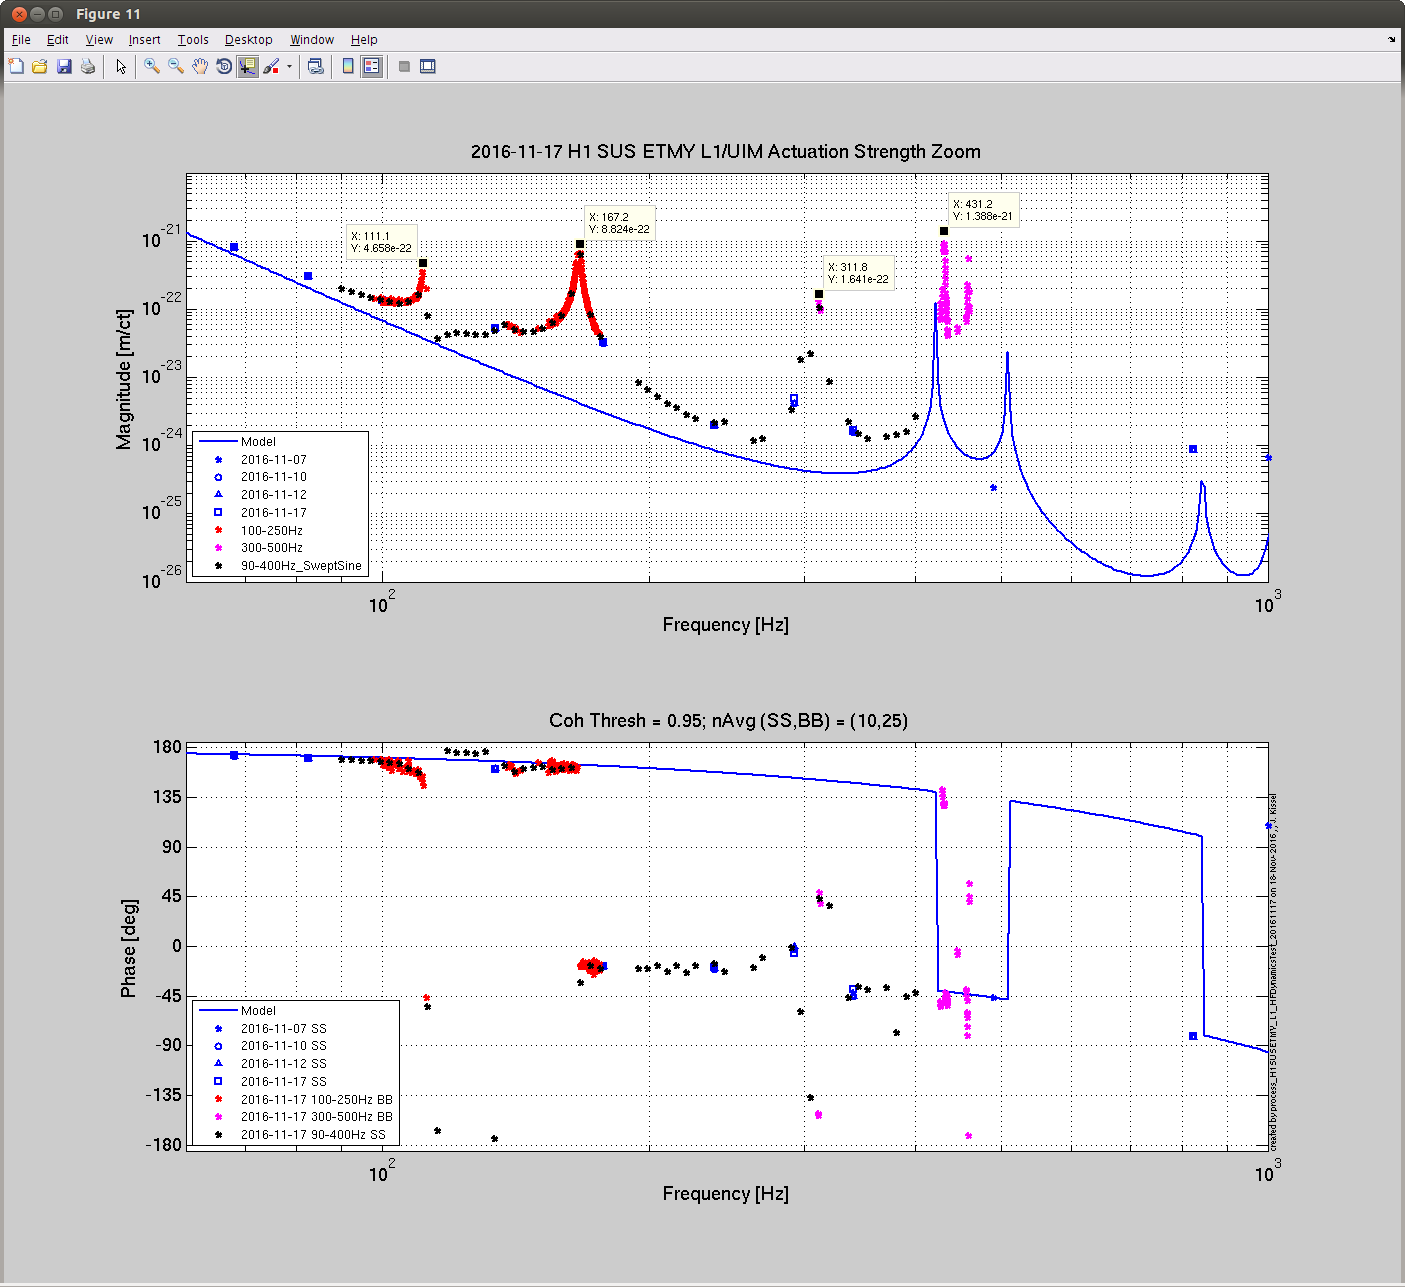
J. Kissel, D. Tuyenbayev

Analyzing the high-frequency data for the UIM that we took last night (LHO aLOG 31601), we find -- as previously suspected -- there is lots of dynamical resonant features in the UIM / L1 actuation stage; it definitely does NOT fall as f^6 to infinity as one might naively suspect.

There are even more features than the (now anticipated; LHO aLOG 31432) broad impacts of the violin modes of the Sus Point-to-TOP wires (~311 Hz), and UIM-to-PUM wires (~420 Hz). We had seen hints of these features previously (LHO aLOG 24917), but here they are fully characterized out to 500 Hz with a combination of swept-sine (SS) and broad-band (BB) transfer function ratios (the calibration standard measurements of PCAL2DARM = C / (1+G) and iEXC2DARM = C A_i / (1+G)). The measurements yield the actuation strength of the UIM stage, in terms [m] of test mass displacement per [ct] of drive from the L1_TEST_L bank, which is the Euler-basis equivalent to DAC [ct]. To scale to [m/N], is a mere scale factor, measured to be
     20/2^18 [V/ct] 0.62e-3 [A/V]* 1.7082 [N/A] = 8.08e-8 [N/ct] (see LHO aLOG 31344).


Via private communication in January this year, Norna suspects that 111 Hz feature is the first internal mode of the UIM blades, backed by a bench test of the blades at CIT which revealed a resonance at 109 Hz. No ideas on the 167 Hz mode though.

These high frequency dynamics continue to plague the estimate of the UIM actuation strength at DC using the traditional frequency-dependent sweep method, because these high frequency dynamics begin to affect the actuation strength at as low a frequency as ~30 Hz (LHO aLOG 31427), and any model fitting code gets totally distracted by these features.

A challenge to the CSWG team: fit this transfer function above 20 Hz and create a set of zeros and poles that can be used as a "correction" filter to a model that falls off as f^6. This filter need not perfectly resolve the details of all of the high-Q features, but it must track the overall frequency dependence over the 20 - 500 Hz region well. I attach all of the measurements compressed onto one (discontinuous) frequency vector as an ascii in the standard DTT form of [freq re(TF) im(TF)]. To use:
    >> foo = load('2016-11-17_H1SUSETMY_L1_Actuation_HighFreqChar_asciidump.txt')
    >> figure; loglog(foo(:,1), abs( foo(:,2)+1i*foo(:,3) ))
This data is also committed to the CalSVN repo here:
    /ligo/svncommon/CalSVN/aligocalibration/trunk/Runs/ER10/H1/Results/Actuation/2016-11-17_H1SUSETMY_L1_Actuation_HighFreqChar_asciidump.txt
Kiwamu has already tried to create such a filter from the previous data (LHO aLOG 28206), but was limited by  that measurement's high-frequency bound falling between the 111, 137, and 167 Hz features.

Details:

Analysis code:
    /ligo/svncommon/CalSVN/aligocalibration/trunk/Runs/ER10/H1/Scripts/FullIFOActuatorTFs/process_H1SUSETMY_L1_HFDynamicsTest_20161117.m

Config files:
    IFOindepPars = '../../../Common/params/IFOindepParams.conf';
    IFOdepPars   = {'../../params/H1params.conf'};
    IFOmeasPars  = {'../../params/2016-11-12/H1params_2016-11-12.conf'};
    PCALPars = {'../../params/2016-11-12/measurements_2016-11-12_ETMY_L1_actuator.conf'};

Model:
    /ligo/svncommon/CalSVN/aligocalibration/trunk/Runs/O2/DARMmodel/src/computeDARM.m

Will post the data for the fitting challenge later this afternoon.


I made an update to the quad matlab model to account for these mystery features. See CSWG log 11197.
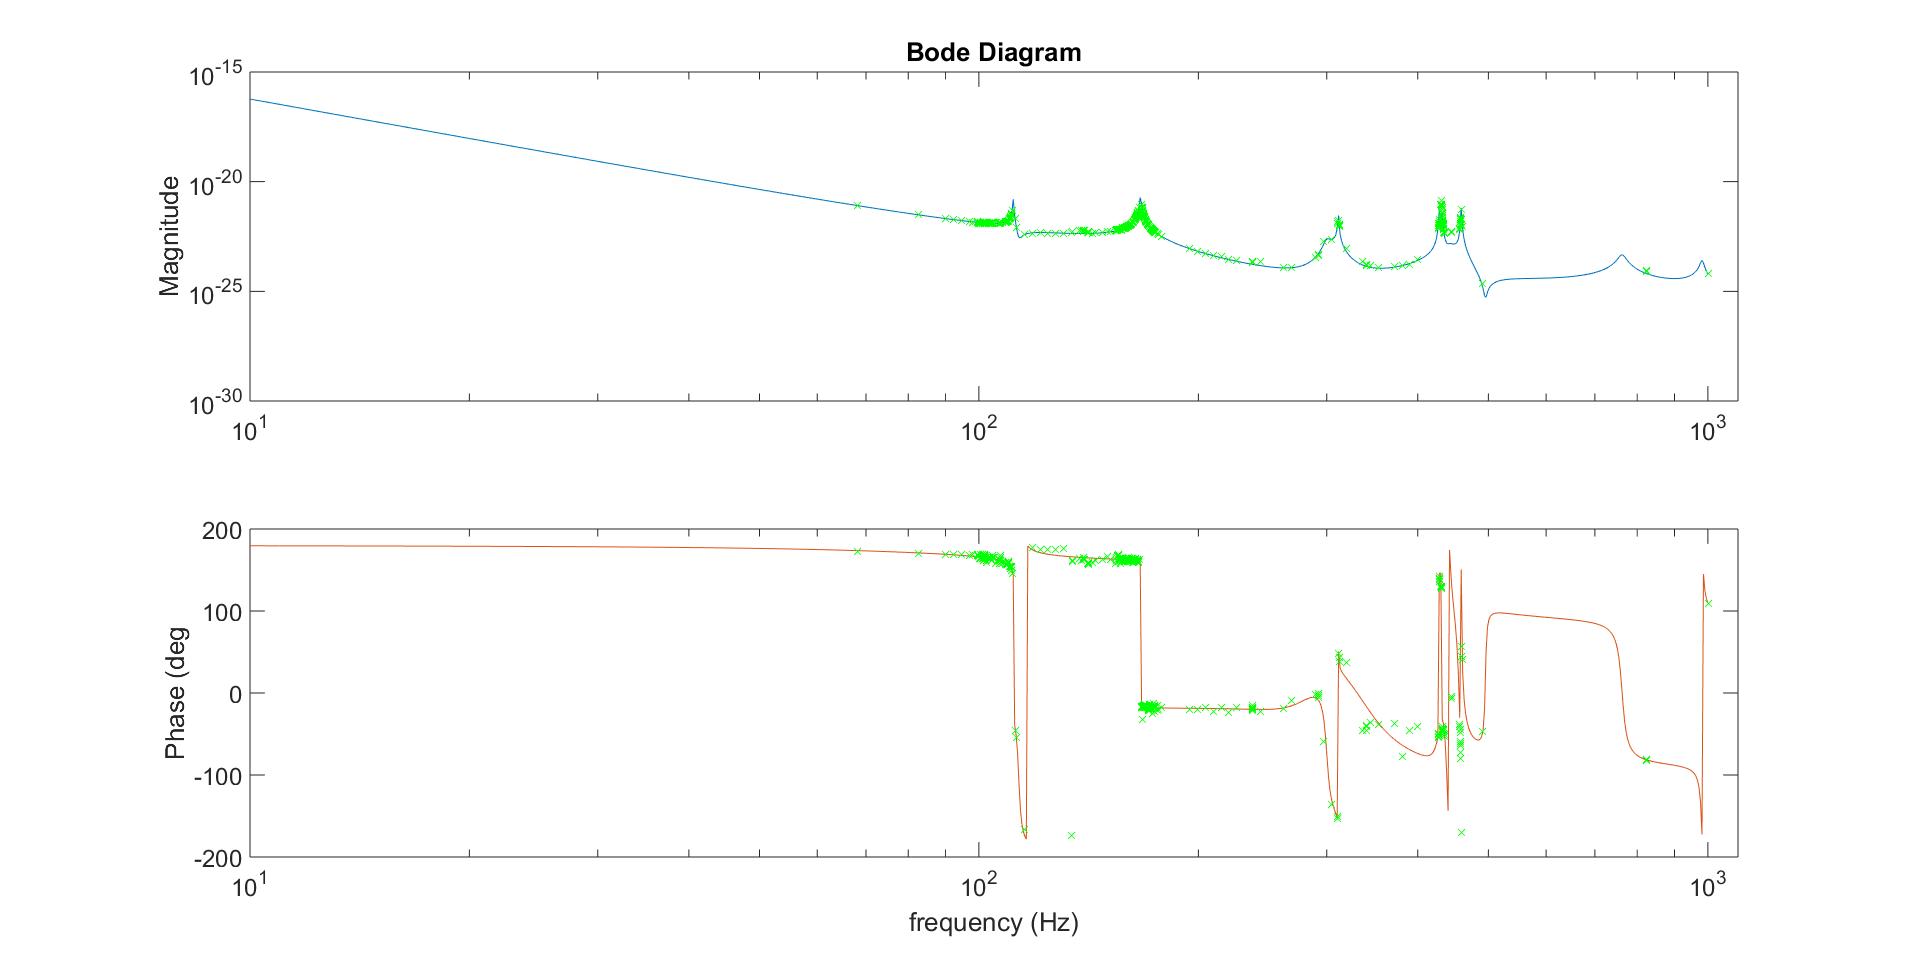
I describe my use of the Frequency Domain System Identification toolbox (FDIDENT) to fit this transfer function in CSWG elog #11205. FDIDENT is a third party Matlab toolbox which provides tools for identifying linear dynamic single-input/single-output (SISO) systems from time response or frequency response measurements. The toolbox is free for non-profit use.
https://www.mathworks.com/products/connections/product_detail/product_35570.html
http://home.mit.bme.hu/~kollar/fdident/
A stable, but non-minimum phase, model without delay – compatible with a Linear Time Invariant (LTI) representation -- results in a best fit for a 22 order numerator and 28 order denominator model, m2228. The model is compared to the measurement data in the attached bode plot.


I attach several new parts of this high frequency characterization in order to facilitate incorporating the uncertainty in any future transfer function fitting.

I attach three new text files:
    "..._tf.txt" -- a copy of the originally attached text file, columns are
        [freq re(A) im(A)]
    "..._coh.txt" -- an export of the (prefiltered) coherence, columns are
        [freq iEXCCoh PCALCoh]
    "..._relunc.txt" -- an export of the combined relative uncertainty on the transfer function, columns are
        [freq sigma_A]

Computing the uncertainty on this actuation strength was a bit of a challenge.
Remember, the above measure of the actuation strength of the UIM stage, A, is a combination of two transfer functions, as described in P1500248, Section V. In this aLOG they're referred to as "PCAL2DARM" where we use the photon calibrator as a reference actuator, and "iEXC2DARM" where the suspension stage under test is used as the actuator. Typically, the iEXC2DARM transfer function has the lowest coherence.
Even worse, I've combined many data sets of both transfer functions covering different frequency regions each with a different number of averages.
Thus form the uncertainty, I've taken each frequency region's data set, and
    - Filtered both iEXC and PCAL transfer functions for data points in which the iEXC TF has coherence greater than 0.95,
    - Created a relative uncertainty vector for each iEXC and PCAL transfer functions using the standard B&P equation,
        sigma_TF(f) / TF = sqrt( (1-C(f)) / (2 N C(f)) )
    where C(f) is the coherence, and N is the number of averages (N was 10 for swept sine TFs, 25 for broad band TFs)
    - Concatenated the data sets to form the overall transfer function, A,
    - Combined the two uncertainty vectors in the standard way,
        sigma_A / A = sqrt((sigma_iEXC / iEXC)^2 + (sigma_PCAL / PCAL)^2)
    - Sorted the collection of
        [frequency complextf iexccoh pcalcoh sigma_A]
    by frequency.
    - Exported the uncertainty.

Note that one only needs one column of uncertainty, for the absolute uncertainty in magnitude is just
    |sigma_A| = abs(A) * (sigma_A / A)
and the absolute uncertainty in phase is
    /_ sigma  = 180/pi * (sigma_A / A)

I attach a plot of the magnitude and its uncertainty for demonstrative purposes, so that when the files are used, you can compare your plots of this against mine to be sure you're using the data right. Note that I've multiplied the uncertainty by a factor of 10 for plotting only so that it's visible.

I've updated and committed the function that's used to process this data, and it can be found here:
    /ligo/svncommon/CalSVN/aligocalibration/trunk/Runs/ER10/H1/Scripts/FullIFOActuatorTFs/
    process_H1SUSETMY_L1_HFDynamicsTest_20161117.m