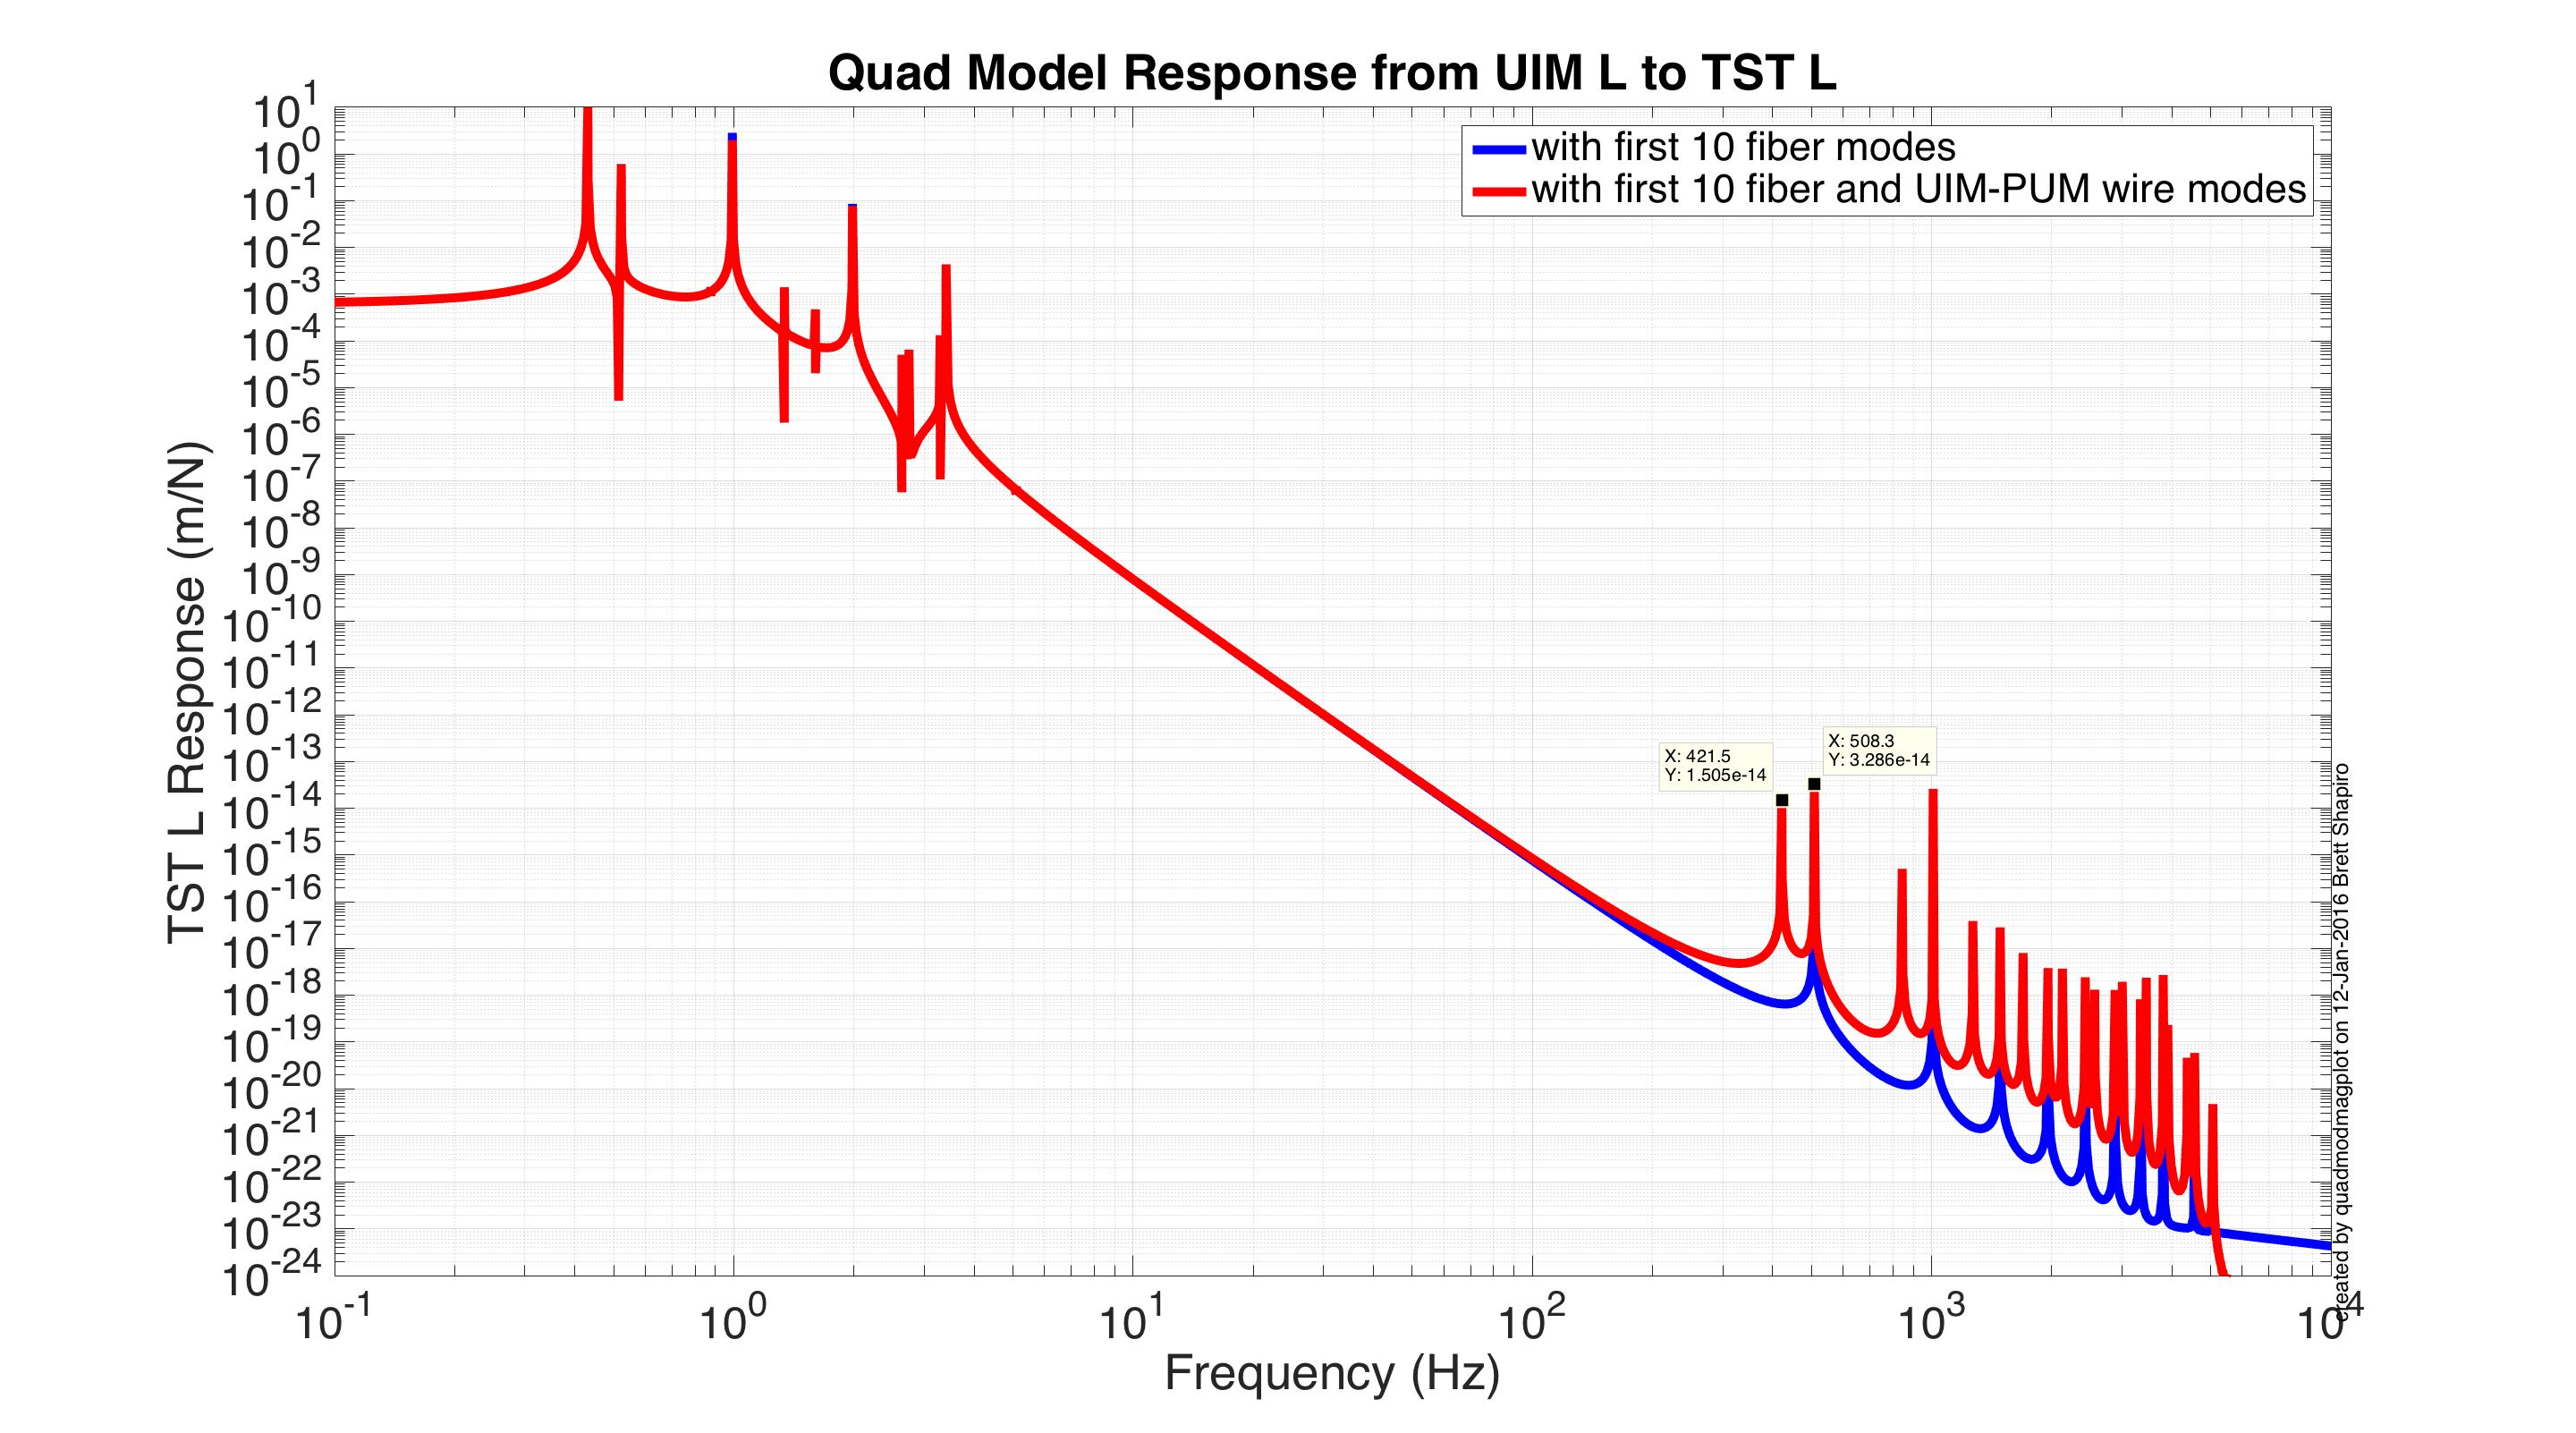
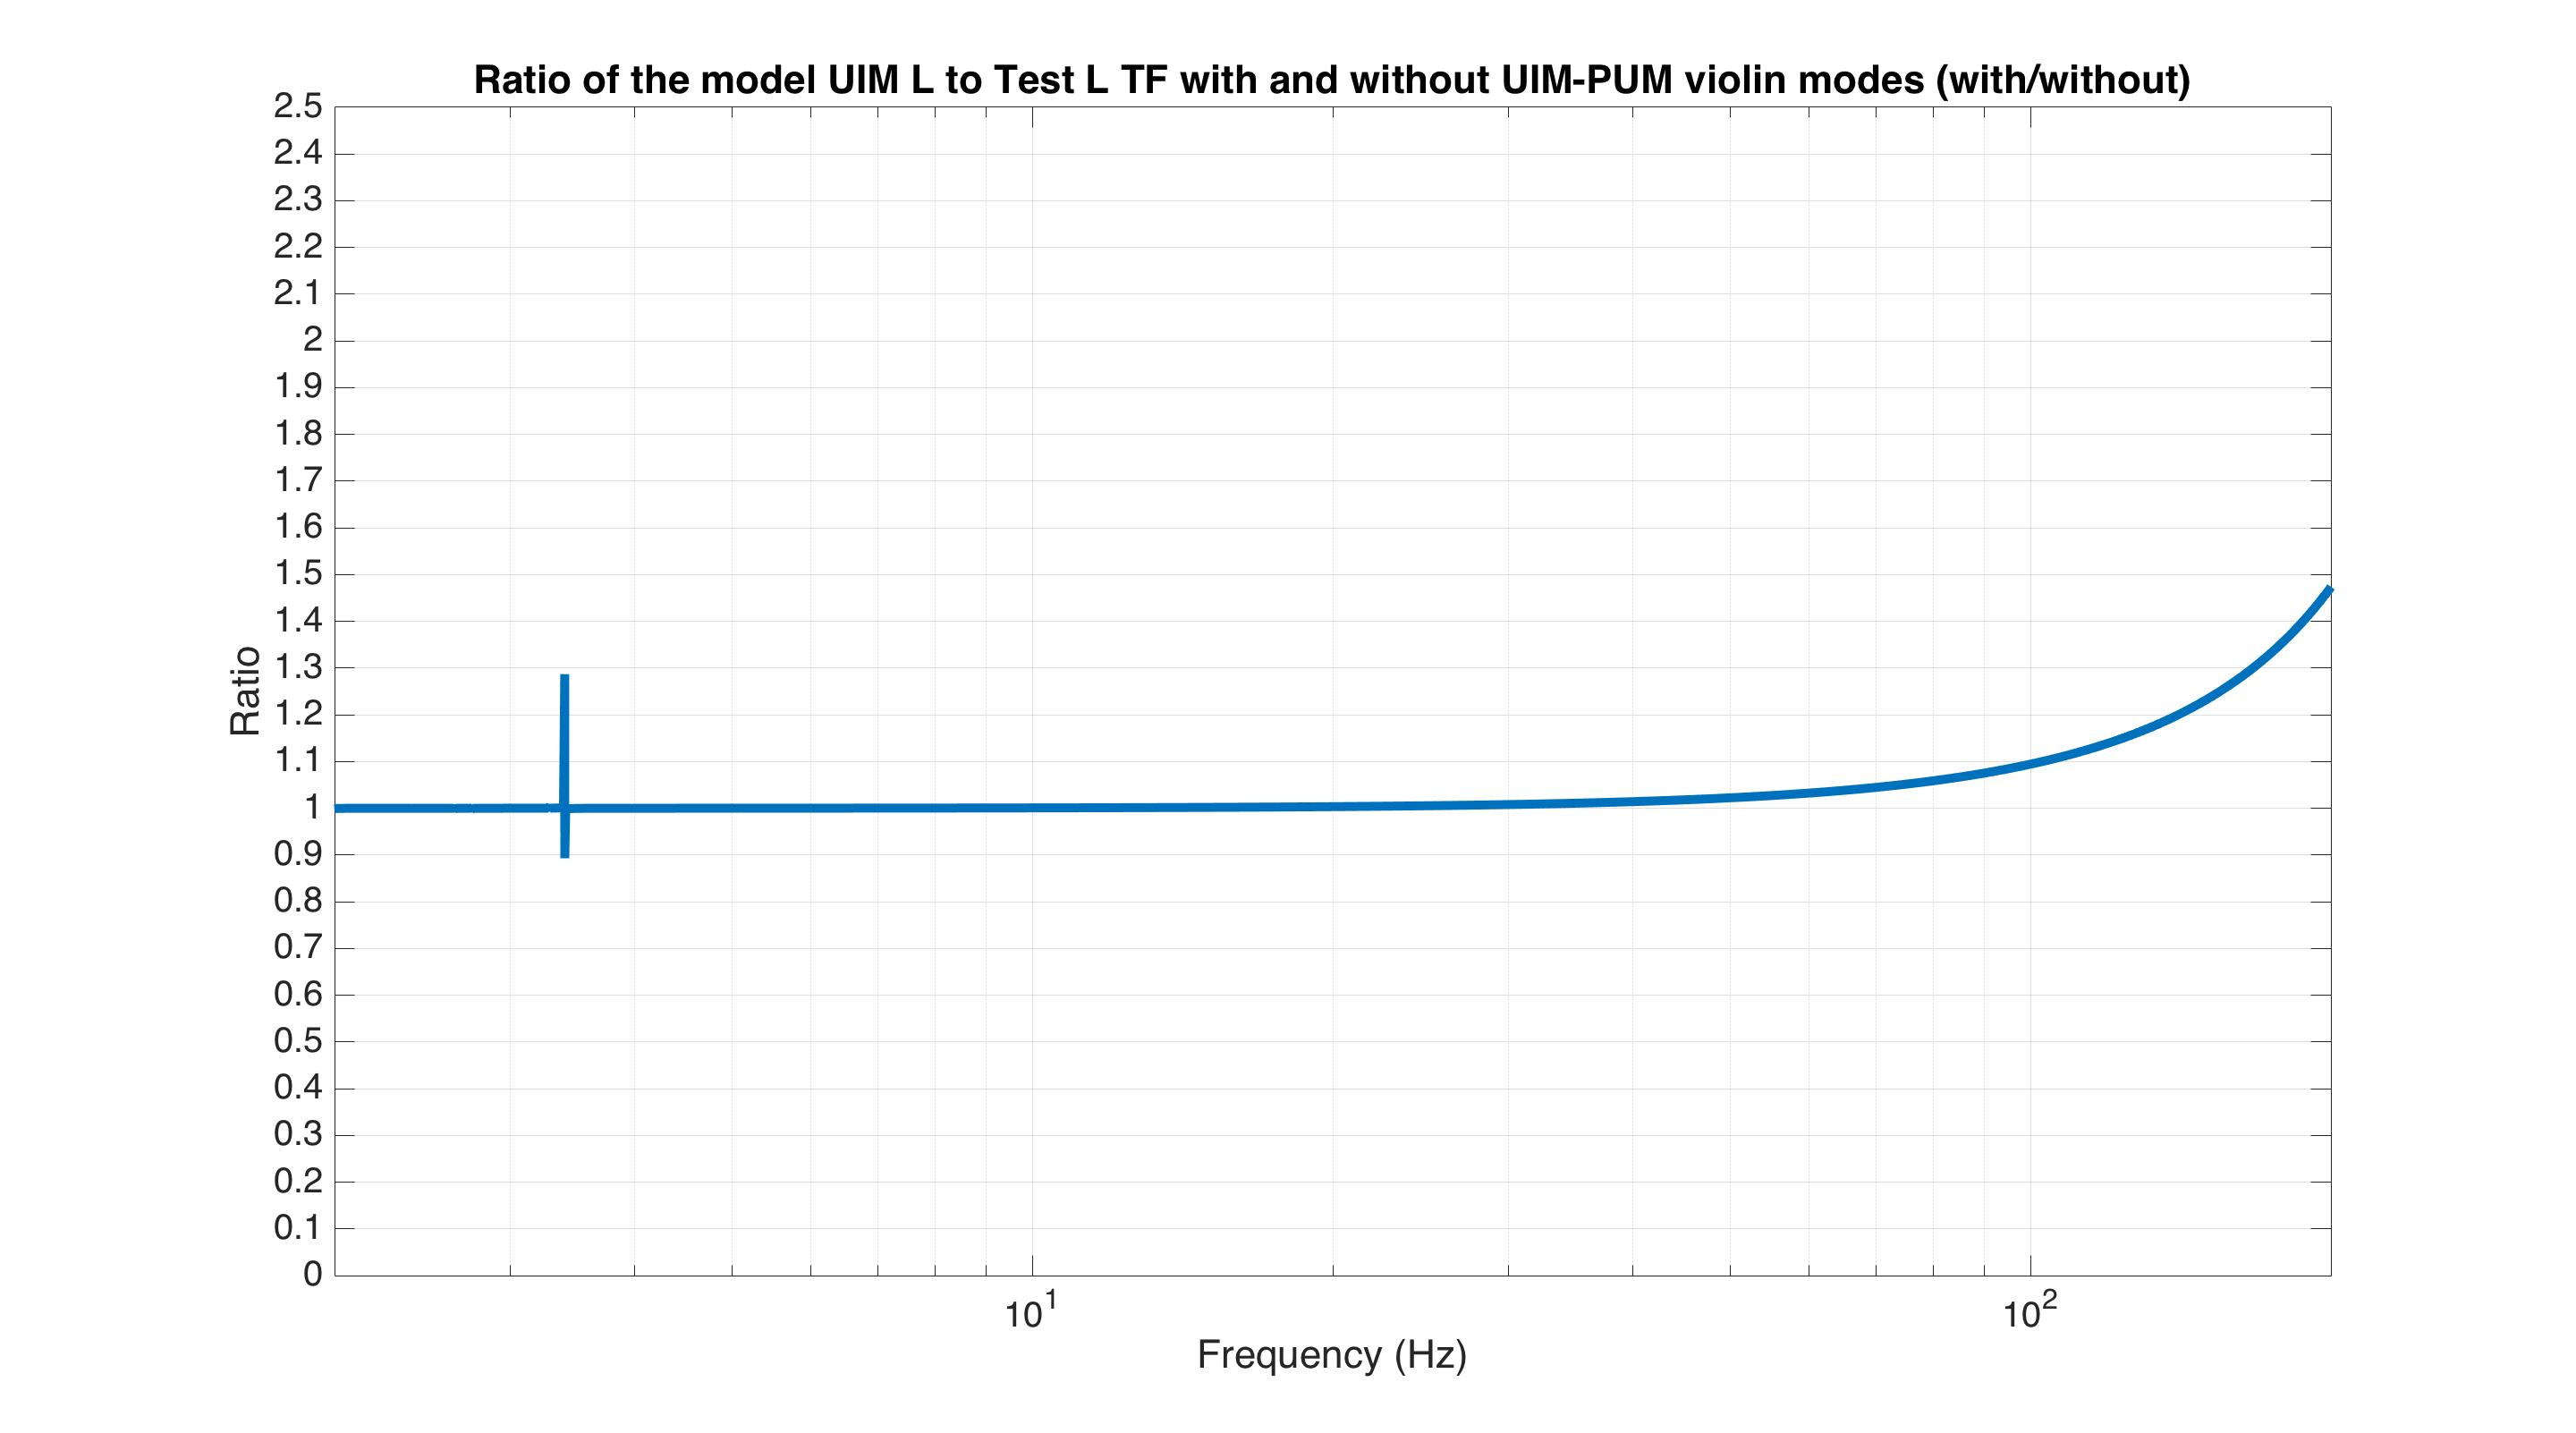
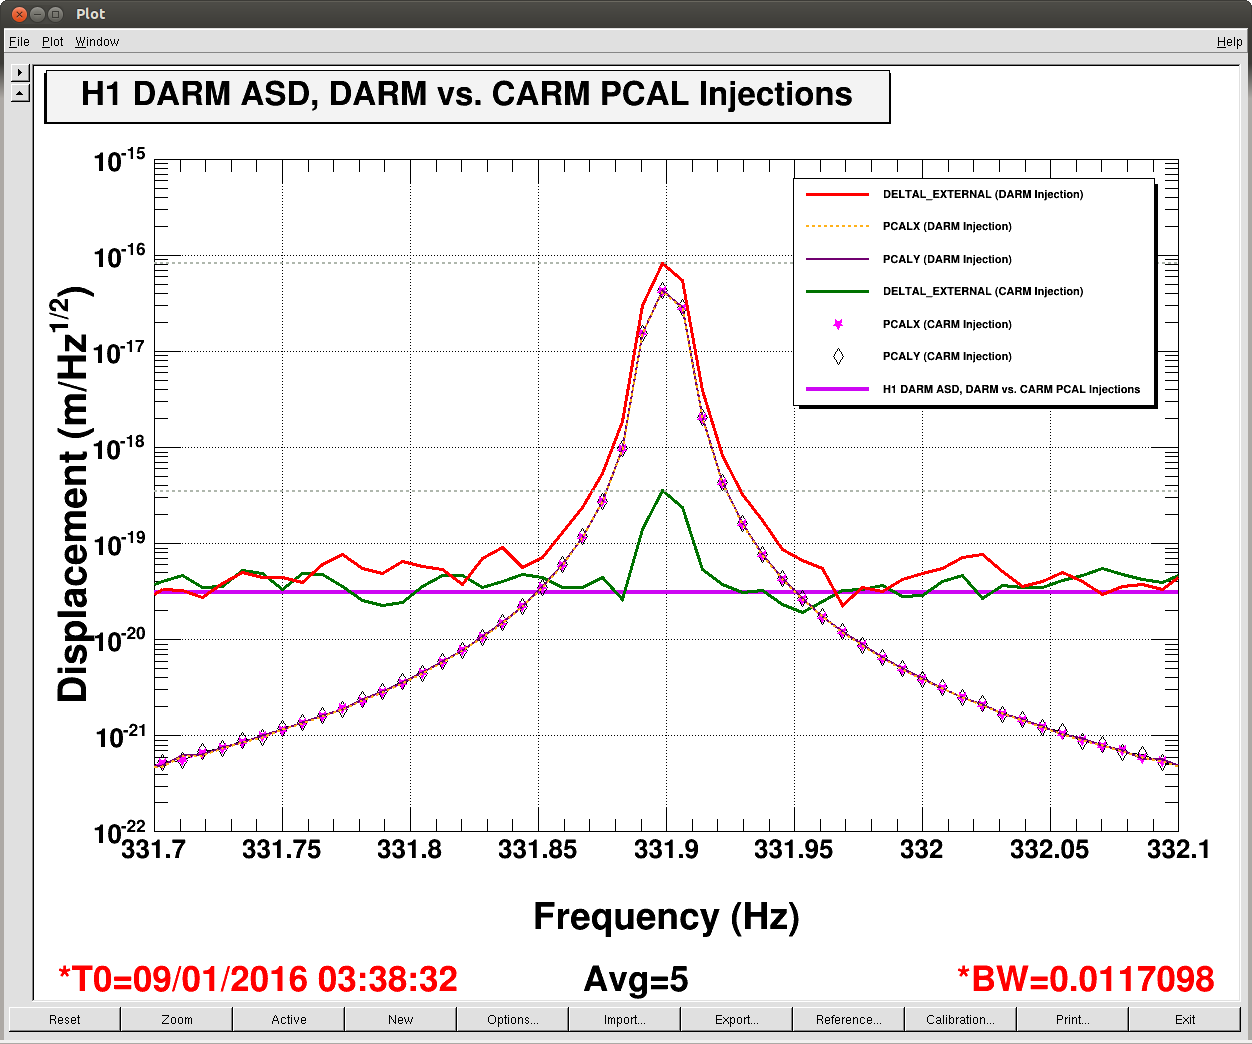
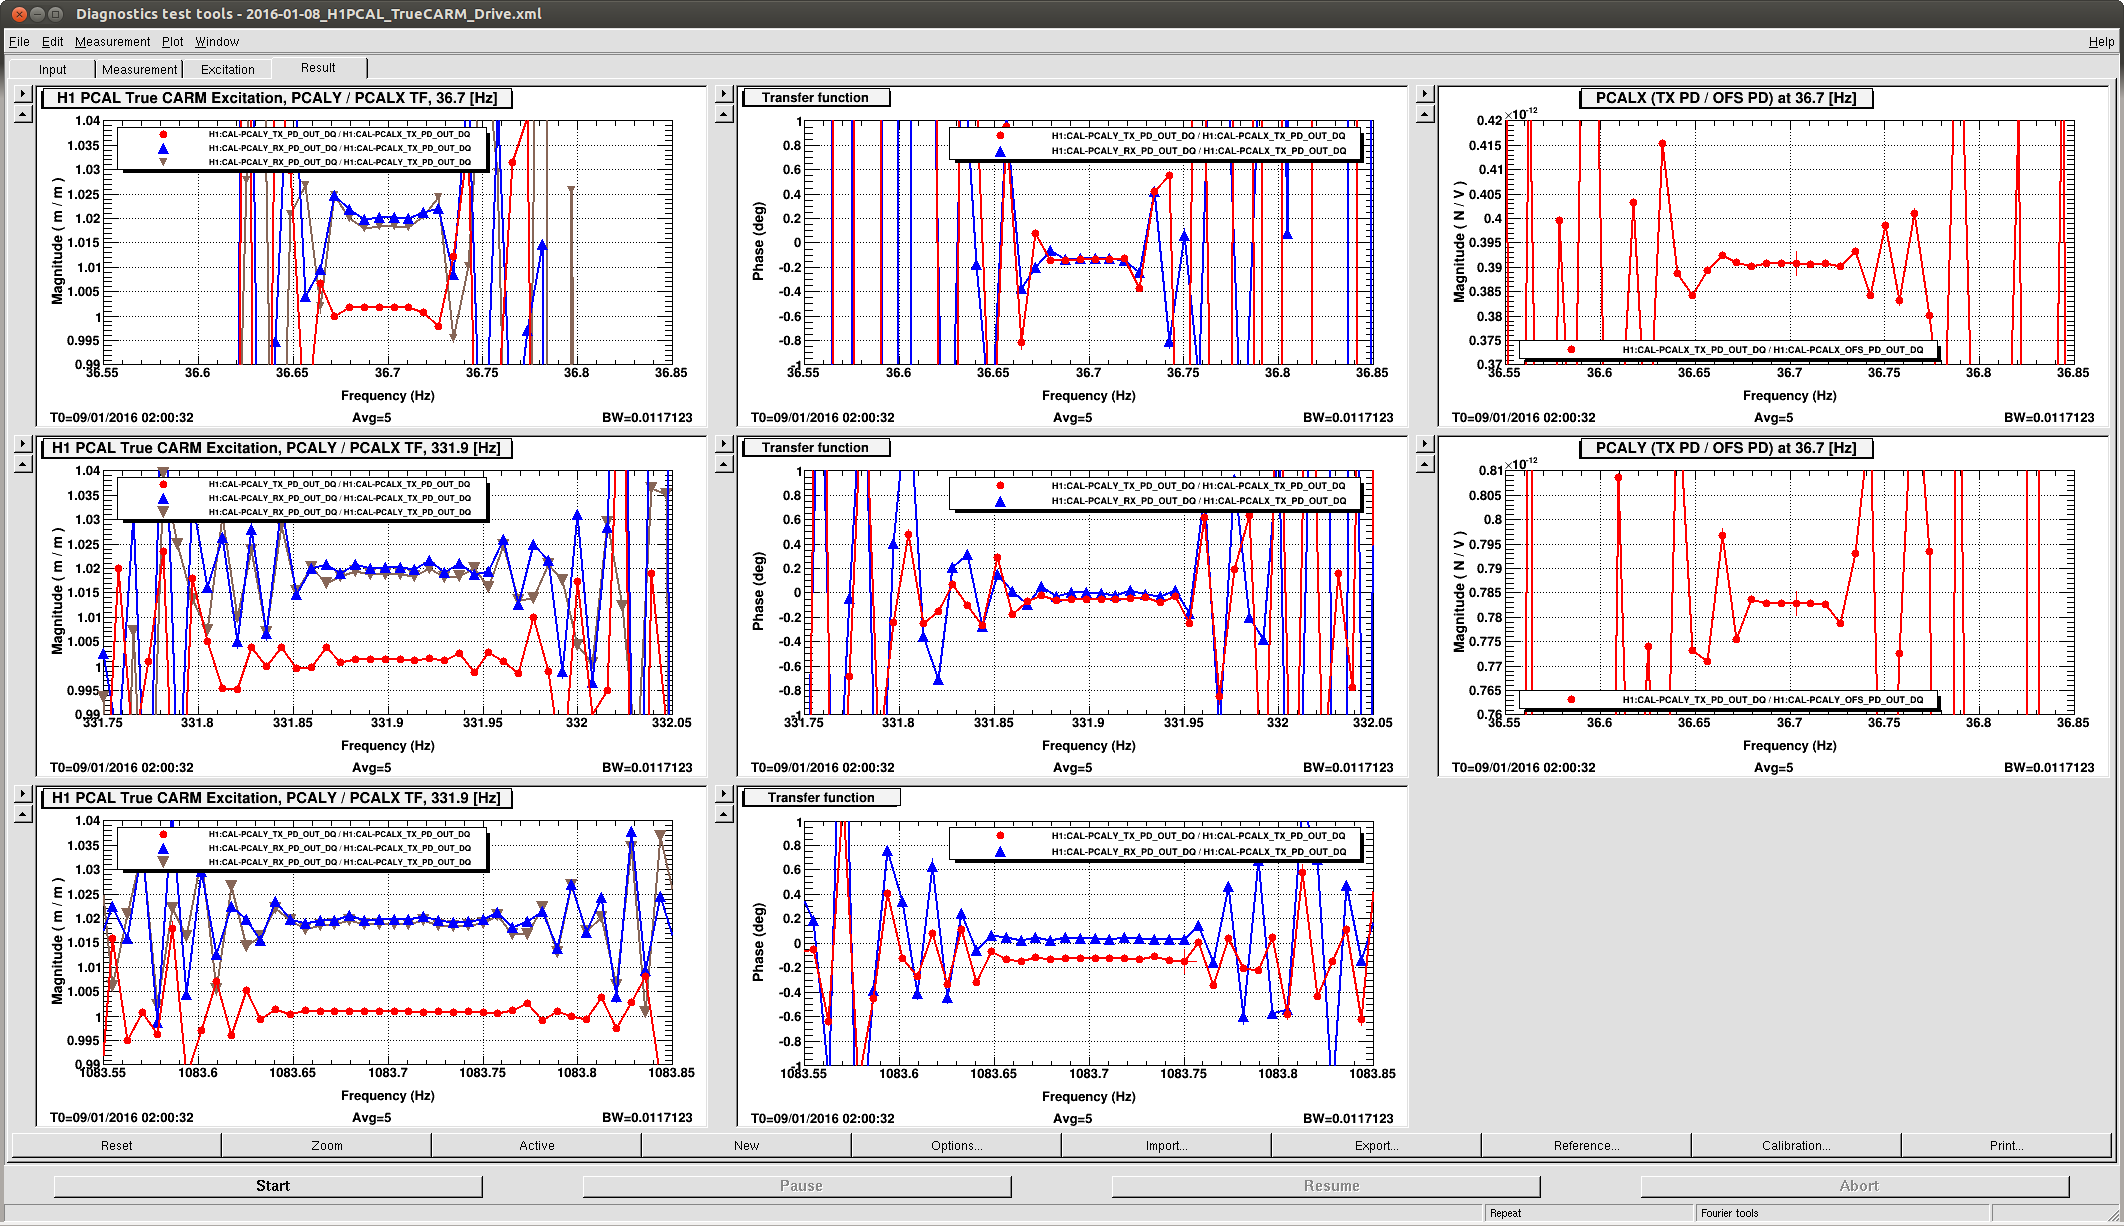
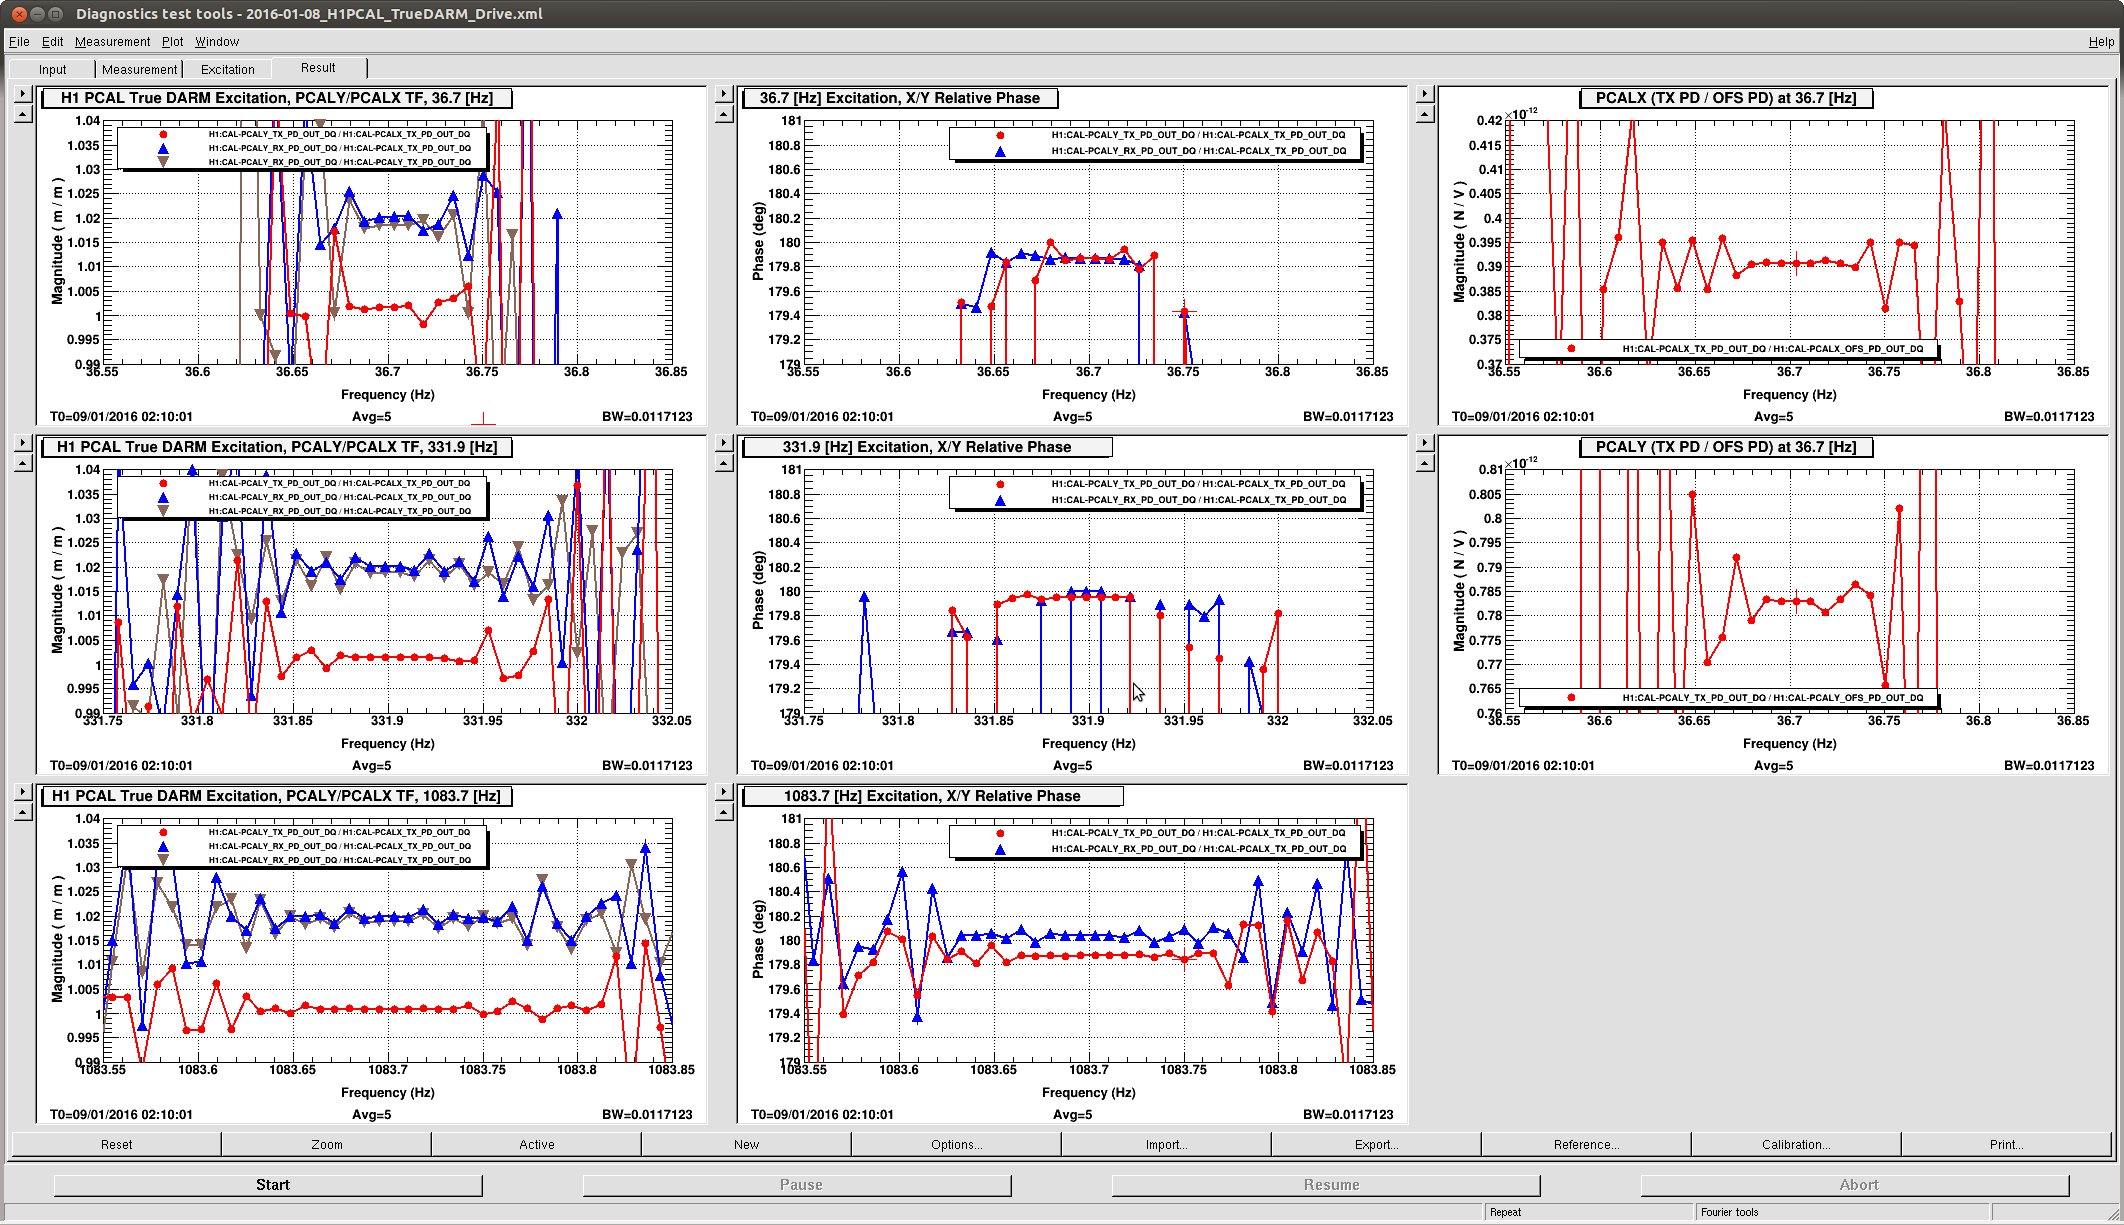
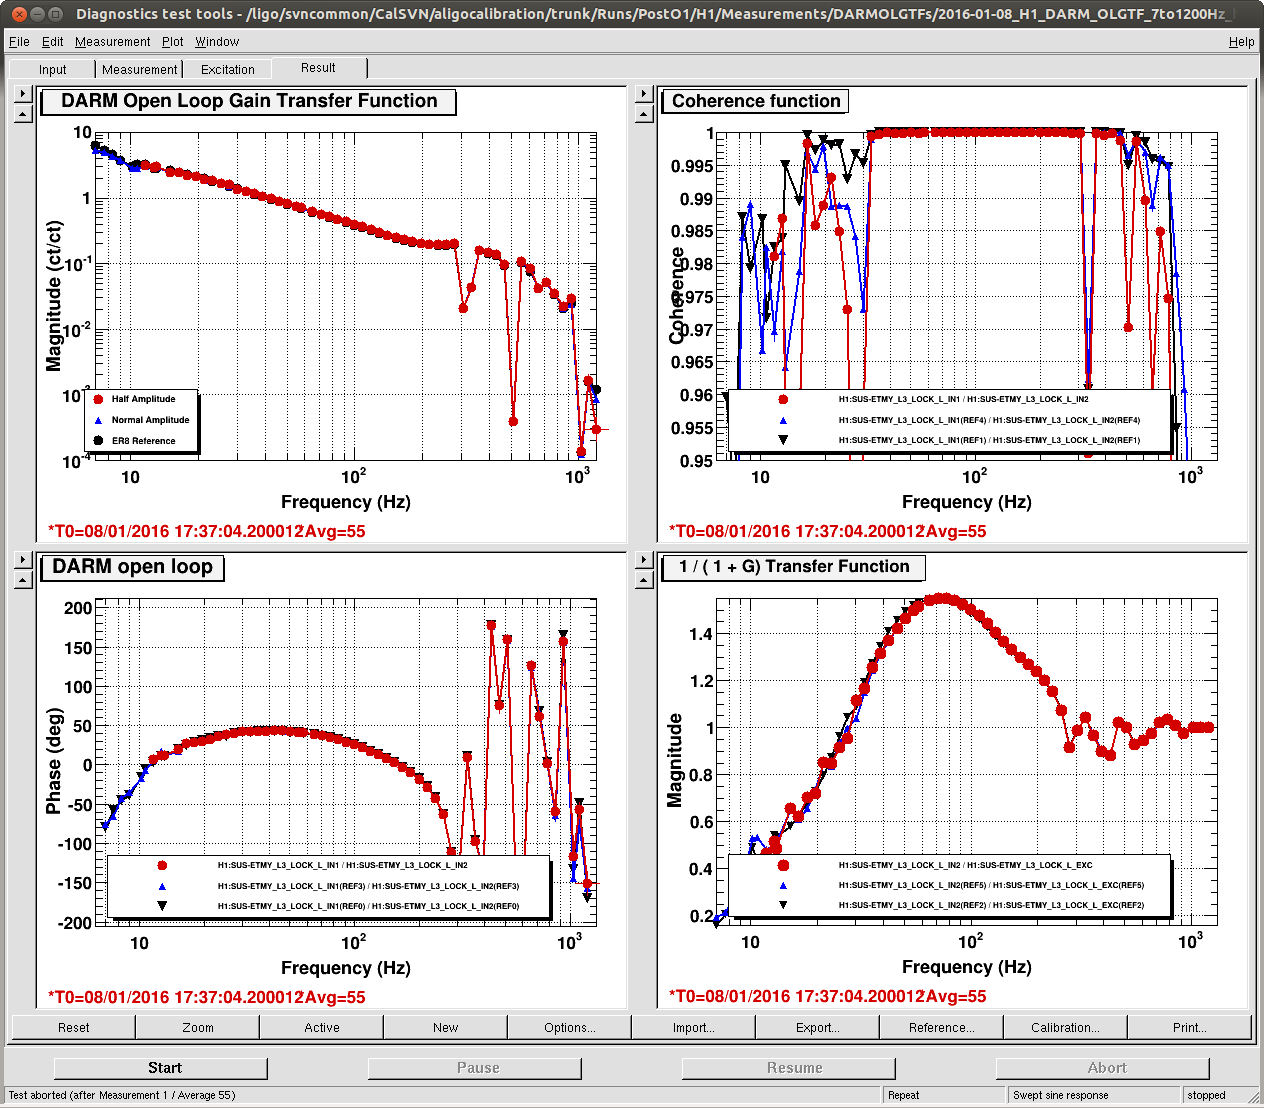
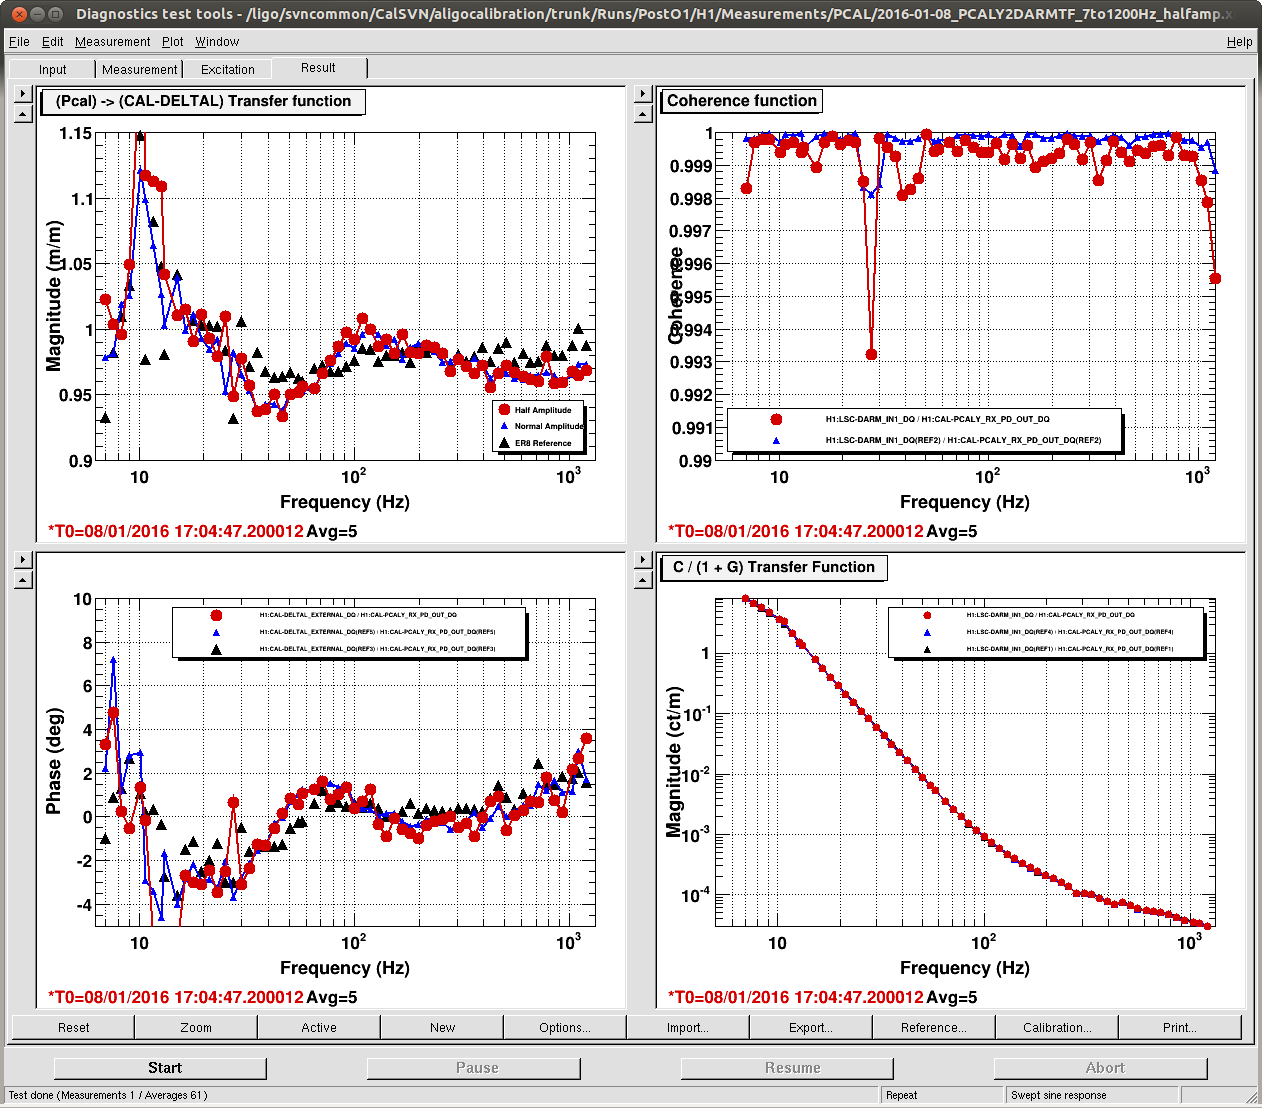
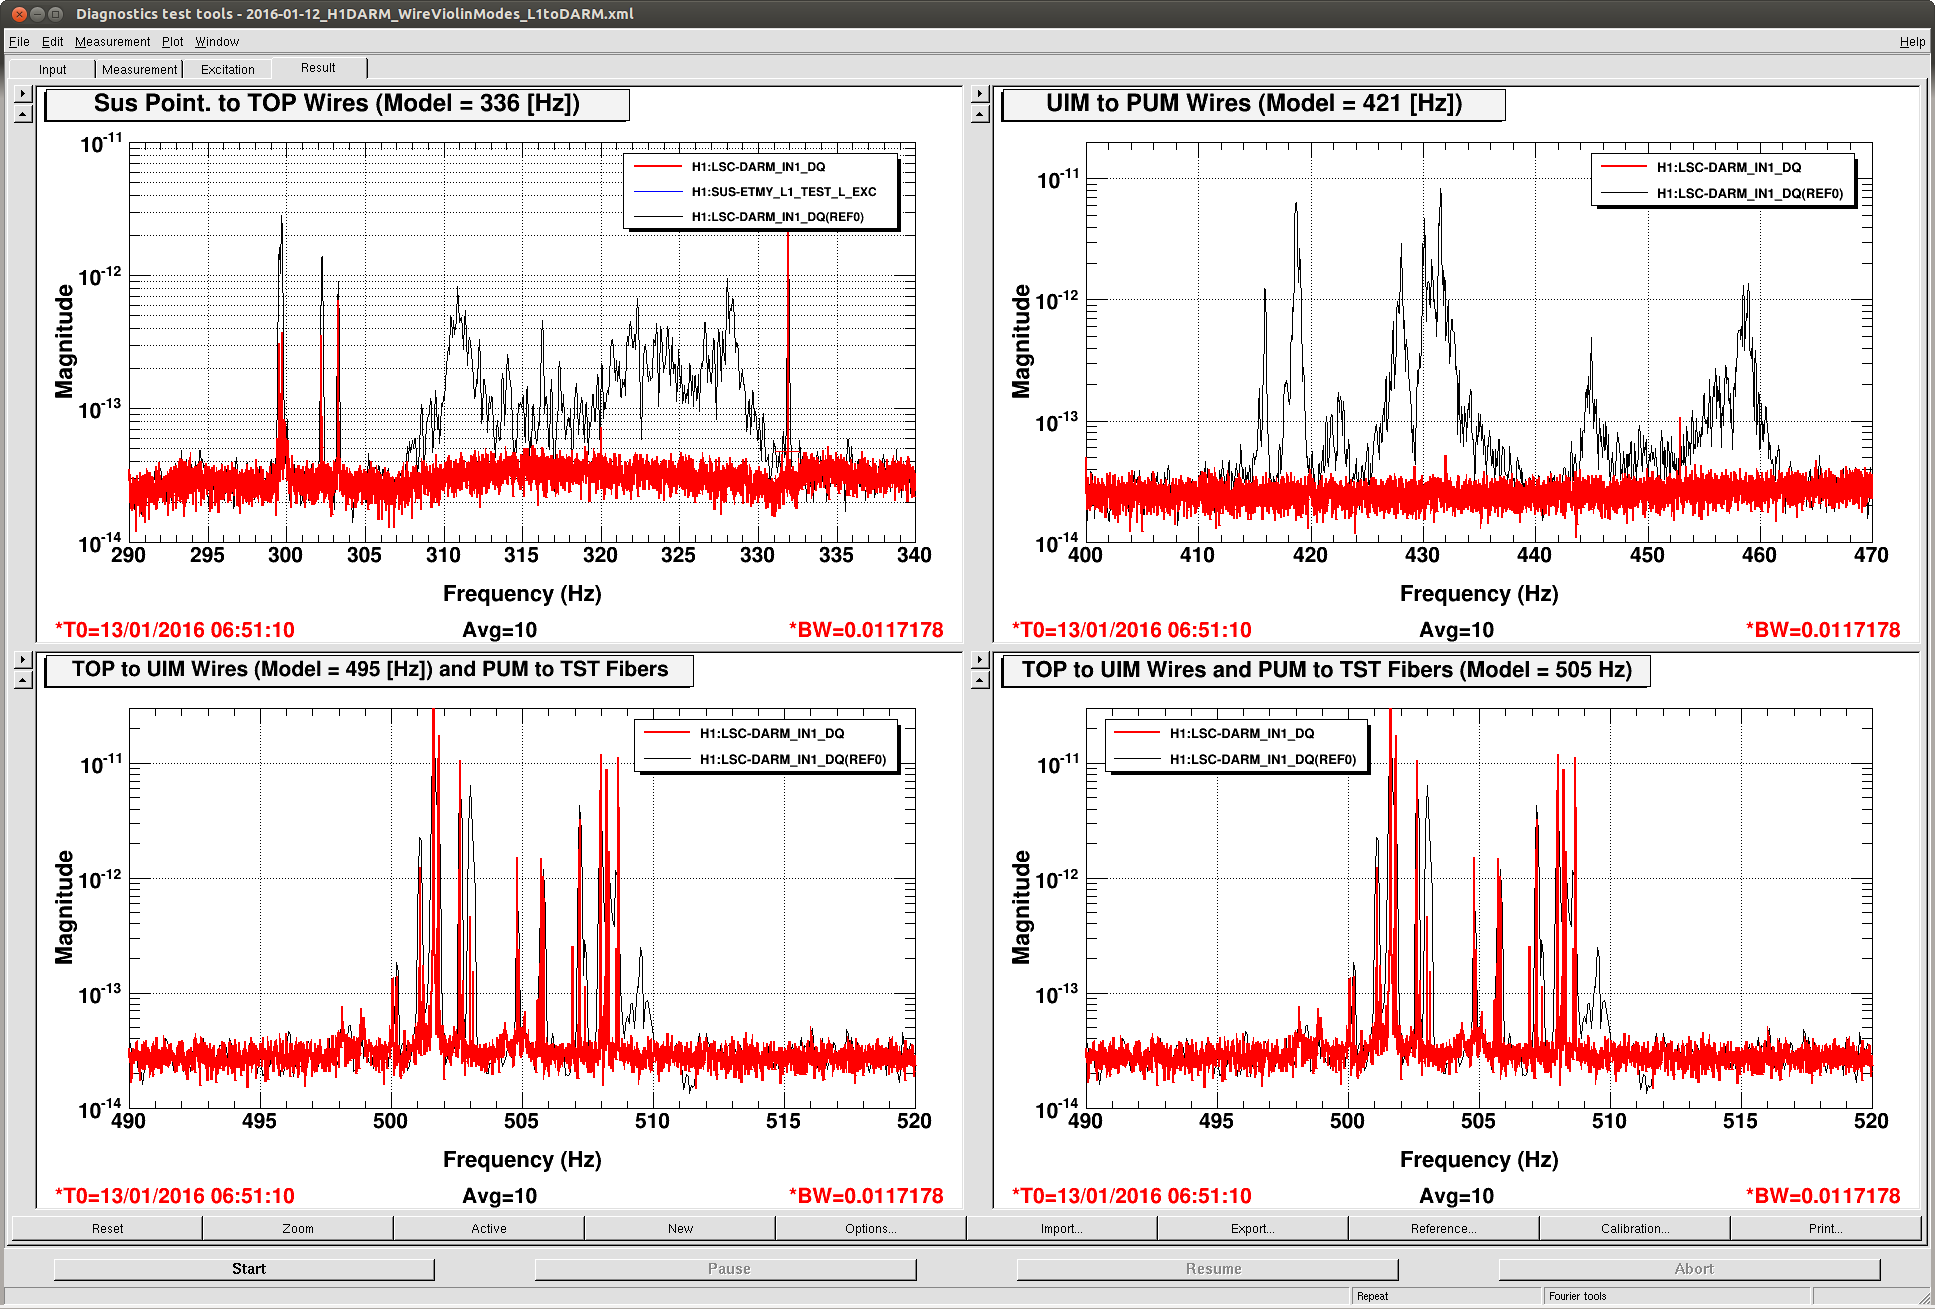
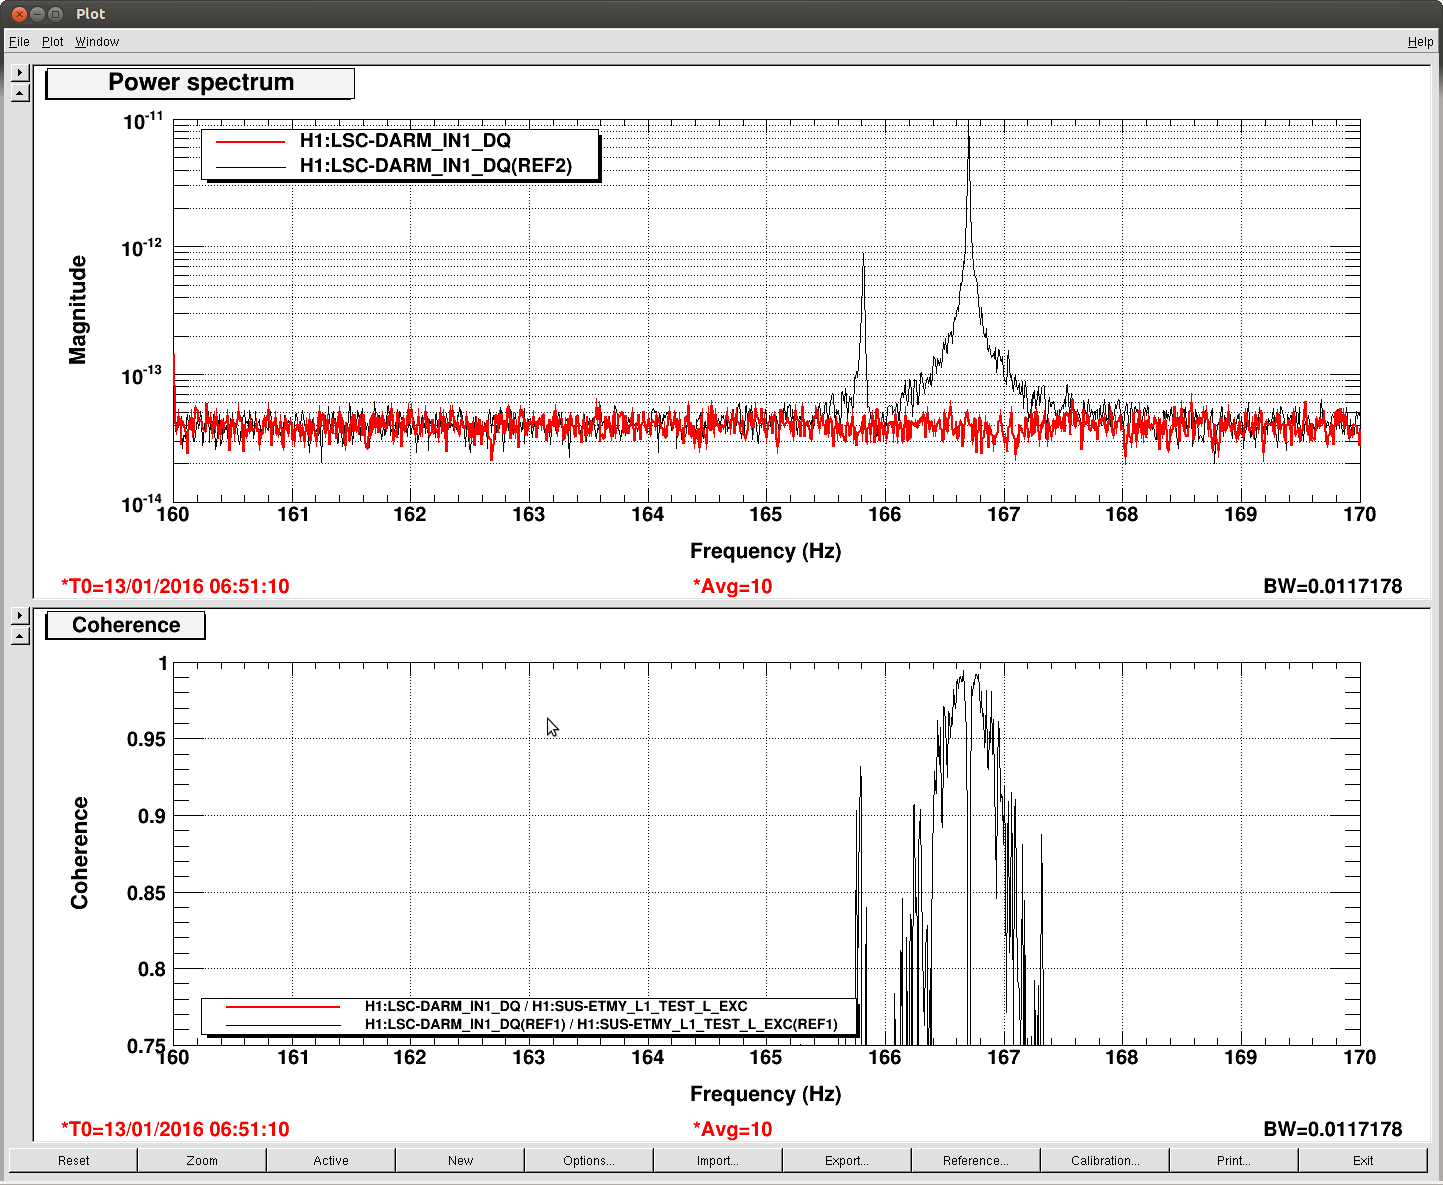
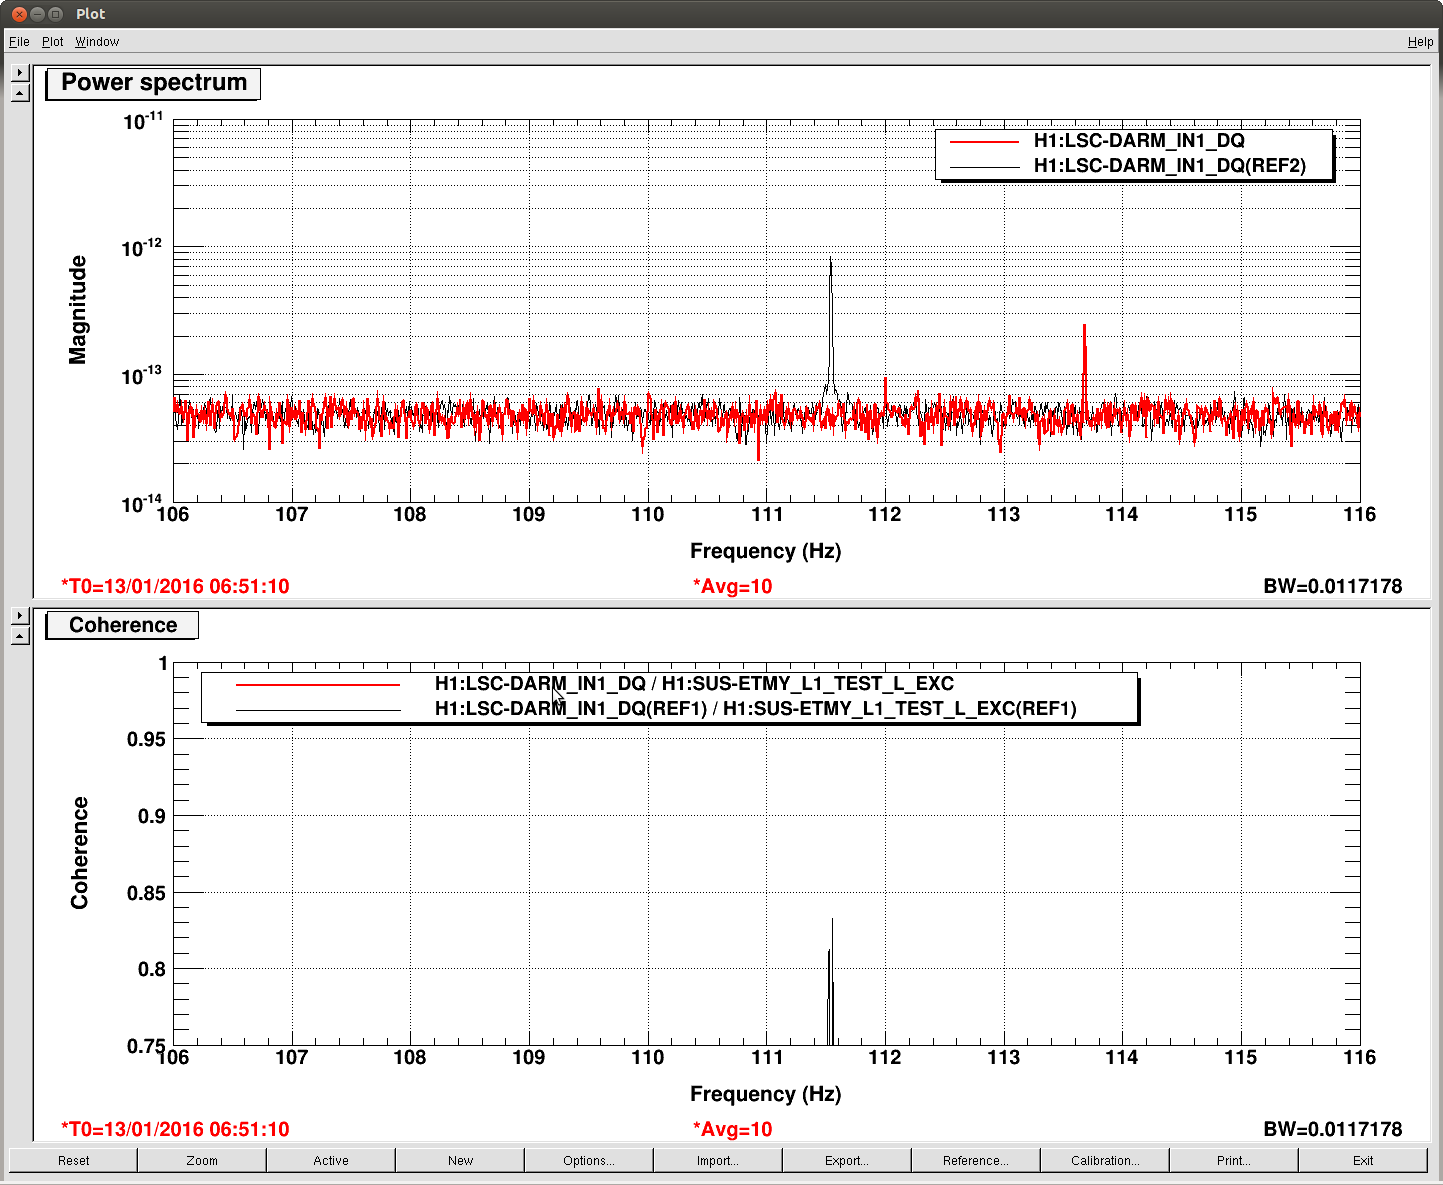
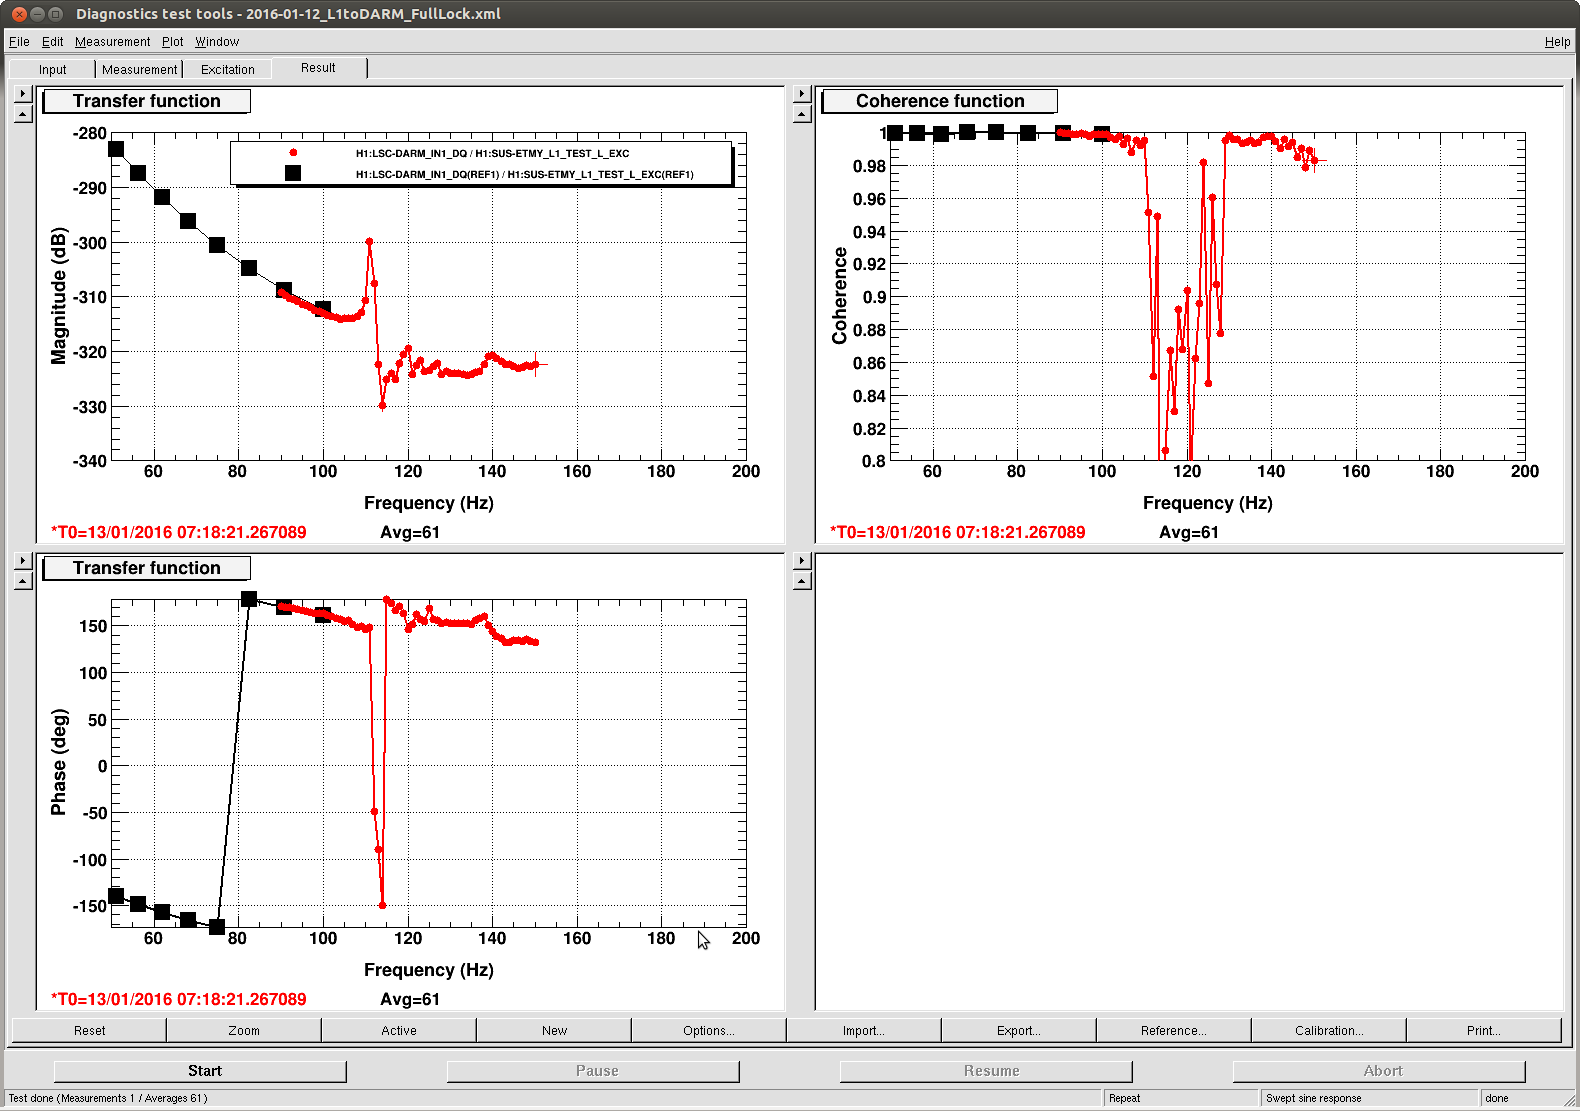
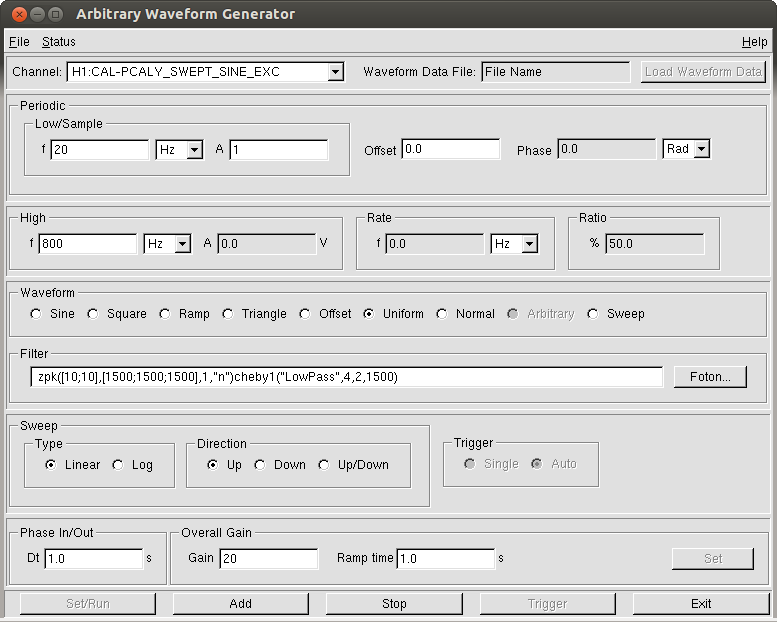
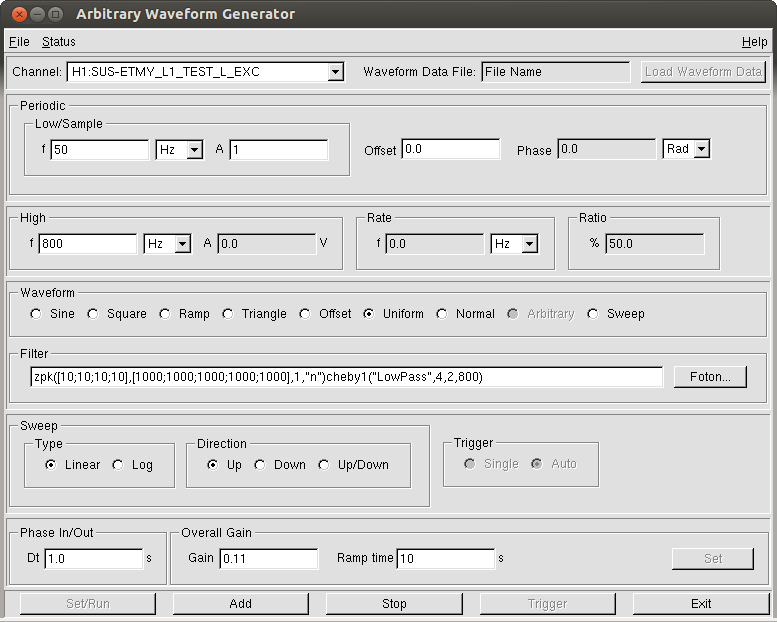
Detailed summary: https://wiki.ligo.org/DetChar/DataQuality/DQShiftLHO20151012 Summary: - Range ~75 Mpc, duty cycle: 75.83%, 49.74%,58.81% respectively -EY Magnetic Glitches Periodic 60Hz magnetic glitches are still present and are vetoed out using the channel H1:SUS-ETMY_M0_DAMP_Y_IN1_DQ -Loud Glitches The Loud glitches are still there but the number of loud glitches during analysis ready time are relatively lower than previous days. As usual few of them were vetoed using this channel ASC-AS_A_RF45_Q_YAW_OUT_DQ. The other channels which showed up as the significant channels in the significance drop plot are X and Y transmon QPDs. These is true for all the previous days since the EX beam diveter issue has been fixed. -300-400Hz Glitches These glitches seems to be related to PSL periscope. These glitches were mostly vetoed using the channel - IMC-WFS_A_DC_SUM_OUT_DQ at round 12. These glitches are not present after tuesday's maintenance (alog 22482 related to IMC WFS offset disabled). Two relevant alogs can be found here : 22418, 22154 -RF45 Glitches RF 45 glitches can be noticed again on 12th when interferometer was not locked. But at the beginning of 13th's lock we can see these glitches clearly in DARM. Some relevant alogs 22498, 22515, 22527. But there was no RF 45 glitch after ~3:30 UTC. -Low Frequency Glitches Apart from RF45 glitches there were few cluster of glitches which showed up on 12th and is present till date. HVeto ( round 10 mainly and some other rounds) as well as UPV results of 12th Oct showed that corner station seismic channels were associated with these glitches. (Related alog- 22494,22710). These glitches seem to be related to ground motion in frequency range 3-10Hz. Hveto used mainly corner station seismic channels to veto out these glitches.
The querying failure showed up and didn't go way like it has been, so I logged onto the script0 machine and it was down. Restarted it in the same screen (pid: 4403), and made sure that the ext_alert.pid had the same.
Yesterday while I was on shift I noticed that the querying failure would repeatedly pop up but then dissapear seconds later. I logged in to script0 and the script hadn't stopped, but it was just having a very hard time connecting yesterday. A "Critical connection error" would be printed frequently. Today it seemed to not be showing the same signs of connection issues, at least until I had to restart it.
The ext_alert.py script has not reported 2 different GRBs in the past two days that are on GraceDB (E194592 & E194919). Both of the external events had high latency times (3004sec and 36551sec). I am not sure if this is the reason that they were not reported. I didn't see anything in ext_alert.py or rest.py that would filter out any events with high latency, but mayb this done on the GraceDB side of things? I'll look into this more on Monday when I get a chance.
Title: 10/23 Day Shift 15:00-23:00 UTC (8:00-16:00 PST). All times in UTC.
State of H1: Observing
Shift Summary: Locked in Observing Mode for my entire shift. During a period when LLO was down, some PEM injections, electronics cabling investigations, and GW injections took place opportunistically.
Incoming operator: Jim
Activity log:
16:37 Kyle to Y28 and Mid Y
18:23 Kyle done
20:52 Commissioning mode while Sheila and Keita go to LVEA to look at cabling. I reloaded a corrected SR3_CAGE_SERVO guardian at the same time.
20:59 Sheila and Keita done
21:10 turned off light in high bay/computer room after Keita noticed it was still on
21:22 Jordan starting PEM injection
21:34 Jordan done
21:47 CW injection alarm
22:02 Stochastic injection alarm
22:09 TJ restarting DIAG_MAIN guardian
22:15 Stochastic injection complete
22:19 CW injection started
22:21 a2L script ran
22:30 Observing Mode
Summary:
- Range ~75 Mpc, observating 55% (low % largely caused by power outage)
- RF45 glitches still present
- anthropogenic noise (train band) caused many glitches in , caused 8+ newSNR triggers in BBH
- DQ shift page: https://wiki.ligo.org/DetChar/DataQuality/DQShiftH120151019
CW injections started around 22:19 UTC. We transitioned to Observing Mode at 22:30 UTC with the CW injections running.
Daniel, Sheila, Evan
Over the past 45 days, we had two instances where the common-mode length control on the end-station HEPIs hit the 250 µm software limiter. One of these events seems to have resulted in a lockloss.
The attached trends show the ISC drives to the HEPIs, the IMC-F control signal, and the IMC-F offloading to the suspension UIMs over the past 45 days. One can see two saturation events: one on 25 September, and another on 11 October.
We survived the event on 11 October: the EY HEPI hit the rail, and counts began to accumulate on the EY UIM, but the control signal turned around and HEPI came away from the rail. On the 25th of September, both end-station HEPIs hit the rail, and after about 2 hours of counts accumulating on the UIMs, IMC-F ran away (second attachment). Note that both HEPI drives started at 0 µm at the beginning of the lock stretch.
Both of these periods experienced large common drifts, when a pure tidal excitation would repeat after 24 hours. This may indicate a problem with the reference cavity temperature and PSL/LVEA temperature during these days.
Added PSL Temp Trends log in 22881.
Chris B, Joe B After LLO had locked again, Joe and I took the opportunity to perform the coherent stochastic injection. CW injections were off at both sites. And the intent bit was off at both sites. For the LLO couterpart aLog entry see: LLO aLog 21999. Waveform: The waveforms injected were: https://daqsvn.ligo-la.caltech.edu/svn/injection/hwinj/Details/stoch/Waveform/SBER8V3.txt Injection: At H1 Chris performed the injection with the command: awgstream H1:CAL-INJ_TRANSIENT_EXC 16384 SBER8V3_H1.txt 1.0 1129673117 -d -d > log_stoch.txt I've attached the log. As we were doing the injection we noticed a range drop of ~10%. IMPORTANT ACTION ITEM: The end of the stochastic waveform was not tapered. So when the injection ended it introduced a large transient into the ETMY. Robot voice was activated. This needs to be fixed. The beginning was properly tapered.
It looks like no one set the CAL-INJ_TINJ_TYPE EPICS channel prior to running awgstream. At LHO it happened to be equal to 2, so this stochastic injection was logged in H1 ODC bits and in the DQ segment database as a burst injection. At LLO it happened to be equal to 0, so this stochastic injection did not flip any of the type-specific bits in L1:CAL-INJ_ODC, although it did still flip the TRANSIENT ODC bit. So, this stochastic injection should be represented in the segment database with the ODC-INJECTION_TRANSIENT flag, but not with the ODC-INJECTION_STOCHASTIC flag.
The re-calibrated C01 hoft data generated by DCS is ready for use. It is available via NDS2 and will be published into LDR soon. The calibration factors were not applied when generating this version of hoft. The calibration group will comment separately on the uncertainties in the C01 calibration. (The calibration group is working on applying the calibration factors which will result in another version of hoft.) 1. The times the re-calibrated C01 hoft cover are: H1: 1125969920 == Sep 11 2015 01:25:03 UTC to 1128398848 == Oct 09 2015 04:07:11 UTC L1: 1126031360 == Sep 11 2015 18:29:03 UTC to 1128398848 == Oct 09 2015 04:07:11 UTC as per these alogs, https://alog.ligo-wa.caltech.edu/aLOG/index.php?callRep=22392 https://alog.ligo-la.caltech.edu/aLOG/index.php?callRep=21464 and as documented here: https://wiki.ligo.org/Calibration/GDSCalibrationConfigurations https://wiki.ligo.org/LSC/JRPComm/ObsRun1#Calibrated_Data_Generation_Plans_and_Status https://dcc.ligo.org/LIGO-T1500502 2. Users should use C00 hoft and DQ flags before/after the above times. This means the O1 analysis chunk including Oct 09 2015 04:07:11 UTC might need parts a and b, using C01 and C00 data respectively. 3. These C01 specific DQ flags exist: H1:DCS-MISSING_H1_HOFT_C01:1 H1:DCS-SCIENCE_C01:1 H1:DCS-UP_C01:1 H1:DCS-CALIBRATED_C01:1 H1:DCS-ANALYSIS_READY_C01:1 H1:DCS-INVALID_CALIBRATED_DATA_TST_C01:1 H1:DCS-INVALID_CALIBRATED_DATA_THREE_C01:1 H1:DCS-CALIB_FILTER_NOT_OK_C01:1 L1:DCS-MISSING_L1_HOFT_C01:1 L1:DCS-SCIENCE_C01:1 L1:DCS-UP_C01:1 L1:DCS-CALIBRATED_C01:1 L1:DCS-ANALYSIS_READY_C01:1 L1:DCS-INVALID_CALIBRATED_DATA_TST_C01:1 L1:DCS-INVALID_CALIBRATED_DATA_THREE_C01:1 L1:DCS-CALIB_FILTER_NOT_OK_C01:1 Summaries of the % "live" time are here: https://ldas-jobs.ligo.caltech.edu/~gmendell/DCS_SegGen_Runs/H1_C01/html_out/Segment_List.html https://ldas-jobs.ligo.caltech.edu/~gmendell/DCS_SegGen_Runs/L1_C01/html_out/Segment_List.html And due to non-zero dataValid flags, L1:DCS-ANALYSIS_READY_C01:1 will not include these segments, 1127128496 1127128592 96 1127353008 1127353104 96 1127387760 1127387856 96 1127435760 1127435856 96 1127687856 1127687952 96 1128122032 1128122075 43 1128122086 1128122128 42 1128320816 1128320912 96 Total duration = 661 seconds. but will gain these, due to gaps that have been filled in: 1126981012 1126981079 67 1126981095 1126981474 379 1126981888 1126983568 1680 1126989208 1126989232 24 Total duration = 2150 seconds. We will not lose any H1:DMT-ANALYSIS_READY:1 time, but will gain these, due to gaps that have been filled in: 1126627282 1126627298 16 1126645233 1126645244 11 1126988688 1126988732 44 1127059230 1127059246 16 1127480460 1127480471 11 1127563235 1127563246 11 Total duration = 109 seconds. 3. For analysis ini files, i. The frame-types are H1_HOFT_C01 and L1_HOFT_C01 ii. The STRAIN channels are: H1:DCS-CALIB_STRAIN_C01 16384 L1:DCS-CALIB_STRAIN_C01 16384 iii. State and DQ information is also in these channels: H1:DCS-CALIB_STATE_VECTOR_C01 16 H1:ODC-MASTER_CHANNEL_OUT_DQ 16384 L1:DCS-CALIB_STATE_VECTOR_C01 16 L1:DCS-CALIB_STRAIN_C01 16384 The bits in the STATE VECTOR are documented here: https://wiki.ligo.org/LSC/JRPComm/ObsRun1#Calibrated_Data_Generation_Plans_and_Status
Following instructions written by Keith Thorn at LLO (https://alog.ligo-la.caltech.edu/aLOG/index.php?callRep=21998) I was able to get psinject to run under control of monit. The same problem existed here as at LLO, including an existing psinject that monit didn't know about. The ~hinj/Details/pulsar/RELEASE points to O1test at LHO as at LLO. I have left psinject turned off (via monit) for now.
Joe B, Chris B Command will be: awgstream H1:CAL-INJ_TRANSIENT_EXC 16384 SBER8V3_H1.txt 1.0 1129673117 -d -d > log_stoch.txt
This test is over. More details later.
H1 has been locked for the past ~8 hours in Observing Mode. Just cruising along listening for gravitational waves.
TITLE: 10/23 OWL Shift: 07:00-15:00UTC (00:00-08:00PDT), all times posted in UTC
STATE of H1: In Observation at 77Mpc for 4+hrs.
Incoming Operator: Travis
Support: Nutsinee, Landry (chatted on phone about status), Kiwamu (on-call, but not called)
Quick Summary: H1 running in special state for 45mHz Blend Filters due to high useism with low gain on the
Shift Activities:
GRB Alarm.
In response to Corey's alog I have turned on an additional heater in the LVEA.
HC2B has been set to 9ma or one stage of heat. The discharge air is responding so I know the heater is working.
The power outage earlier this week has messed up our FMCS trending capability and Bubba and I have been trying to sort this out. There are a few bad data samples which mess up the plotting routine and apparently no way to delete these data points according to our vendor!. For the interim we can use data viewer while at LIGO but from home it is difficult to see trends.
I noticed that the end stations were running out of control range so I have incremented the heat there as well. Both end stations' heaters are now set to 9ma on the control signal. These are variac fed units so there should be no significant current spikes as in the corner where the heaters are either off or on.
LVEA Low Temperatures For Last Three Evenings
Have had a few "CS temperature is low" Verbal Alarms. Looking at trends (see attached 7-day), it seems like we've had dips in temperature for the last (3) nights. Sending Bubba & John an email.
H1 Status
Other than the lockloss and slow recovery, H1 has been doing decently at 76Mpc.
Because there have been some indications the now missing HAM3 .6hz line was electronic, I checked that it was still gone after this morning's power outage. It is, so far. Attached spectra are the GS-13s.
It looks like the line reappeared for a while on Oct 13. It is visible in the DetChar summary page for HAM3 at the link below https://ldas-jobs.ligo-wa.caltech.edu/~detchar/summary/day/20151013/plots/H1-ISI_ODC_1B8A8B_MEDIAN_RATIO_SPECTROGRAM-1128729617-86400.png I've attached a png of the plot which is linked to above.
We're still having operators run A2L before going to Observe or when leaving Observe (e.g. for maintenence), so there's more data to come, but I wanted to post what we do have, so that we can compare with LLO's aLog 21712.
The 2 plots are the same data: The first uses the same axis limits as the LLO plot, while the second is zoomed in by a factor of 5.
It certainly looks like we aren't moving nearly as much as LLO is.
Note that the values for both LLO and LHO are missing a coupling factor of L2P->L3L, which will change the absolute value of the spot position displacements. However, since we're both wrong by the same factor, our plots are still comparable. See aLog 22096 (the final comment in the linked thread) for details on the factor that we still need to include.
Today I went through all of the A2L data that has been collected so far, and pulled out for analysis all of the runs for each optic that had acceptable data. Here, I'm defining "acceptable" as data sets that had reasonable linear fits, as displayed in the auto-generated figures.
In particular, for almost all of the ETMY data sets, there is one data point that is very, very far from the others, with large error bars. I'm not sure yet why we seem to have so much trouble collecting data for ETMY. I've emailed Marie at LLO to see if they have similar symptoms.
For all of the times that we have taken measurements, I also checked whether the IFO had been on for more than 30 minutes or not. In both plots below, the cold blue data points are times when the IFO had been at Nominal Low Noise for less than 30 minutes prior to the measurement, while the hot pink data points are times when the IFO had been at Nominal Low Noise for at least 30 minutes.
The first plot is all of the data points that I accepted, plotted versus time. This is perhaps somewhat confusing, but each of the y-axes are centered about the mean spot position for that optic and degree of freedom, plus or minus 3 mm. So, each y-axis has a range of 6mm, although they're all centered around different values.
For the second plot, I find all the times that I have both acceptable pitch and yaw measurements, and plot the spots on a grid representing the face of the optic. Note that since I had zero acceptable ETMY Yaw data points, nothing is plotted for ETMY at all.
Interestingly, the ITM spots seem fairly consistent, regardless of how long the interferometer has been on, while the ETMX spots have a pretty clear trend of moving as the IFO heats up. None of our spots are moving more than +- 1.5 mm or so, so we are quite consistent.