This is a budget for the DARM noise on 2015-09-12. Compared to the previous budget, the only major difference (that we know of) is the elimination of the excess 45 MHz AM.
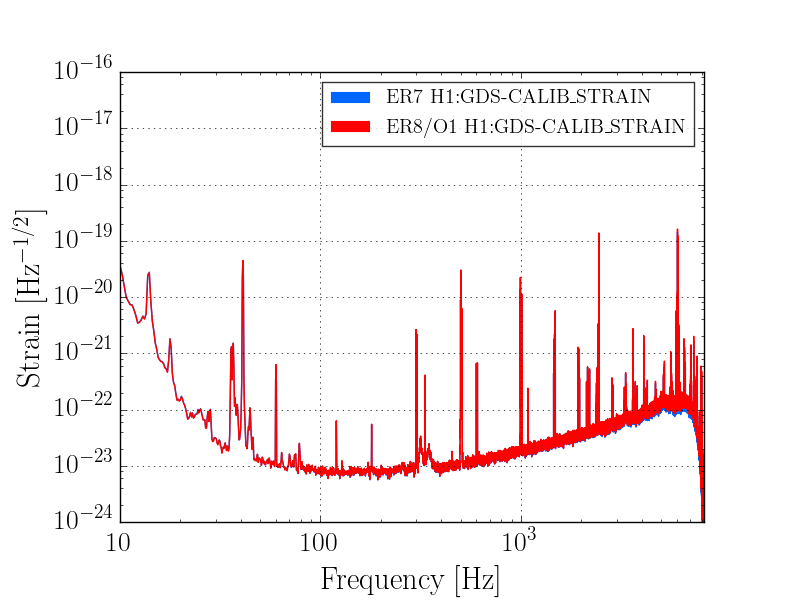
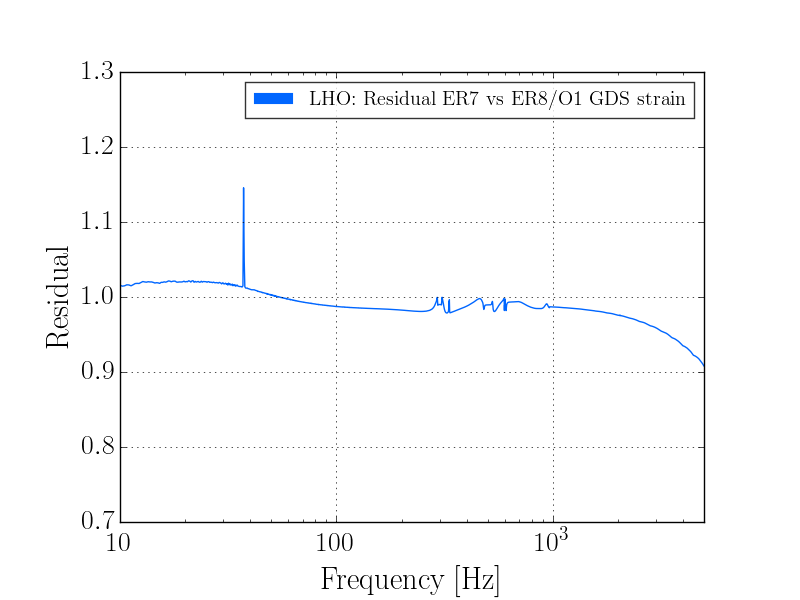
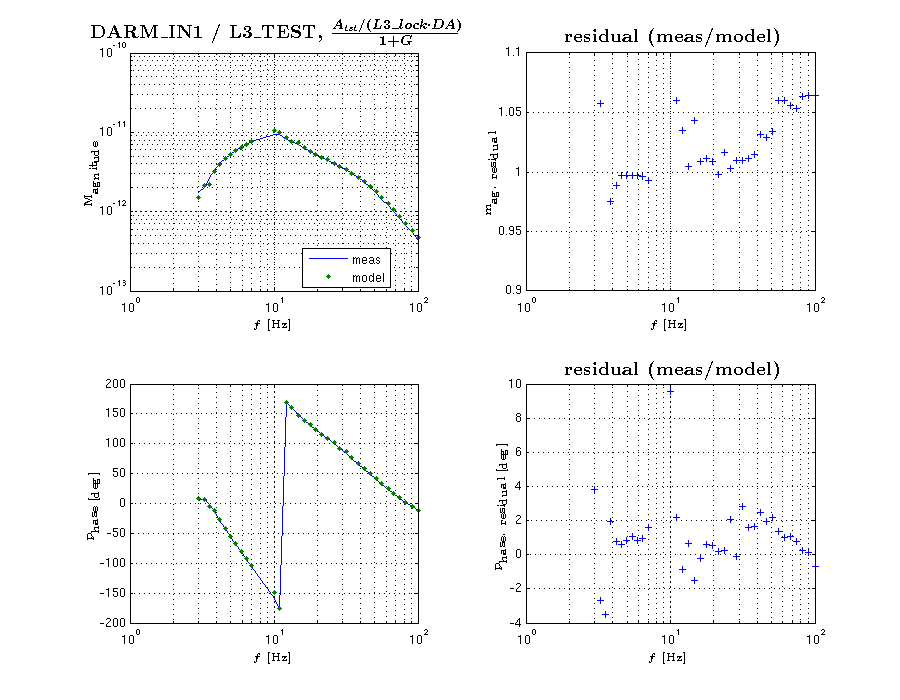
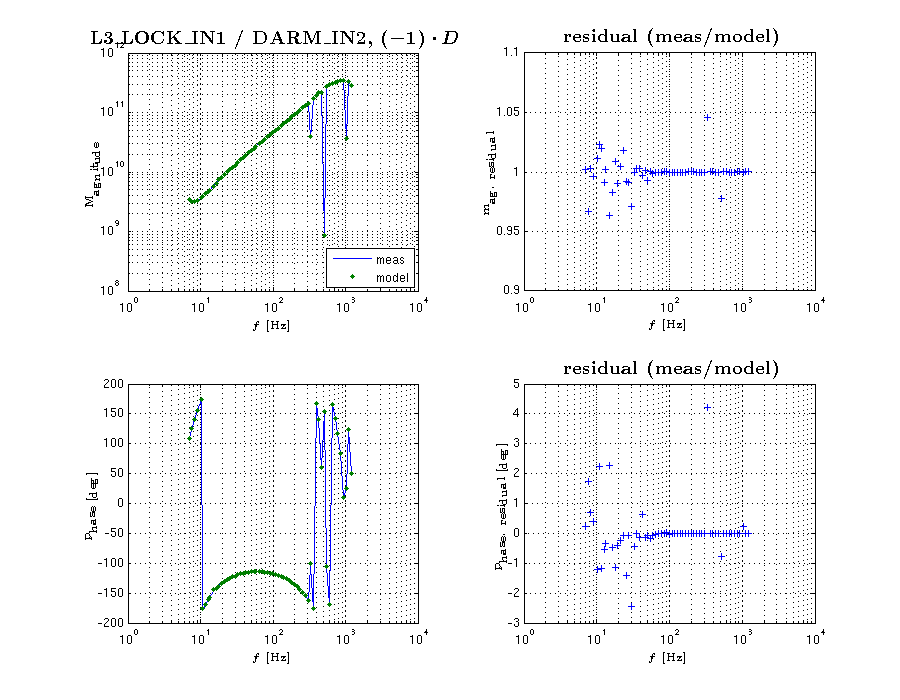
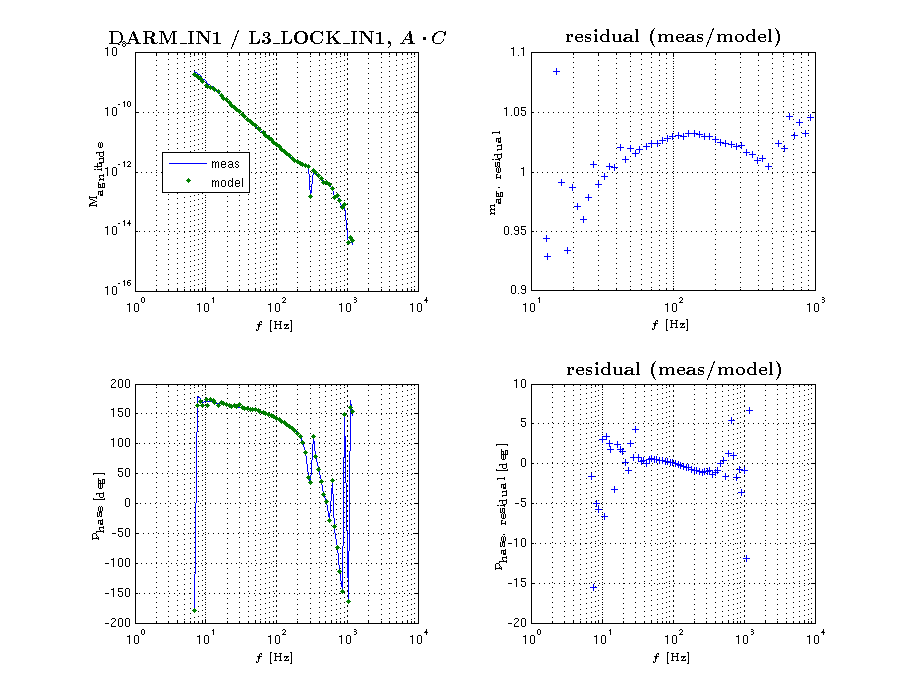
DARM spectrum and calibration
For the DARM estimation I use the DCPD sum, which is calibrated into milliamps. Calibration into freerunning displacement requires the DARM OLTF (I used the CalSVN measurement from 2015-09-10) and an estimate of the optical plant. I use Kiwamu's measurement of the optical plant along with Sudarshan's corrections to arrive at an optical gain of 3.39 mA/pm, and a DARM pole of 349 Hz.
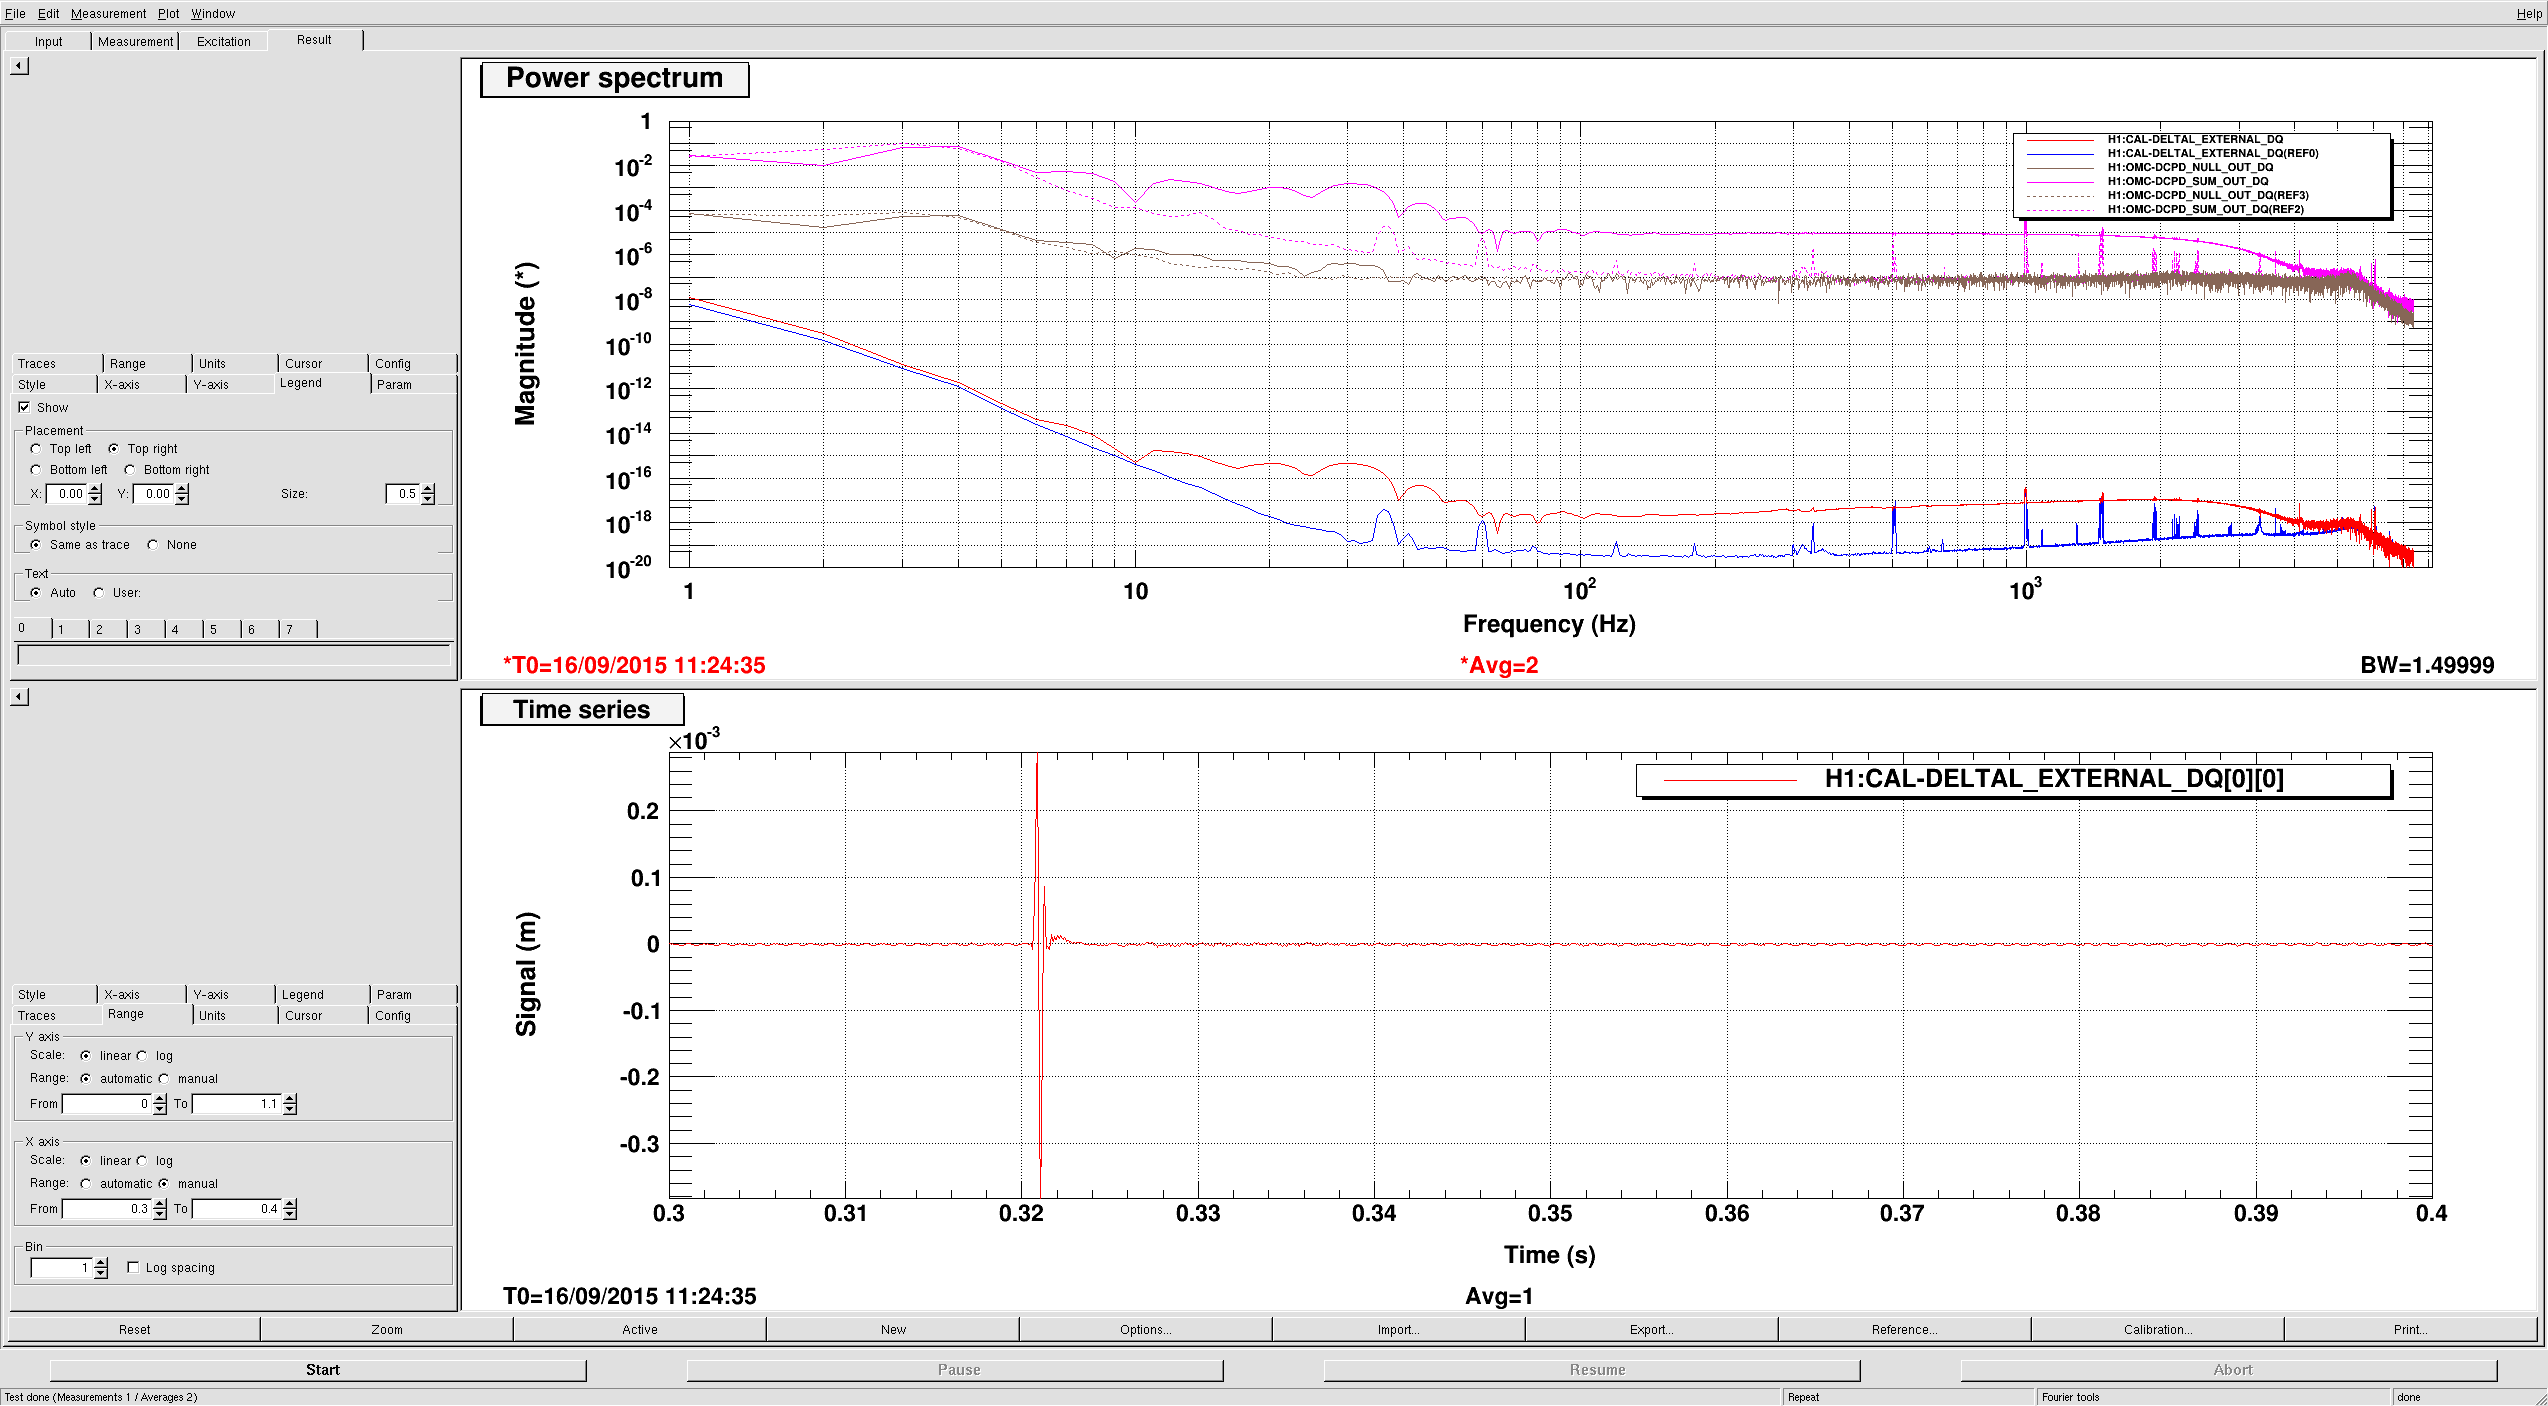
Quantum noise, DCPDs, null stream, readout losses
Quantum noise is taken from GWINC, using the same parameters as previously: recycling gain 37 W/W, 107 kW circulating power, 755 kW BS power, 87 % quantum efficiency, 14 % other readout losses. The dark noise is taken from a measurement made several months ago.
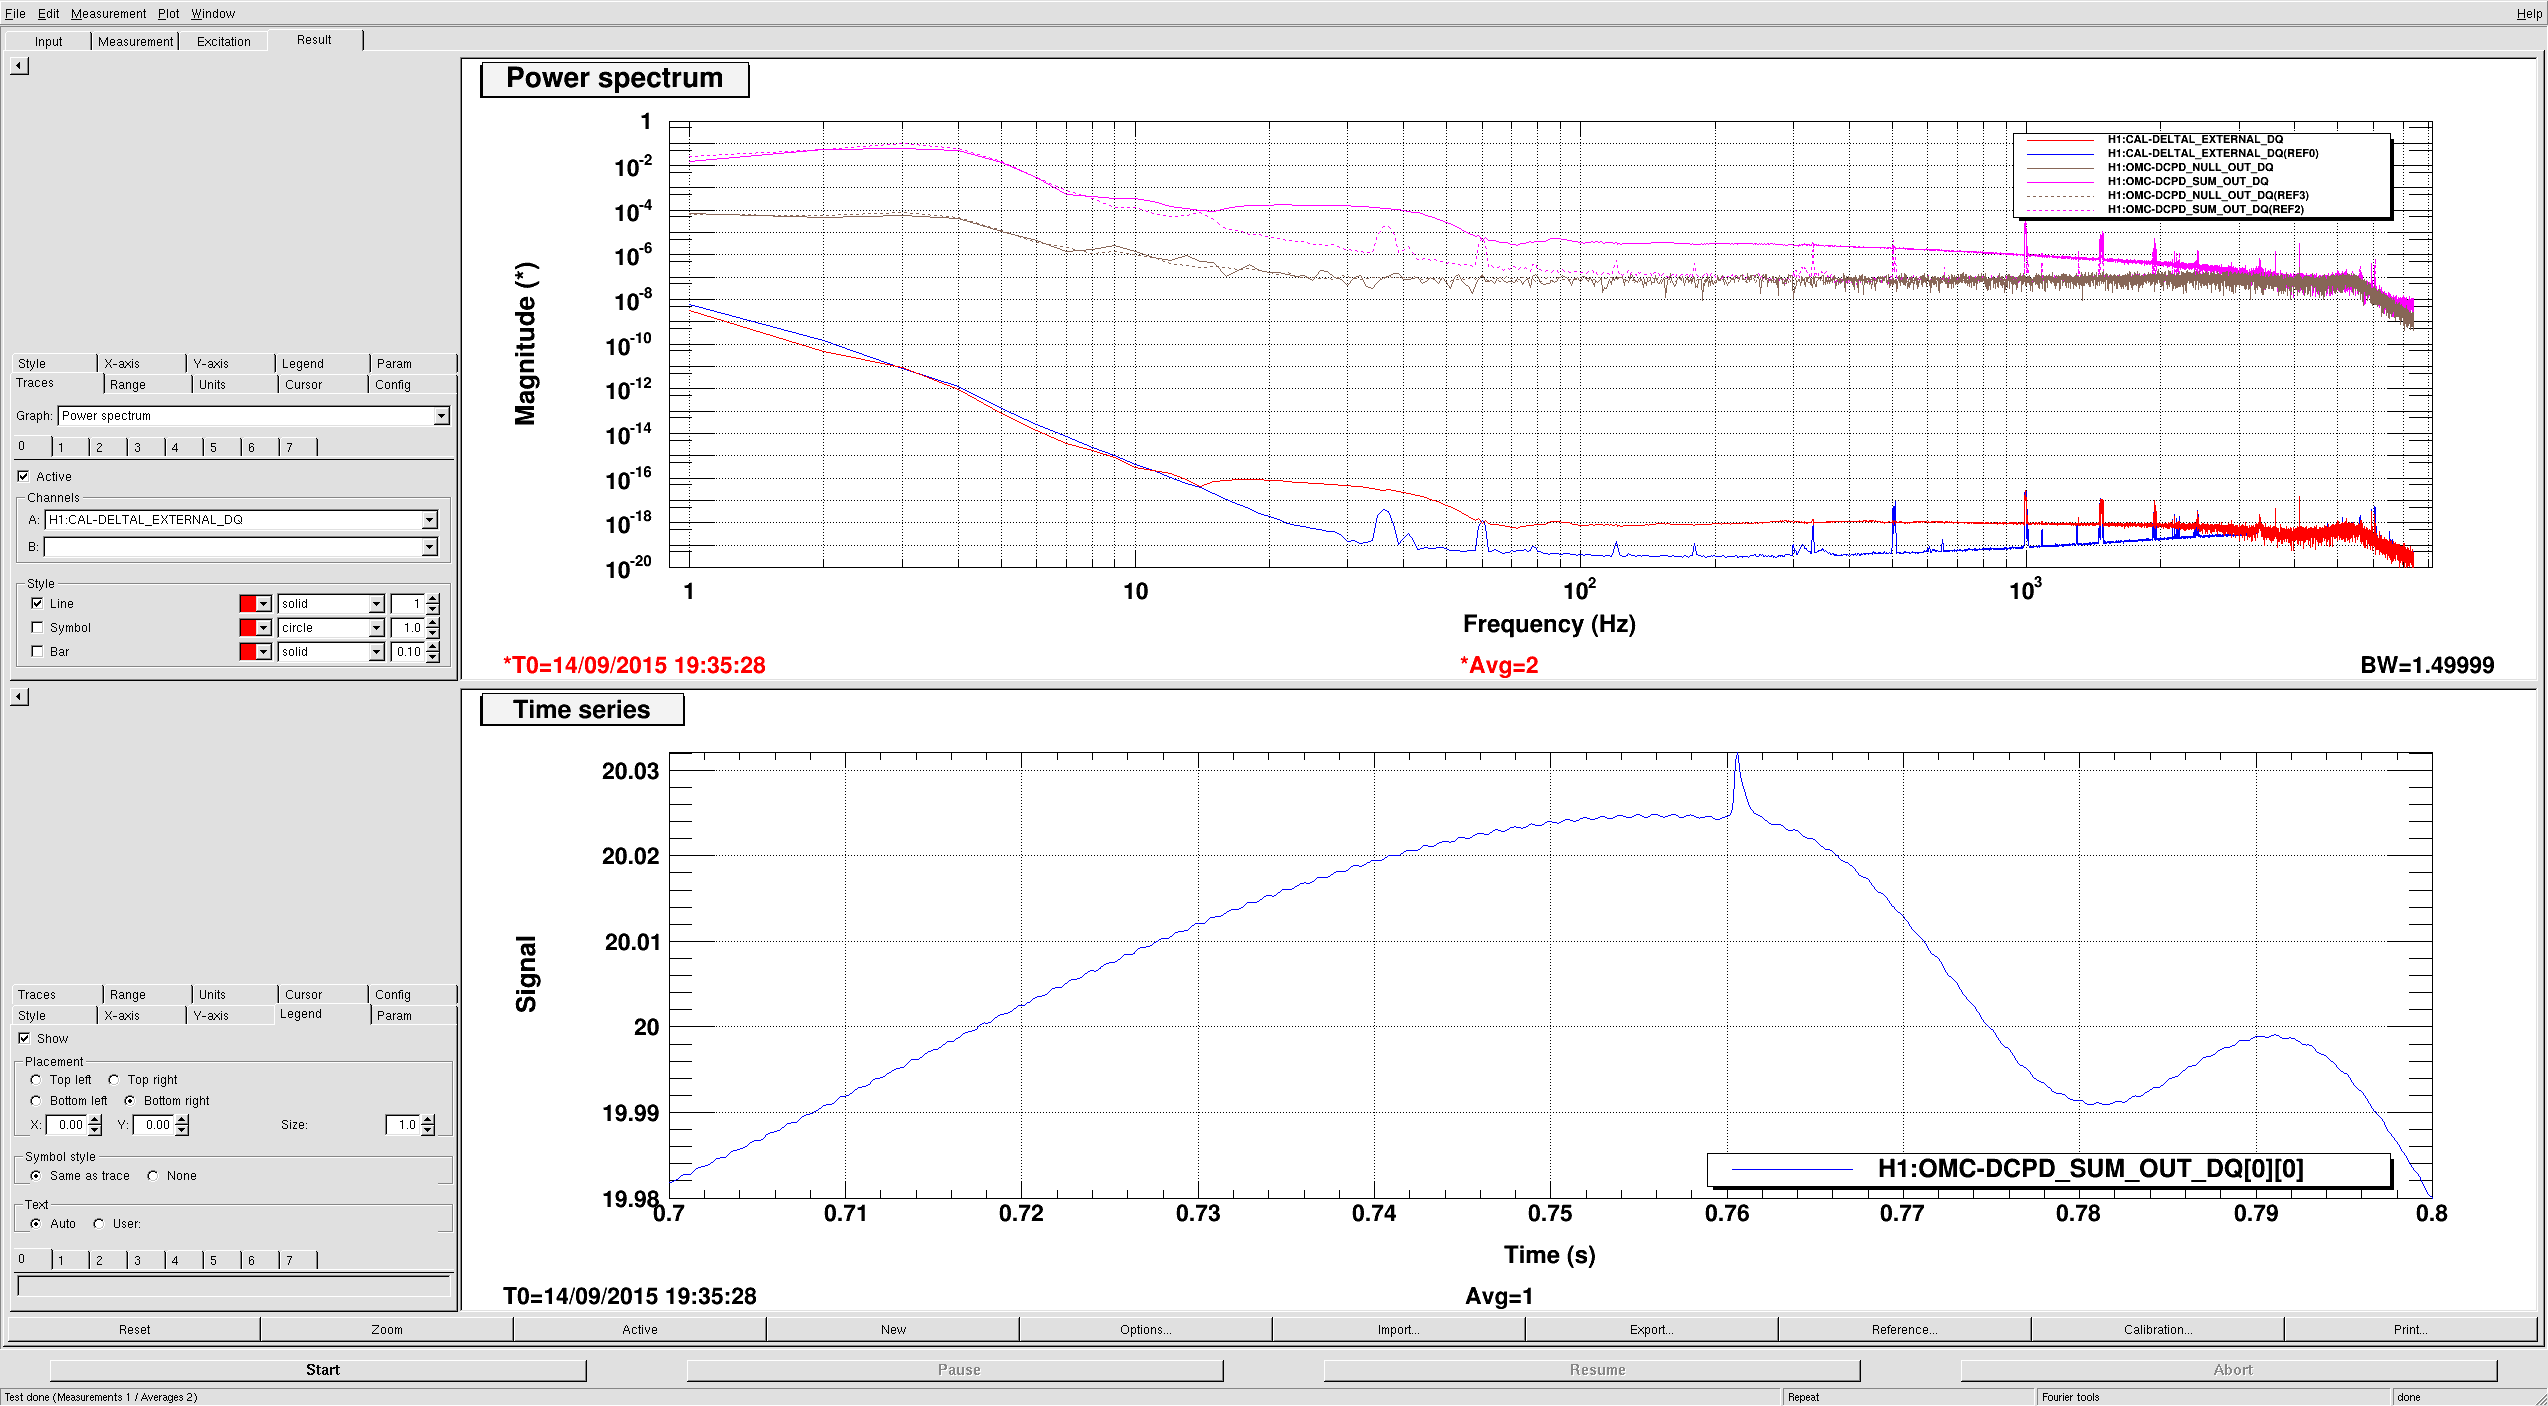
The null stream is higher than this shot noise prediction by about 7 %. This was the case previously, but this is almost certainly a coincidence, since the previous budget used data with two stages of whitening on (which we already know has a small calibration discrepancy). Previously I had used pcal directly to estimate the optical plant (without the necessary pcal correction factors), so this could explain part of the issue.
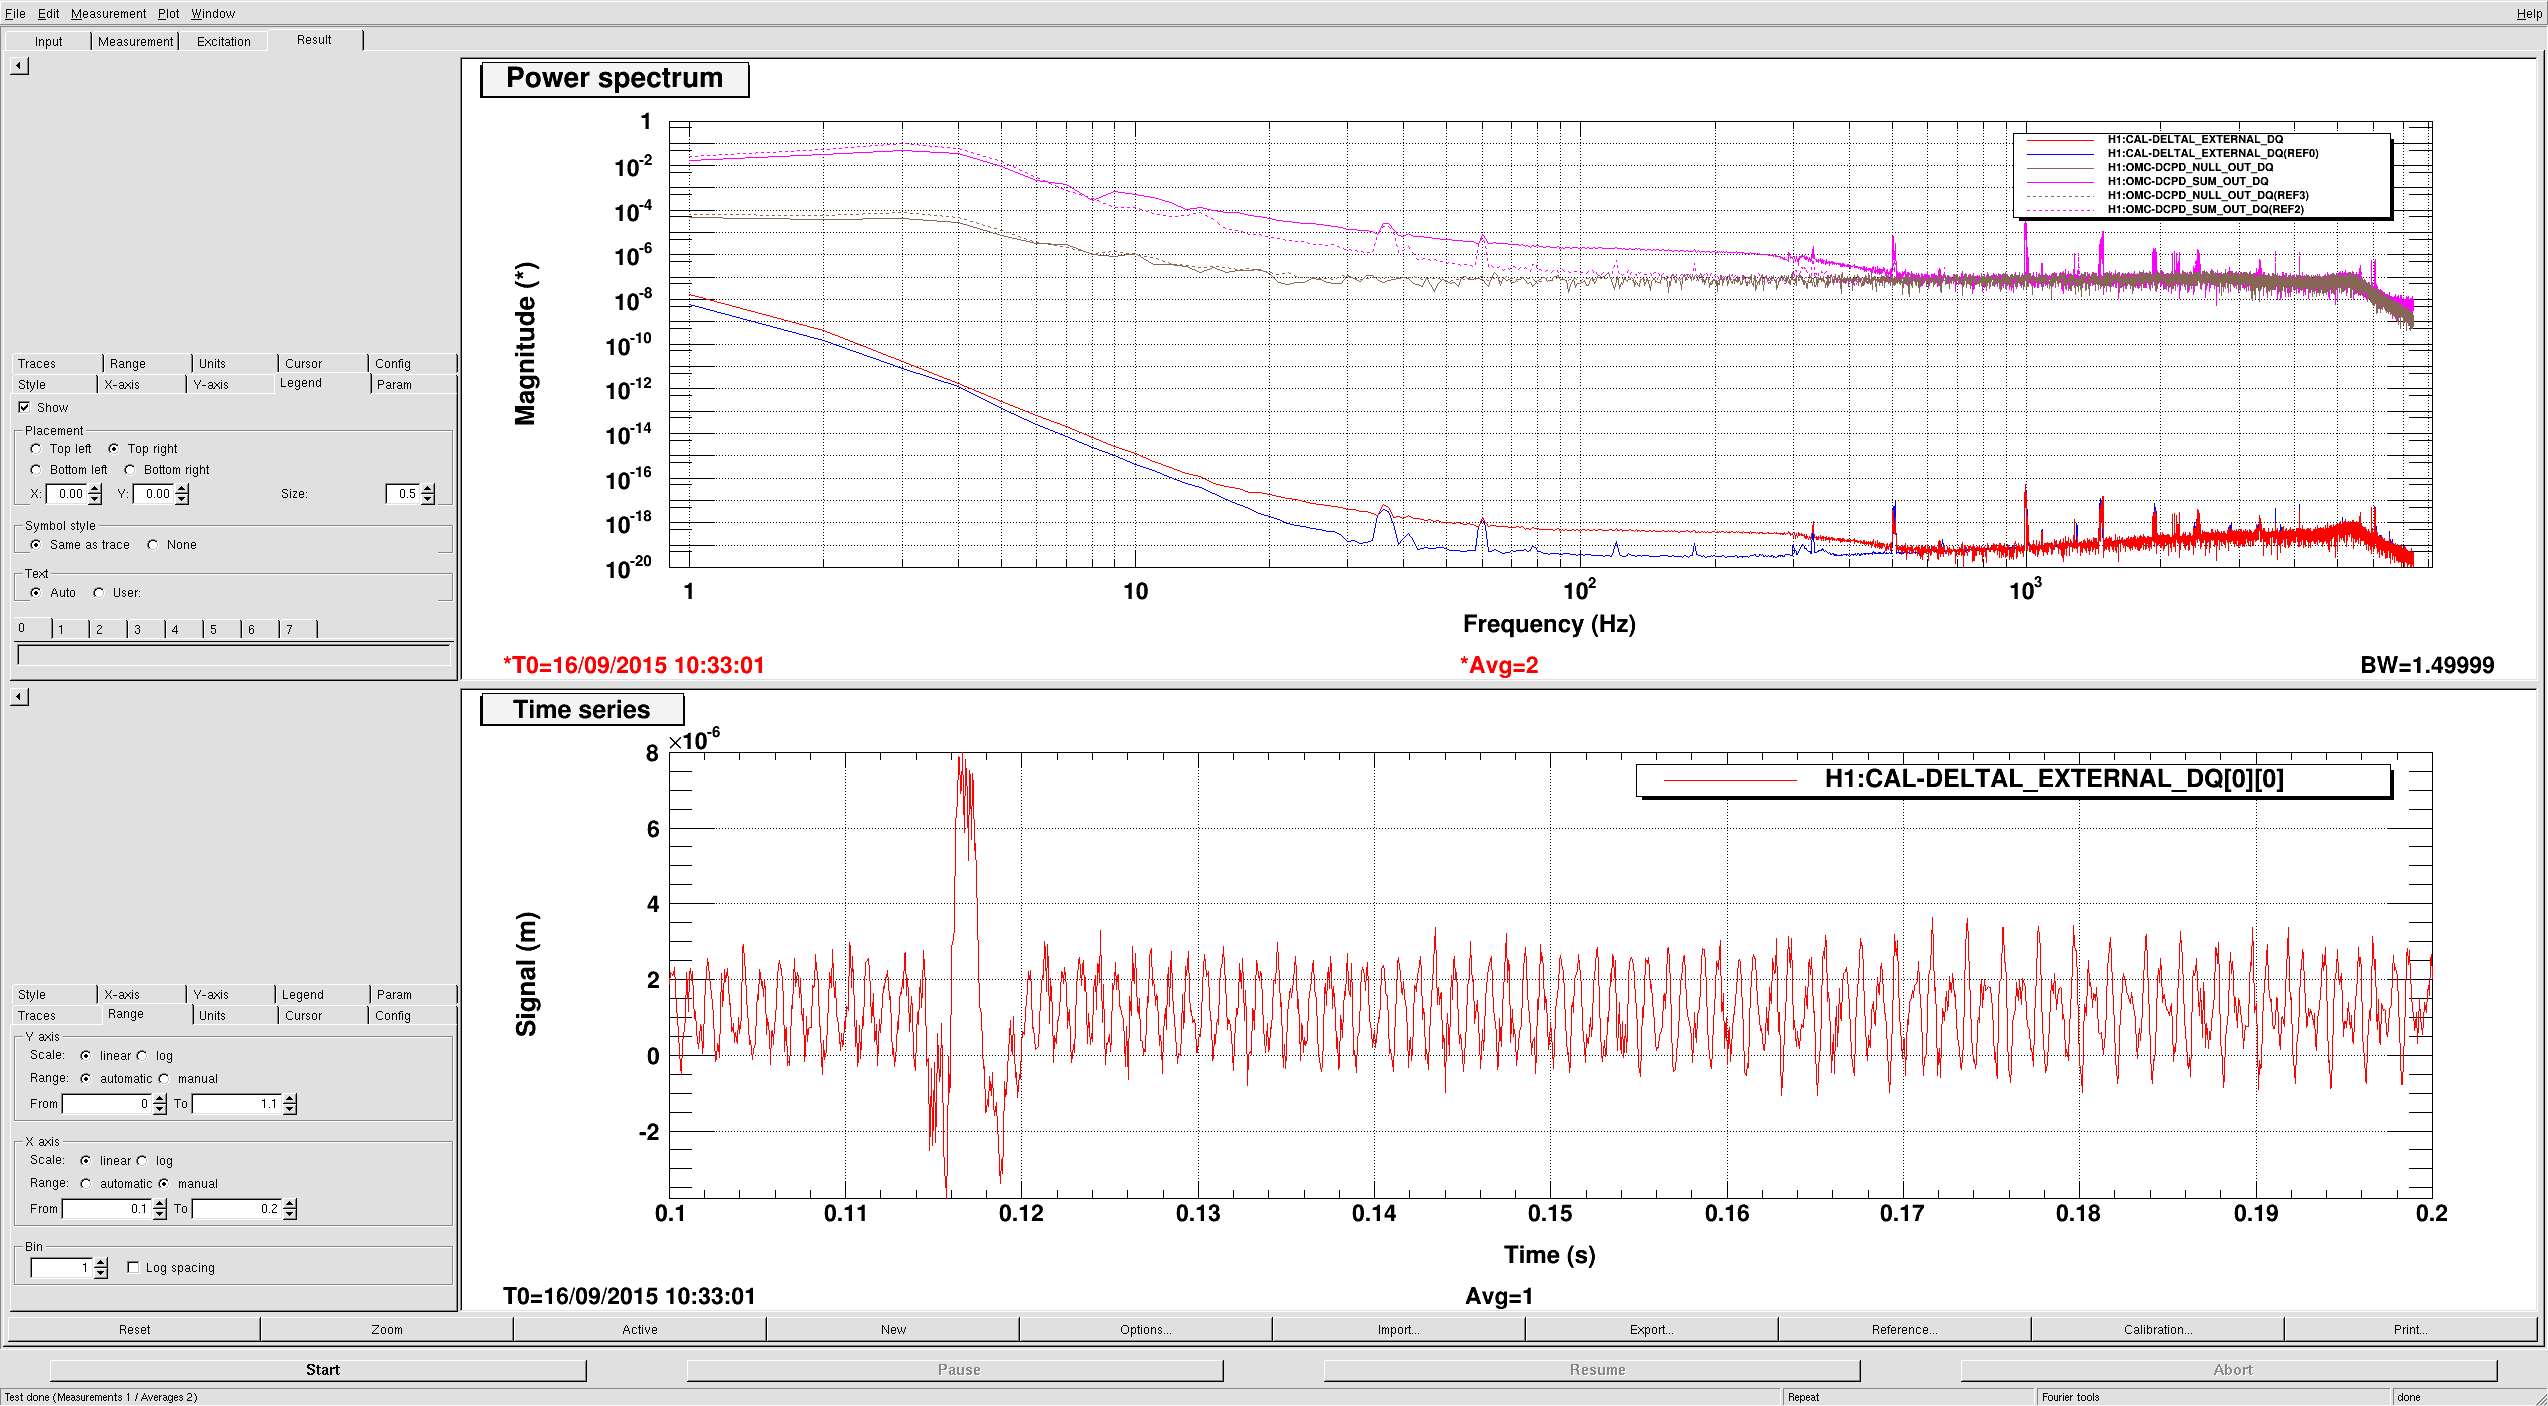
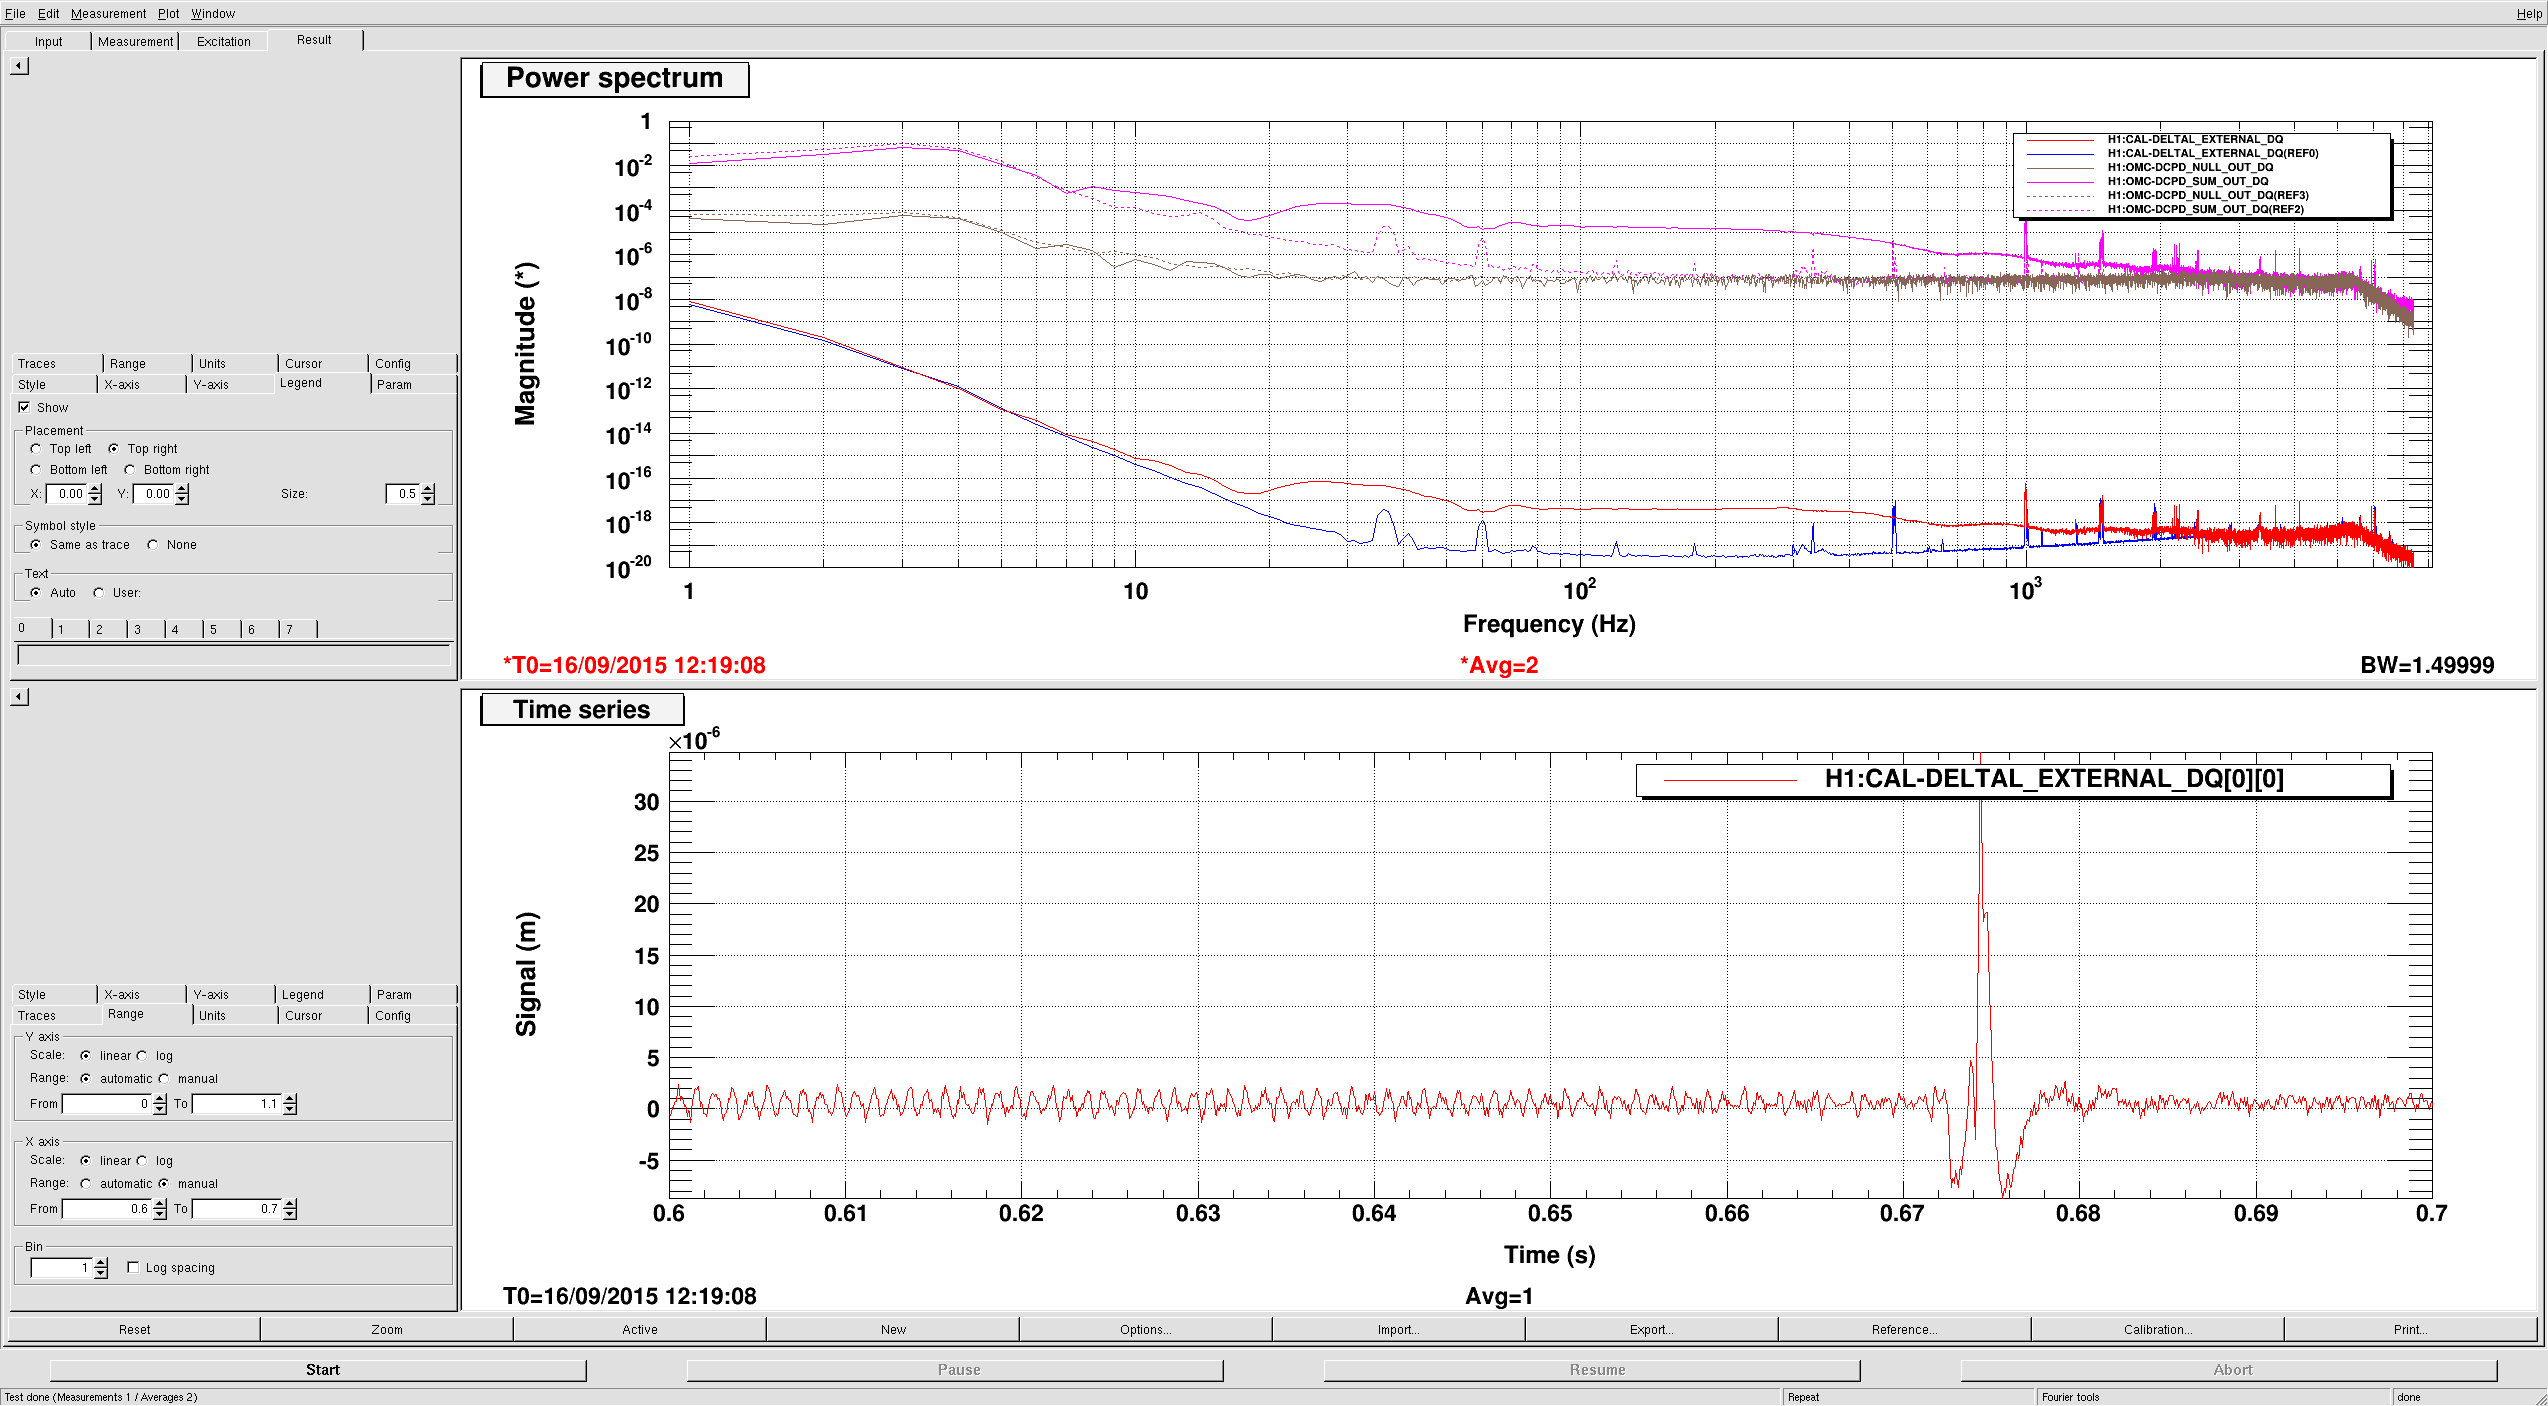
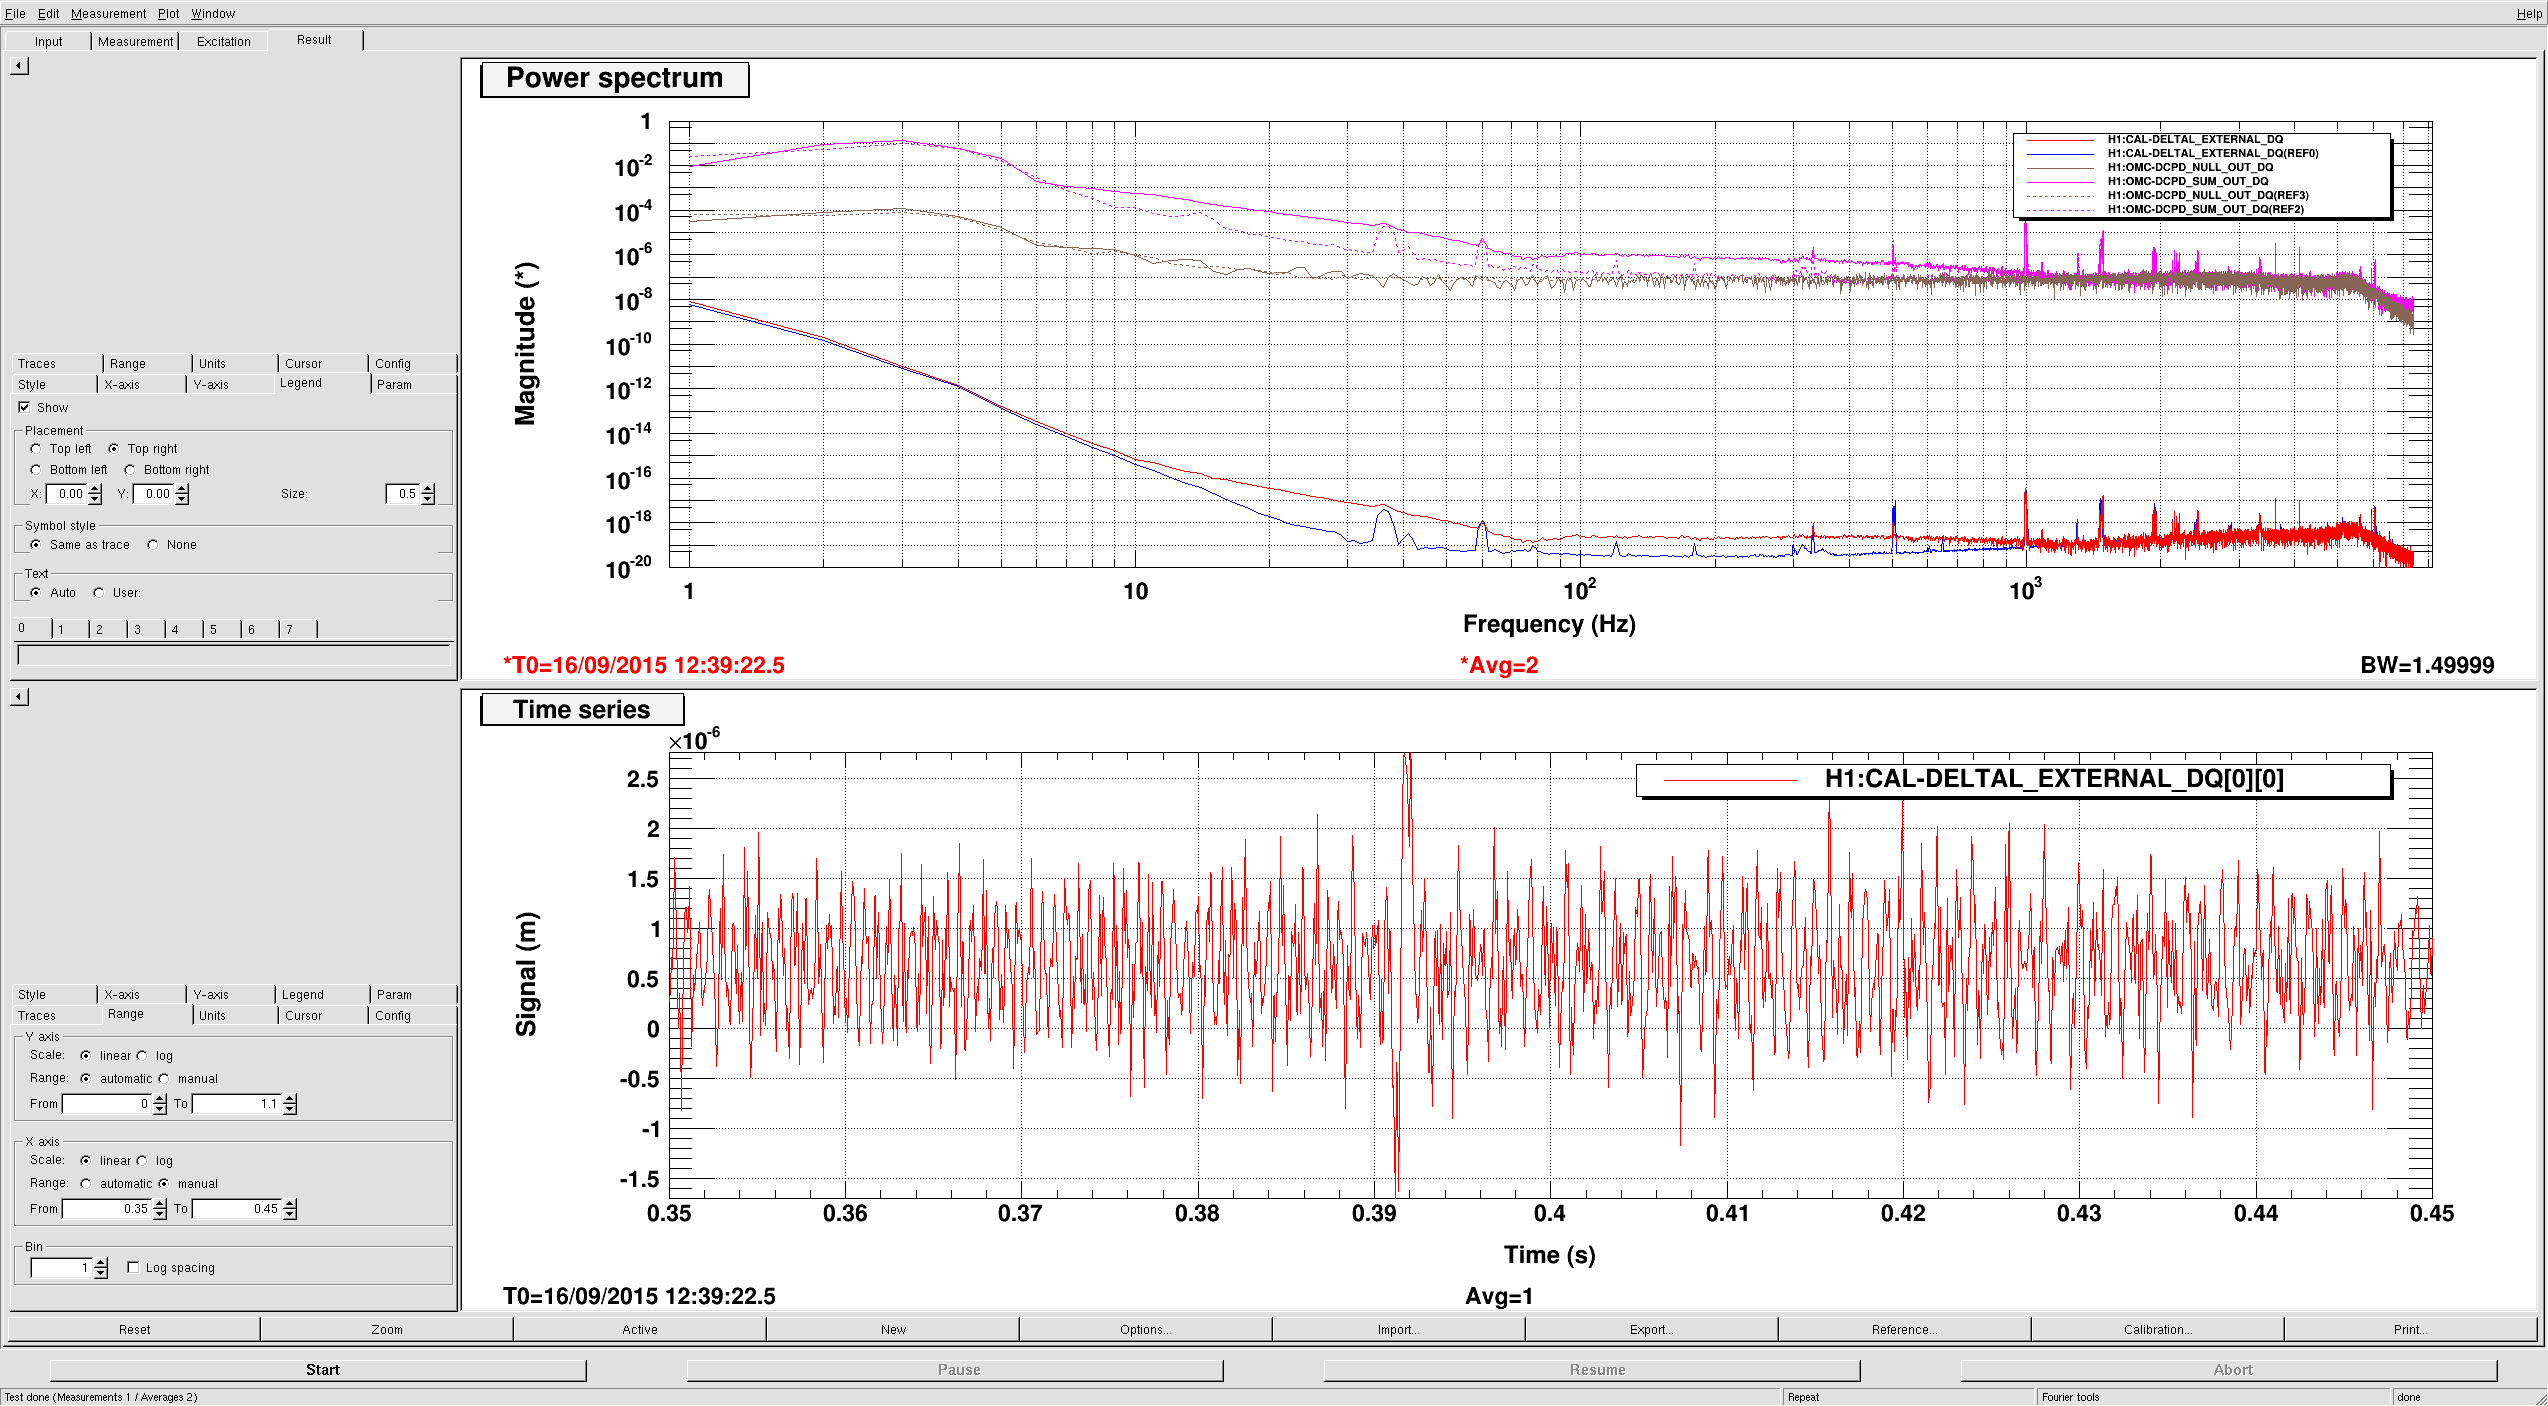
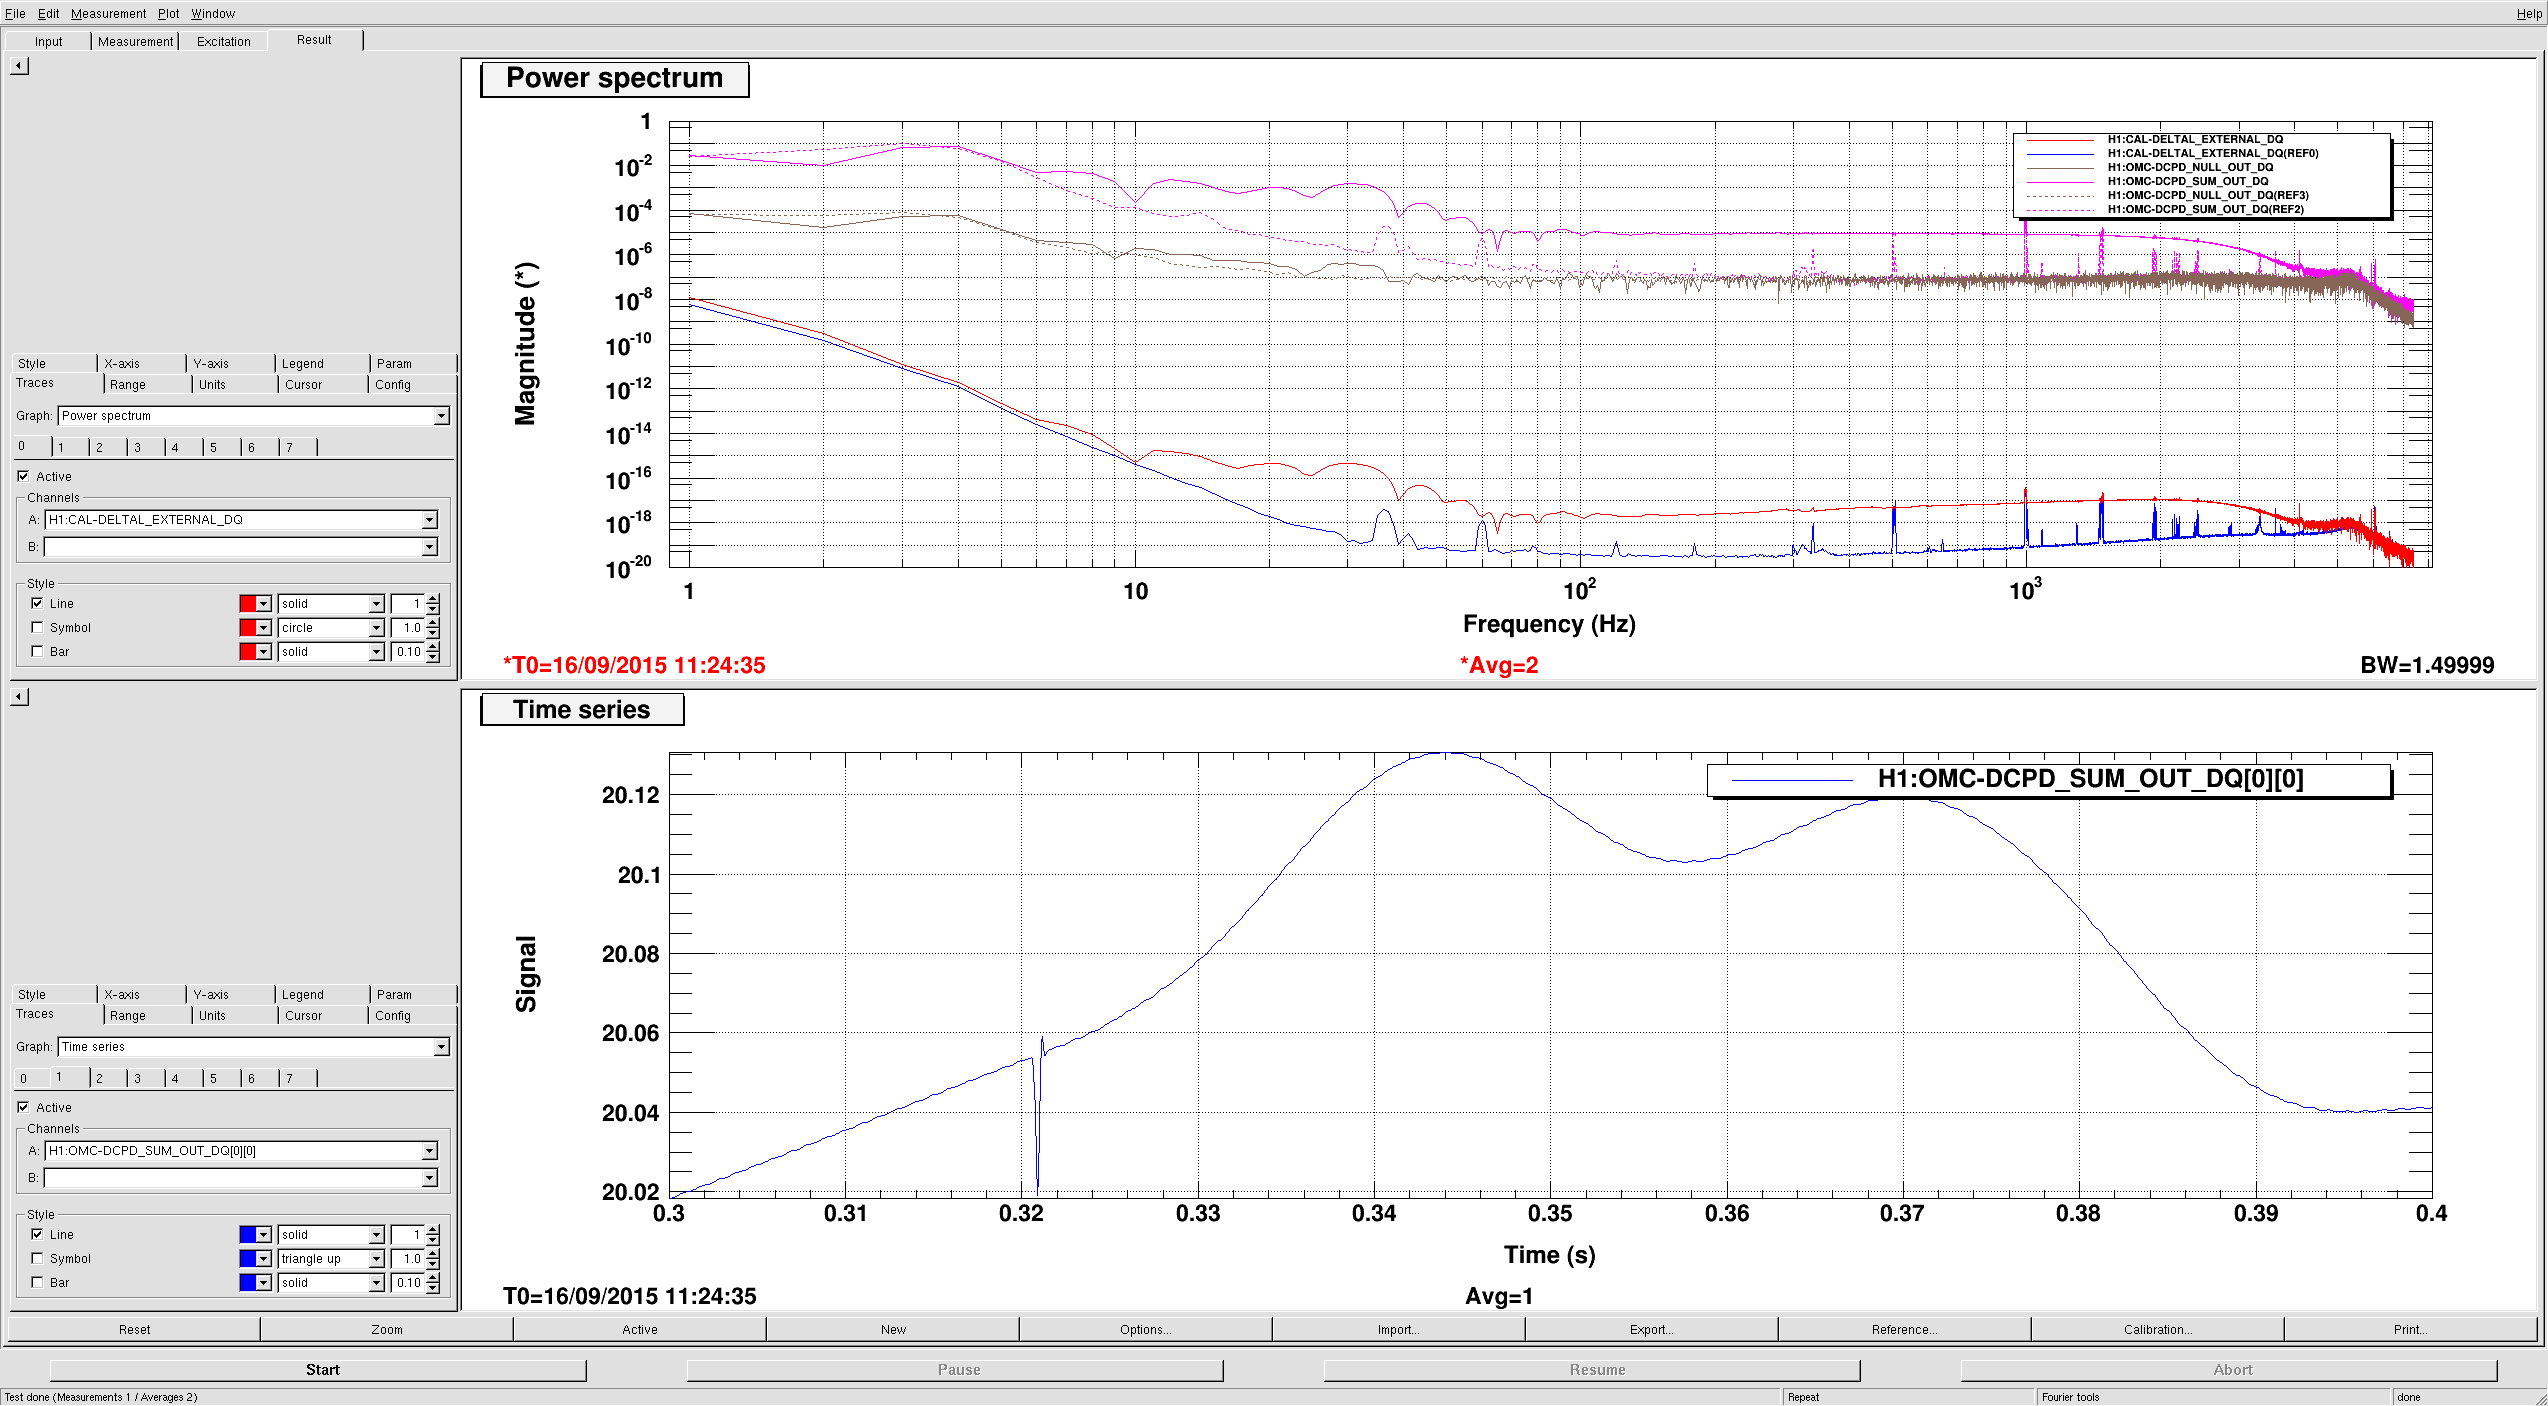
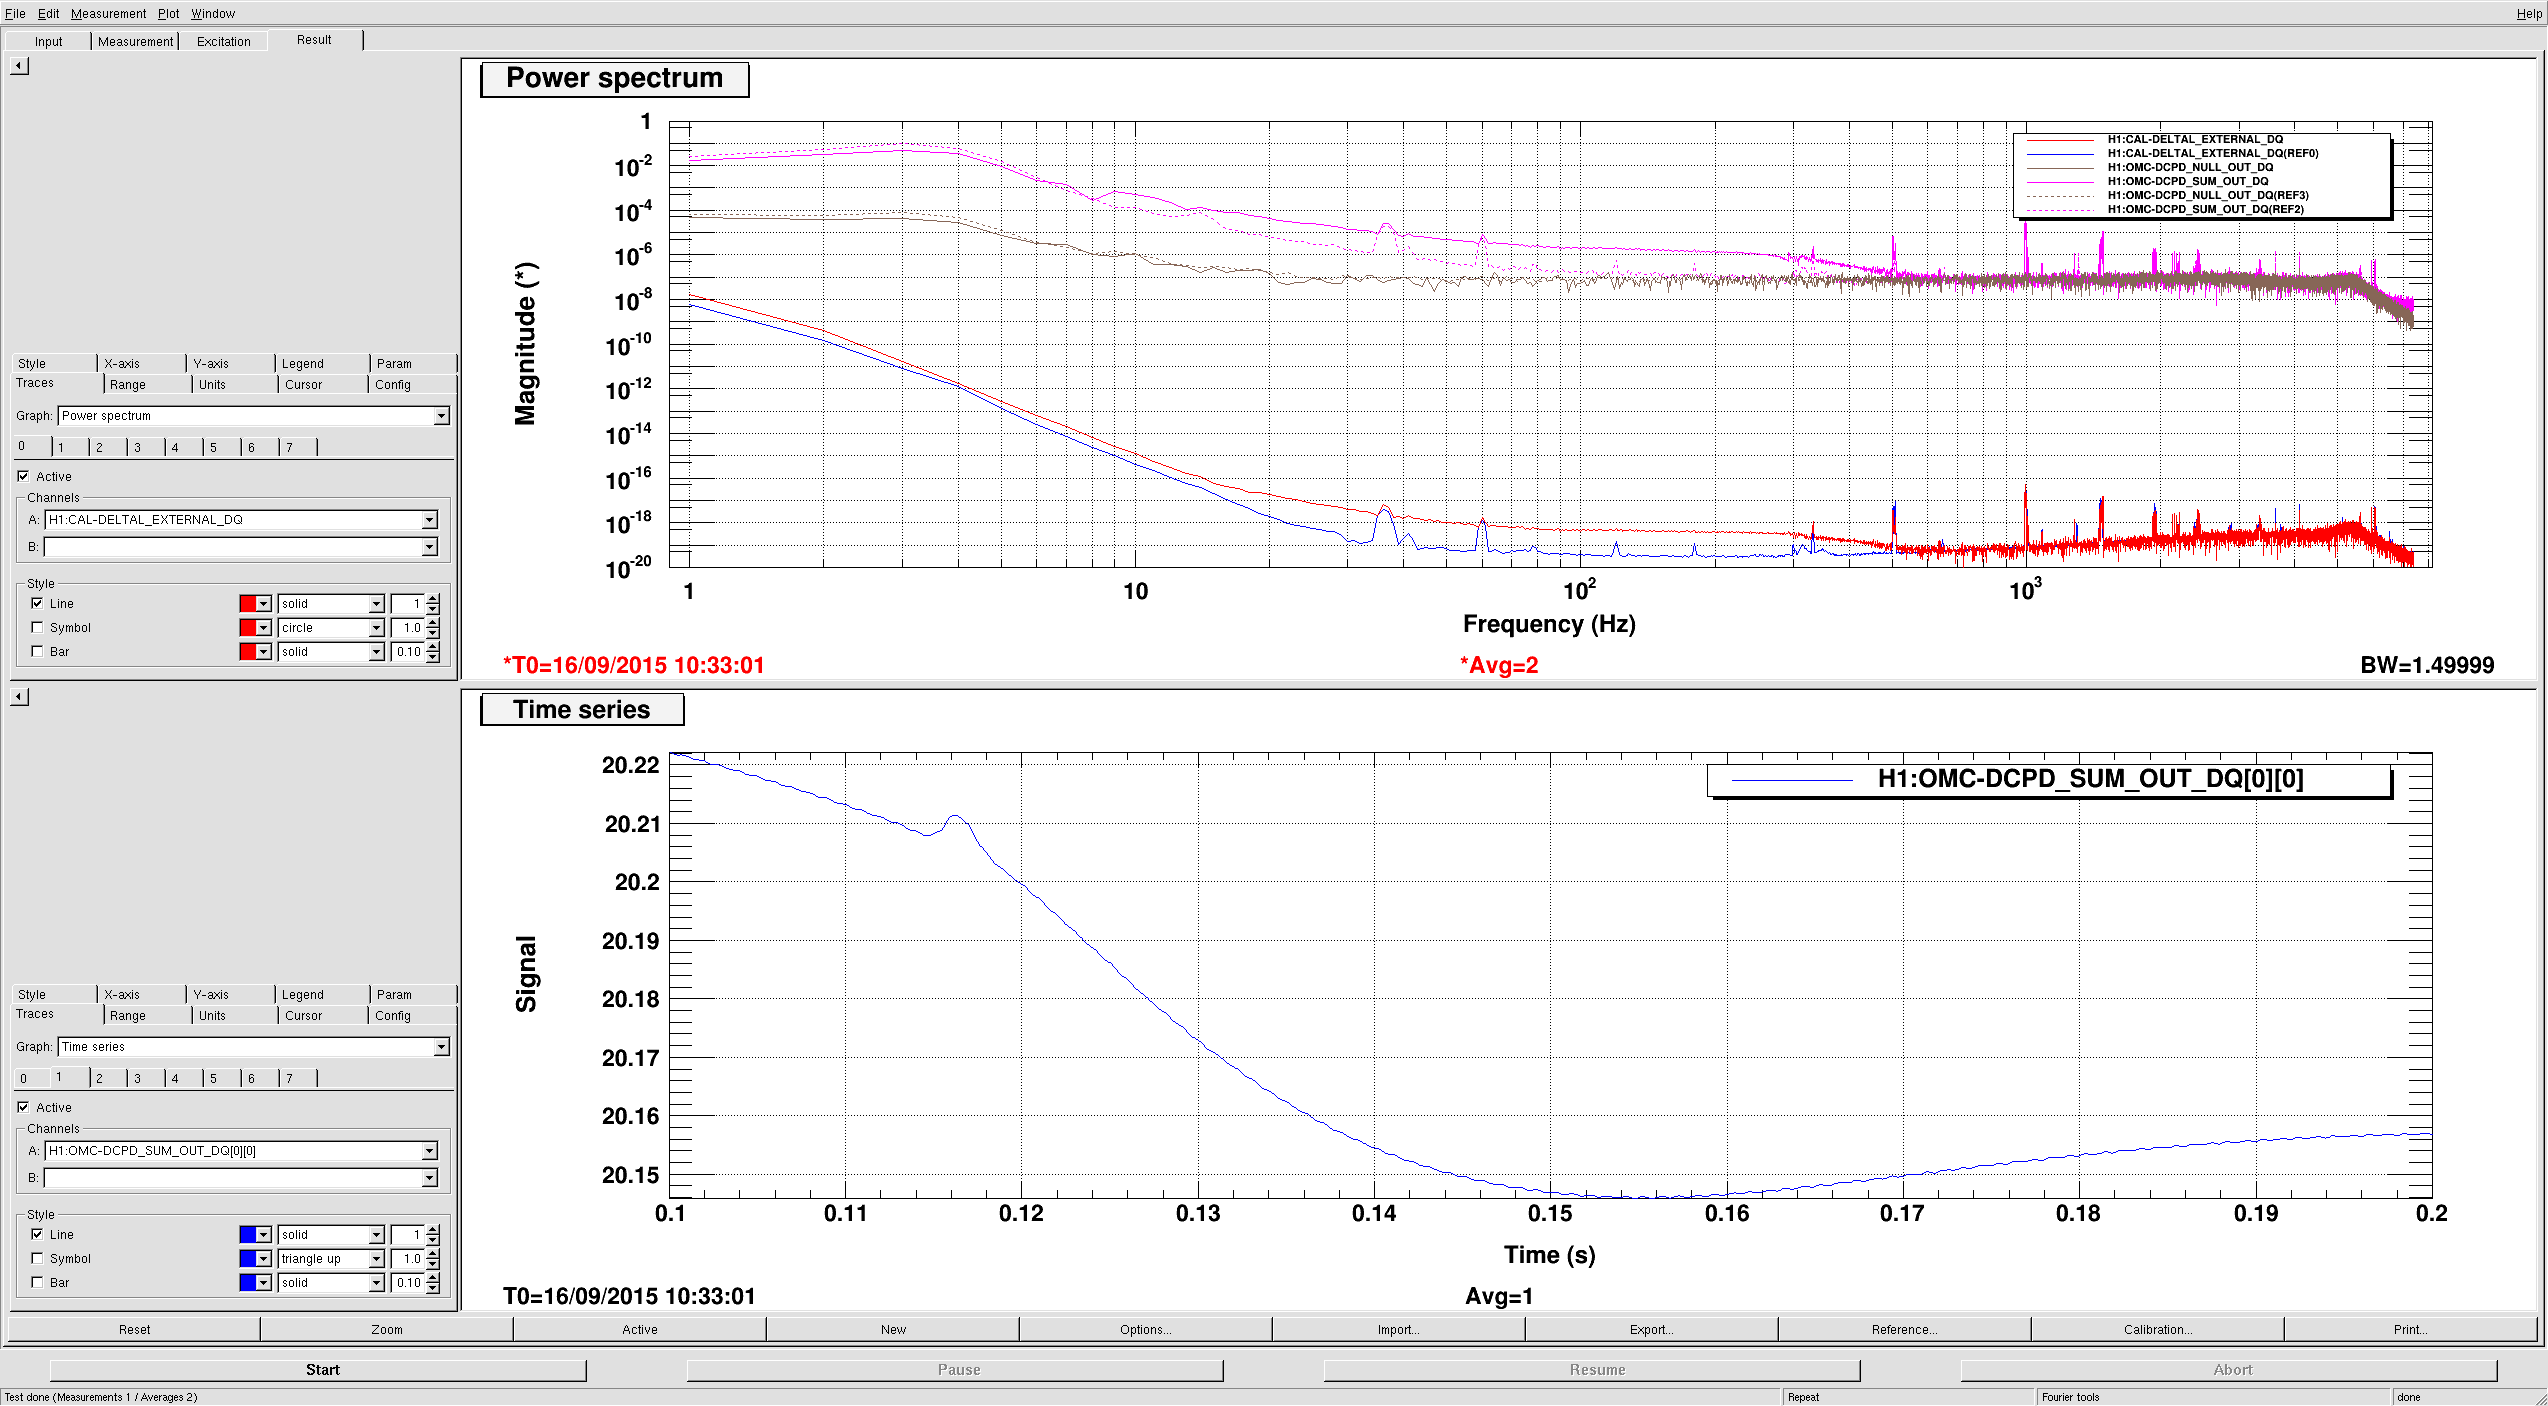
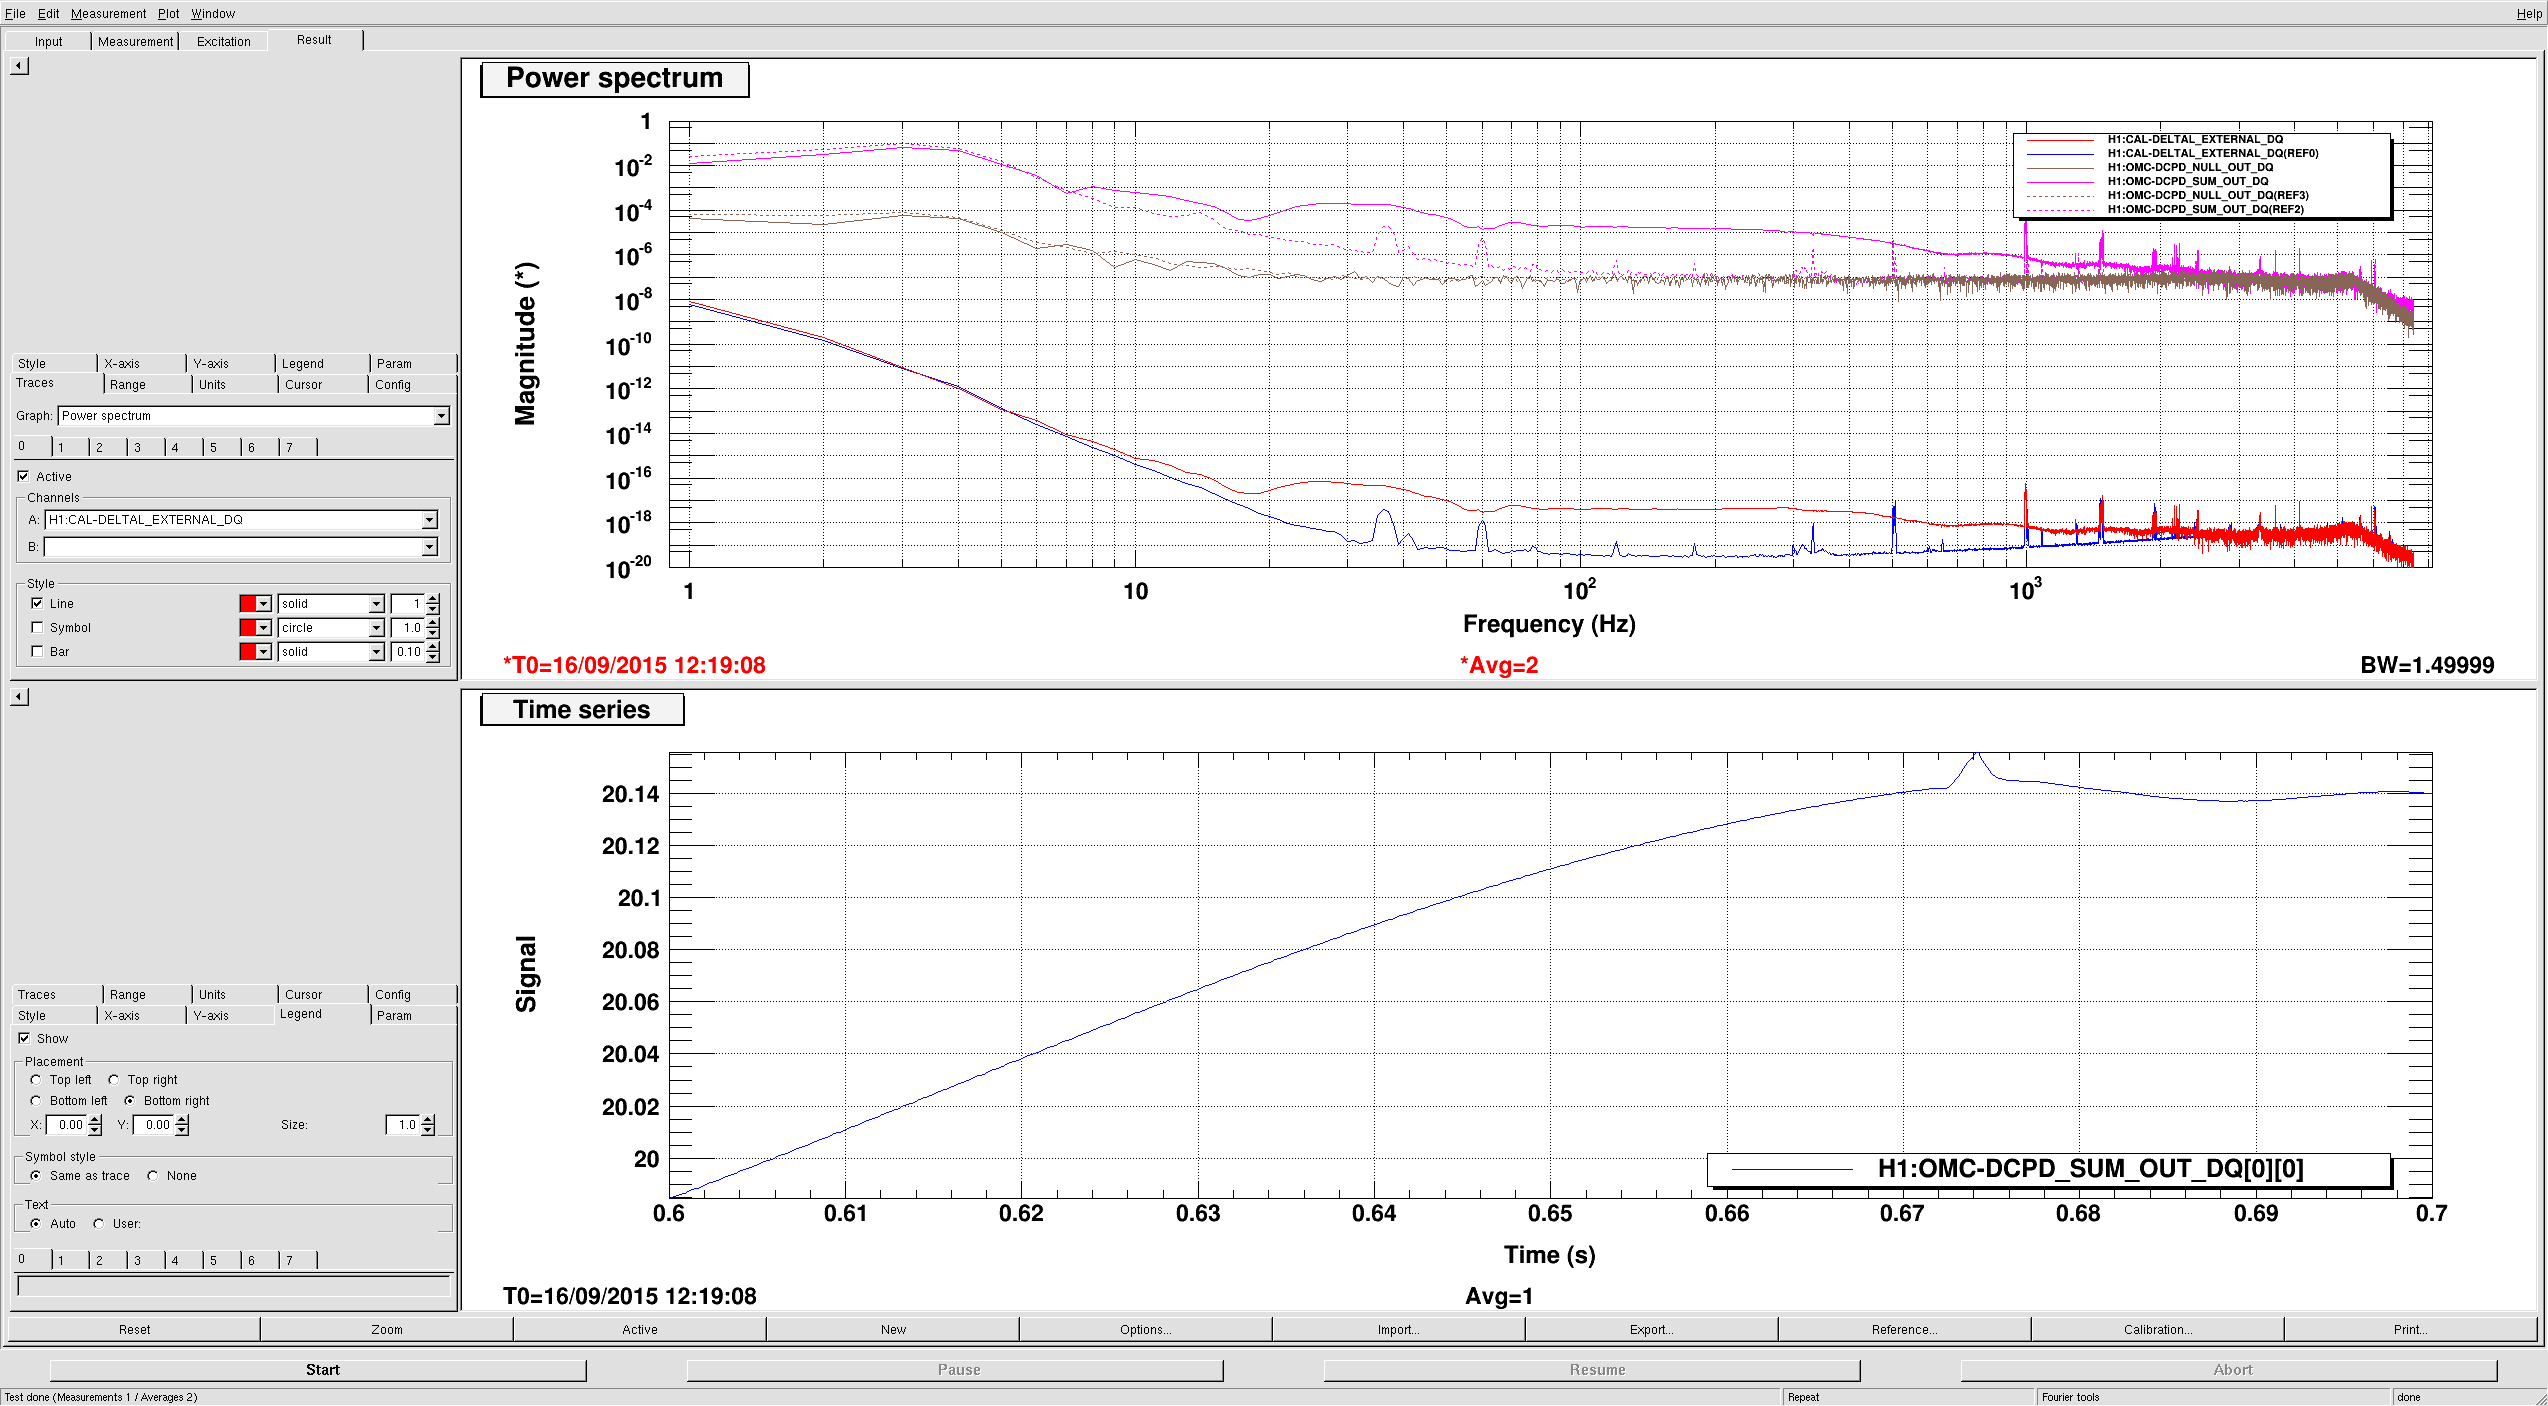
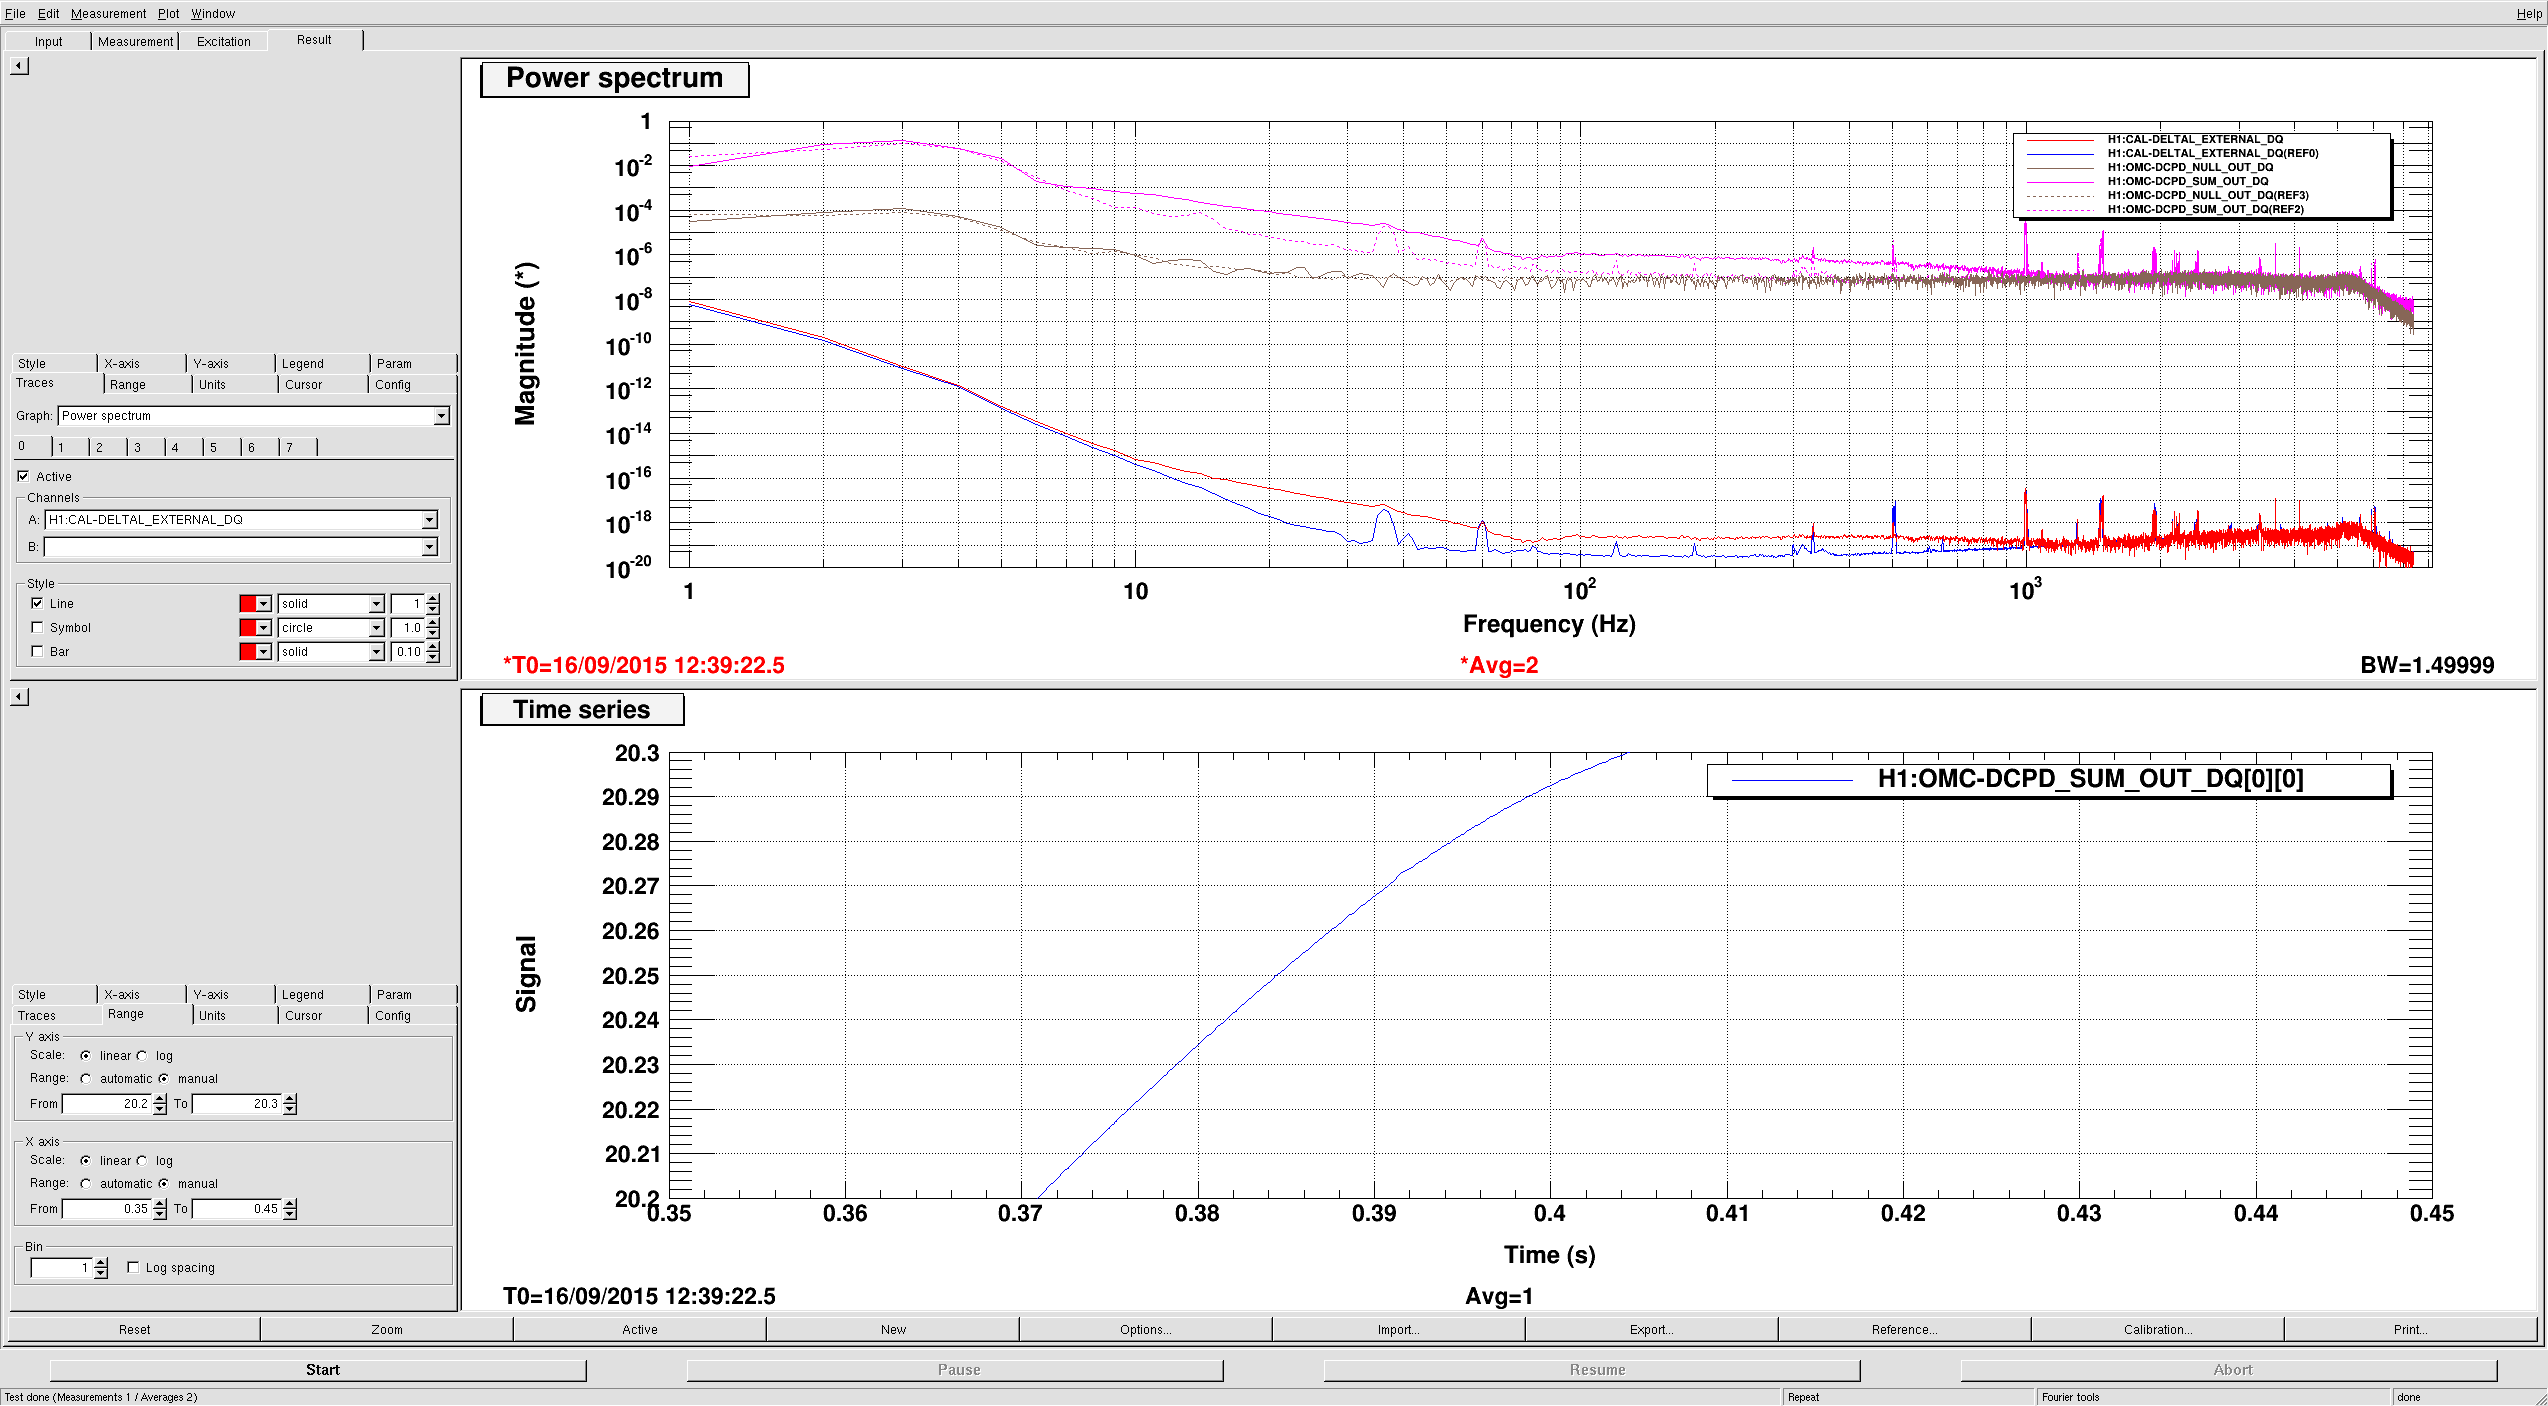
The attachment shows sum, null, and quantum noise curves, along with 20.0 mA shot noise. It could be that we are missing some readout loss, or the GWINC curve could still require some more tuning of the power.
Seismic, Newtonian, thermal
The seismic and Newtonian curves are the vanilla ones from GWINC, as is the coating Brownian noise.
DAC noise
DAC noise (using Peter's model) is propagated forward to displacement noise at the quads. The elevated noise from Chris's pringle measurements is not yet included.
Intensity and frequency noise
Intensity noise and frequency noise are as described previously. Intensity noise was measured with the ISS outer loop off. I injected into the ISS inner loop error point and used the outer loop's out-of-loop PD array (sum 5–8) to estimate the RIN. Frequency noise is a lower bound, including only the noise of the first stages of the CARM loop (PD dark noise, PD shot noise, and electronics noise of the CARM board).
LSC and ASC control noises
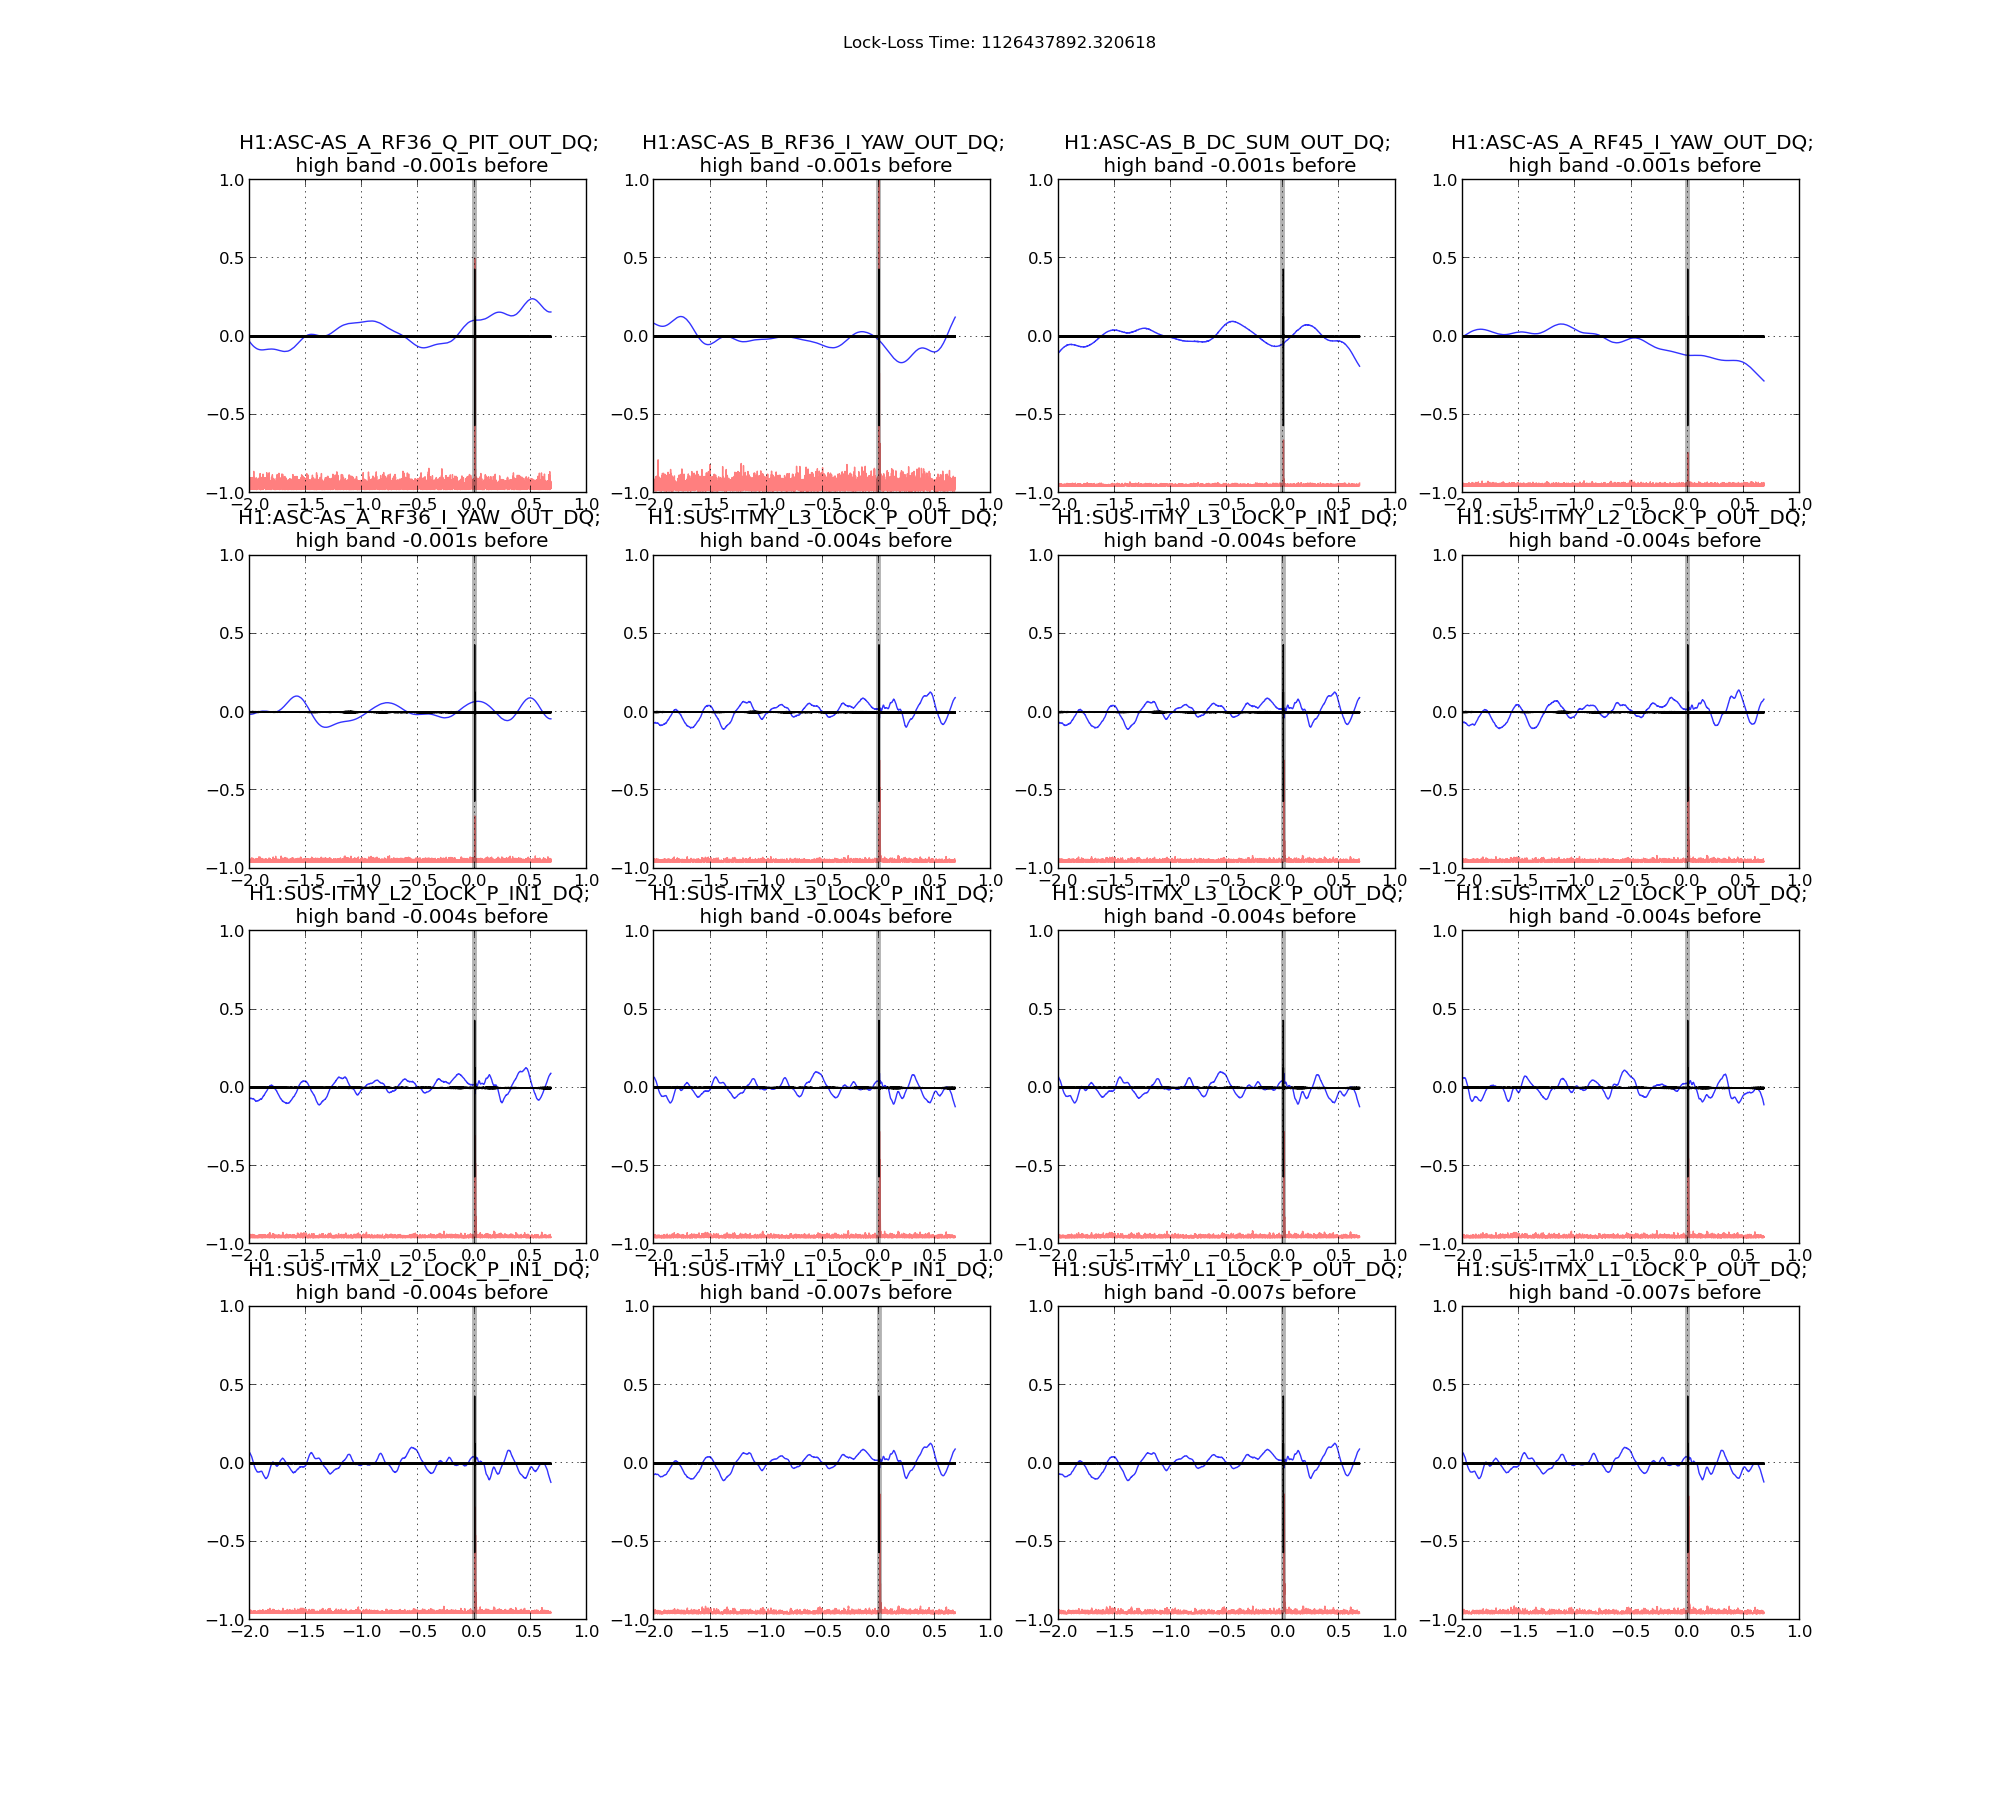
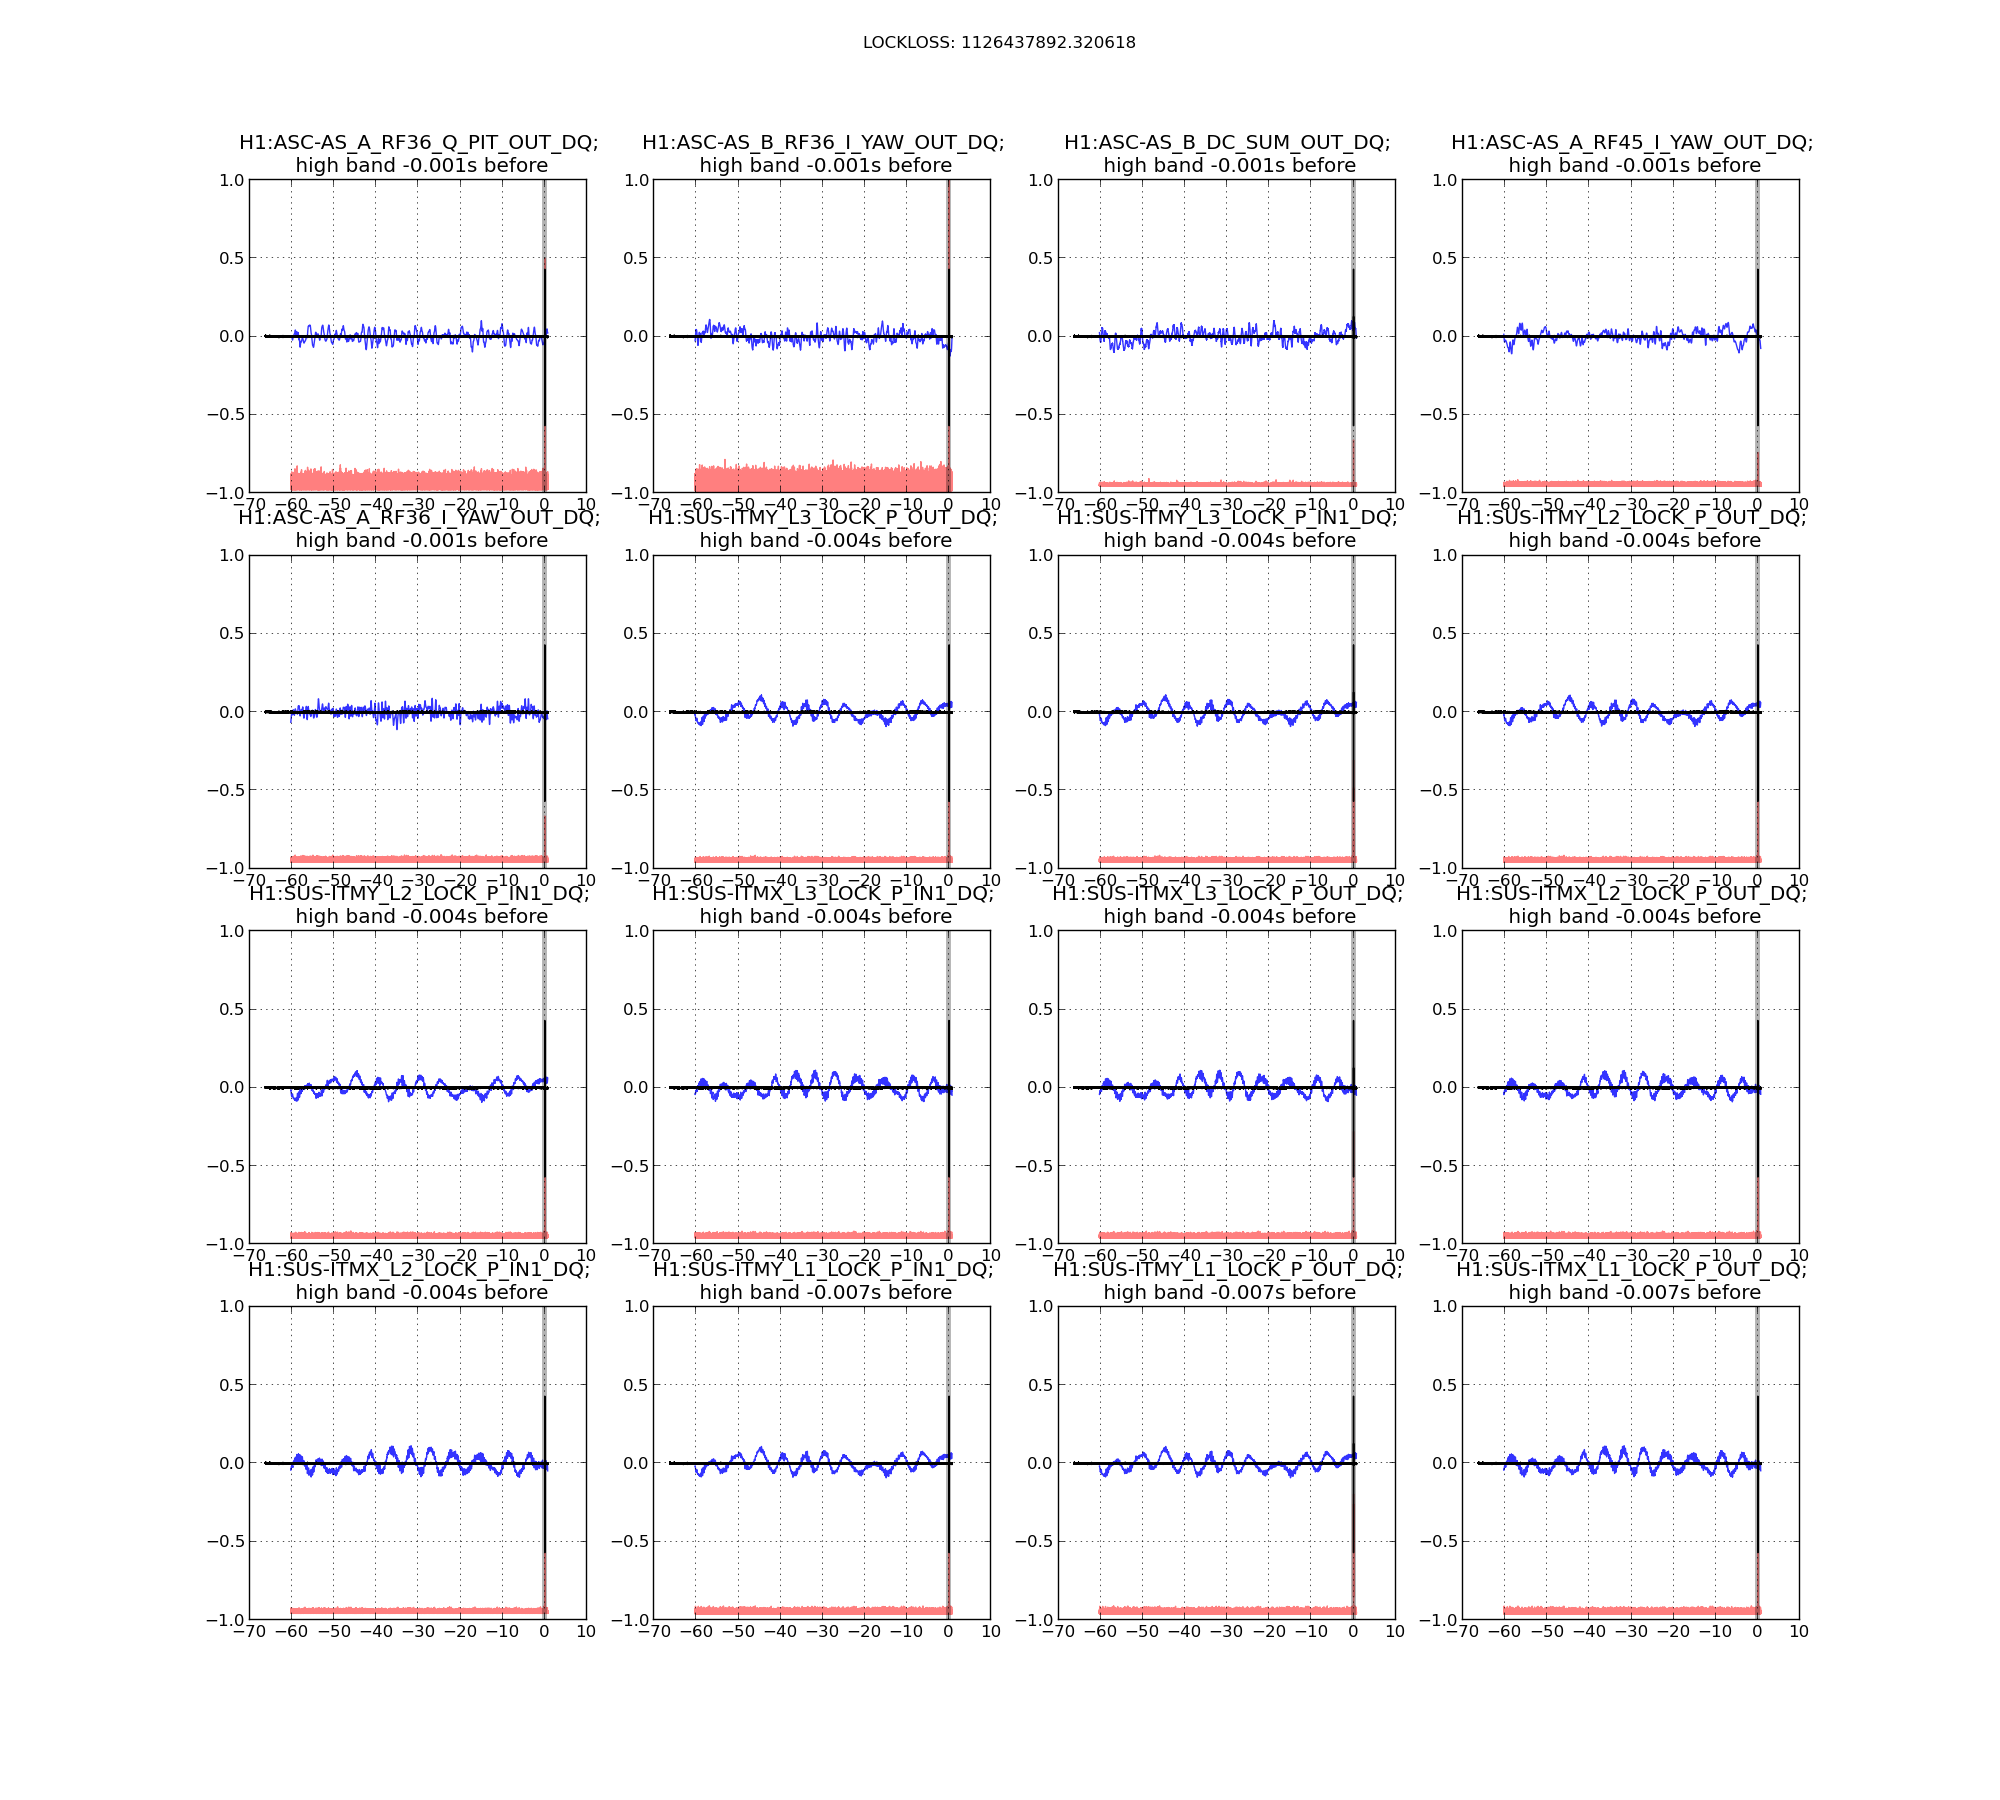
LSC control noises include PRCL, MICH, and SRCL. ASC control noises include dHard, BS, and SR2 loops (these are our high-bandwidth loops). I injected broadband noise for each of these and estimated the coupling via ratio of excess power (not coherent TFs).
Compared to the last budget, the SRCL coupling has increased slightly (see attached injection spectra), which is responsible for the slightly increased LSC noise around 50 Hz. Unclear whether this was a short-term excursion or a long-term drift of the SRCL coupling.
Gas noise
Squeeze film damping and residual gas are calculated as before. End station pressures are assumed to be 1×10⁻⁸ torr of molecular hydrogen. For residual gas, I have used 5×10⁻⁹ torr of molecular hydrogen.
Jitter
IMC input jtter was measured by driving the IMC PZT in pitch and in yaw. On Keita's suggestion, as a sensor for the PZT motion I use WFS B I for pitch and WFS A I for yaw. Again the coupling is estimated by excess power ratio. Jitter at the OMC is not yet incorporated.
Based on Bruco, there is still some coherence with the endstation QPDs around 78 Hz, as Gabriele has already noted. But other than that, no channel seems to jump out as the culprit for the noise from 50 Hz to 150 Hz. So either we are looking at some nonlinear process, or we are seeing some kind of displacement noise that is not captured by the digital system.


~10:50 Left to cook salmon and bagel/cream cheese, and set ISC_LOCK to DRMI
11:22 Came back to H1 locked on DRMI (since 11:18)
NOTE: So DRMI finally locked up, and on the 0.03-0.1 seismic band, the velocity was down to 0.1um/s. Recap:
Observation Mode was set to Earthquake from 10:03-11:34 (should be more like 9:30-11:18, where 11:18-11:33 would be Lock Acquisition).
11:35 Back to Observation Mode (with a range trending toward 80Mpc).
ITM ISI GS13 SDFs ACCEPTED with HI gain.